Article

The Optimum Slash Pile Size for Grinding Operations: Grapple Excavator and Horizontal Grinder Operations Model Based on a Sierra Nevada, California Survey

1
College of Bioresource Sciences, Nihon University, Fujisawa 252-0880, Japan
2
Faculty of Agriculture, University of Miyazaki, Miyazaki 889-2192, Japan
3
Graduate School of Bioresource Sciences, Nihon University, Fujisawa 252-0880, Japan
4
Department of Biological and Agricultural Engineering, University of California, Davis, CA 95616, USA
*
Author to whom correspondence should be addressed.
Forests 2017, 8(11), 442; https://doi.org/10.3390/f8110442
Submission received: 25 September 2017 / Revised: 10 November 2017 / Accepted: 13 November 2017 / Published: 15 November 2017
(This article belongs to the Special Issue Forest Operations, Engineering and Management)

Abstract

:
The processing of woody biomass waste piles for use as fuel instead of burning them was investigated. At each landing of slash pile location, a 132 kW grapple excavator was used to transfer the waste piles into a 522 kW horizontal grinder. Economies of scale could be expected when grinding a larger pile, although the efficiency of the loading operation might be diminished. Here, three piles were ground and the operations were time-studied: Small (20 m long × 15 m wide × 4 m high), Medium (30 × 24 × 4 m), and Large (35 × 30 × 4 m) piles. Grinding the Medium pile was found to be the most productive at 30.65 bone dry tons per productive machine hour without delay (BDT/PMH0), thereby suggesting that there might be an optimum size of slash pile for a grinding operation. Modeling of the excavator and grinder operations was also examined, and the constructed simulation model was observed to well-replicate the actual operations. Based on the modeling, the productivity of grinding at a landing area of 710 m2 of slash pile location was estimated to be 31.24 BDT/PMH0, which was the most productive rate.

1. Introduction

Increasingly fierce wildfires are currently one of the most severe problems in the western United States. California is also experiencing one of the state’s worst droughts of the past century. Under natural fire conditions, a proper amount of thinning occurs and the remaining trees are thereby given a better chance to mature. In contrast, after a century of fire suppression, California’s forests are denser and have fewer large trees. For example, from the 1930s to the 2000s, the number of large trees in the Sierra Nevada mountain range in California decreased by half while the density of small trees doubled [1]. Severe fires are increasing in frequency and size throughout the Sierra Nevada, and regeneration is not a given for severely burned forests where seed trees have been killed across large areas [2]. Fuel reduction operations (e.g., prescribed fire, mechanical treatment, mechanical treatment + prescribed fire) are effective to reduce the risk of high-intensity wildfires and return forests to a more fire-resilient landscape [3].
Current ‘business as usual’ activities for biomass disposal in much of the Sierra Nevada include pile and burn, mastication, and drop/scatter techniques. Notably, the utilization of biomass material for energy production is an appealing option for biomass disposal that can contribute to density management, forest health, and fire hazard reduction. In a previous study, the Placer County Air Pollution Control District (PCAPCD) and the Sierra Nevada Conservancy demonstrated a significant reduction in air emissions through the diversion of forest biomass that had been scheduled for open pile burning [4]. In the project entitled ‘Forest Biomass Diversion in the Sierra Nevada’ as a next step, the PCAPCD sponsored research that tracked the economic costs and air emissions generated from the collection, processing, and transport of forest harvest residuals generated at the Blodgett Forest Research Station, the Center for Forestry, the University of California, Berkley in 2012, with the objective of quantifying the emissions reductions gained from using the biomass for energy production compared to open pile burning (Figure 1).
The market value of forest biomass was not sufficient to cover 100% of the forecasted costs to collect, process, and transport material to the Buena Vista Biomass Power (BVBP) facility, which is the nearest biomass power generation facility located near Ione, California. The PCAPCD therefore offset the cost differential between the forest biomass market value and the actual costs of collection, processing, and transport. A forest biomass processing contractor, Brushbusters Inc., was retained to process and transport six woody biomass waste piles for use as fuel in the BVBP facility. In order to monitor the equipment operating costs and efficiencies as well as the equipment air emissions, processing the woody biomass waste piles was investigated. At each landing of slash pile location, a grapple excavator was used to transfer the piles into a horizontal grinder (Figure 2).
In contrast, in Japan, following the ‘Feed-in Tariff Scheme for Renewable Energy (FIT)’ that was put into practice in 2012, the building of power-generation plants that accept unused forest biomass (such as thinnings and logging residues) and the initiation of the plants’ operation are progressing, since the purchase price of electricity from unused forest biomass has been set higher than that from other wood-based materials, e.g., mill residues and imported woods [5]. Thus, 1.17 million bone dry tons (BDT) of wood chips derived from thinnings and logging residues were used as energy in Japan in 2015 [6]. With respect to the FIT approval of power generation fueled by unused forest biomass, 38 plants (297 MW of total power output) were already in operation and 89 projects (436 MW) were approved as of February 2017 [7]. Because thinnings and logging residues must be comminuted before energy conversion at a power-generation plant or biomass-fired boiler, increasing numbers of the following operations are expected in Japan: the creation of large slash piles by collecting thinnings and logging residues at landings alongside forest roads or at the stockyards of power-generation plants, and the subsequent processing of the piles by chippers or grinders.
In general terms, economies of scale can be expected when grinding a larger slash pile, although the efficiency of a loading operation may be diminished. With respect to the impact of the slash pile size, Seymour and Tecle [8,9] studied the impact of burning on soil physical properties and chemical characteristics, and the impact of burning on biomass moisture change has also been tested; e.g., [10,11]. The grinding operations in the western Pacific USA were investigated and modeled; e.g., [12,13]. However, the relationship between the slash pile size and the productivity of a grinder has not been established. In the present study, three slash piles (small, medium, and large) were ground, and the operations were time-studied in the Results section by using a protocol that is similar to a protocol used by the authors of this paper previously [14,15,16,17]. In the Discussion section, based on the results of the time study, a simulation model of a grapple excavator’s loading of logging residues from the varying slash piles and its unloading to the conveyor of a horizontal grinder is constructed. Thus, the optimum size of slash piles that would maximize the productivity of the grinder is discussed based on the replication of the excavator and grinder operations.
Concerning previous studies related to the modeling of forest operations by simulation, Iwaoka et al. [18] calculated the cycle time and productivity of harvesters, and Sakurai et al. [19] calculated those of tower-yarders, processors, and forwarders by determining theoretical formulae of element operations and aggregating them on the basis of a transition probability matrix of element operations. Other research groups predicted the productivity of total logging systems by determining theoretical formulae of the cycle times of forestry machines and by using the system dynamics method [20,21,22]. In the present study, the approach used by Iwaoka et al. and Sakurai et al. was followed in order to construct a simulation model of a grapple excavator operation by analyzing the data of element operations.

2. Materials and Methods

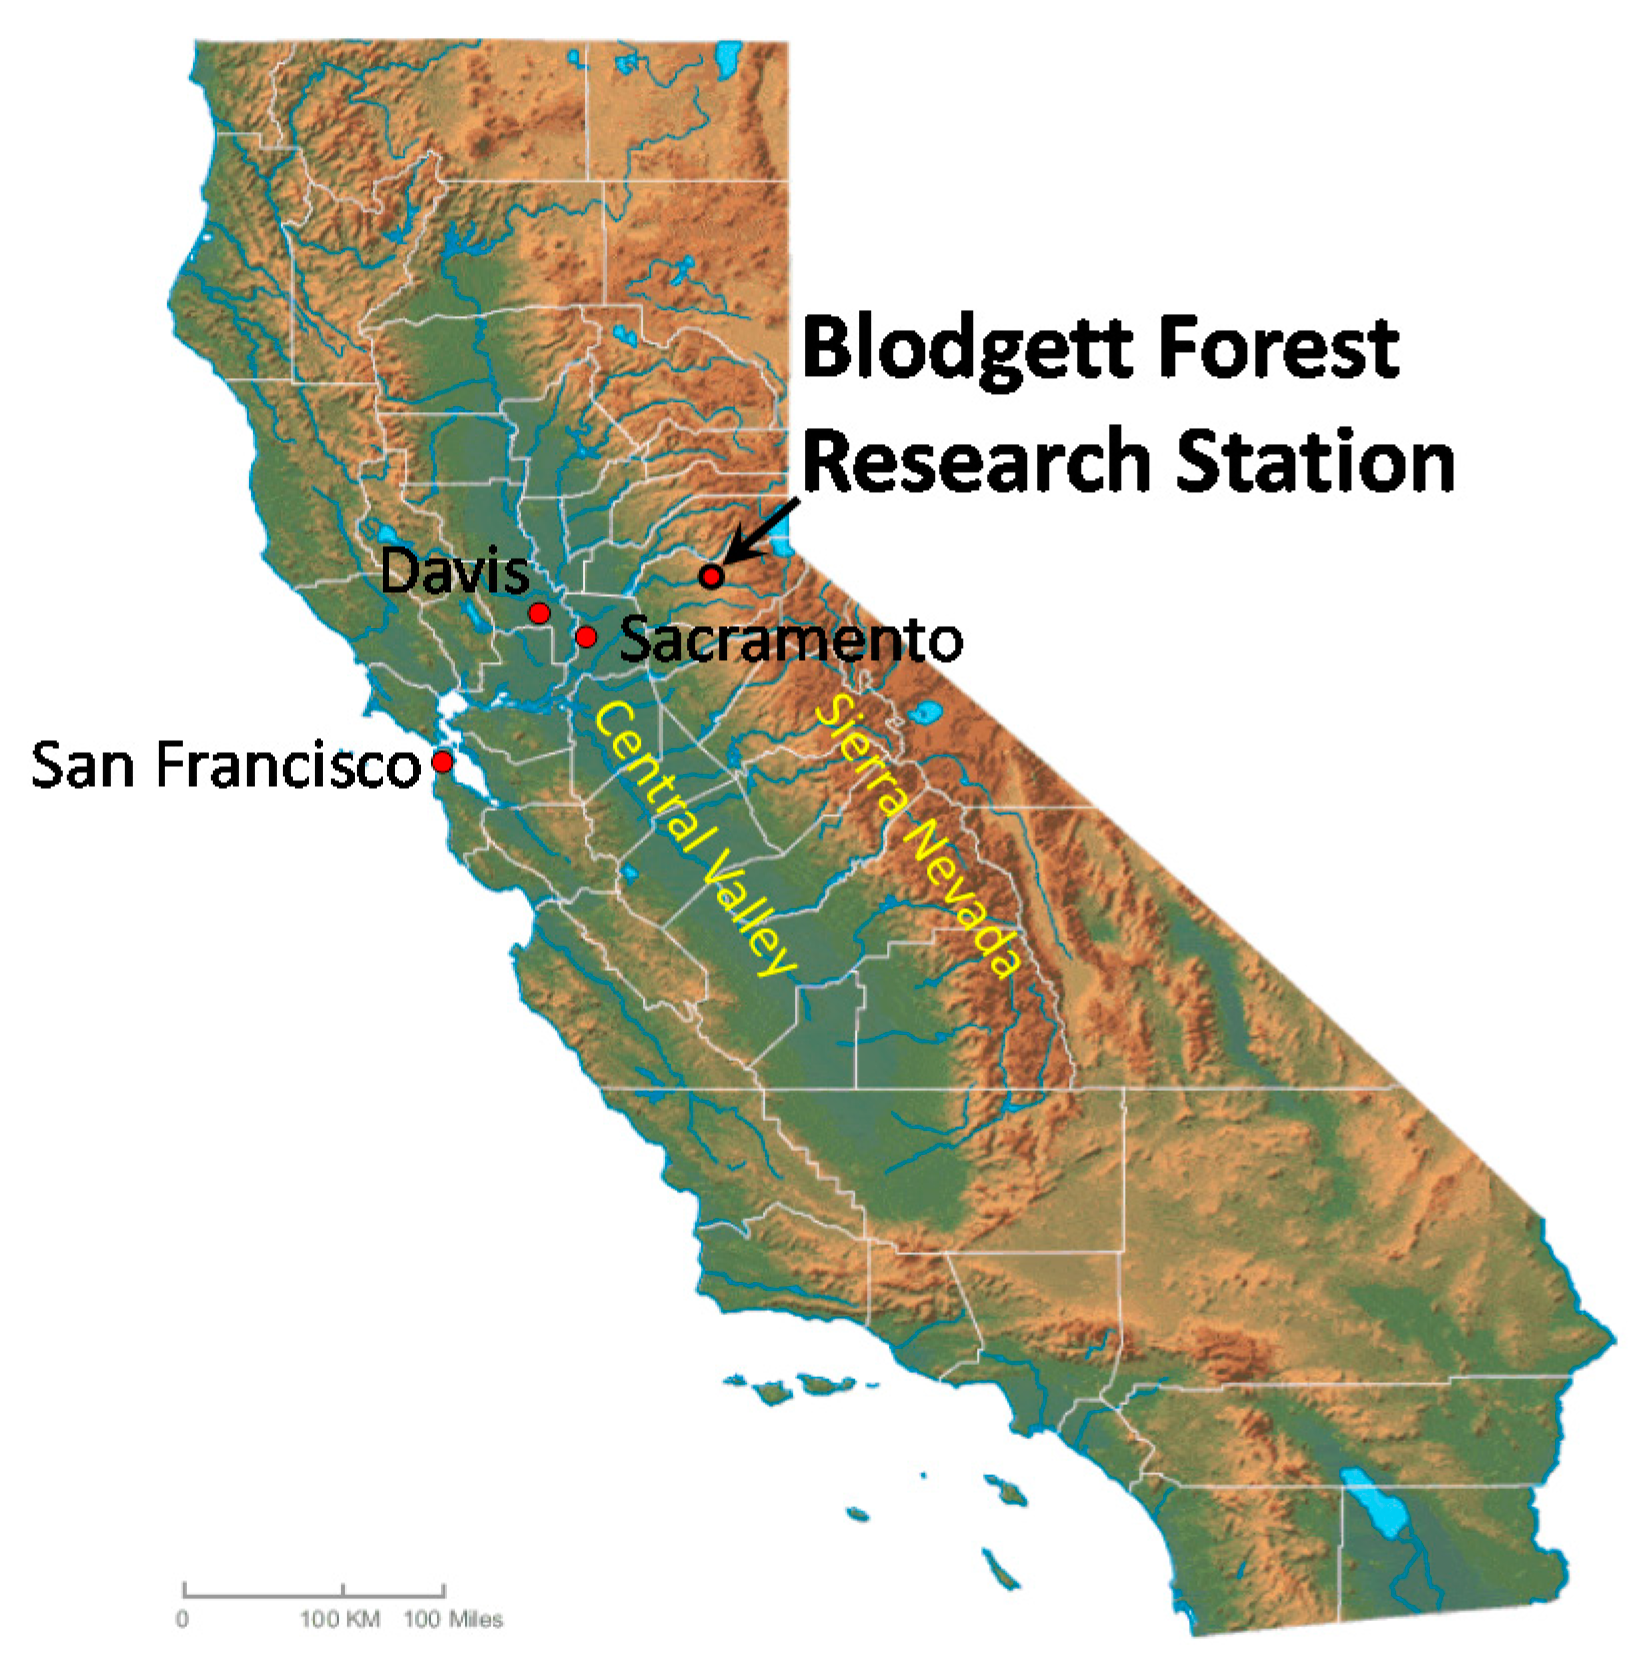
2.1. Study Site and Treatment

The Blodgett Forest Research Station (BFRS) is 1198 ha of Sierra Nevada forest land located east of Georgetown, California (approx. 100 km northeast of Sacramento, Figure 3). The woody biomass waste piles at the BFRS include tree tops, limbs, and small trees. The piles were generated from thinning treatments in mixed conifer plantations during the summer of 2012. The treatment objectives were to reduce the fire hazard, increase the average tree vigor, and increase the species diversity. Operations were typical of those in the Sierra Nevada, where young and dense forests have developed following wildfires or even-aged harvests. Plantations were thinned to an average of 272 trees per ha from pre-treatment stocking levels of 549 trees per ha. Four plantations were thinned, covering a total of approx. 32 ha. Because smaller trees were preferred for removal, the average stem diameter (for residual trees) at breast height (DBH) increased from 30.2 to 33.3 cm. Sawlogs with >15.2 cm dia. on the small end and ≥3.05 m long were transported to a sawmill for processing into lumber products. Unmerchantable trees (too small to process into sawlogs) plus the tops and limbs of merchantable trees were piled at landings adjacent to the roadside for disposal by open burning; the processing residues had been piled with the intention of burning rather than grinding them, and thus no attention was paid to orienting the tops so that they could be readily fed into the grinder. The overall sizes of the piles generated were typical of thinning operations in young and mature forests, with the bulk volume averaging 1784 m3 per pile [23].
At each BFRS slash pile, a grapple excavator was used to transfer the waste material into a horizontal grinder. Wood chips from the grinder were conveyed directly into chip vans operated by Brushbusters, Inc. and transported to the Buena Vista Biomass Power (BVBP) facility, typically a 105 km one-way trip. The equipment and engines used for the loading and grinding operations (Table 1) were sized for the scale of operations that a medium or large landowner might consider. Landing piles for the project contained ≥100 green tons (GT) of biomass waste (the equivalent of four chip vans each holding 25 GT). All of the biomass received at the BVBP facility had been chipped prior to transport since the BVBP facility does not have fuel-processing equipment on site. Brushbusters’ operations of grinder, excavator, and chip vans were carefully observed and tracked, including the determination of the total operating hours, productive operating hours, diesel fuel use, biomass production, and distance traveled. The data of the amount and moisture content of the transported chips were derived by interviewing the BVBP staff on the day after the transport day.

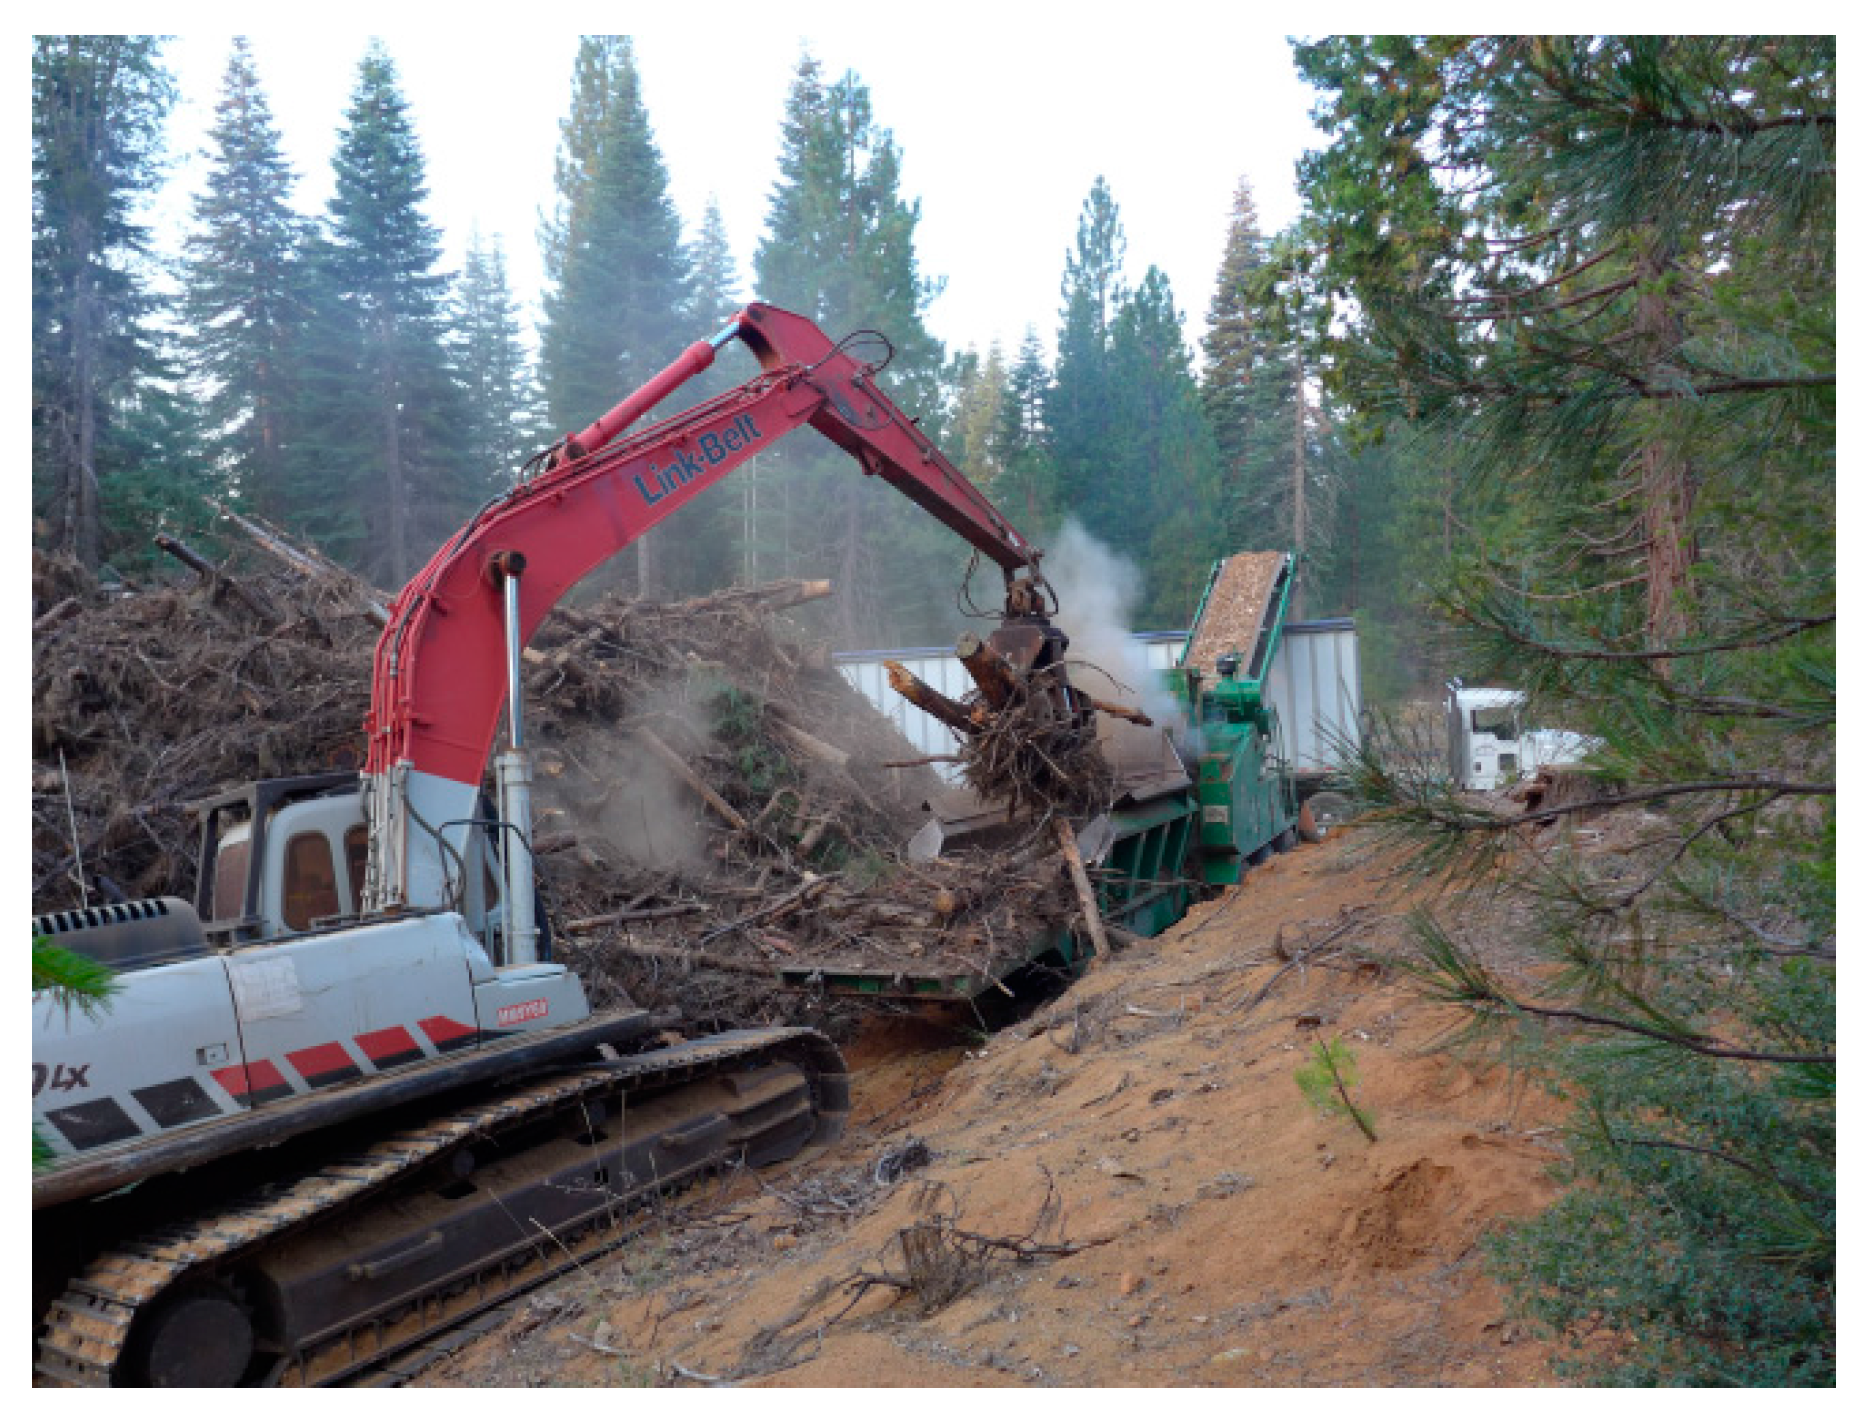
2.2. Description of Slash Pile and Element Operation

For the analysis of the relationship between the slash pile size and the productivity of the grinder, the following three piles were selected from the total of six piles and studied their processing, grinding, and transport operations: Small (20 m long × 15 m wide × 4 m high; 51.41 BDT), Medium (30 × 24 × 4 m; 122.66 BDT), and Large (35 × 30 × 4 m; 173.78 BDT) piles. The following element operations of the excavator were monitored:
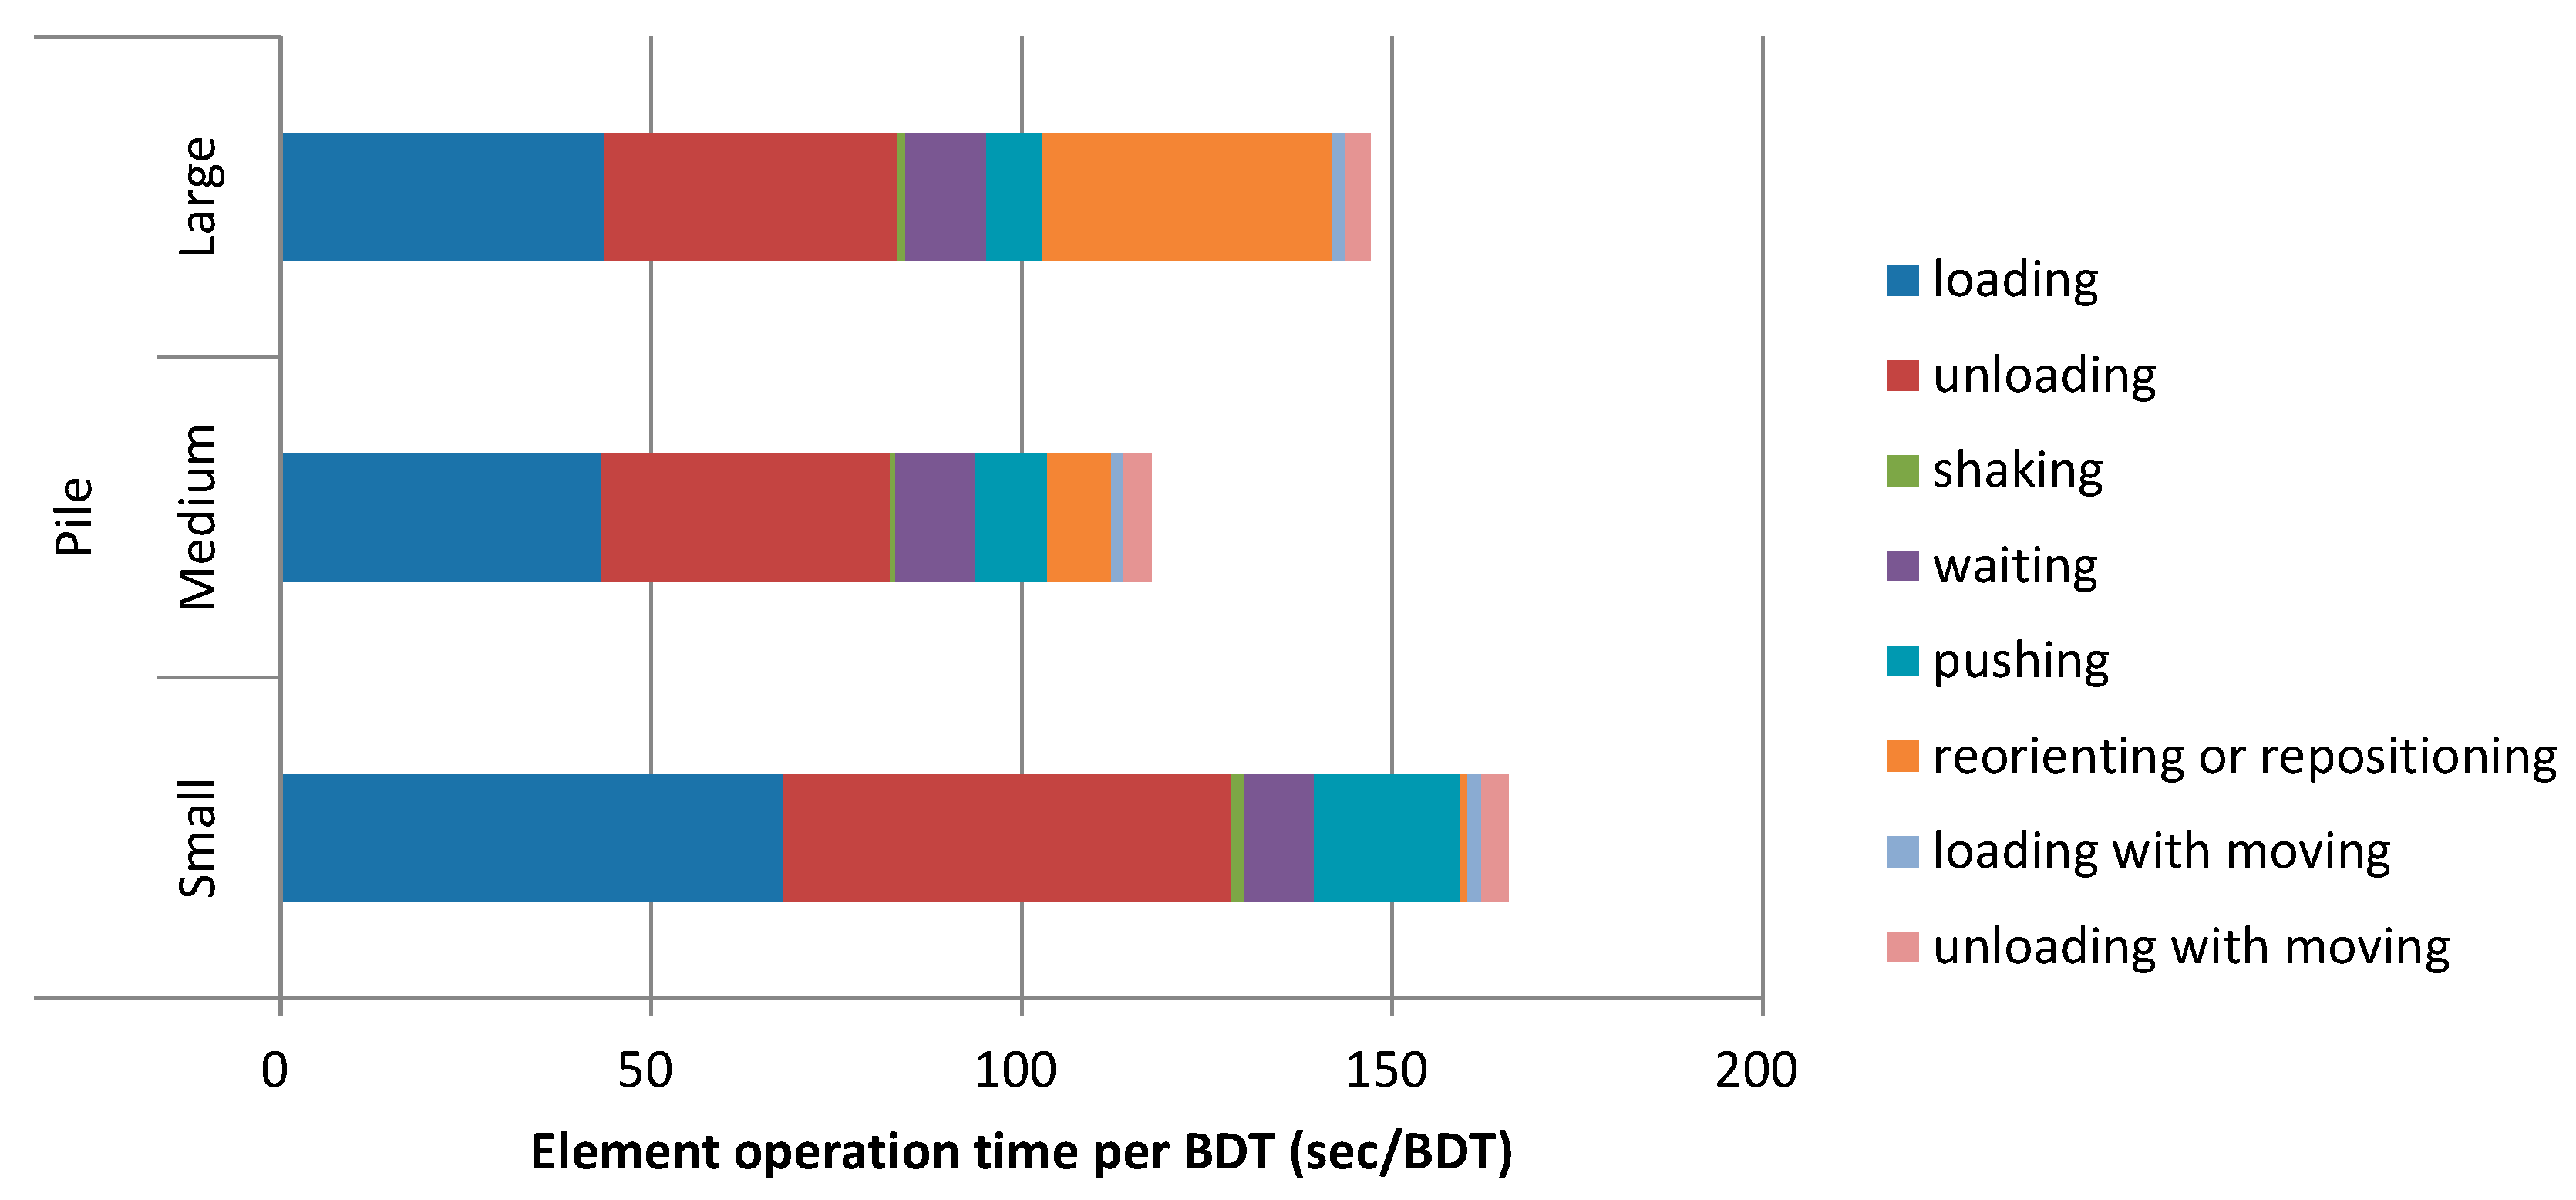
  • Loading means grabbing logging residues out of a slash pile and then pivoting with load;
  • Unloading means releasing the residues at the conveyor of a horizontal grinder and then pivoting with no load;
  • Shaking means shaking waste material off in order to facilitate the feeding of grabbed residues;
  • Waiting means waiting for feeding the material; the grinding operation was carried out by the interaction of excavator and grinder, so the waiting operation was essential for the excavator;
  • Pushing means pushing the material into the grinder when it could not ‘swallow’ the residues because of their bulkiness;
  • Reorienting or repositioning means reorienting or repositioning the scattered material in order to increase the amount of residue per grab when the operation proceeded and the bulk volume of pile became smaller;
  • Loading with moving means that the loading operation shown above was done with moving;
  • Unloading with moving means that unloading operation shown above was done with moving.
Provided that the shape of each landing slash pile location was rectangular, the amounts of logging residues per m2 were calculated as 0.171 BDT/m2 (=51.41 BDT/(20 m × 15 m)), 0.170 BDT/m2 (=122.66 BDT/(30 m × 24 m)), and 0.166 BDT/m2 (=173.78 BDT/(35 m × 30 m)) for the Small, Medium, and Large piles, respectively, and it was thus concluded that there was no significant deviation of the amount of residues among the three piles.

3. Results of the Time Study and the Monitored Productivity of a Grinder

During the period of 20 August 2013 through 4 September 2013 on eight workdays, 601 BDT (928 GT) of forest slash from the BFRS were collected, processed, and transported by Brushbusters for energy use to the BVBP facility. This comprised a total of 37 separate chip van loads, with each delivery averaging 16.3 BDT (25.1 GT). Average moisture content of the delivered chips was 55.1% on a dry basis (standard deviation = 8.01%).
The results of the time study are shown in Table 2. The times of loading and shaking would be shortened by improving the piling method, such as by orienting the tree tops and limbs so that they can most readily be fed into the grinder. Modifying the infeed conveyor of the grinder, e.g., by extending its length, would improve the times needed for waiting and pushing. With respect to the impact of the slash pile size, the average times of all element operations except for reorienting or repositioning were not influenced by the pile size. The reorienting/repositioning frequency was increased and its average time was lengthened as the size of the pile bulked up. The percentage of the time of reorienting/repositioning to the total observed time was also proportional to the pile size.
The results of the time study per BDT (Figure 4) show that grinding the Medium pile was the most productive, at 30.65 BDT/PMH0 (=122.66 BDT/14,408 s × 3600 s/h). The productivity for the Small pile was 21.73 BDT/PMH0 (=51.41 BDT/8519 s × 3600 s/h), and that for the Large pile was 24.49 BDT/PMH0 (=173.78 BDT/25,545 s × 3600 s/h), thereby suggesting that there might be an optimum size of slash pile for a grinding operation. The Nordic guidelines state that the preferable size for a slash pile is 20–30 m long and a max. of 4 m high [24]; this guideline supports this paper’s finding about the Medium pile, of which width was 24 m.
The element operation times of reorienting/repositioning per BDT were 1.01 s/BDT (=52 s/51.41 BDT), 8.61 s/BDT (=1056 s/122.66 BDT), and 39.3 s/BDT (=6826 s/173.78 BDT) for the Small, Medium, and Large piles, respectively, thus lengthening as the size of the pile bulked up. The calculated weights of slashes per loading were 0.138 BDT/time (=51.41 BDT/359 + 13 times (this was the total frequency of element operations of loading and loading with moving)), 0.212 BDT/time (=122.66 BDT/550 + 29 times), and 0.208 BDT/time (=173.78 BDT/802 + 33 times) for the grinding of the Small, Medium, and Large piles, respectively, which suggests that reorienting or repositioning material from the pile could make the amount of slashes per loading increase and the productivity of the grinder rise. However, reorienting or repositioning from too large a pile may take too much time, resulting in a decline of the overall operational efficiency.

4. Discussion by the Simulation Model

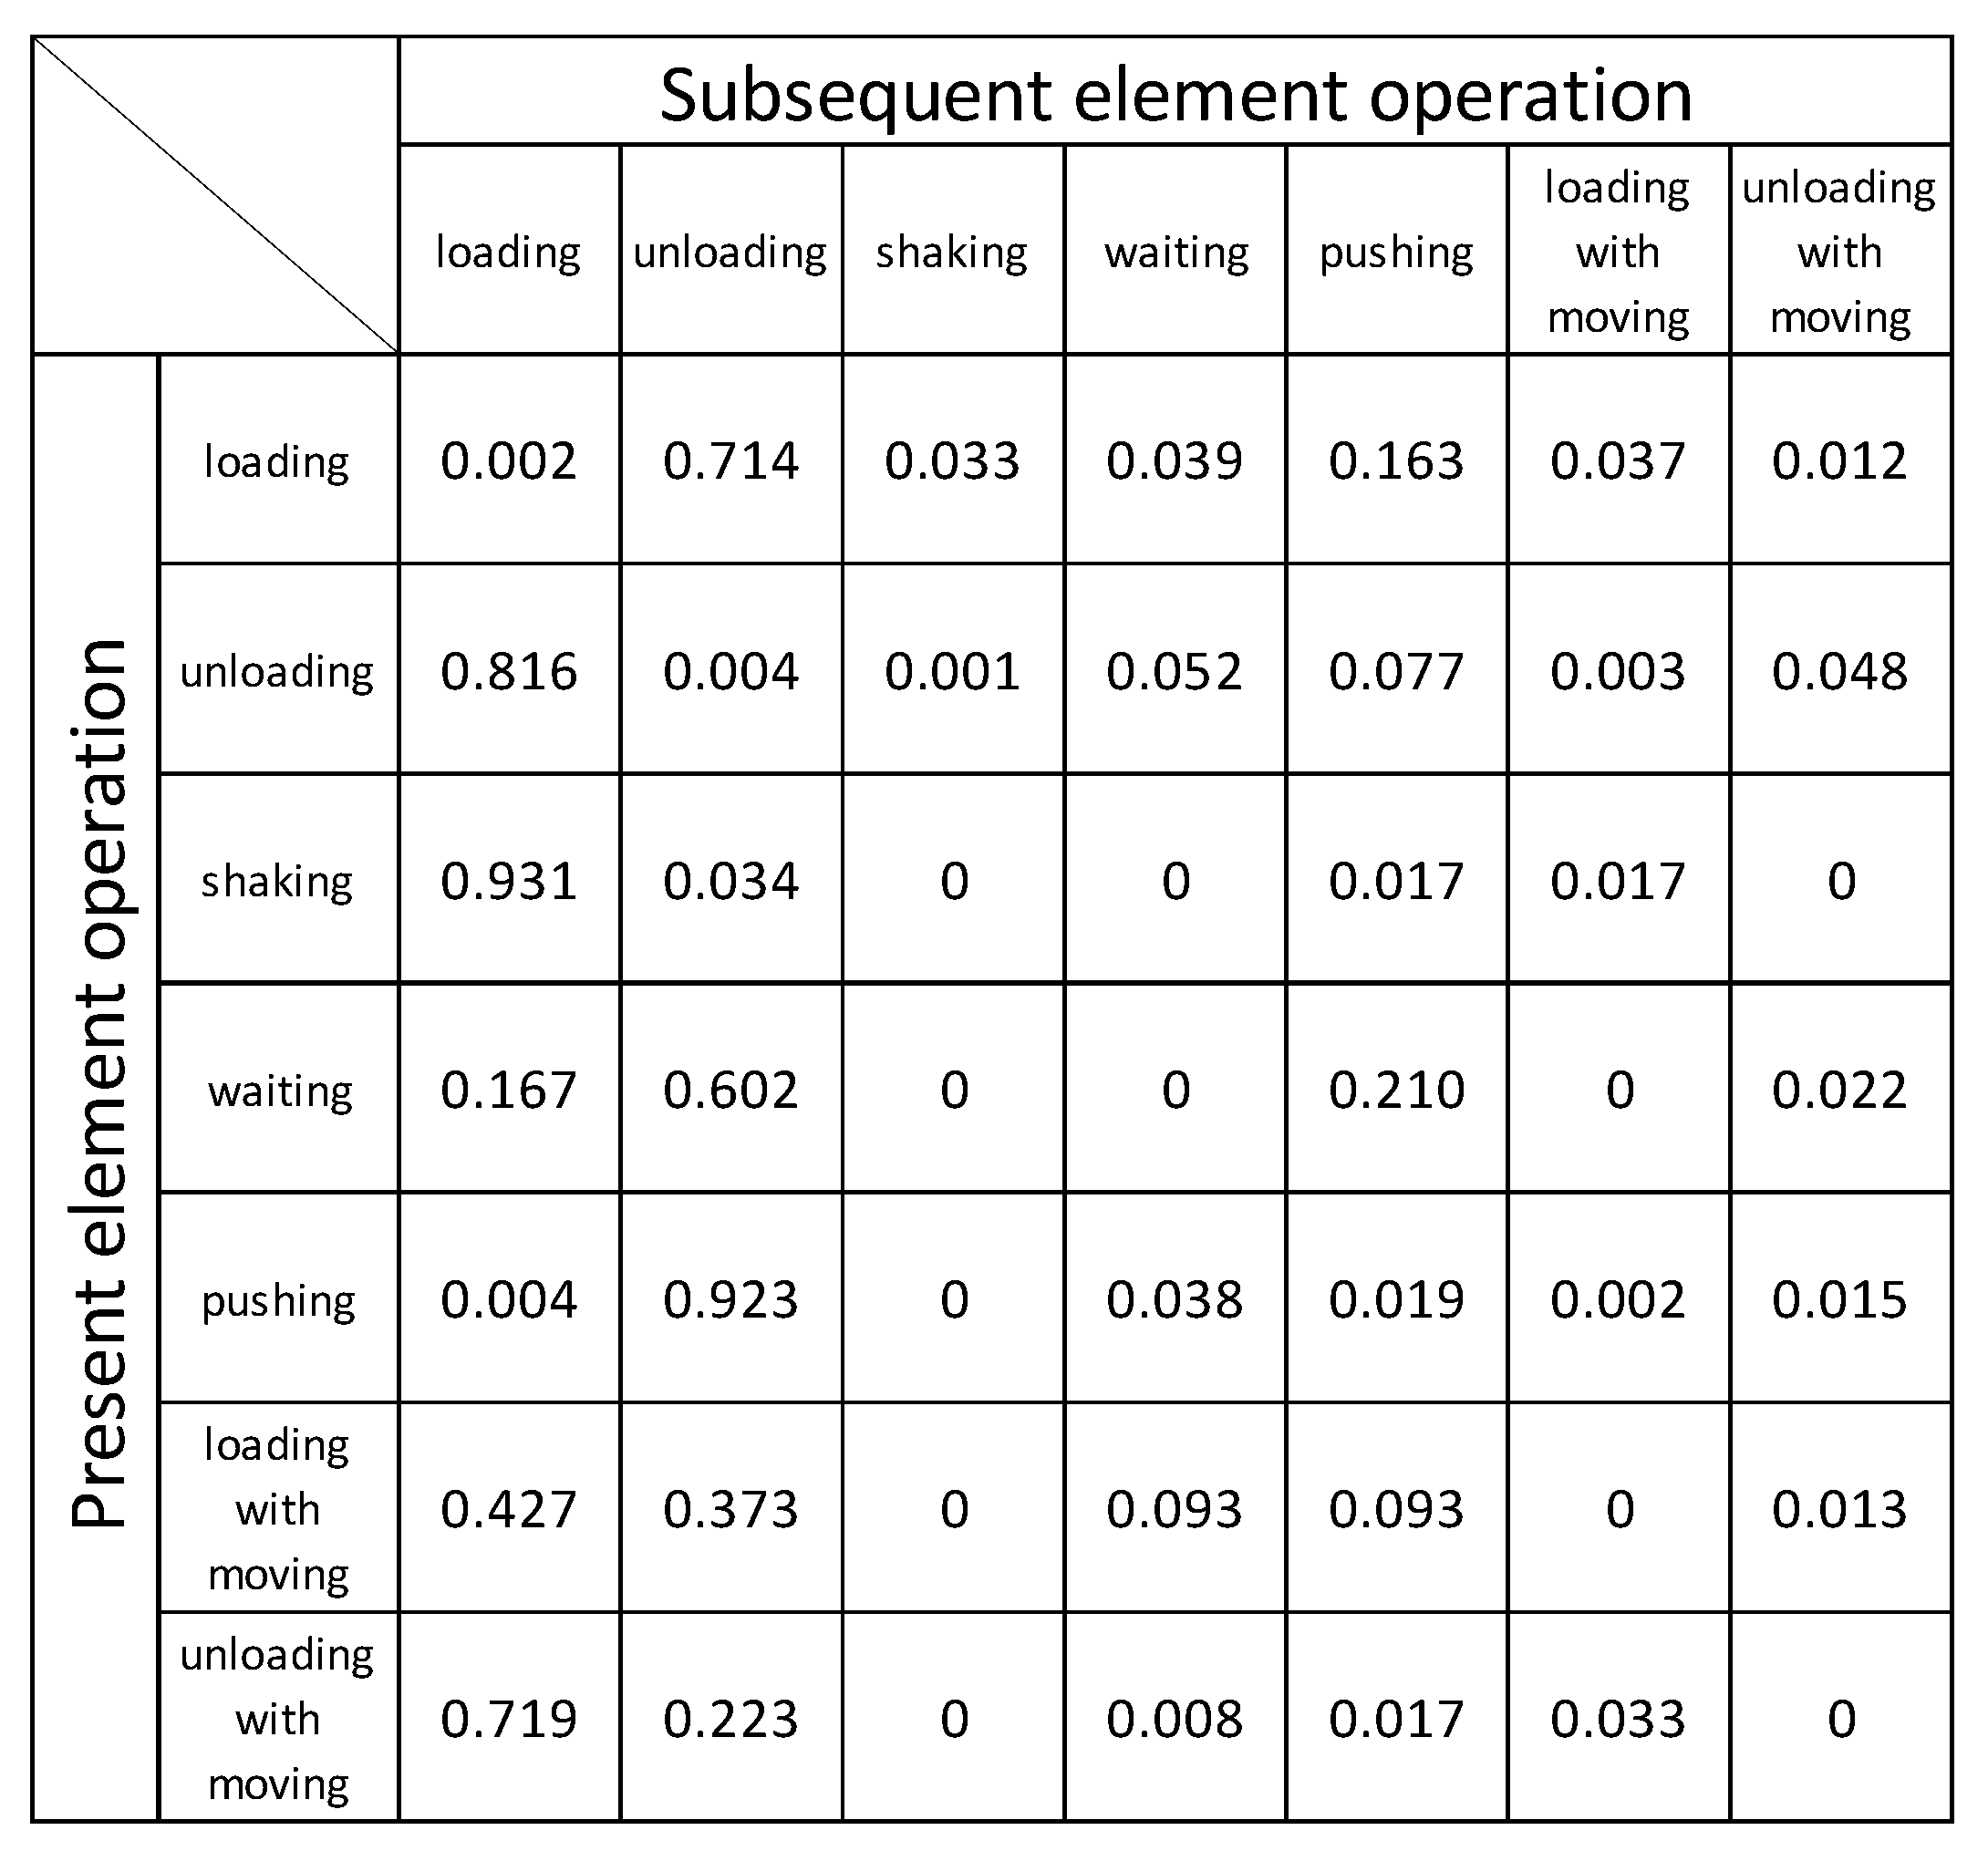
4.1. Modeling a Grapple Excavator Operation

The respective element operations of a grapple excavator’s operation were aggregated and created histograms. A theoretical formula of each element operation time was determined from the distribution of the histogram of the monitored element operation time, and each operation time was estimated by substituting random sampling numbers for the theoretical formula, such as exp(N(m, σ)) and N(m, σ) is an operator that generates random normal numbers of which average and standard deviation are m and σ, respectively; the theoretical formula was expected to follow a lognormal distribution according to the study by Sakurai et al. [19]. The monitored grapple excavator operation was complicated because there are so many branches in the workflow of element operations. A transition probability matrix was thus constructed based on the connectivity of element operations. In the simulation model, the next element’s operation was determined by the matrix.
The average times of all of the element operations other than reorienting/repositioning were not influenced by the pile size, as mentioned above. Therefore, concerning these seven element operations, i.e., (1) loading, (2) unloading, (3) shaking, (4) waiting, (5) pushing, (6) loading with moving and (7) unloading with moving, the element operation times monitored at the three piles were put together and the transition probabilities that would indicate the probability that the next element operation would occur were calculated (Figure 5). The time distribution of each element operation was fit to a lognormal distribution, and a chi-square test of goodness of fit was conducted. The goodness of fit in none of the element operations was rejected at the significance level of 5%, so the theoretical formulae of these element operations could be determined (Table 3).
On the other hand, the frequency of reorienting/repositioning in the time study was low and a distinct relationship with precedent and subsequent element operations was not observed. However, reorienting/repositioning was an element operation that was definitely carried out within the workflow of the grapple excavator operation, and thus the total operation time was estimated based on a theoretical formula. From the results described in the text section above, i.e., 1.01 s/BDT for the Small pile (300 m2), 8.61 s/BDT for the Medium pile (720 m2), and 39.3 s/BDT for the Large pile (1050 m2), the relationship between the landing area of slash pile location, x (m2), and the time of reorienting or repositioning per BDT, y (s/BDT), was approximated as follows:
y = 0.2397 exp(0.00489x) (r2 = 0.9992)
and then the total time could be calculated by multiplying y by the amount of logging residues at the landing.
In the constructed model, the mass of the landing pile is first set up, and the simulation is started at the element operation of loading. A grapple excavator grabs logging residues out of a slash pile when loading and loading with moving. If the mass of the pile falls below zero after the excavator grabs the residues, the element operation of unloading comes next; then the excavator operation is finally finished. Consequently, the total time of the excavator operation is composed of the time calculated by the simulation model and the estimated element operation time of reorienting/repositioning. Incidentally, the amount of residue per grab, z (BDT/time), was approximated as a function of the landing area of slash pile location, x, from the results described in the last section, i.e., 0.138 BDT/time for the Small pile (300 m2), 0.212 BDT/time for the Medium pile (720 m2), and 0.208 BDT/time for the Large pile (1050 m2), as follows:
z = −2.489 × 10−7x2 + 4.292 × 10⁻⁴x + 3.184 × 10⁻² (r2 = 1.000)

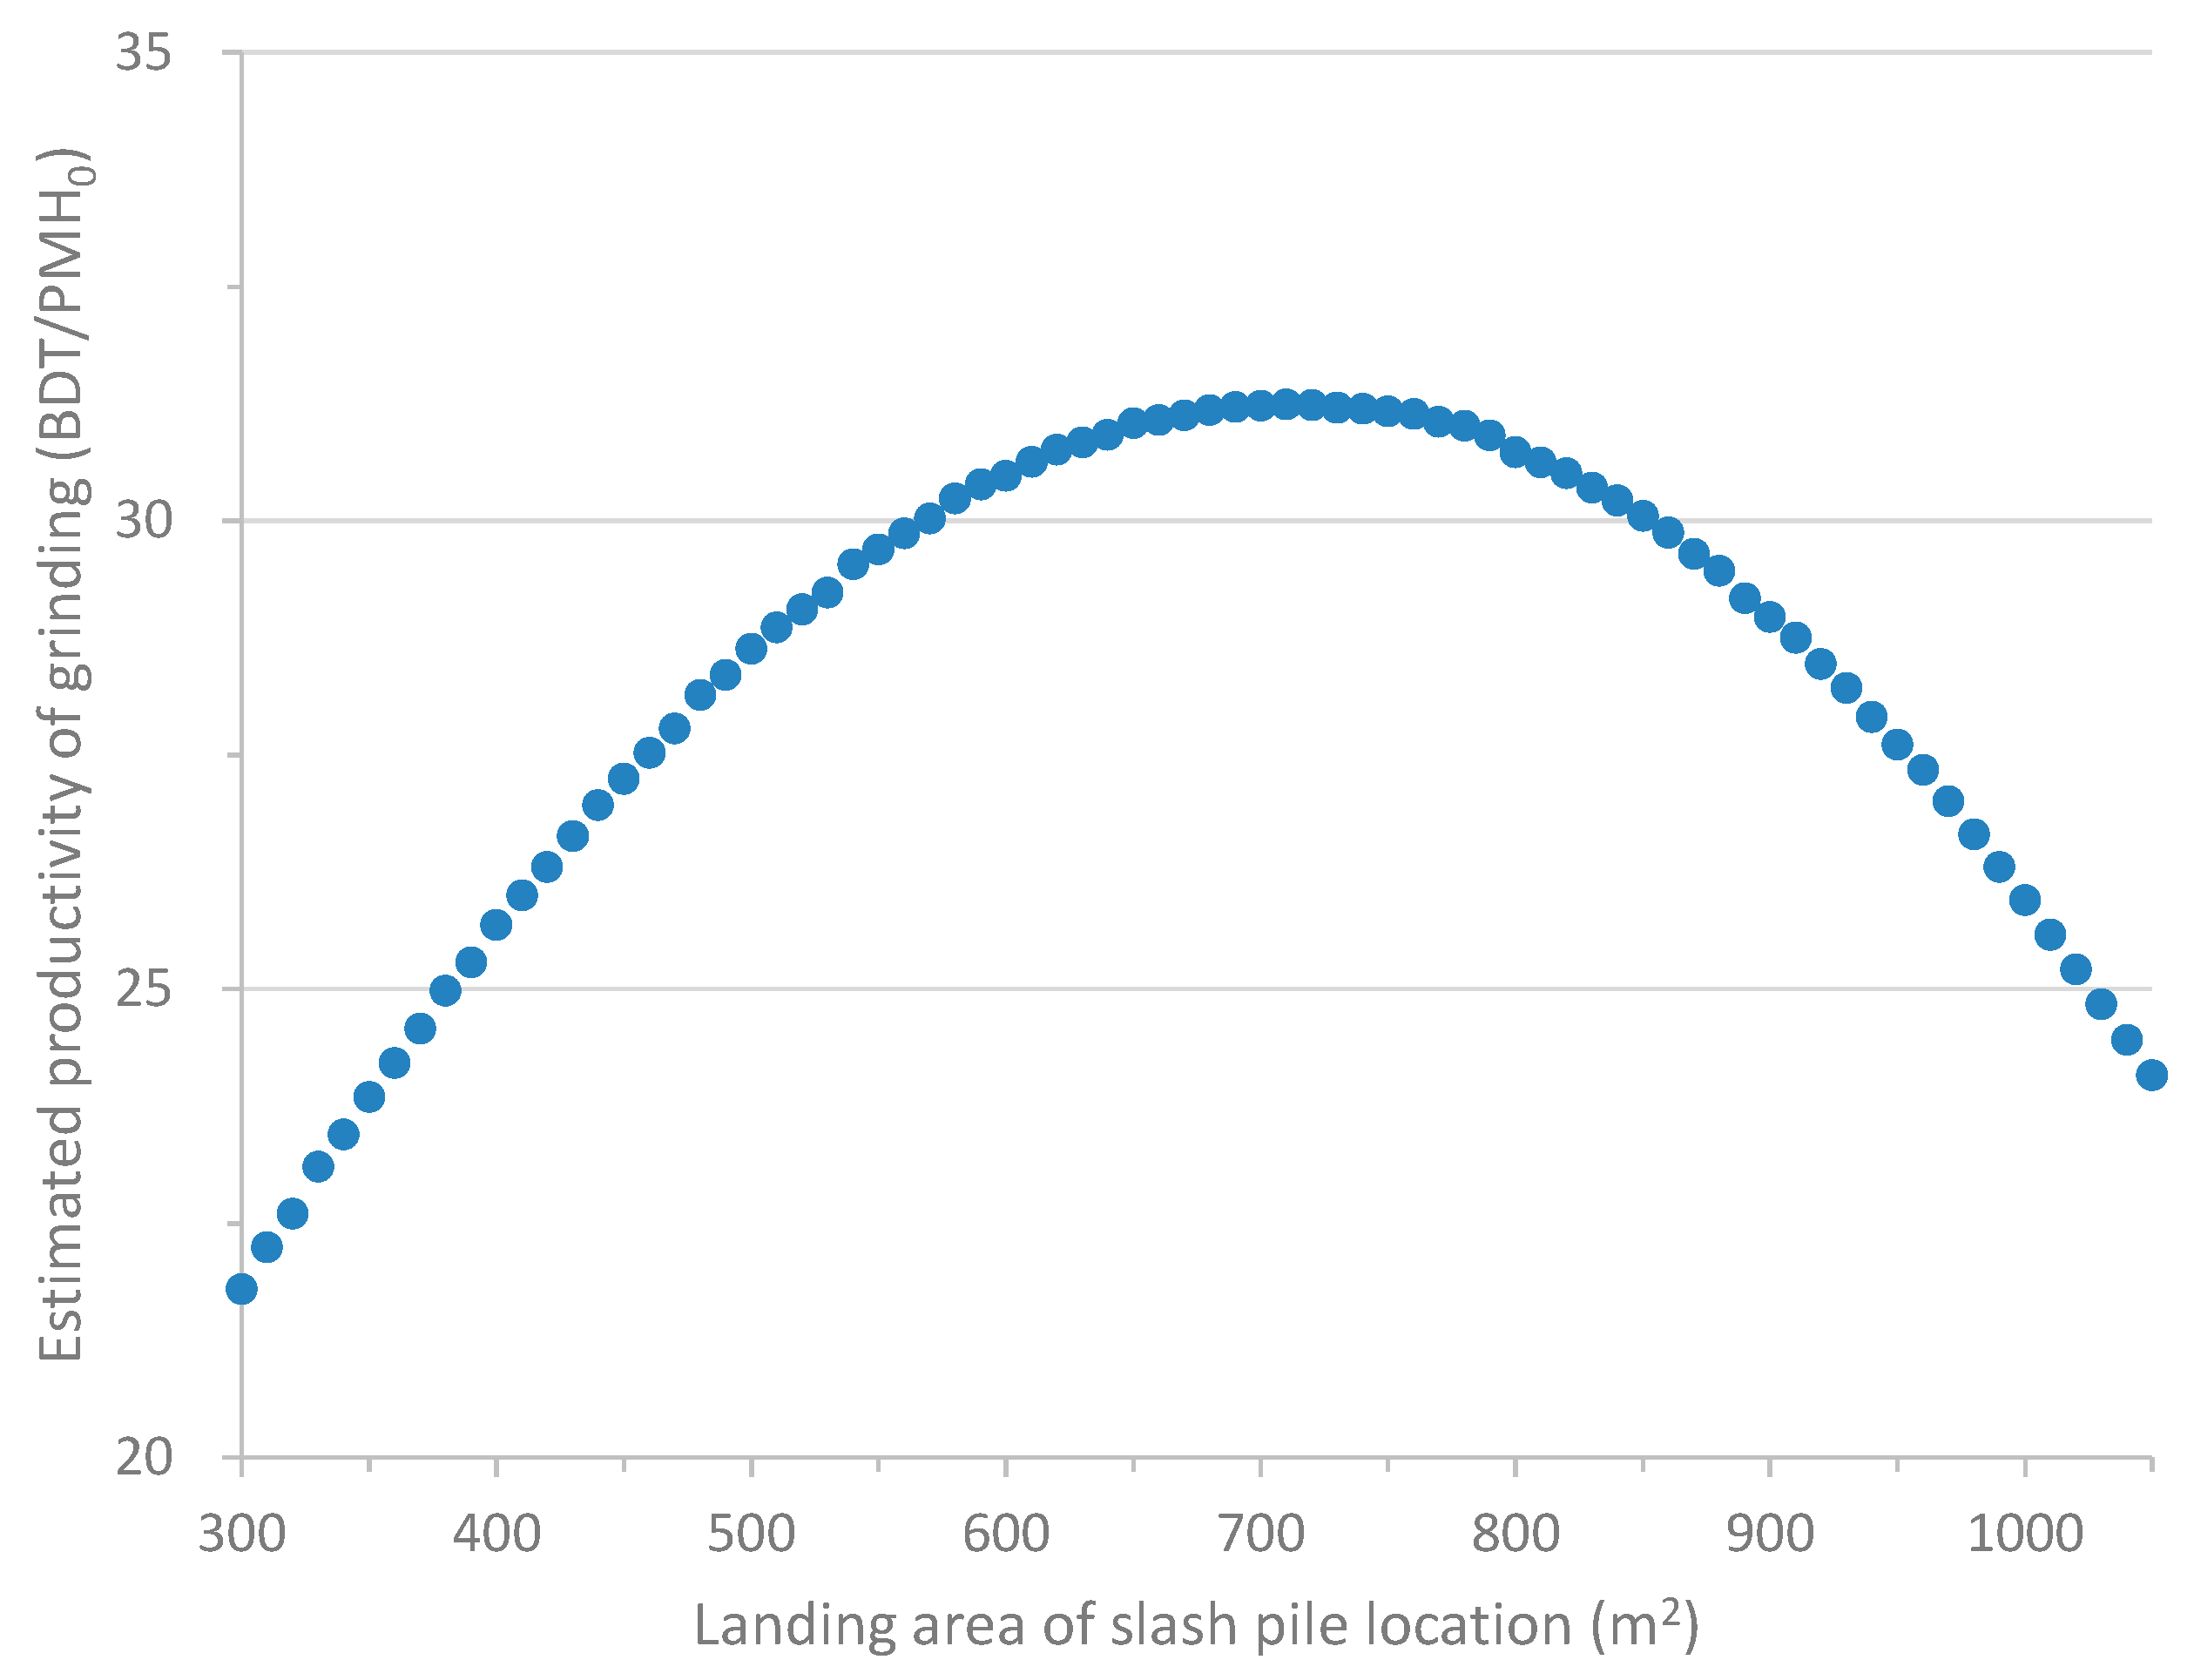
4.2. Verification of the Replicability of the Model and an Optimum Slash Pile Size

The replicability of the constructed model was verified by comparing the monitored productivities with the values calculated by the simulation (the program was created by using Microsoft Excel VBA). The calculation was repeated 1000 times for the respective Small, Medium, and Large piles (Table 4). The maximum difference between the monitored value and the average calculated value was 1.7% for the Medium pile, and the highest ratio of the standard deviation to the average calculated productivity was only 3.2% (=0.70/21.78 × 100) for the Small pile; it was thus concluded that the constructed simulation model well-replicated the actual operations.
For the discussion of an optimum slash pile size that maximizes the productivity of a grinder, the landing area of slash pile location was focused on next. A simulation was carried out for a landing area between 300 m2 (for the Small pile; 20 m long × 15 m wide) and 1050 m2 (for the Large pile; 35 m long × 30 m wide) at 10 m2 intervals. In the simulation of the respective landing areas, the calculation was repeated 1000 times. The productivity for each landing was determined based on the averaged total operation time. Since no significant deviation of the amount of residues among the three piles was observed in the time study, the mass of the slash pile in an initial state of simulation was calculated by multiplying 0.168 BDT/m2 (=(0.171 × 300 + 0.170 × 720 + 0.166 × 1050)/(300 + 720 + 1050), which was the weighted average value of the monitored three piles) by the landing area.
Figure 6 shows the results of the simulation. The productivity of grinding at the landing area of 710 m2 of slash pile location is 31.24 BDT/PMH0, which is the highest productivity value obtained. However, the difference in the estimated productivities is small between the areas 690 m2 (31.21 BDT/PMH0) and 730 m2 (31.20 BDT/PMH0), and there is a range in the calculation result for each landing. It should be noted therefore that Figure 6 simply compares the average values of the 1000-times repeated calculation. Concerning the versatility of the constructed model, however, the following points should be discussed further so that the accuracy of the model can be improved:
  • The shape of each landing, i.e., the ratio of its length to its width, was not considered in the simulation model;
  • The theoretical formulae of (1) and (2) were both approximated from only three samples;
  • The optimum size of the slash pile for a grinding operation will also depend in part on aspects of the machines used, e.g., their size, engine output, and grinding capacity.

5. Conclusions

The simulation model that can replicate the operations of a grapple excavator and a horizontal grinder was constructed based on a Sierra Nevada, California survey, and this paper determined the optimum size of a slash pile for a grinding operation, which is expressed in the landing area of slash pile location.
With respect to other results derived from the Blodgett Project, it was demonstrated that utilization of biomass from these large debris piles can result in energy and air quality benefits [23], as follows:
  • The energy (diesel fuel) expended for processing and transport was 2.5% of the biomass fuel (energy equivalent);
  • Based on measurements from a large pile burn, air emission reductions of 98–99% for PM2.5, CO, NMOC, CH4, and BC, and 20% for NOX and CO2-equivalent greenhouse gases were observed;
  • The delivered cost of $70/BDT exceeds the biomass plant gate price of $45/BDT. Under typical conditions, the break-even haul distance would be approx. 48 km.

Acknowledgments

The Placer County Air Pollution Control District sponsored the Blodgett Project #BF12-05RY ‘Forest Biomass Diversion: Tracking the Economic Costs and Air Emissions of Forest Biomass Diversion and Allocating the Air Emissions Credits Generated’ at the Blodgett Forest Research Station of the Center for Forestry, the University of California, Berkeley. This study was financially supported in part by JSPS KAKENHI Grant Numbers JP24580213 and JP15H04508, the University of California, Davis, and the Nihon University.

Author Contributions

T.Y. and B.H. conceived, designed, and performed the field experiments; T.Y., S.K., and K.I. analyzed the data; R.S. contributed the simulation model; T.Y. and B.H. wrote the paper.

Conflicts of Interest

The authors declare no conflict of interest.

References

  1. McIntyre, P.J.; Thorne, J.H.; Dolanc, C.R.; Flint, A.L.; Flint, L.E.; Kelly, M.; Ackerly, D.D. Twentieth-century shifts in forest structure in California: Denser forests, smaller trees, and increased dominance of oaks. Proc. Natl. Acad. Sci. USA 2015, 112, 1458–1463. [Google Scholar] [CrossRef] [PubMed]
  2. Kocher, S. Californians must learn from the past and work together to meet the forest and fire challenges of the next century. Calif. Agric. 2015, 69, 5–9. [Google Scholar] [CrossRef]
  3. North, M.; Collins, B.; Stephens, S. Using fire to increase the scale, benefits, and future maintenance of fuels treatments. J. For. 2012, 110, 392–401. [Google Scholar] [CrossRef]
  4. Springsteen, B.; Christofk, T.; Eubanks, S.; Mason, T.; Clavin, C.; Storey, B. Emission reductions from woody biomass waste for energy as an alternative to open burning. J. Air Waste Manag. Assoc. 2011, 61, 63–68. [Google Scholar] [CrossRef] [PubMed]
  5. Present Status and Promotion Measures for the Introduction of Renewable Energy in Japan. Available online: http://www.meti.go.jp/english/policy/energy_environment/renewable/index.html (accessed on 26 October 2017).
  6. Forestry Agency of Japan (Ed.) FY 2016 White Paper in Forest and Forestry; Zenrinkyou: Tokyo, Japan, 2017; p. 236. (In Japanese)
  7. Tomari, M. (Ed.) Biomass White Paper 2017; Biomass Industrial Society Network (BIN), NPO: Kashiwa, Japan, 2017; p. 28. (In Japanese) [Google Scholar]
  8. Seymour, G.; Tecle, A. Impact of slash pile size and burning on ponderosa pine forest soil physical properties. J. Ariz. Nev. Acad. Sci. 2004, 37, 74–82. [Google Scholar] [CrossRef]
  9. Seymour, G.; Tecle, A. Impact of slash pile size and burning on soil chemical characteristics in ponderosa pine forests. J. Ariz. Nev. Acad. Sci. 2005, 38, 6–20. [Google Scholar] [CrossRef]
  10. Kim, D.-W.; Murphy, G. Forecasting air-drying rates of small Douglas-fir and hybrid poplar stacked logs in Oregon, USA. Int. J. For. Eng. 2013, 24, 137–147. [Google Scholar] [CrossRef]
  11. Lin, Y.; Pan, F. Effect of in-woods storage of unprocessed logging residue on biomass feedstock quality. For. Prod. J. 2013, 63, 119–124. [Google Scholar] [CrossRef]
  12. Bisson, J.A.; Han, H.-S. Quality of feedstock produced from sorted forest residues. Am. J. Biomass Bioenerg. 2016, 5, 81–97. [Google Scholar] [CrossRef]
  13. Zamora-Cristales, R.; Sessions, J.; Marrs, G. Economic implications of grinding, transporting, and pretreating fresh versus aged forest residues for biofuel production. Can. J. For. Res. 2017, 47, 269–276. [Google Scholar] [CrossRef]
  14. Hartsough, B.; Nakamura, G. Harvesting eucalyptus for fuel chips. Calif. Agric. 1990, 44, 7–8. [Google Scholar]
  15. Yoshioka, T.; Aruga, K.; Sakai, H.; Kobayashi, H.; Nitami, T. Cost, energy and carbon dioxide (CO2) effectiveness of a harvesting and transporting system for residual forest biomass. J. For. Res. 2002, 7, 157–163. [Google Scholar] [CrossRef]
  16. Yoshioka, T.; Aruga, K.; Nitami, T.; Sakai, H.; Kobayashi, H. A case study on the costs and the fuel consumption of harvesting, transporting, and chipping chains for logging residues in Japan. Biomass Bioenerg. 2006, 30, 342–348. [Google Scholar] [CrossRef]
  17. Yoshioka, T.; Sakurai, R.; Aruga, K.; Nitami, T.; Sakai, H.; Kobayashi, H. Comminution of logging residues with a tub grinder: Calculation of productivity and procurement cost of wood chips. Croat. J. For. Eng. 2006, 27, 103–114. [Google Scholar]
  18. Iwaoka, M.; Aruga, K.; Sakurai, R.; Cho, K.-H.; Sakai, H.; Kobayashi, H. Performance of small harvester head in a thinning operation. J. For. Res. 1999, 4, 195–200. [Google Scholar] [CrossRef]
  19. Sakurai, R.; Iwaoka, M.; Sakai, H.; Kobayashi, H. Studies on yarding and hauling system of mobile-yarder, processor, and forwarder with simulation methods. Bull. Tokyo Univ. For. 1999, 102, 113–132, (In Japanese with English Summary). [Google Scholar]
  20. Nitami, T. Modeling of timber harvesting operation by system dynamics and the productivity estimation function. J. Jpn. For. Eng. Soc. 2006, 20, 281–284. (In Japanese) [Google Scholar] [CrossRef]
  21. Sugimoto, K.; Niinaga, S.; Hasegawa, H. Consideration on flow harvesting system utilizing system dynamics. J. Jpn. For. Eng. Soc. 2010, 25, 5–14, (In Japanese with English Summary). [Google Scholar] [CrossRef]
  22. Yoshimura, T.; Hartsough, B. Conceptual evaluation of harvesting systems for fuel reduction and biomass collection on steep terrain using system dynamics. In Proceedings of the International Mountain Logging and 13th Pacific Northwest Skyline Symposium, Corvallis, OR, USA, 1–6 April 2007; Sessions, J., Havill, Y., Eds.; Department of Forest Engineering, Oregon State University: Corvallis, OR, USA, 2007; pp. 94–102. Available online: http://www.cof.orst.edu/cof/ferm/pdf/skyproceedings.pdf (accessed on 22 September 2017).
  23. Springsteen, B.; Christofk, T.; York, R.; Mason, T.; Baker, S.; Lincoln, E.; Hartsough, B.; Yoshioka, T. Forest biomass diversion in the Sierra Nevada: Energy, economics and emissions. Calif. Agric. 2015, 69, 142–149. [Google Scholar] [CrossRef]
  24. Nilsson, B. Costs, CO2-emissions and energy balance for applying Nordic methods of forest biomass utilization in British Columbia. M.Sc. Thesis, Department of Forest Resource Management, Swedish University of Agricultural Sciences, Umeå, Sweden, 13 April 2009. Available online: http://ex-epsilon.slu.se/id/eprint/3244 (accessed on 22 September 2017).
Figure 1. Open pile burning.
Forests 08 00442 g001
Figure 2. Grinding operation.
Forests 08 00442 g002
Figure 3. Location of the study site.
Forests 08 00442 g003
Figure 4. Element operation time per BDT.
Forests 08 00442 g004
Figure 5. Transition probability matrix of element operations of the grapple excavator.
Forests 08 00442 g005
Figure 6. Relationship between the landing area of slash pile location and the estimated productivity of grinding.
Forests 08 00442 g006
Table 1. Equipment and engines for biomass processing.
EquipmentGrapple ExcavatorHorizontal Grinder
Vendor, modelLink-Belt, 290 LXBandit, Beast 3680
Engine, horsepowerIsuzu CC-6BG1TC, 132 kWCaterpillar C18 Tier III, 522 kW
Length10.41 m11.89 m
Width3.400 m2.845 m
Height3.270 m4.115 m
Weight29,211 kg28,122 kg
Maximum reach10.54 m-
Maximum feed height-0.890 m
Infeed conveyor-6.110 m × 1.520 m
Table 2. Results of the time study.
Element Operation Pile
SmallMediumLarge
LoadingTime (s)348453127614
Frequency359550802
Avg. (s)9.709.669.49
Std. Dev. (s)5.554.294.56
UnloadingTime (s)311447766848
Frequency383594863
Avg. (s)8.138.047.94
Std. Dev. (s)3.093.002.73
ShakingTime (s)9295201
Frequency141529
Avg. (s)6.576.336.93
Std. Dev. (s)3.082.502.84
WaitingTime (s)47913141875
Frequency297188
Avg. (s)16.5218.5121.31
Std. Dev. (s)18.0619.9519.32
PushingTime (s)101311901316
Frequency132168180
Avg. (s)7.677.087.31
Std. Dev. (s)5.024.837.06
Reorienting or repositioningTime (s)5210566826
Frequency31121
Avg. (s)17.3396.00325.05
Std. Dev. (s)2.31126.17732.85
Loading with movingTime (s)100201284
Frequency132933
Avg. (s)7.696.938.61
Std. Dev. (s)3.822.253.19
Unloading with movingTime (s)185464581
Frequency184756
Avg. (s)10.289.8710.38
Std. Dev. (s)6.955.449.28
Total 851914,40825,545
Table 3. Results of chi-square tests and theoretical formulae of element operation time.
Element OperationChi-Square TestTheoretical Formula 1
χ2dfp-Value
Loading5.41650.367eN(2.140, 0.485)
Unloading10.98550.052eN(2.023, 0.370)
Shaking4.42250.490eN(1.825, 0.383)
Waiting6.31450.277eN(2.625, 0.800)
Pushing10.23850.069eN(1.819, 0.539)
Loading with moving8.35350.138eN(1.987, 0.363)
Unloading with moving8.00950.156eN(2.153, 0.530)
1 N(m, σ) is an operator that generates random normal numbers of which average and standard deviation are m and σ, respectively.
Table 4. Comparison between the monitored and estimated productivities.
PileMonitoredEstimated Productivity
Area of Landing (m2)Amount of Slashes (BDT)Productivity (BDT/PMH0)Calculation FrequencyAvg. ± Std. Dev. (BDT/PMH0)Rate of Avg. Value to Monitored (%)
Small30051.4121.73100021.78 ± 0.70100.2
Medium720122.6630.65100031.17 ± 0.75101.7
Large1050173.7824.49100024.27 ± 0.3899.10

