1. Introduction
Blackwood and other acacia were introduced in Portugal at the beginning of the twentieth century in order to colonize dry and poor sandy soils along the coast. Some of the species are considered as invasive as they are characterized by vigorous tree growth, root sprouting and fire stimulated seed germination. Given the high timber value of
Acacia melanoxylon in its region of origin, a research effort was made to study the wood quality in view of its valorization as a timber species in Europe. For instance, studies were made on heartwood development [
1], density and mechanical properties [
2] as well as on its utilization as raw-material for pulp and paper [
3,
4].
Blackwood is a medium density hardwood presenting basic density ranging between 450 and 850 kg/m
3 [
2]. The density that is usually higher for heartwood will influence the paper properties [
5,
6].
The wood quality of blackwood trees is primarily given by the amount of heartwood, which generally shows a rich brown color and a high natural durability [
7,
8]. Heartwood, which has a high content of extractives, mostly dark-colored and phenolic, impacts negatively on wood chemical pulping [
9], pulp yields, pulp brightness [
10,
11,
12,
13] and affects paper manufacturing [
14,
15,
16]. However, the presence of heartwood color can be a positive detail in furniture. The variation of heartwood and sapwood in
Acacia melanoxylon growth in Portugal showed no significant variation between trees and site [
1].
Knowledge about the influence of heartwood percentage on the properties of the final product is important for stand management and raw material selection in the industry.
Machine learning focuses on the biological learning process and tries to emulate it through algorithms that are able to learn from given data and provide new results. Machine learning techniques have shown to be an effective tool for modelling and predicting natural parameters in different fields. Among the examples in the literature, these techniques were used to evaluate manufactured paper [
17], to obtain the mechanical properties of wood and cork from physical properties [
18,
19,
20], to predict paper properties from its density [
5], to discriminate wood types [
21] and to evaluate tree growth [
22], to name a few.
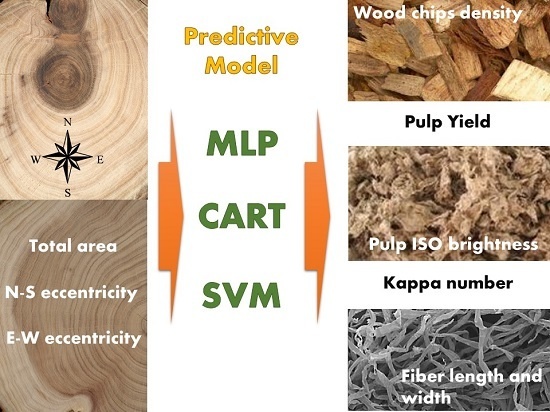
The objective of this work is to develop a tool to predict pulp properties (pulp yield, Kappa number, ISO brightness (ISO 2470:2008), fiber length and fiber width) from characteristics of the raw material such as sapwood and heartwood proportion, stem eccentricity in N-S and E-W directions and the relative position of samples with respect to the total tree height. For this purpose, we first applied classical mathematical techniques (multiple linear regression), and then used different machine learning techniques, namely classification and regression trees (CART), Multi-Layer Perceptron (MLP), which is a particular case of artificial neural networks, and support vector machines (SVM).
2. Materials and Methods
2.1. Dataset
Transversal stem sections of
A. melanoxylon belonging to 20 trees from four sites in Portugal were used—the Camarido National Forest (MNC), at the mouth of Minho River, in the littoral north close to Caminha; the Forest Perimeter of Ovar Dunes (PFDOVM), in the littoral north close to Ovar; the Forest Perimeter of Rebordões de Santa Maria (PFRSM), in the north mid-interior close to Ponte de Lima; and the Forest Perimeter of Crasto Mountain (PFC), in the centre interior close to Viseu [
23]. Selective harvesting was done for a sawn timber with diameter at breast height (
dbh) above 40 cm over-bark, corresponding to a revolution age of about 50 years. Six samples were taken from each tree at different heights: one from the top, one from the bottom, and one from the 65%, 35%, 15% and 5% of the total height of the tree.
The marking out of heartwood was done visually by its color, its area being estimated by the calculation of a circle area, using the mean radius of direct measurements on four geographic exposures of each disc. The tree and heartwood volumes were calculated per stump comprised between the different height levels of the sampling. Conical sections for 0%–5%, 5%–15%, 15%–35%, 35%–65% and 65%–top were considered. The sapwood volume was calculated by the difference of heartwood with respect to total wood, according Rucha et al. [
24].
The samples were subsequently chipped to particles with approximately 50 mm length, 10 mm width and 5 mm thickness, taking care to avoid any knotwood—since their extractive content may influence pulping [
25]—and submitted to conventional Kraft pulping in a forced circulation digester under the following reaction conditions: active alkali charge 21.3% (as NaOH); sulfidity index 30%; liquor/wood ratio 4/1; time to temperature 90 min; time at temperature (160 °C) 90 min. Experiments were carried out with 25 g (oven dry) of wood, as reported in Santos et al. [
6].
For each sample, the following parameters were gathered: position of the samples with respect to the relative height (%), total tree height (m), absolute height of the sample (m), tree diameter at different heights (cm), stem eccentricity in N-S and E-W directions (cm), sapwood and heartwood proportion and total area (cm
2) according to [
23]. Also, density (kg/m
3) of the wood chips was measured [
26]. The pulp was characterized by measuring pulp yield (%), Kappa number, ISO brightness (%), fiber length (mm) and fiber width (μm) according Santos et al. [
6].
2.2. Classical Techniques: Multiple Linear Regression
In a multiple linear regression model, two or more explanatory variables relate to a single response variable by means of an adjusted linear function,
where
represents the estimated response of
[
27,
28]. The similarity of the prediction method is maximized with the least squares method and the correlation coefficient is defined as
being
the variance of
Y.
2.3. Machine Learning Techniques: CART
Classification and regression trees (CART) are defined as a non-parametric model that is able to explain the response of a dependent variable given a set of independent variables [
29]. The process is based on the creation of subgroups from the initial input data, then analyzing their variance and minimizing this parameter until they are homogeneous.
The prediction of pulp properties was tackled as a regression problem, so the regression trees defined were optimized using mean-squared error (MSE).
Depending on the type of problem (regression or classification), different algorithms can be used to minimize the variance of the subgroups: (MSE) for regression trees, towing rule, cross entropy or Gini’s diversity index for classification trees [
30].
2.4. Machine Learning Techniques: MLP
Artificial neural networks (ANNs) emulate the natural connections between our neurons and how they process information. The structure of multilayer perceptron (MLP) is based on layers (input, intermediate or hidden and output) formed by perceptions that are not back propagated, connected by activation functions and weights that are adjusted by training the algorithm until the best output is obtained [
31].
Hence, an ANN can be defined by (1) how its layers are interconnected; (2) how its weights are updated, i.e., how it learns; (3) how the activation function converts input neurons into their output [
31,
32].
The training of the network was completed with a 10-fold cross-validation process that guaranteed that all the data were used as training data and as testing data to optimize the weights.
2.5. Machine Learning Techniques: SVM
Since Cortes and Vapnik introduced a new methodology to approach binary classification problems [
33], support vector machines (SVM) have become an important machine learning technique for pattern recognition problems due to the global optimum character, parsimony and flexibility [
34]. This method is based on finding an optimal separating hyperplane able to classify the observations of an initial input space into a certain number of classes, which are at maximum distance from each other. However, SVM have also been applied to regression problems, usually renamed as support vector regression (SVR) [
35,
36].
2.6. Predictive Model: Input and Output Data
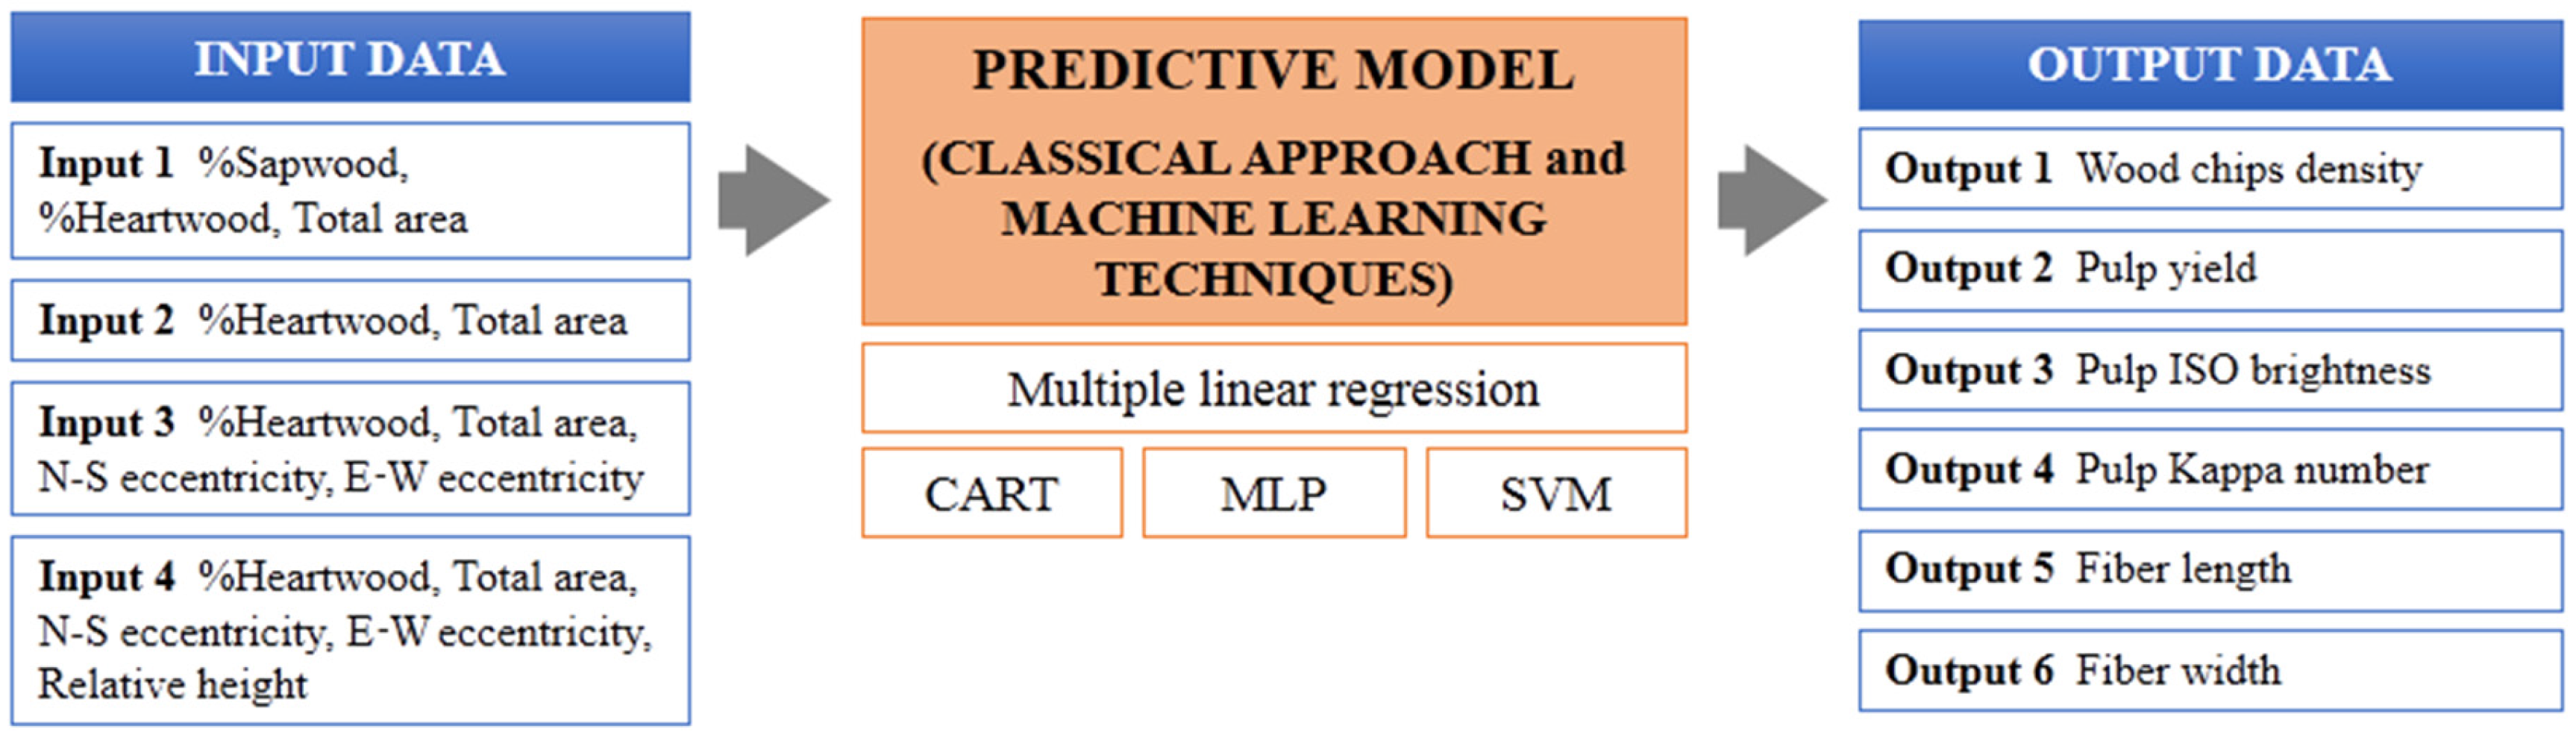
The predictive model defined in this paper consists of some input variables used to obtain other output variables (the desired prediction results) by means of the selected machine learning technique (
Figure 1).
The problem was approached as a regression problem, where a numeric output is given. Several input sets were tested in order to find the most suitable input data for the model:
Input 1: sapwood in the wood discs (%), heartwood in the wood discs (%), total area of the wood discs (cm2);
Input 2: heartwood in the wood discs (%), total area of the wood discs (cm2);
Input 3: heartwood in the wood discs (%), total area of the wood discs (cm2), stem eccentricity in N-S direction (cm), stem eccentricity in E-W direction (cm);
Input 4: heartwood in the wood discs (%), total area of the wood discs (cm2), stem eccentricity in N-S direction (cm), stem eccentricity in E-W direction (cm), relative position of the samples with respect to the total tree height (m).
The relevance of input variables was studied by means of PCA, whose results will be discussed in the corresponding section.
Regarding the output variables, the prediction of the following properties was assessed:
Output 1: density of wood chips (kg/m3);
Output 2: pulp yield (%);
Output 3: pulp ISO brightness (%);
Output 4: Kappa number of the pulp;
Output 5: fiber length (mm);
Output 6: fiber width (μm).
3. Results
The basic statistic parameters of the selected samples used as input variables to obtain other output variables with the machine learning technique are reported in
Table 1, while
Table 2 contains a summary of the results.
PCA analysis was performed in order to study the relevance of the variables of each input set. Since these variables belong to different properties and magnitudes, they were standardized before performing PCA. The results regarding the total variance explained by each principal component are included in
Table 3.
The performance of the predictive models was assessed by means of their Pearson’s correlation coefficient (R). Furthermore, root mean square error (RMSE) was also considered to assess CART, MLP and SVM predictive models. It gives the standard deviation of the model prediction error, so the smaller its value, the better the model performance is. Regarding multiple linear regression results, R2 was obtained.
Table 4 shows in more detail the performance of CART models for the different inputs and outputs.
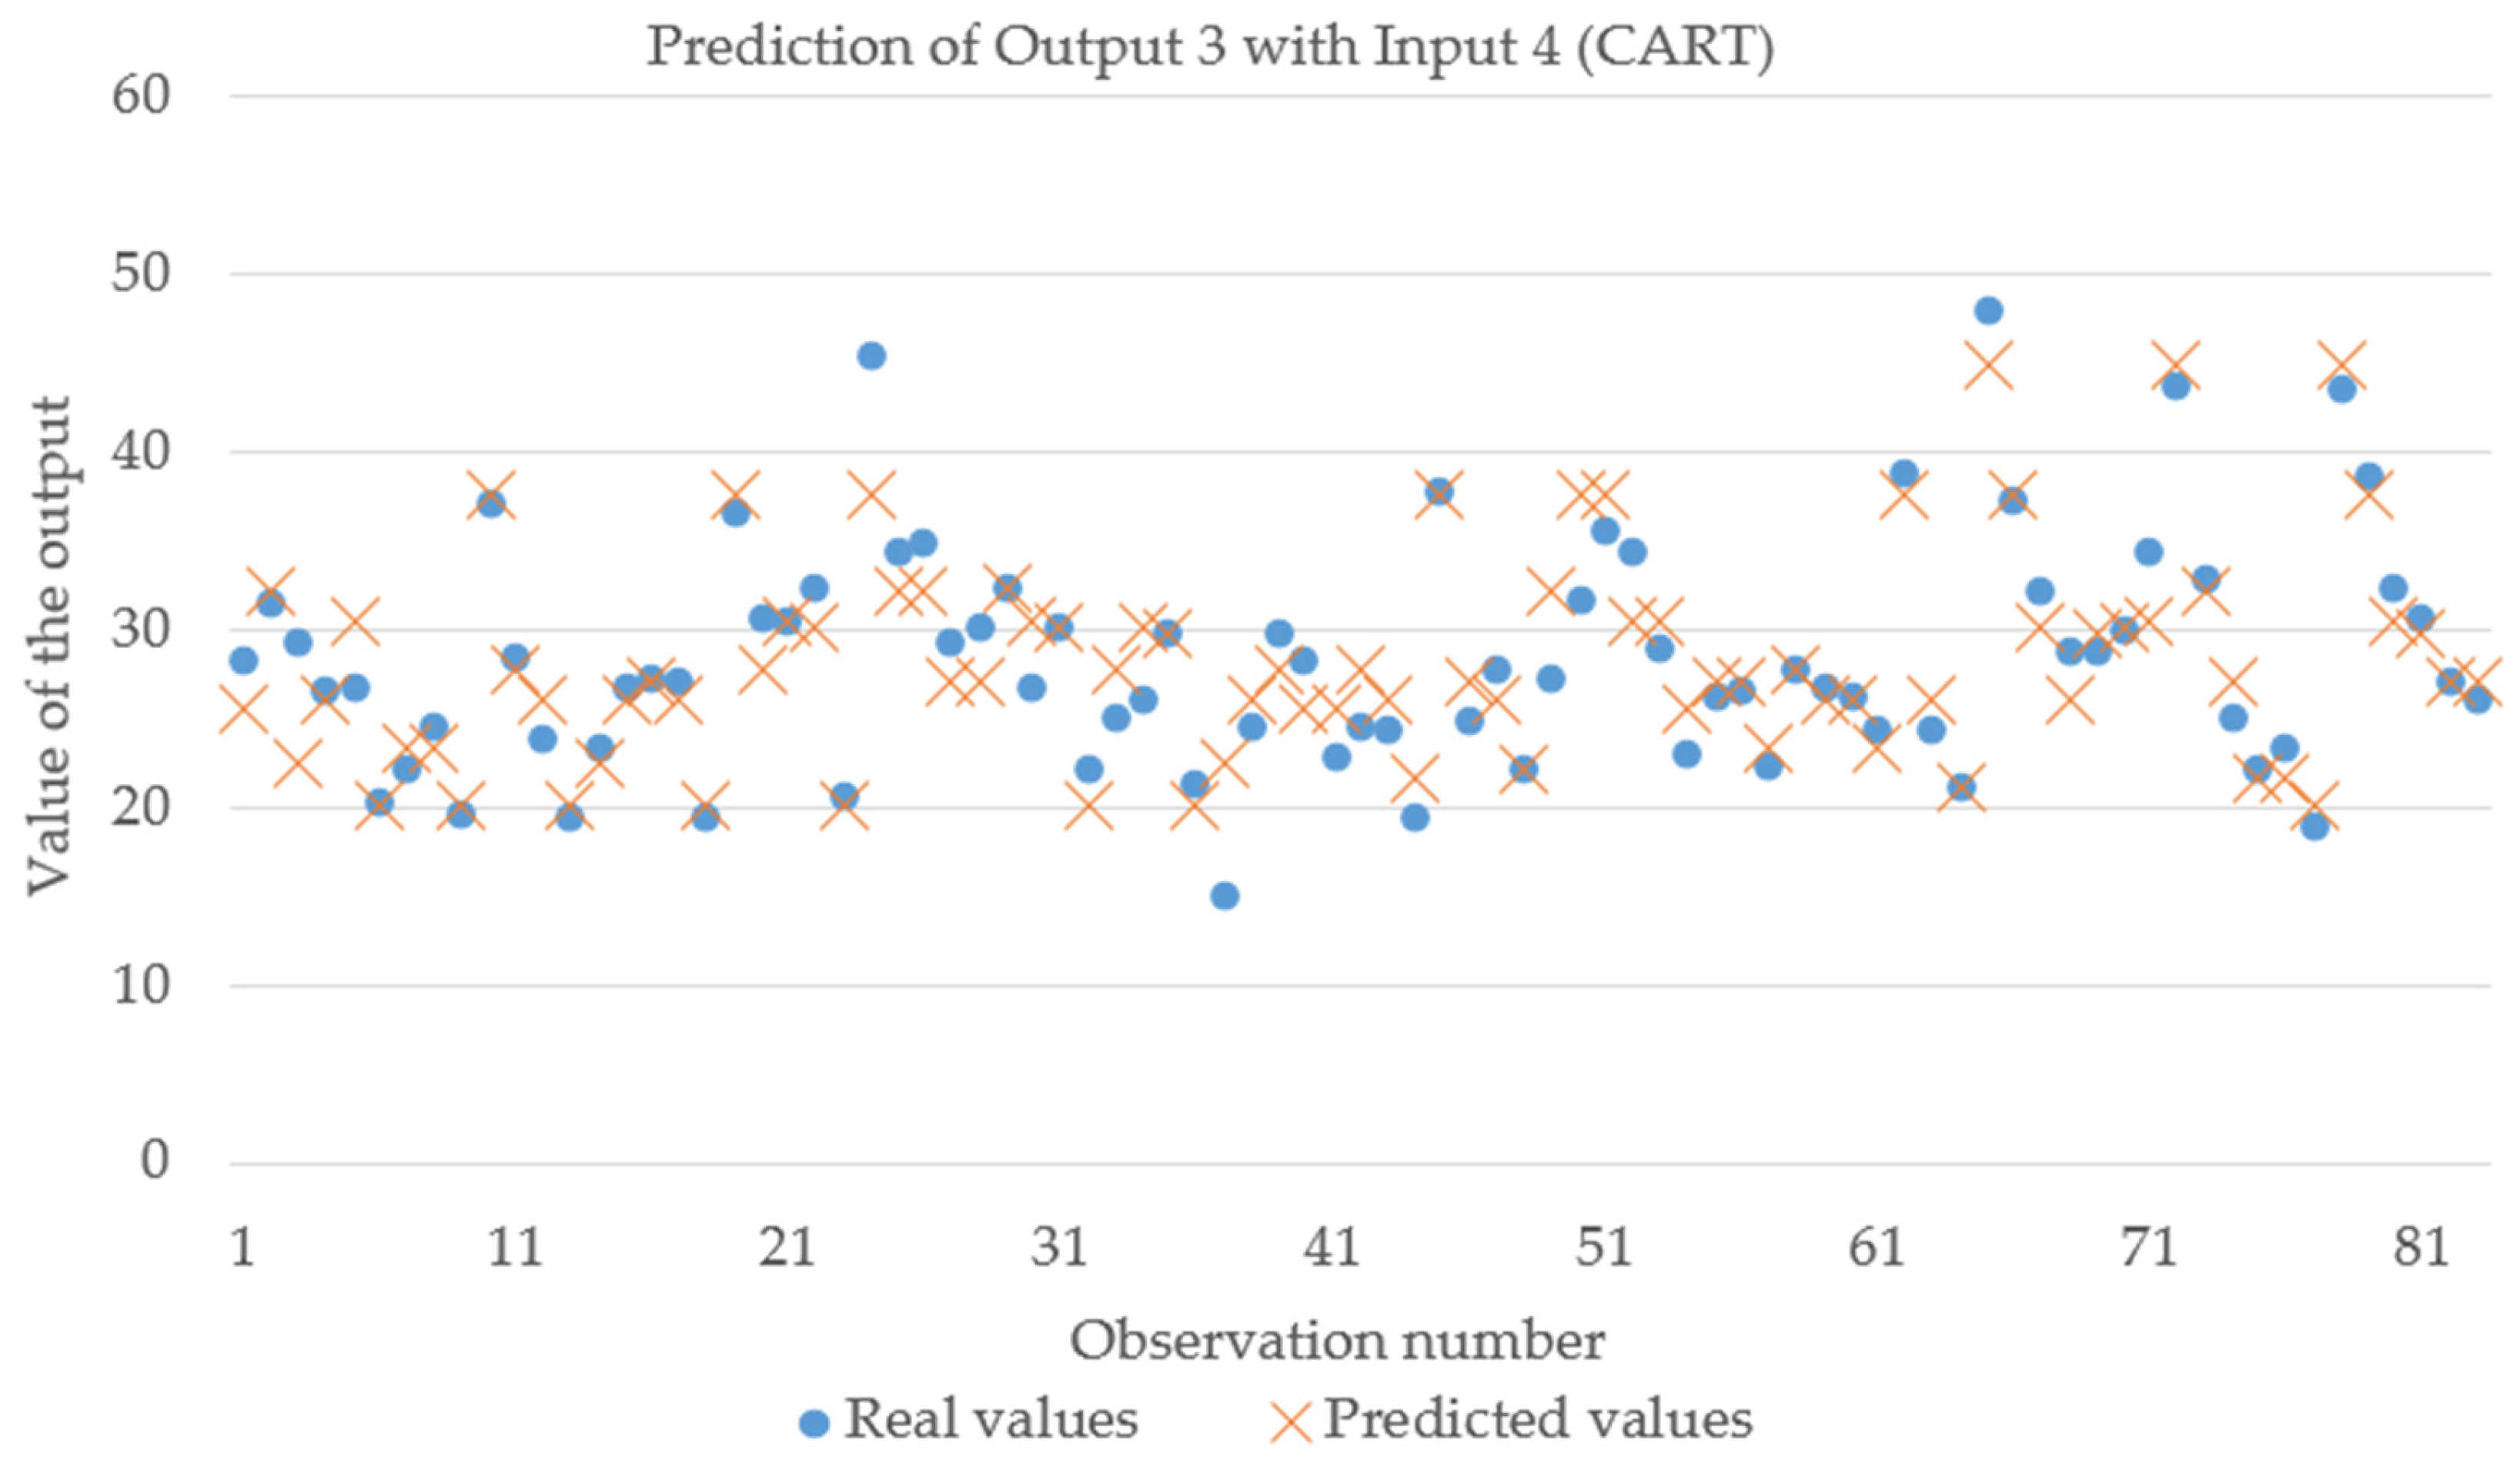
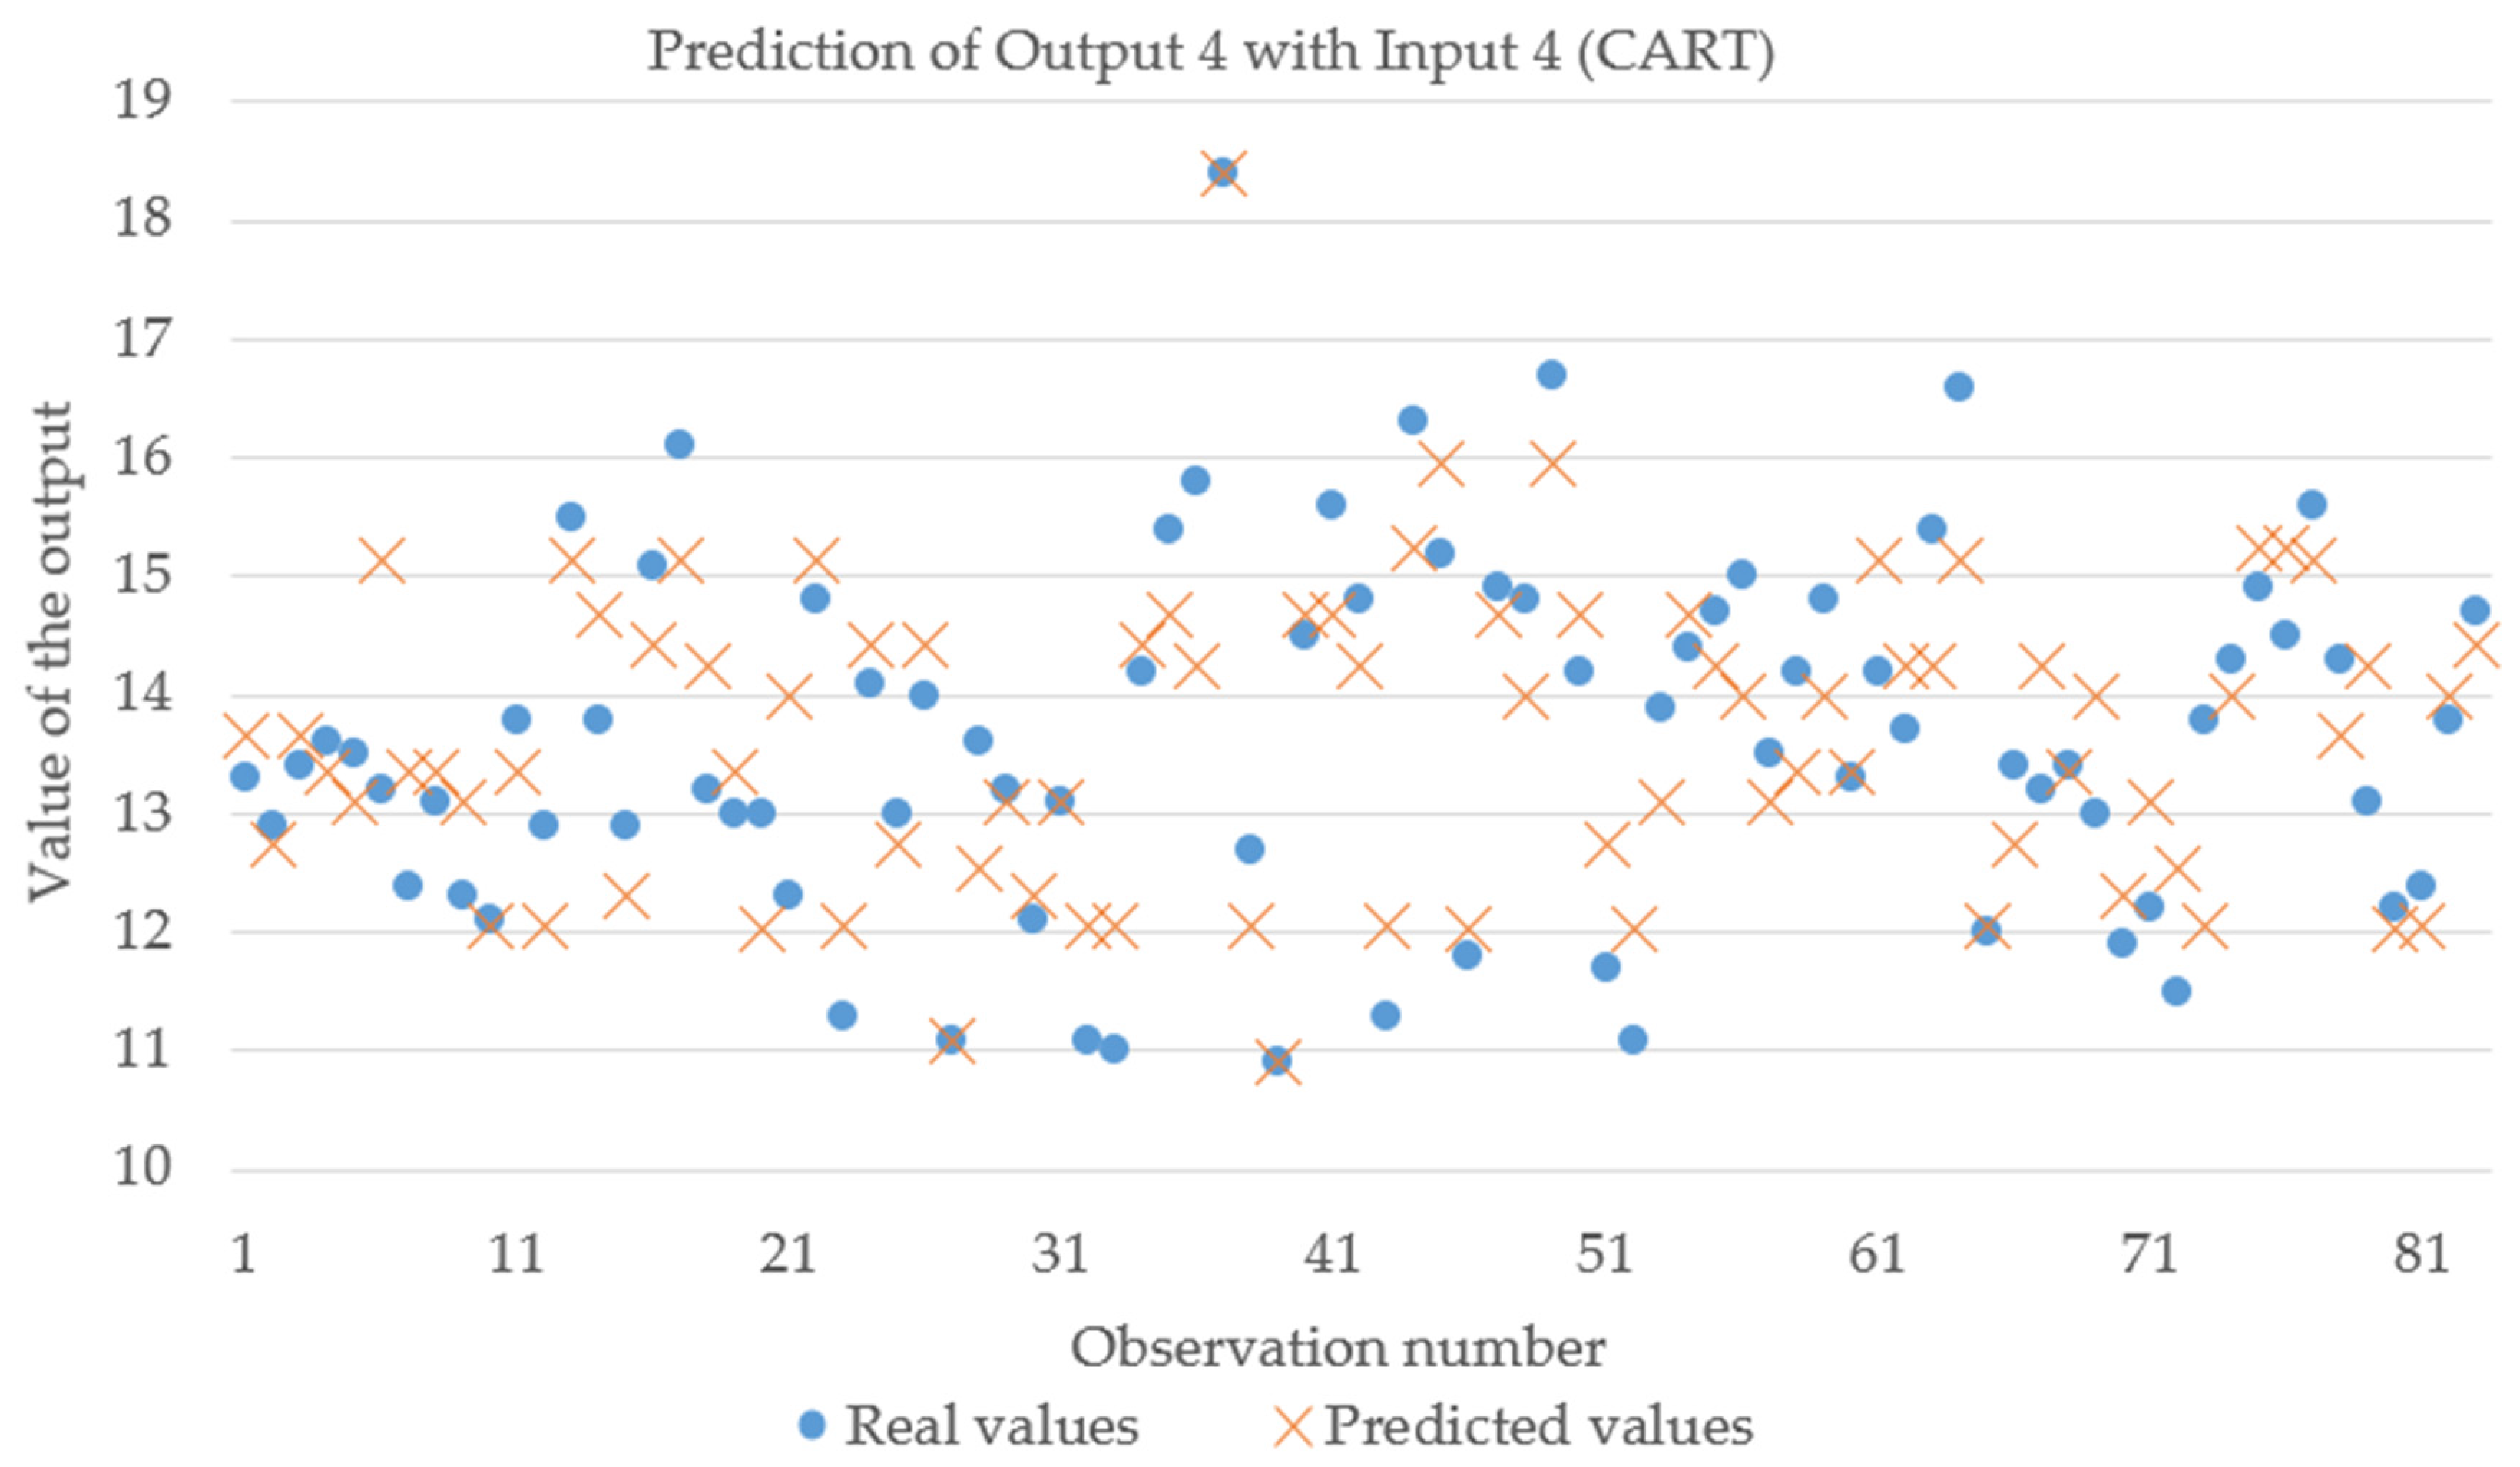
Figure 2 and
Figure 3 display the real and predicted values for Output 3 and Output 4, respectively, when obtained by means of the trained CART from Input 4.
4. Discussion
PCA analysis provides valuable information regarding the role played by each variable in the predictive model (
Table 3). The four input sets were studied and their principal components show the following: regarding Input 1, there is a linear dependence between two of the variables (quite obvious, since % Sapwood and % Heartwood make 100%). The remaining Input sets do not show a linear dependence between their variables and none of them could be removed without losing a considerable amount of information.
According to the results obtained, multiple linear regression turned out not to be appropriate for the given data when the input was Input 2, Input 3 or Input 4 since the resulting R2 statistic was negative. When Input 1 was used, multiple linear regression performed poorly whatever the output was, with Output 3 showing the highest R2 = 0.46. These results are coherent with PCA analysis. Furthermore, given the complexity of the data, results of multiple linear regression with Inputs 2, 3 and 4 are proof of the non-linear relationship among the variables considered. Bearing this in mind, machine learning techniques were applied to the problem.
Among the machine learning techniques tested, MLP and SVM performed similarly: poor results were obtained regardless of the input and output, as shown in
Table 2. This fact could be explained by the limited number of input variables and observations available, since they usually perform well with considerable databases [
37].
Based on our results, CART is the technique that best predicts wood pulp properties, better than multiple linear regression, MLP and SVM. All the output variables tested showed higher correlation coefficients and lower RMSE values when they were obtained through CART models, regardless of the input parameters (
Table 4). Pulp ISO brightness gave the best results (
R = 0.85, RMSE = 2.425), followed by Kappa number (
R = 0.74, RMSE = 0.758), whereas the remaining properties (wood chips density, pulp yield, fiber length and fiber width) had similar results (
R = 0.64–0.68 and RMSE consistent with the dispersion of data). Furthermore, the results show that Input 3 and Input 4 perform better in general terms than Input 1 and 2, which is in accordance with PCA results that indicated the distributed importance of the variables.
No models were found in the literature to predict these output variables with these input variables. However, other models with similar Pearson’s correlation coefficients were found for wood quality prediction. Fritz et al. [
38] used structure-from-motion with multi-view stereo-photogrammetry and obtained a
R = 0.70, to estimate the stem radius of oak (
Quercus robur), hornbeam (
Carpinus betulus), and maple (
Acer pseudoplatanus) trees. Knapic and Pereira [
39] found significant positive correlations for heartwood diameter with tree diameter at breast height (
R = 0.63).
Furthermore, CART provides valuable information regarding the influence of the different input parameters, since the structure of the tree represents the regression process until the result is reached [
29]. Stem eccentricity in both N-S and E-W directions showed up as an important input parameter for an accurate prediction of all the output variables. It is also the case of the relative position of the samples with respect to the total tree height, which is included in the Input 4 configuration that gave the most accurate results for five of the six outputs predicted.
Stem eccentricity is frequently linked to the presence of reaction wood that is produced on inclined trunks or branches. Depending on reaction wood proportion, the wood properties could be affected to a greater or lesser extent. The eccentricity of a log strongly influences timber processing and the yield of wood components. Tension wood i.e., reaction wood in hardwoods, produces paper with inferior strength properties (namely tensile index, brust index and tear index) in comparison to normal wood, given the differences in the morphologic ultra-structure [
40].
5. Conclusions
This research work focuses on predicting pulp properties from raw-material characteristics, testing the suitability and applicability of different mathematical techniques to correlate the available data and obtain the density of wood chips, pulp yield, Kappa number of the pulp, pulp ISO brightness and fiber length and width.
A classical mathematical approach, namely multiple linear regression, as well as machine learning techniques, namely CART, MLP and SVM, were used for this purpose. CART has been shown as the most appropriate technique to predict pulp properties among the four tested. The poor results of the remaining techniques can be due to the limited database and the heterogeneity of the data, thus being difficult to model. The pulp properties best predicted were ISO brightness and Kappa number, which could be modelled reasonably well by means of CART.
Taking advantage of CART structure, the influence of the different input parameters could be analyzed. Thereby, stem eccentricity, an indicator of the presence of reaction wood, was shown to influence the strength of the final paper products due to the resultant differences in the morphologic ultra-structure.
This kind of study provides valuable information to correct or prevent undesirable properties in the final products, as well as highlighting the existing relationships between the different variables of the process.
Acknowledgments
The first author acknowledges the Spanish Ministry of Education, Culture and Sport [grant number FPU 12/02283 to C.I.]. The second author acknowledges a scholarship (SFRH/BD/42073/2007) given by Fundação para a Ciência e a Tecnologia (FCT), Portugal. Centro de Estudos Florestais is a research unit funded by FCT (UID/AGR/UI0239/2013).
Author Contributions
A.J.A.S., H.P. and O.A. conceived and designed the experiments; A.J.A.S., and O.A. performed the experiments; C.I. and J.M. analyzed the data; A.J.A.S., C.I., O.A. and H.P. wrote the paper.
Conflicts of Interest
The authors declare no conflict of interest. The founding sponsors had no role in the design of the study; in the collection, analyses, or interpretation of data; in the writing of the manuscript, and in the decision to publish the results.
References
- Knapic, S.; Tavares, M.; Pereira, H. Heartwood and sapwood variation in Acacia melanoxylon R. Br. trees in Portugal. Forestry 2006, 79, 371–380. [Google Scholar] [CrossRef]
- Machado, J.S.; Louzada, J.L.; Santos, A.J.A.; Nunes, L.; Anjos, O.; Rodrigues, J.; Simões, R.M.S.; Pereira, H. Variation of wood density and mechanical properties of blackwood (Acacia melanoxylon R. Br.). Mater. Des. 2014, 56, 975–980. [Google Scholar] [CrossRef]
- Anjos, O.M.S.; Santos, A.J.A.; Simões, R.M.S. Effect of Acacia melanoxylon fibre morphology on papermaking potential. Appita J. 2011, 64, 185–191. [Google Scholar]
- Santos, A.J.A.; Anjos, O.; Simões, R.M.S. Paper making potencial of Acacia. Appita J. 2006, 59, 58–64. [Google Scholar]
- Anjos, O.; García-Gonzalo, E.; Santos, A.J.A.; Simões, R.; Martínez-Torres, J.; Pereira, H.; García-Nieto, P. Using Apparent Density of Paper from Hardwood Kraft Pulps to Predict Sheet Properties, based on Unsupervised Classification and Multivariable Regression Techniques. BioResources 2015, 10, 5920–5931. [Google Scholar] [CrossRef]
- Santos, A.J.A.; Anjos, O.; Amaral, M.E.; Gil, N.; Pereira, H.; Simões, R. Influence on pulping yield and pulp properties of wood density of Acacia melanoxylon. J. Wood Sci. 2012, 58, 479–486. [Google Scholar] [CrossRef]
- Harrison, C.M. Heartwood content patterns in Acacia melanoxylon in the southern cape. For. S. Afr. 1974, 15, 31–34. [Google Scholar]
- Villaverde, J.J.; De Vega, A.; Ligero, P.; Freire, C.S.R.; Pascoal Neto, C.; Silvestre, A.J.D. Miscanthus x giganteus bark organosolv fractionation: Fate of lipophilic components and formation of valuable phenolic byproducts. J. Agric. Food Chem. 2010, 58, 8279–8285. [Google Scholar] [CrossRef] [PubMed]
- Miranda, I.; Gominho, J.; Lourenço, A.; Pereira, H. Heartwood, extractives and pulp yield of three Eucalyptus globulus clones grown in two sites. Appita J. 2007, 60, 485–500. [Google Scholar]
- Higgins, G. Pulp and paper. In Eucalyptus for Wood Production; Hillis, W.E., Brown, A.G., Eds.; CSIRO/Academic Press: Melbourne, Australia, 1984; pp. 290–316. [Google Scholar]
- Santos, A.J.A.; Anjos, O.; Pereira, H. Estimation of Acacia melanoxylon unbleached Kraft pulp brightness by NIR spectroscopy. For. Syst. 2015, 24, eRC03. [Google Scholar] [CrossRef]
- Santos, A.J.A.; Anjos, O.; Pereira, H. Prediction of blackwood Kraft pulps yields with wood NIR–PLSR models. Wood Sci. Technol. 2016, 50, 1307–1322. [Google Scholar] [CrossRef]
- Domingues, R.M.A.; Patinha, D.J.S.; Sousa, G.D.A.; Villaverde, J.J.; Silva, C.M.; Freire, C.S.R.; Silvestre, A.J.D.; Pascoal Neto, C. Eucalyptus biomass residues from agro-forest and pulping industries as sources of high-value triterpenic compounds. Cellul. Chem. Technol. 2011, 45, 475–481. [Google Scholar]
- Hillis, W.E. Wood Extractives and Their Significances to the Pulp and Paper Industries; Academic Press: London, UK; New York, NY, USA, 1962. [Google Scholar]
- Pereira, H.; Santos, A.J.A.; Anjos, O. Fibre Morphological Characteristics of Kraft Pulps of Acacia melanoxylon Estimated by NIR-PLS-R Models. Materials 2016, 9, 8. [Google Scholar] [CrossRef]
- Santos, A.J.A.; Anjos, O.; Simões, R.; Rodrigues, J.; Pereira, H. Kappa number prediction of Acacia melanoxylon unbleached kraft pulps using NIR-PLSR models with a narrow interval of variation. BioResources 2014, 9, 6735–6744. [Google Scholar] [CrossRef]
- García Nieto, P.J.; Martínez Torres, J.; de Cos Juez, F.J.; Sánchez Lasheras, F. Using multivariate adaptive regression splines and multilayer perceptron networks to evaluate paper manufactured using Eucalyptus globulus. Appl. Math. Comput. 2012, 219, 755–763. [Google Scholar] [CrossRef]
- García, Á.; Anjos, O.; Iglesias, C.; Pereira, H.; Martínez, J.; Taboada, J. Prediction of mechanical strength of cork under compression using machine learning techniques. Mater. Des. 2015, 82, 304–311. [Google Scholar] [CrossRef]
- Iglesias, C.; Anjos, O.; Martínez, J.; Pereira, H.; Taboada, J. Prediction of tension properties of cork from its physical properties using neural networks. Eur. J. Wood Wood Prod. 2015, 73, 347–356. [Google Scholar] [CrossRef]
- Tiryaki, S.; Özşahin, Ş.; Yıldırım, İ. Comparison of artificial neural network and multiple linear regression models to predict optimum bonding strength of heat treated woods. Int. J. Adhes. Adhes. 2014, 55, 29–36. [Google Scholar] [CrossRef]
- Turhan, K.; Serdar, B. Support vector machines in wood identification: The case of three Salix species from Turkey. Turk. J. Agric. For. 2013, 37, 249–256. [Google Scholar]
- Görgens, E.B.; Montaghi, A.; Rodriguez, L.C.E. A performance comparison of machine learning methods to estimate the fast-growing forest plantation yield based on laser scanning metrics. Comput. Electron. Agric. 2015, 116, 221–227. [Google Scholar] [CrossRef]
- Santos, A.J.A.; Simões, R.; Tavares, M. Variation of some wood macroscopic properties along the stem of Acacia melanoxylon R. Br. adult trees in Portugal. For. Syst. 2013, 22, 463–470. [Google Scholar] [CrossRef]
- Rucha, A.; Santos, A.J.A.; Campos, J.; Anjos, O.; Tavares, M. Two methods for tree volume estimation of Acacia melanoxylon in Portugal. Floresta 2011, 41, 169–178. [Google Scholar] [CrossRef]
- Pietarinen, S.P.; Willför, S.M.; Ahotupa, M.O.; Hemming, J.E.; Holmbom, B.R. Knotwood and bark extracts: Strong antioxidants from waste materials. J. Wood Sci. 2006, 52, 436–444. [Google Scholar] [CrossRef]
- Santos, A.J.A.; Alves, A.; Rogério, S.; Pereira, H.; Rodrigues, J.; Schwanninger, M. Estimation of wood basic density of Acacia melanoxylon (R. Br.) by near infrared spectroscopy. J. Near Infrared Spectrosc. 2012, 2, 267–274. [Google Scholar] [CrossRef]
- Neter, J.; Kutner, M.; Nachtsheim, C.; Wasserman, W. Applied Linear Statistical Models; The McGraw-Hill Companies, Inc.: Boston, MA, USA, 1996. [Google Scholar]
- Seber, G. Linear Regression Analysis; John Wiley and Sons, Inc.: New York, NY, USA, 1977. [Google Scholar]
- Breiman, L.; Friedman, J.; Stone, C.J.; Olshen, R.A. Classification and Regression Trees; Wadsworth Inc.: Belmont, Australia, 1984. [Google Scholar]
- Brown, S.D.; Myles, A.J. Decision Tree Modeling in Classification. In Reference Module in Chemistry, Molecular Sciences and Chemical Engineering; Elsevier: Oxford, UK, 2013. [Google Scholar]
- Bishop, C.M. Neural Networks for Pattern Recognition; Oxford University Press: New York, NY, USA, 2008. [Google Scholar]
- Heaton, J. Introduction to the Math of Neural Networks; Heaton Research: New York, NY, USA, 2012. [Google Scholar]
- Cortes, C.; Vapnik, V. Support-vector networks. Mach. Learn. 1995, 20, 273–297. [Google Scholar] [CrossRef]
- Burges, C.J.C. A tutorial on support vector machines for pattern recognition. Data Min. Knowl. Discov. 1998, 2, 121–167. [Google Scholar] [CrossRef]
- Smola, A.J.; Schölkopf, B. A tutorial on support vector regression. Stat. Comput. 2004, 14, 199–222. [Google Scholar] [CrossRef]
- Fletcher, R. Practical Methods of Optimization; John Wiley & Sons, Inc.: New York, NY, USA, 1989. [Google Scholar]
- Iglesias, C.; Martínez Torres, J.; García Nieto, P.J.; Alonso Fernández, J.R.; Díaz Muñiz, C.; Piñeiro, J.I.; Taboada, J. Turbidity Prediction in a River Basin by Using Artificial Neural Networks: A Case Study in Northern Spain. Water Resour. Manag. 2014, 28, 319–331. [Google Scholar] [CrossRef]
- Fritz, A.; Kattenborn, T.; Koch, B. UAV-based photogrammetric point clouds—Tree stem mapping in open stands in comparison to terrestrial laser scannerpoint clouds. Int. Arch. Photogramm. Remote Sens. Spat. Inf. Sci. ISPRS 2013, XL-1/W2, 141–146. [Google Scholar] [CrossRef]
- Knapic, S.; Pereira, H. Within-tree variation of heartwood and ring width in maritime pine (Pinus pinaster Ait.). For. Ecol. Manag. 2005, 210, 81–89. [Google Scholar] [CrossRef]
- Parham, R.A.; Robinson, K.W.; Isebrands, J.G. Effects of tension wood on kraft paper from a short-rotation hardwood (Populus Tristis No. 1). Wood Sci. Technol. 1977, 11, 291–303. [Google Scholar] [CrossRef]
© 2017 by the authors; licensee MDPI, Basel, Switzerland. This article is an open access article distributed under the terms and conditions of the Creative Commons Attribution (CC-BY) license (http://creativecommons.org/licenses/by/4.0/).


 ,
, 

