1. Introduction
Along with urban greening the interest in tree growth rapidly increased during recent decades. On the one hand, it can be explained by the fact that trees provide many ecosystem services and functions, like cooling the environment, filtering harmful particulate matter from the air, and having aesthetical and structural functions within build-up areas [
1,
2]. On the other hand, several disservices of urban trees exist, like litter fall, damage to foot paths, and fallen branches which cause additional costs [
1,
3,
4] and can endanger the public’s safety.
Due to the benefits and disadvantages, the growth of urban trees and its space requirements are of high interest for urban planners and managers, as well as for arborculturists. First, it is important to know the future space requirements for the existing trees at a certain age. Second, for future planning the growing space requirements can be crucial for the choice of tree species before planting at a certain place [
5]. Lastly, information on allometric relationships of urban trees is essential for the treatment measures of arborculturists for ensuring public safety. While there are several studies on forest trees, the space development of urban trees (solitary and open grown trees) is rarely known. Only a few studies [
6,
7] have investigated the differences in allometry and biomass between forest and urban trees. Our study aims at generating knowledge for urban trees by analyzing the space requirements, growth dynamics, and allometry of urban trees.
Taking a deeper look at the benefits, one major benefit of urban trees is their carbon sequestration. The carbon storage capacity in turn is species-specific as Moser
et al. [
8], for example, showed for
Robinia pseudoacacia and
Tilia cordata in two German cities. They found a storage capacity of 461 kg C per tree for
Robinia pseudoacacia (mean age: 39 years) and with 196 kg C a remarkable lower storage capacity for
Tilia cordata (mean age: 41 years). Yoon
et al. [
9] estimated 24.9 t of total average C storage for the tree species
Acer buergerianum, Ginkgo biloba, Prunus yedoensis, and
Zelkova serrata in Daegu, Korea, and 69.7 t C ha
−1 for
Platanus orientalis.
A key variable for space occupation is the crown size. Species-specific crown projection areas were found by Pretzsch
et al. [
10] while analyzing the growing space requirements of 22 tree species worldwide. They focused on crown size parameters and determined five different crown extension types. Large crown expansions, crown sizes, and tree heights result in higher service functions such as shading and filtering particulates. The dimensions of the crown are responsible for shading and cooling, two of the most important ecosystem services of trees in urban areas. They play an important role not only on a tree scale, cooling down the microclimate, but also on a street scale. This means that through shading, trees can increase human thermal comfort [
11]. Further, on the city scale this service can reduce the urban heat island effect [
4]. Additionally, the shading of street trees can reduce the maintenance costs for streets by protecting the asphalt from solar radiation. McPherson and Muchnick [
3] report an extended lifetime of 10 to 25 years for road and pavement surfaces in California that are highly shaded in comparison to those that are not shaded.
A further benefit at all three aforementioned scales is the reduction of water runoff. Besides tree number, increasing tree and crown dimension also reduces water runoff due to higher evapotranspiration and interception rates. This reduction in the amount of runoff is species-specific [
4,
12,
13] and might also reduce stormwater runoff [
14,
15].
While the studies mentioned above show that trees have many benefits, the related space requirements of urban trees are a potential conflict. On the one hand, space in urban areas is limited and therefore expensive. On the other hand, open space is essential for housing prices, especially close to the city center [
16]. Thus, knowing the space requirements of certain tree species is of high interest for urban planning. As tree growth is species-specific, the growth rate and the spatial dimensions of different tree species in dependence on tree age could be essential information for urban planning. While the growth behavior (
i.e., the crown radius, diameter at breast height or tree height) is well known for forest stands, little is known for solitary urban trees [
17]. Studies have shown that information about growth dynamics of trees from forest stands cannot be directly transferred to urban trees [
6]. This is due to the fact that in urban areas mainly mechanical stresses outweigh effects in forest stands, such as competition between trees or forest management measures [
18].
The discussion about space requirements of trees in urban areas is not only relevant for the aboveground tree structure, but also for the rooting zone. The root growth is influenced by the available soil fraction, soil compaction, and the volume of root-penetrable soil [
2]. Further, the effects of soil compaction, reduced soil volume, and paved surface are investigated in several studies [
18,
19]. If the soil volume is becoming too shallow, with time the roots start uplifting and cracking the pavement [
20]. This in turn causes high costs for road or pavement maintenance, which is reported to be one of the first reasons for removing trees in urban areas [
21].
In summary, while there are several studies dealing with space requirements of trees [
10,
22,
23], the present study differs from the existing studies as it (1) is specific to urban trees; and (2) investigates the space requirements for six different tree species worldwide; and (3) provides a data set for each tree species representing the temporal dynamic of the tree structure. It is important to state that we do not see this study as a species comparison in the usual sense, which would not be possible with our data. Rather, we intend to compare different urban tree species, each under conditions where it can be considered to be typical and highly adapted. Based on the analyses, conclusions for space requirements of existing and planned tress, as well as conclusions on the potential benefits of urban trees, can be drawn. This leads to the following research questions:
- (1)
Is there a relationship between space limitations of typical urban tree species (in the sense mentioned above) and allometric relationships?
- (2)
Does soil sealing limit the growth of urban trees?
- (3)
How do typical urban tree species (in the sense mentioned above) differ in terms of aboveground biomass and carbon storage?
2. Materials and Methods
2.1. Data Acquisition
For this study we used data from urban trees that were collected in six metropolises worldwide. The data are a subset from samples acquired in the overarching project Response of Urban Trees on Climate Change funded by the AUDI Environmental Foundation. The field campaigns took place between October 2010 and June 2014 in the cities of Berlin, Brisbane, Hanoi, Houston, Munich, and Paris. Altogether, our data comprise 1097 trees, with an average of 183 trees per city, with a minimum of 126 (Brisbane) and a maximum of 240 trees (Berlin). In each city the most common local urban tree species was chosen. While the overarching project included trees in the city centers, suburban zones, and in rural outskirts, only the former were selected for the study at hand.
Selecting criteria for sample trees were: (1) health; and (2) that the trees were not pruned. An overview of the selected cities and species is given in
Table 1.
For each tree, diameter increment time series are available from two increment cores taken from orthogonal directions at breast height. As the tree diameter
d was measured, the diameter time series could be reconstructed backwards. Additional information about the sampling is described in Pretzsch
et al. [
10]. In the study at hand we transformed the diameter time series into basal area (
ba) and basal area increment (
iba) time series, because in contrast to diameter increment, basal area increment is directly related to a tree’s biological production [
24] and thus more appropriate for the allometric analyses shown below. Total tree height (
h) and height to crown base (
hcb) are also available, together with crown radii (
r) measured in the eight cardinal and sub-cardinal directions, as suggested by Preuhsler [
25]. The mean crown radius (
cr) was calculated as the quadratic mean of these eight crown radii in Equation (1).
Based on the mean crown radius, the crown projection area is then given by the following Equation (2), ensuring a bias-free transition between crown radius to crown projection area.
Moreover, tree height and height to crown base (cb) were recorded by using a Vertex IV ultrasonic hypsometer.
In order to quantify a tree’s spatial confinement by soil sealing like asphalted pavement or concrete surfaces, the unsealed area around the stem base was measured for each tree in four cardinal directions with a measuring tape. We used this information for calculating the variable
SCON, which expresses the degree of confinement due to soil sealing. It is calculated as follows in Equation (3):
where
cpa is the crown projection area (m
2) and
npa is the measured non-paved area (m
2).
Table 2 gives an overview of the tree characteristics covered by our data.
A. cunninghamii covers the broadest diameter range (15.7–129.5 cm) and the largest diameter was measured for
P. x hispanica with 144 cm. The largest maximum
cr with 14.8 m was also measured for
P. x hispanica. The tallest tree was of the species
K. senegalensis with 36 m, and this species also showed the highest range for ring widths.
A. hippocastanum (232 years) and
P. x hispanica (234 years) covered the largest age range within our sampled trees.
Npa was largest for
A. cunninghamii with 410 m
2, and smallest for
T. cordata,
A. hippocastanum, and
K. senegalensis with 0.5 to 100 m
2.
2.2. Allometric Analyses
Plant allometry is a concept that is used in this study to relate tree dimensions to each other as well as to relate plant size and increment. It has a strong theoretical foundation [
26,
27,
28] which, together with its mathematical compactness, makes it a powerful tool for applications in science and practice [
22]. It is very common to use the double-logarithmic form of the allometric equation, especially in empirical study, because it makes the relation between two plant variables
x and
y, say
x = stem diameter,
y = height, accessible to linear regression models (Equation (4)):
Here, the constants c and
are the allometric scaling coefficient and the allometric factor, respectively. Embedded in this context, the backbone of our analyses is a linear mixed effects model (Equation (5)), which describes the allometric relationship between the annual basal area increment
iba (cm
2/y) and the corresponding basal area
ba (cm
2) at the beginning of the corresponding year.
This model was fitted to the retrospective tree growth data of each city separately. The indexes i and j represent the jth observation of the ith tree, β0 and β1 are fixed effect parameters, bi is a random effect on tree level with , and εij are i.i.d. errors.
In order to estimate the influence of spatial restriction on basal area increment we extended this model to Equation (6) by including the variable
SCON which describes the confinement of a tree’s growing area by soil sealing as defined in Equation (3) above.
When fitting this model, we restricted the tree growth data to the years after 1980, because
npa was only measured once at survey time, and we refrained from assuming it was in effect for four decades or more. With preliminary versions of Equation (6) we also tested for the presence of interactions between
SCON and
ba, which, however, were not significant. Due to the comparably short time series from the restricted data set, we did not obtain plausible estimates for the allometric slope
β1 when fitting Equation (6). We therefore decided to keep the allometric slopes
β1 from the fitted Equation (6), and to use the following model (Equation (7)) for assessing the influence of
SCON:
Here,
and
are the fixed effects parameters to be estimated with the model. Thus, for estimating a tree’s basal area increment
iba from its basal area
ba and a given spatial confinement
SCON, without considering tree-specific random effects, the Equation (8) can be used:
Analogously, if the spatial confinement effect shall not be considered explicitly in the estimation of basal area increment, the fit results of Equation (6) can be applied with Equation (9):
Both equations allow for estimating a tree’s temporal basal area development by using them in the following alternative serial calculations (Equations (10) and (11)):
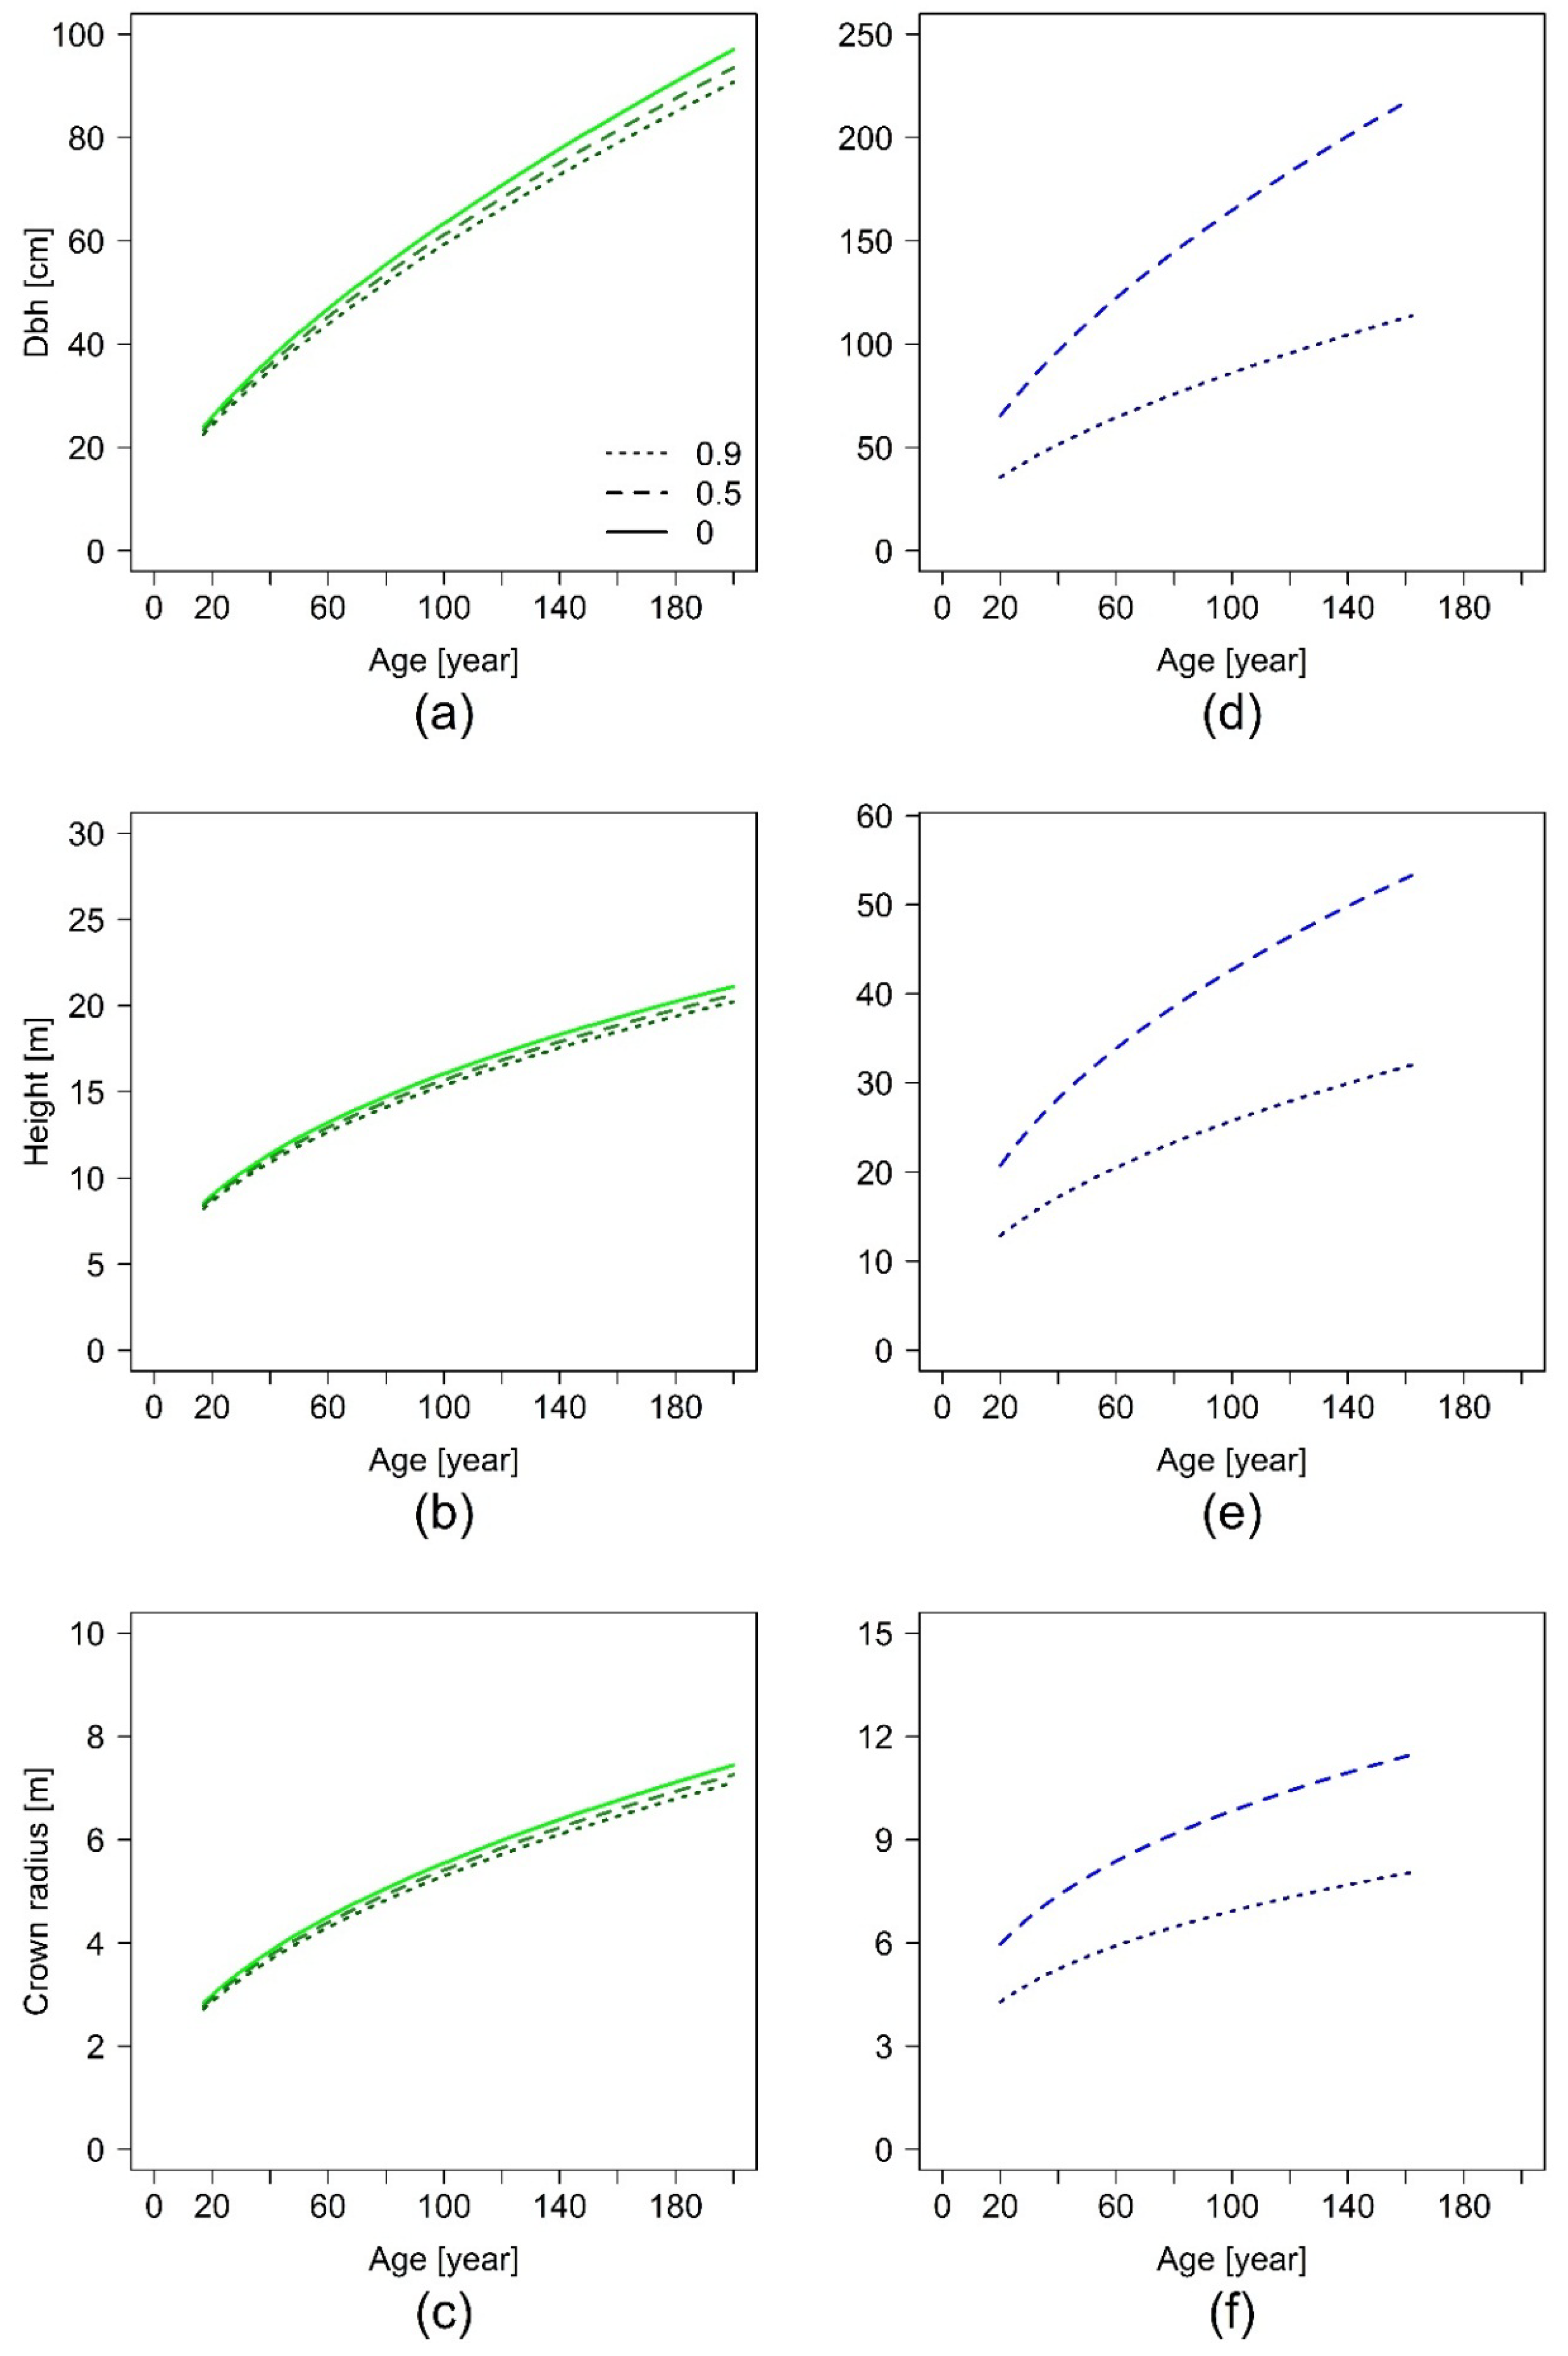
The index t represents one point of time, t + 1 is the point of time one year later. Starting with a given initial value for basal area , basal area development for any reasonable time span can be projected. As a common initial value we chose cm2, which corresponds to a diameter at breast height of 10 cm, a size at which urban trees are often planted. We projected basal area development for 200 years, in case of Equation (10) with three different values for SCON, representing total absence of non-paved area limitation, medium, and maximum limitation as found in the data for each tree species.
In order to link basal area with vertical and horizontal space requirements, we fitted two additional allometric models (Equations (12) and (13)):
where
h is tree height,
cr crown radius, and d is a tree’s diameter at breast height. The latter can be easily obtained if basal area is known by
. Both models were fitted city-wise by ordinary least squares (OLS) regression. As only one height and crown radius per tree were available from the field survey, including tree-level random effects was not necessary.
2.3. Tree Biomass Estimates
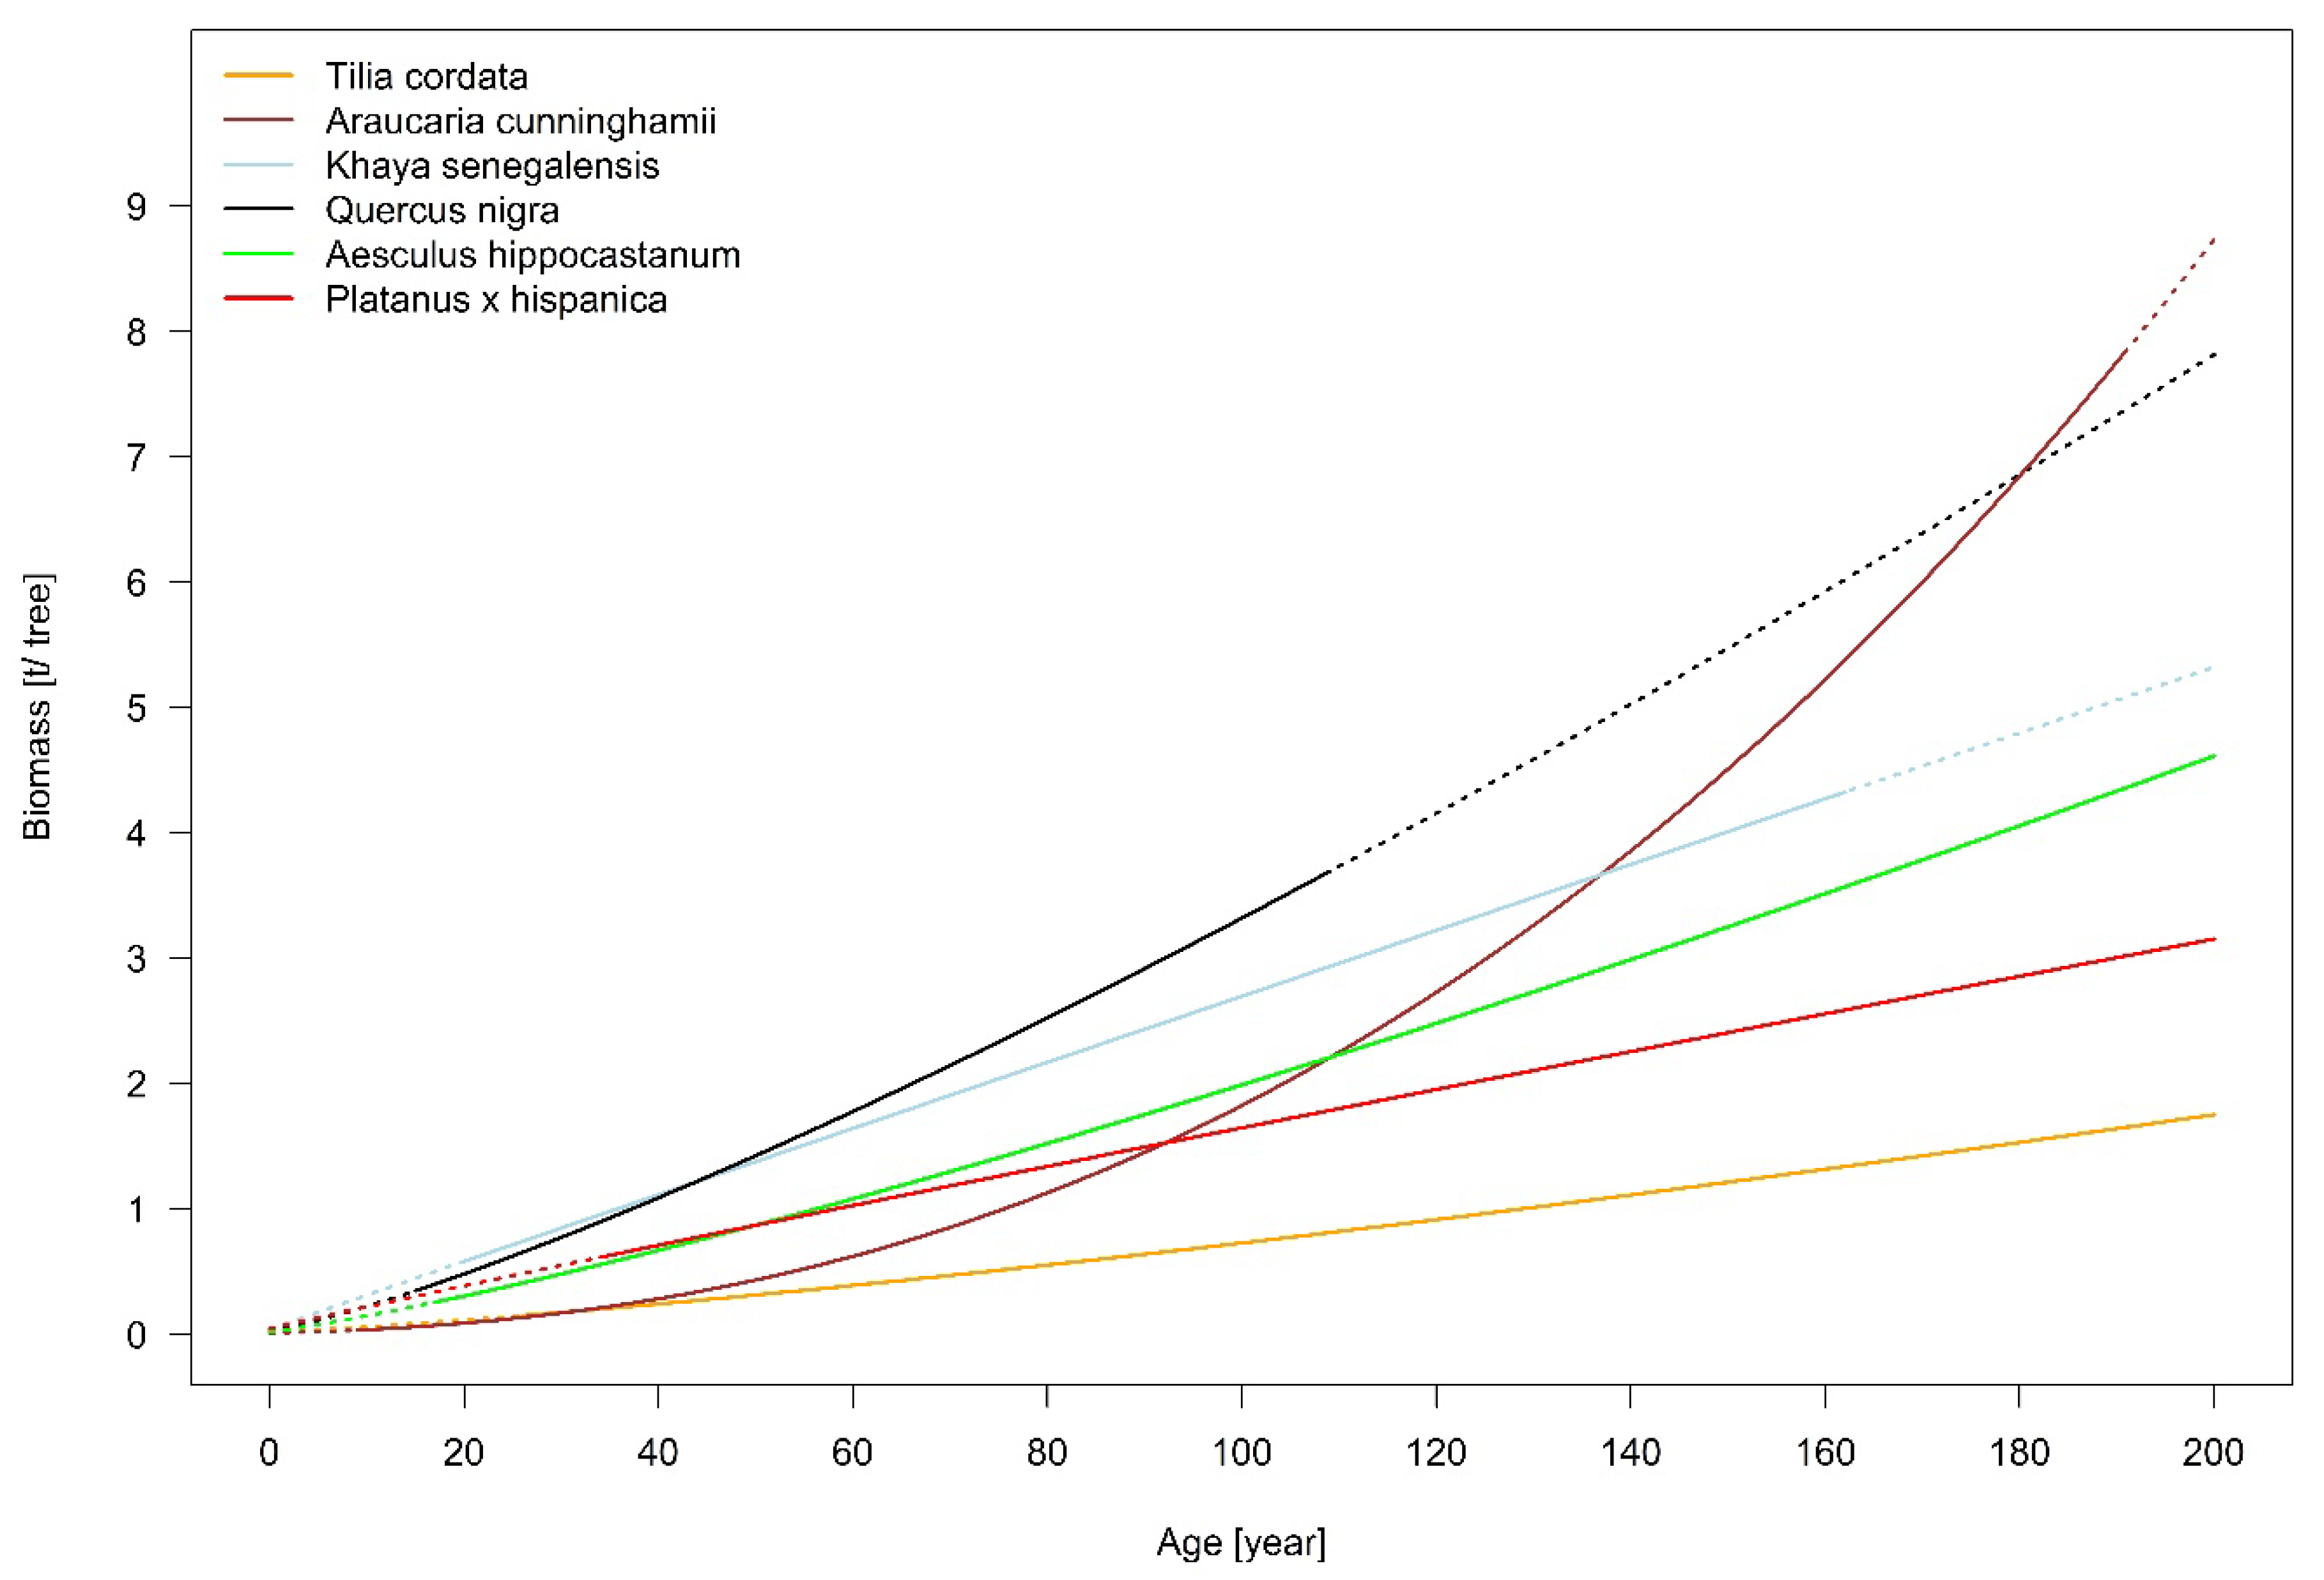
Based on the statistical models shown above, temporal tree development in terms of basal area (diameter), height, and crown radius can be estimated. In order to link those projected tree dynamics to biomass and carbon storage, the tree biomass has to be estimated. We focus on total aboveground woody biomass (w), which can usually be estimated as a function of stem diameter at breast height (d) and tree height (h).
For all species covered by this study, such equations for estimating
w were available as by Jenkins
et al. [
29] for
A. hippocastanum, Eamus
et al. [
30] for
A. cunninghamii, Clément [
31] for
K. senegalensis, Yoon
et al. [
9] for
P. x hispanica, Clark
et al. [
32] for
Q. nigra, and Čihák
et al. [
33] for
T. cordata.
The biomass equations are based on forest tree data, and thus on trees under competition by other trees, excepting the equation for P. x hispanica, which is based on urban tree data. Trees in urban areas are mostly open-grown without competing trees, which calls the applicability of the above-mentioned equations into question. To account for this we apply a factor of 0.8 to the traditional biomass equations.
Based on the aboveground biomass we determine the related carbon storage by multiplying the biomass with 0.5 [
34].
4. Discussion
4.1. Generalizabilty of the Identified Relationships
As mentioned in the introduction, this study cannot be interpreted as a usual species comparison, which would require a research design where the same set of species is observed under the same range of conditions. Our point is to compare urban tree growth and space requirements across a broad geographic climatic gradient based on a set of species that can be considered to be typical and highly adapted to the respective conditions. Some of the data we use are a subset of a data set that was used by Pretzsch
et al. [
10], where many urban tree species, including those dealt within the study at hand, are assigned to a small set of allometric types. This suggests that our findings can at least be roughly generalized for other species from the same allometric type and the same climate zone, and that they are representative for typical urban trees under the respective conditions.
In this context, the advantage of using allometric relations in contrast to other equation types is their strong foundation in biological theory. Thus, they are more than a mere description of a data set within the bounds of the sampled tree dimensions, as the parameter estimates transport direct biological information. An important consequence of this fact, allometric relationships can be extrapolated much more reliably than usual best-data-fit models. Species that show similar allometry can actually be considered to be comparable in terms of the variables involved. Furthermore, the allometry between tree size and size growth allows us to include temporal dynamics in our study, which are meaningful, albeit less precise, even when extrapolated due to their foundation in biological theory.
4.2. Growth and Space Requirements of Urban Trees Based on Allometric Relationships
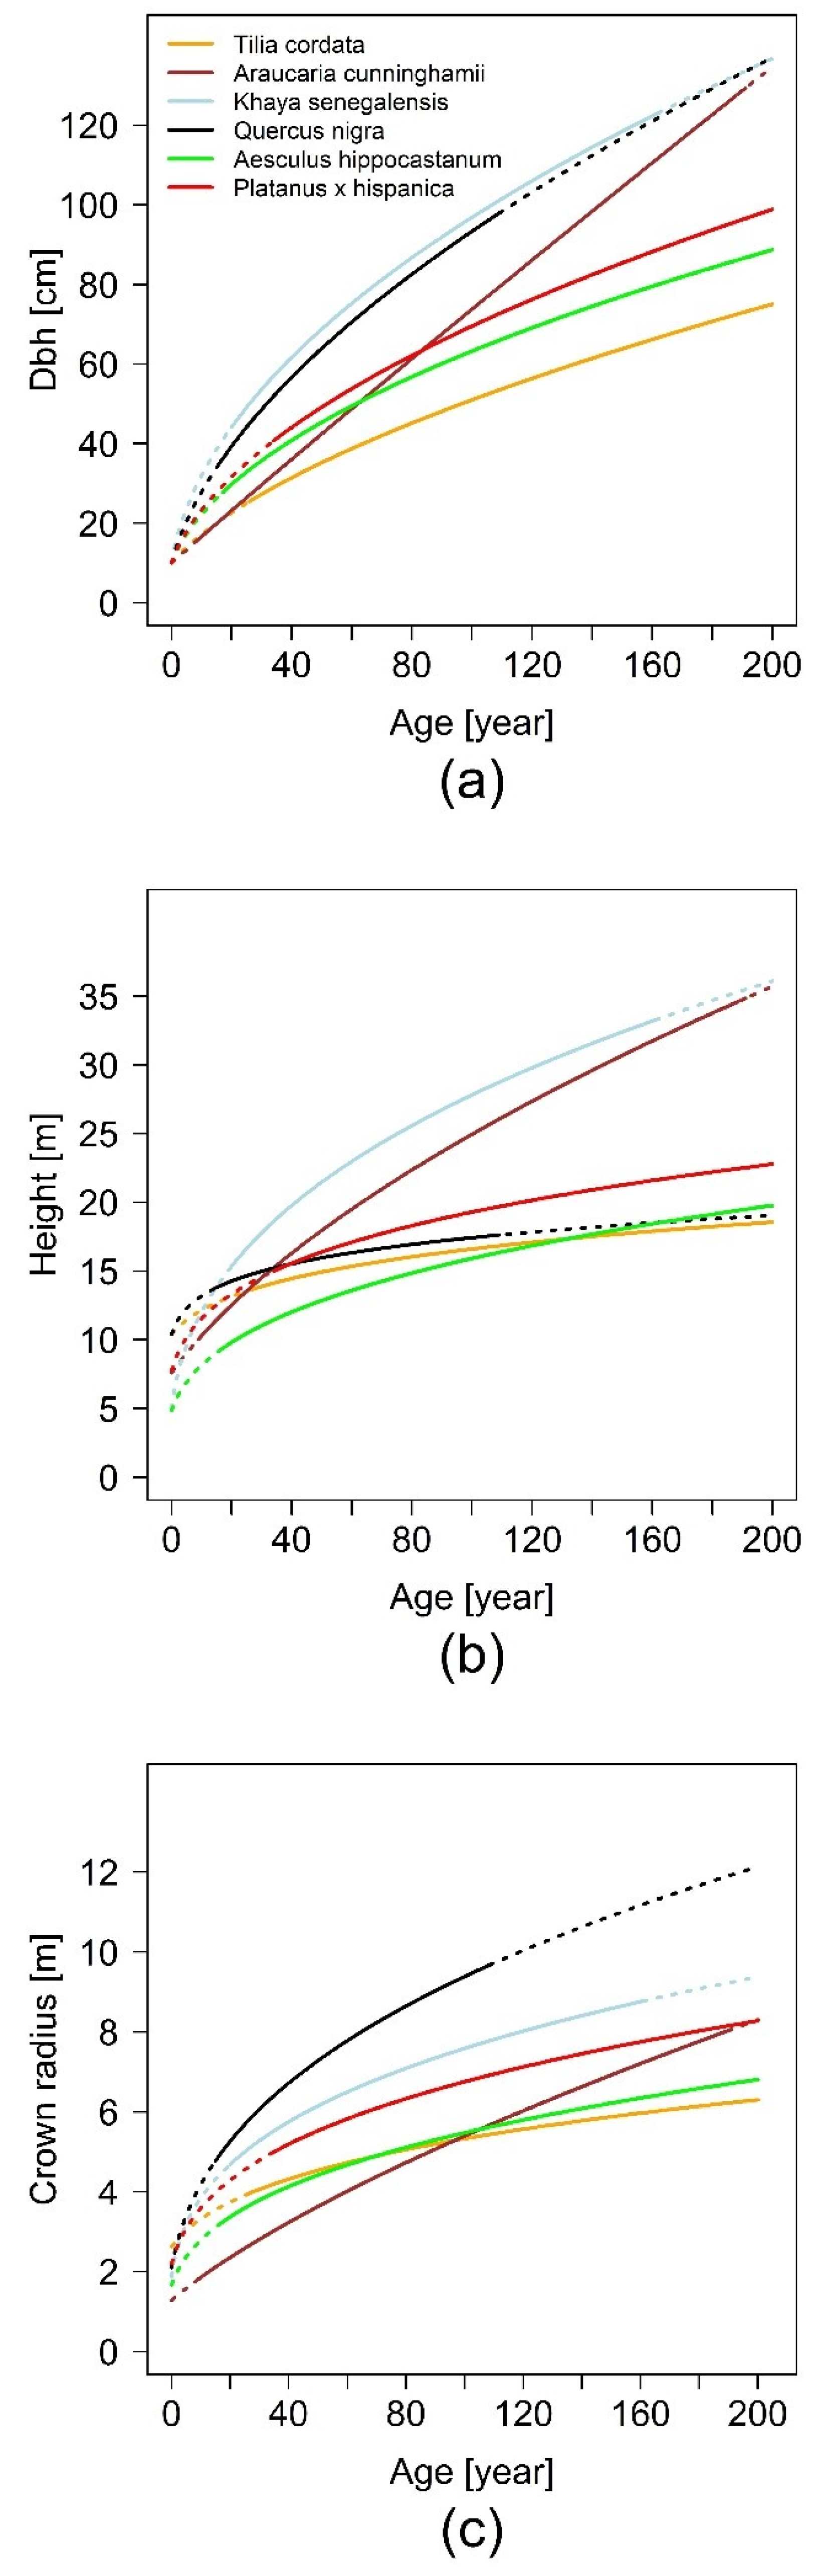
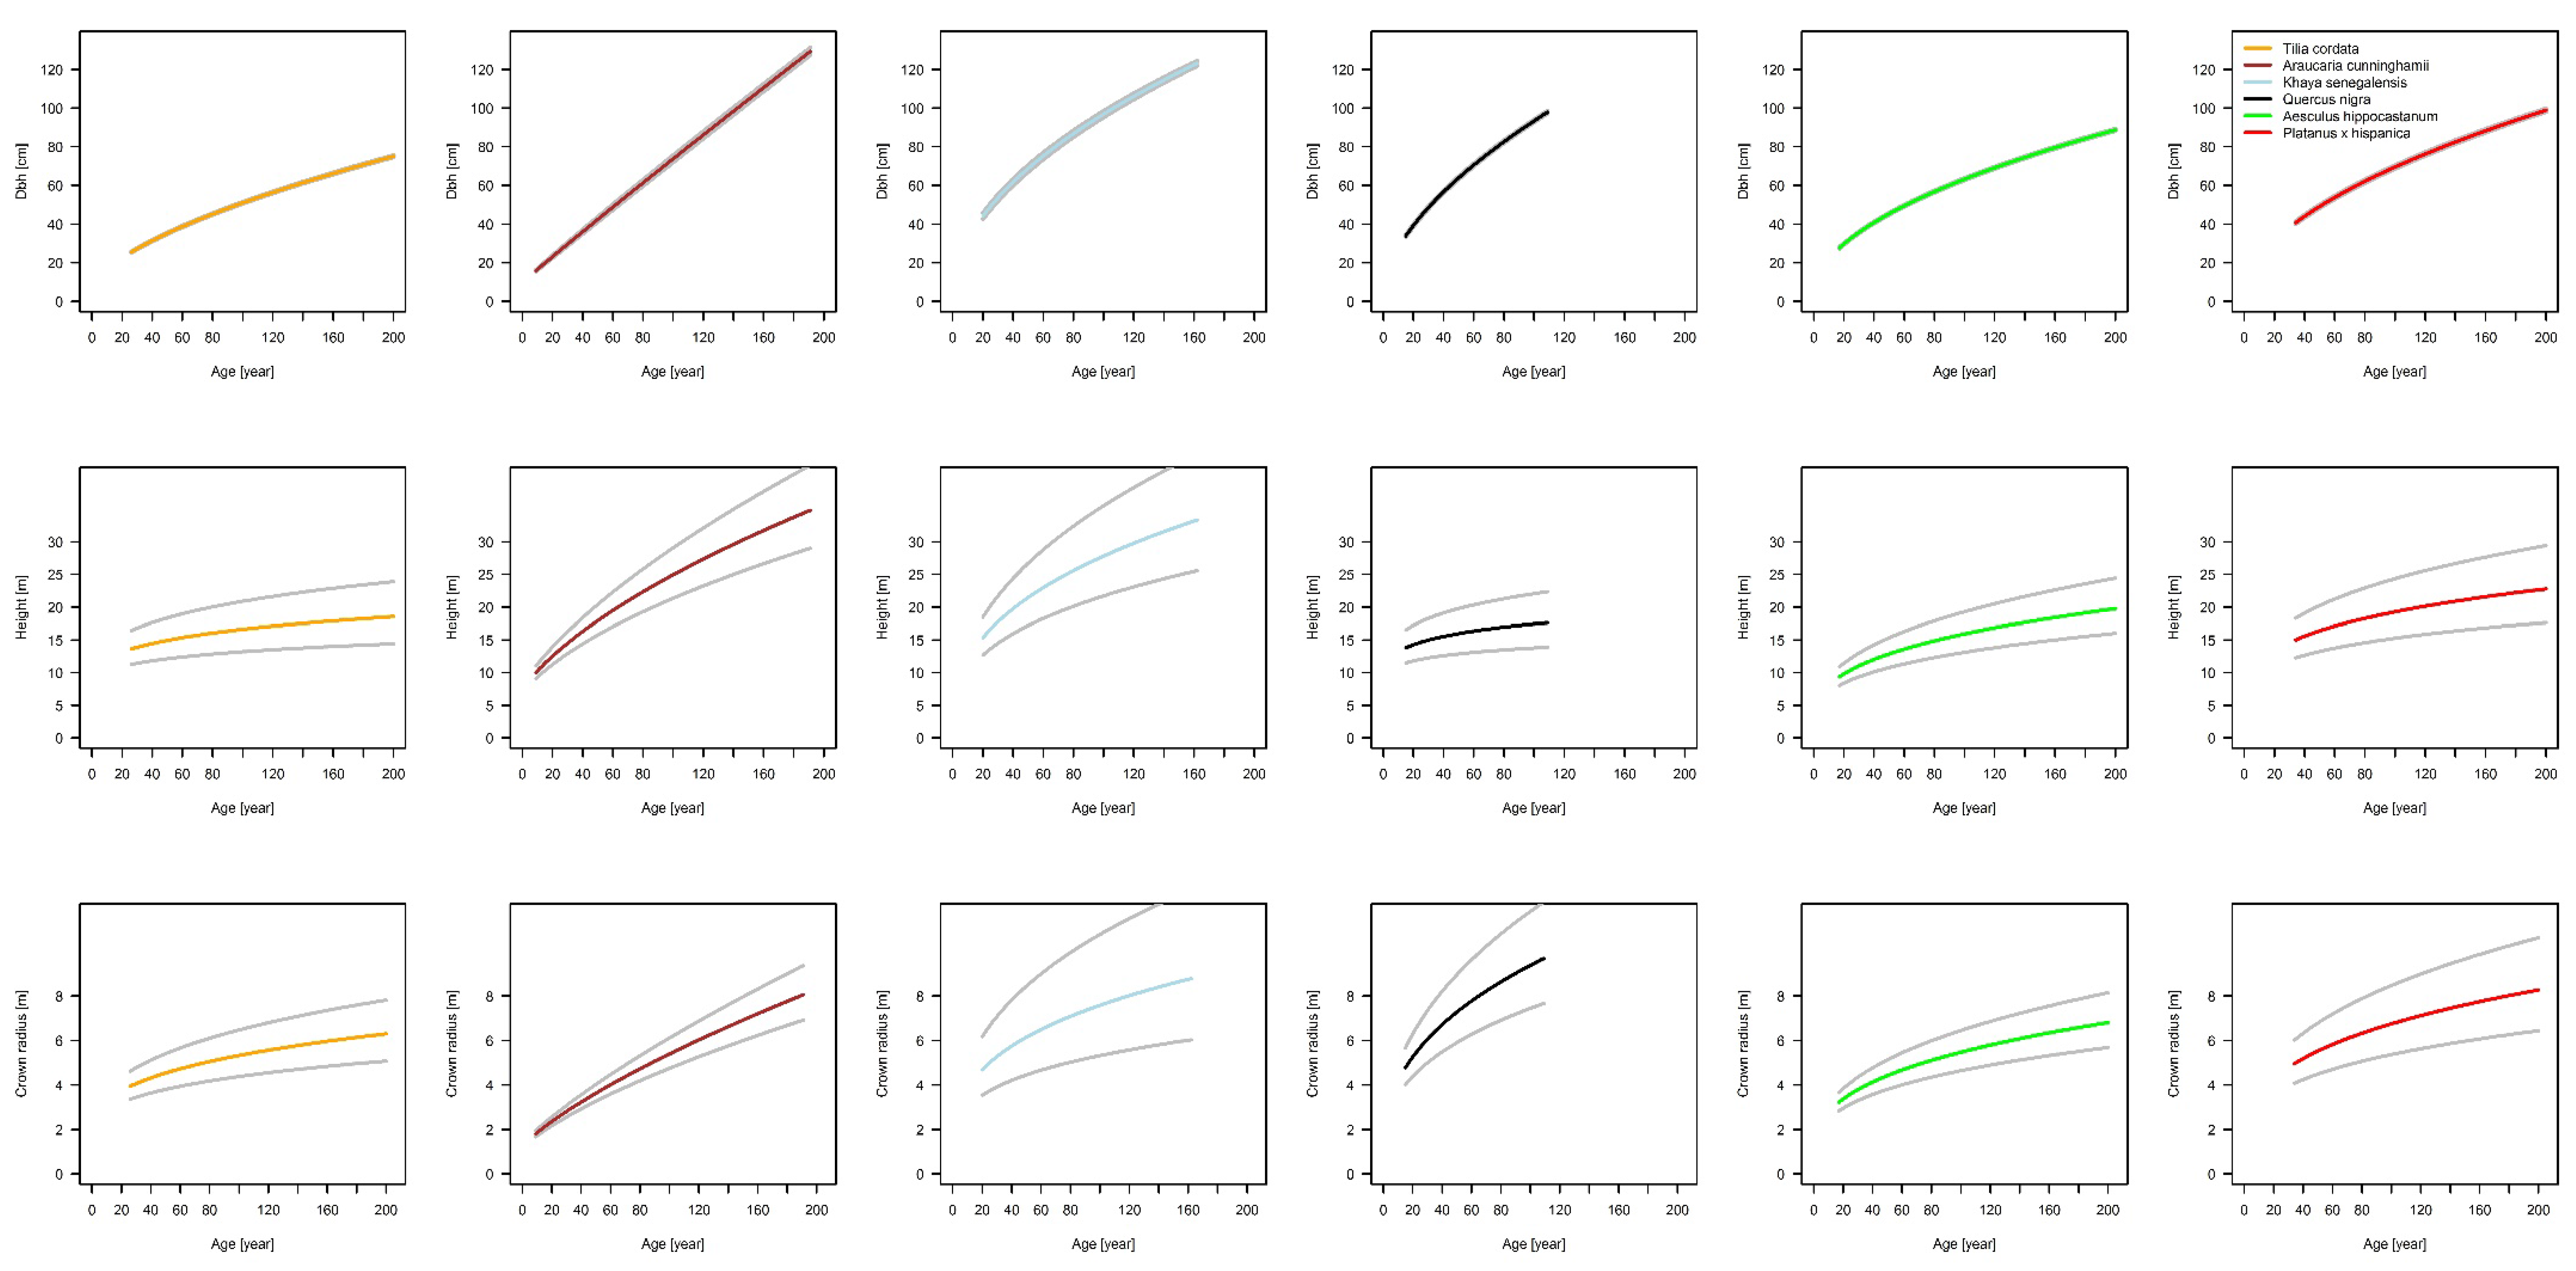
Tree size and structure as described by tree allometry determine most functions and services of urban trees, such as shading, carbon fixation, or aesthetic embellishment. This underlines the relevance of a correct and species-specific quantification of tree allometry, which is in the focus of the study. Our continent-overarching study revealed the considerable extent to which allometry, and thus functions and services, can vary between species and change with proceeding tree ontogenesis. The study arrives at quantifying the allometry of six tree species common in urban environments. The quantification is relevant for practical planting guidelines for urban trees, for improving urban tree growth models, and parameterizing integrated tools for urban landscape planning.
The fundamental relationship of our analysis between basal area and basal area increment, which gives us the possibility of tracing back stem diameter growth and delivering us a sound scaling relationship, is based on increment cores. The results of our projected allometric relationships show that there are interspecific differences in urban tree allometry. The relationship of stem diameter to tree height shows the highest scaling parameter for K. senegalensis (β1 = 0.76) in Hanoi and lowest for Q. nigra (β1 = 0.23) in Houston. For β0 only K. senegalensis (β0 = −0.13) shows an unexpected negative value, all other species have positive values with the highest for Q. nigra (β0 = 1.81). In comparison to this, allometric exponents for the relationship of stem diameter to crown radius are in a smaller range. The scaling factors are positive for all species and in a very narrow range (β1 = 0.43 for T. cordata in Berlin, β0 = 0.71 for A. cunninghamii in Brisbane). The lowest allometric exponent is β0 = −1.39 for A. cunninghamii and is the highest for T. cordata with β0 = −0.03. The results indicate that the growth of each species is individually based. Height growth, for example, increases from A. hippocastanum over P. x hispanica and A. cunninghamii to K. senegalensis, while crown radius expands from A. cunninghamii over A. hippocastanum and P. x hispanica to Q. nigra. These differences in growth dynamics for the specific species are highly relevant for urban forestry managers and planers. They need to know the space requirements of different species and how they will expand in the future in order to avoid potential conflicts with urban infrastructure.
Pretzsch
et al. [
22] state that interspecies differences in tree allometry exist in forest stands. They applied a similar method as in the present study and highlighted that competition can change plant morphology, and that allometric relationships represent structural configurations of forest stands on a species-specific or a general scaling level. Their analysis was based on stem slices of different tree species from forest stands in southern Germany.
The results of the present study show that differences in tree allometry are not only present in forest stands due to competition, but are similarly found in urban areas. Pretzsch
et al. [
10] also investigated crown allometry of different urban tree species, but without taking the temporal dynamic of the species into account. Their findings resulted in five allometric crown extension types, which also covered a distinct range of expansion and showed species-specific differences. These allometry types can also serve as a means of generalizing the results shown in this study.
4.3. Impact of Paved Surface Area on Urban Tree Growth
Our results show evidence that the restricted non-paved area limits tree growth in urban areas. Thereby, we could demonstrate that the level of growth limitation due to spatial confinement by sealed surfaces is species-specific.
This finding might be explained by water supply and the tree species’ water storage capacity. Quigley [
18] assumes that urban tree growth is slower than in forest stands due to the fact that a distinct proportion of the roots is below the pavement, and in this way is cut off from precipitation water. The reduction of water supply might be the main disadvantage of the restricted non-paved area affecting tree growth. The water storage capacity, which is very limited in the case of paved surfaces, is investigated for different tree species by Xiao and McPherson [
13]. They state that this capacity is very species-specific and age-dependent.
Another study showed that the pavement type and profile design have an influence on tree growth, as well as the compaction, but that the pavements themselves do not cause a reduced growth rate [
23]. We used the area of non-paved surface as a parameter for the influence of restricted area and found a trend for species-specific growth reduction with increasing restricted area.
The conflicts of roots with urban infrastructure are reviewed by Randrup
et al. [
35] in the way of analyzing the most relevant factors causing problems with tree roots in urban areas. As main factors they list among other things: species with a large maturity size, fast growing species, trees planted in restricted soil volumes, shallow irrigation, restricted distance between tree and sidewalk, and, in general, trees older than 15 to 20 years. Of these factors the restricted soil volume and shallow irrigation are likely to be given if the non-paved surface area is limited. Due to this limitation in non-paved area our analysis showed a significantly reduced growth, especially for
K. senegalensis.
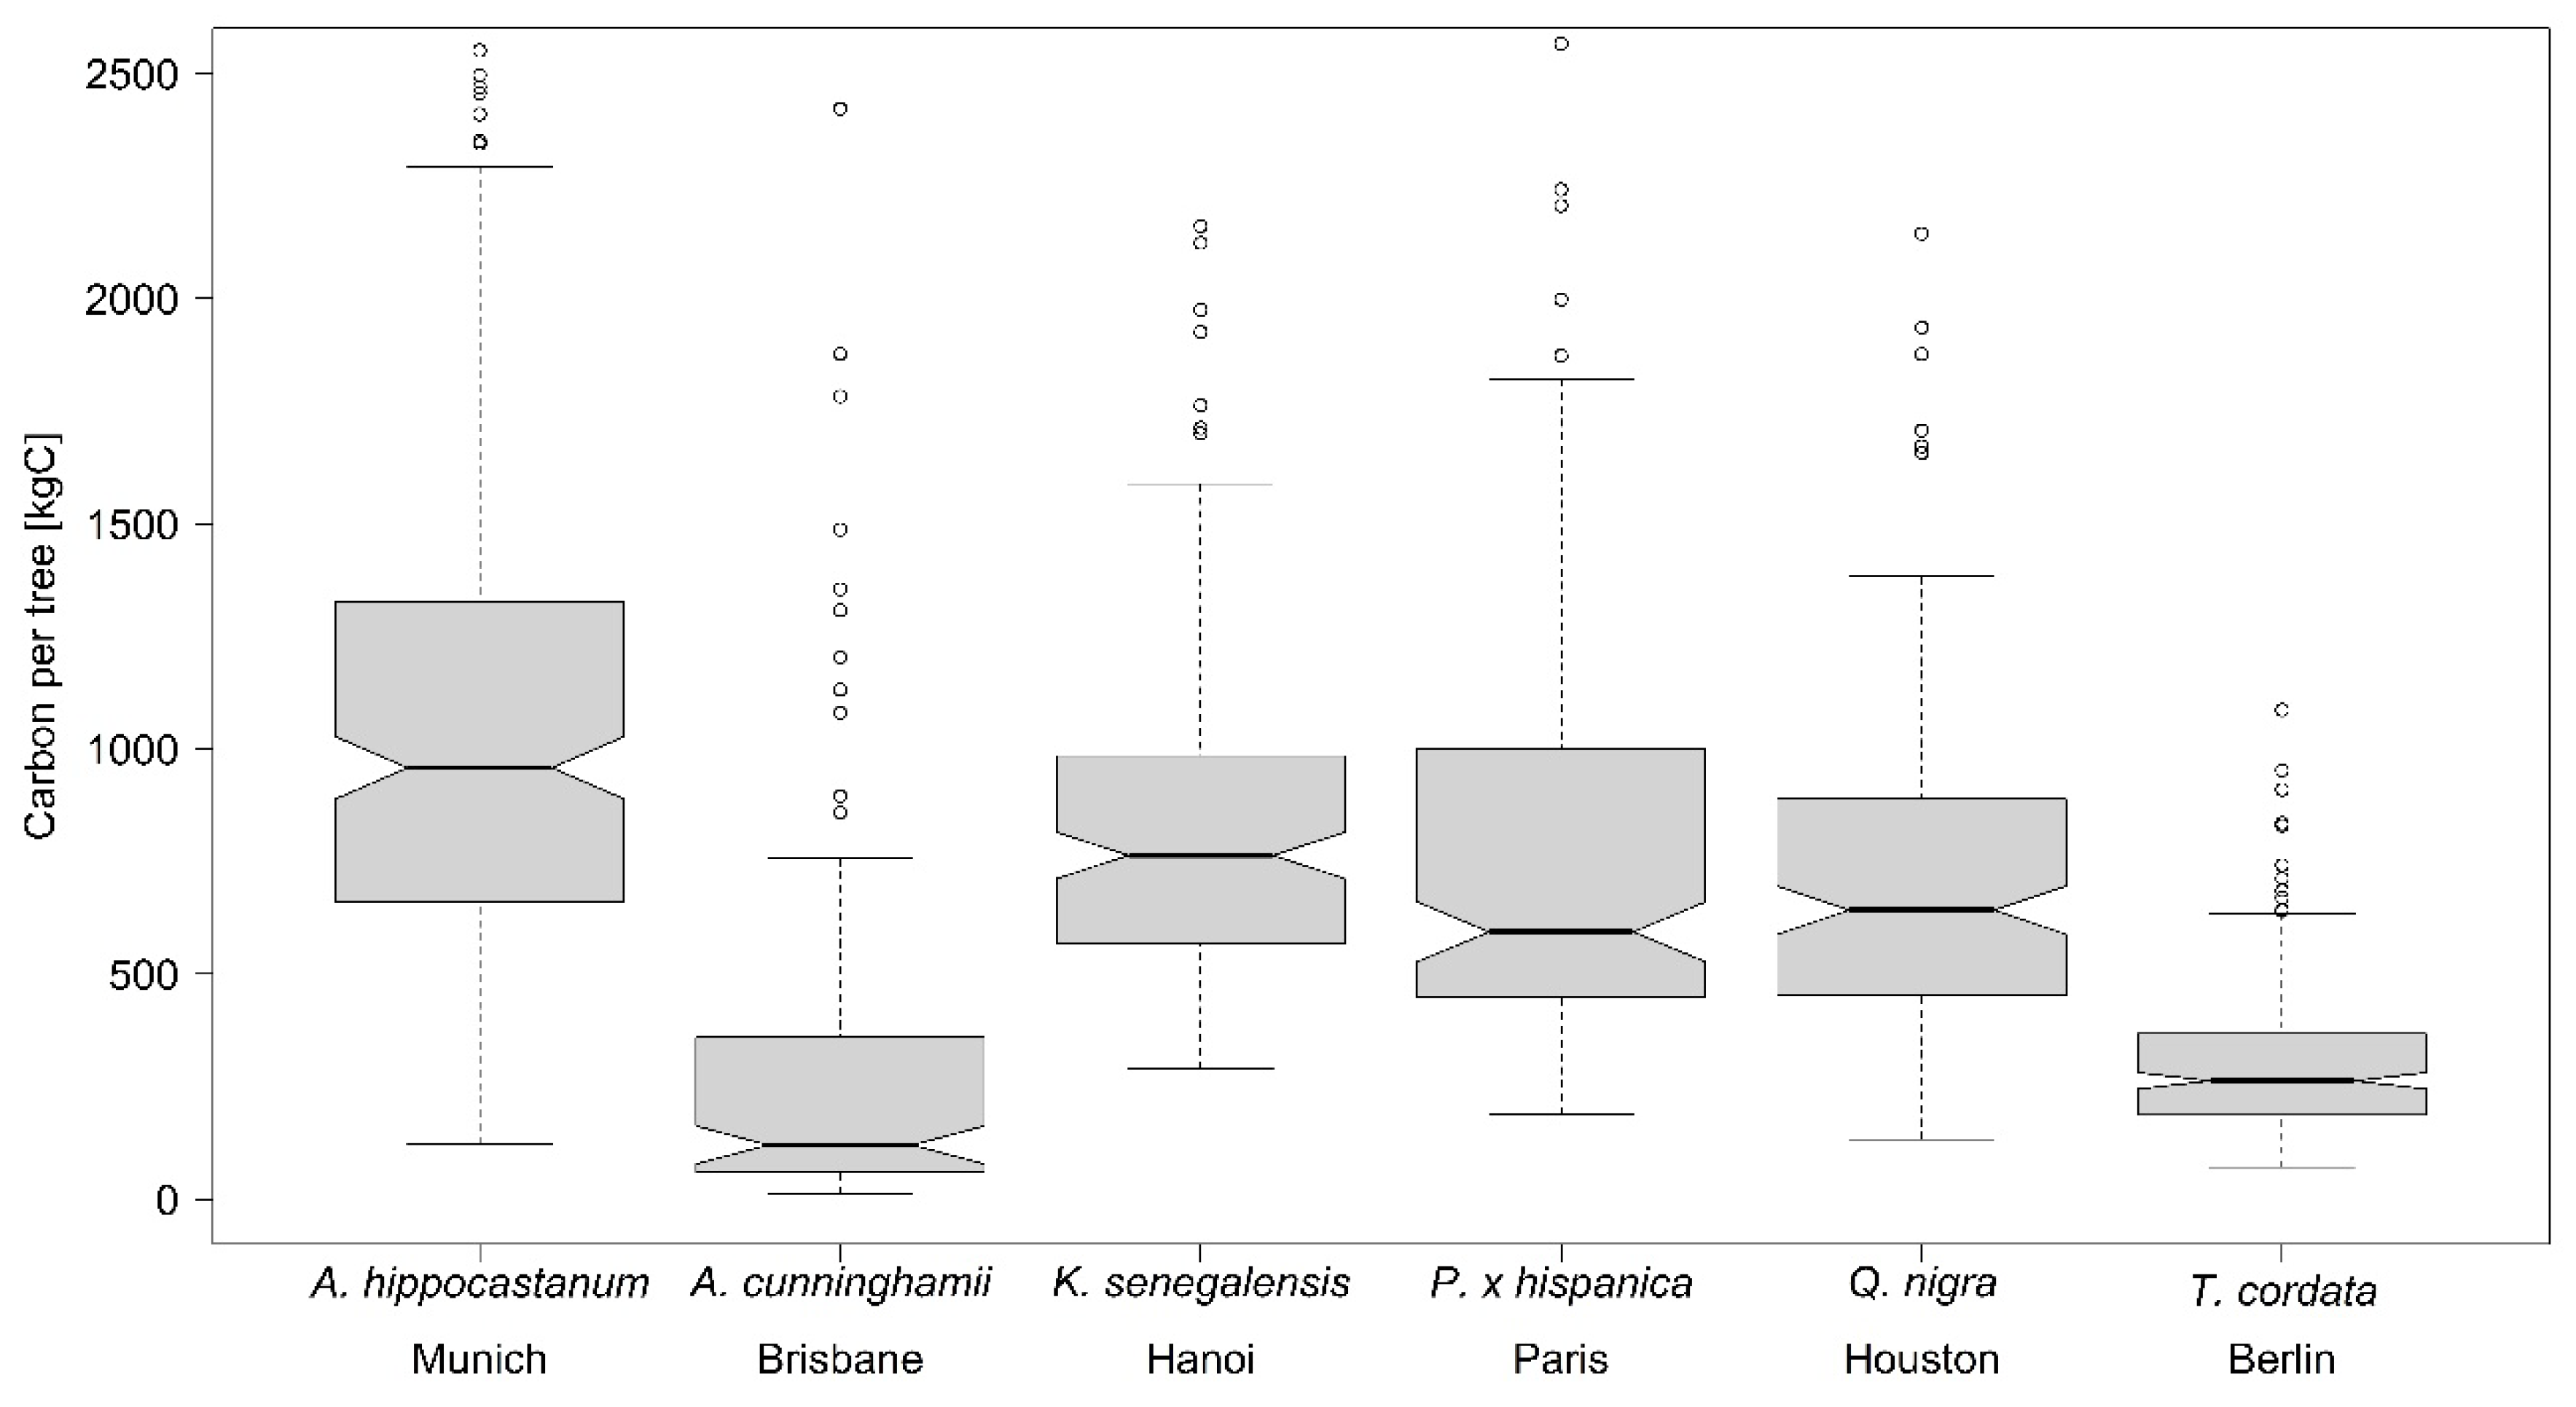
4.4. Comparison of Biomass and Carbon Storage Capacities of Different Urban Tree Species
McPherson
et al. [
7] investigated the differences in biomass between forest and urban trees and concluded that forest trees on average contain 20% more biomass than urban trees at a given height and stem diameter. Following their suggestion, we multiplied the outcomes obtained with the traditional biomass equations with a factor of 0.8 in order to achieve more realistic estimates for our urban trees. This factor is also considered in the i-Tree Eco/Urban Forest Effects (UFORE) model developed in the USA [
36]. In contrast, Russo
et al. [
37] did not use such a factor for their study in Bolzano, Italy, due to their assumption that not all urban trees are open-grown. McHale
et al. [
6] also compared forest and urban biomass values and equations and stated that the value of 20% difference in biomass should be re-evaluated.
In
Table 7 the results of two other urban tree studies on C storage [
8,
9] are compared with the values of the present study. For
T. cordata the C storage values found by Moser
et al. [
8] are in a similar range to our findings. Both studies investigated
T. cordata trees in German cities, which means that both studies took place within the same climate region. The minimum and mean C storage values of the present study are higher, due to the fact that less small trees were sampled and the mean diameter is higher. Again, Moser
et al. [
8] did not apply the correction factor of 0.8 and Yoon
et al. [
9] used it for avoiding an overestimation of the urban tree biomass for their estimations. Despite the fact that the two studies were done in different climate regions, and assuming that the two studied
Platanus species (
P. x hispanica and
P. orientalis) show the same growth patterns, the C storage of the tree individuals fit together when based on their diameter.
These results show that although a comparison of different studies is difficult due to different diameter ranges and different equations that might be used for the estimation, still the findings indicate that a tree species performs in a similar range on different sampling locations.
4.5. Carbon Storage Capacity of T. Cordata on City Scale
The present study estimates the temporal dynamic of urban tree growth and expansion. On this basis an estimation of the annual net carbon fixation of urban trees’ woody biomass for a whole city is possible. Different studies [
37,
38,
39], which quantified above-ground carbon storage on a city-wide scale, show that more research in this field is needed. For deriving a plausible estimation on the city scale the diameter distribution of the tree collective has to be known. For
T. cordata a sample of 61,000 trees in Berlin [
40] delivered us this distribution. In total,
T. cordata trees amounted to 155,000 in 2014, by having a share of 35% of all street trees in Berlin [
40]. By using the above mentioned biomass equation for
T. cordata [
33], which takes the diameter and the tree height into account, the carbon storage of this species sums up to 31.17 million tons C. On the base of the mean tree age of the respective diameter class the annual net average C-fixation of one single lime tree was calculated with 2.8 kg C year
−1, which results in an annual C-fixation for all lime trees in Berlin of 430 t C year
−1. Assuming a per capita C consumption of 1.5 t C year
−1 for the year 2012 for Berlin [
41], the annual carbon-fixation of lime trees corresponds to a carbon consumption of 284 inhabitants of Berlin.
Comparing the average value of 2.8·kg C year
−1 of the present study to a similar study from Italy by Russo
et al. [
37] shows that with 2.8 kg C year
−1 our estimation is out of his range, which lies between 9.79 to 43.06 kg C year
−1. It has to be mentioned though that
T. cordata represents the lowest level of biomass production and carbon sequestration from our investigated species. This means that the other investigated species are within the range of Russo’s values, which represent diverse tree species. Further, the differences between the studies might be due to the fact that the study by Russo
et al. [
37] included trees from urban areas as well as forest stands.
Schreyer
et al. [
42] derived the carbon storage per tree of different structure types in the City of Berlin. They list a value of 1,028,427 t carbon for the entire city of Berlin. In comparison, we quantified the value of 31,170 t C for 155,000
Tilia trees. If we take into account that
T. cordata has a low C fixation rate compared to other species, and that just one third of Berlin’s vegetation is represented with our selection, the total values of the two studies might fit together.
5. Conclusions
In summary, the results show the species-specific allometries of a set of typical urban trees worldwide, under the conditions they are typically found and best adapted to, by taking the temporal dynamic into account. The enlargement of diameter, tree height, and crown radius size are very species-specific and vary between the six investigated urban tree species. It can also be shown that the impact of paved surface inhibits tree growth. A significant impact of the non-paved area was found for the species A. hippocastanum in Munich and K. senegalensis in Hanoi. The estimations for above ground biomass are also species-specific and show the highest values for the deciduous species Q. nigra in Houston and the lowest for T. cordata in Berlin.
Our study gives statistically solid quantitative information about how typical urban tree species develop worldwide with specific regard given towards space requirements, which we deem useful for urban managers. Linking this information with the allometric species types as identified in Pretzsch
et al. [
10], the applicability of our study is beyond the species investigated here. With this knowledge better adaption of treatments for urban trees, which are in potential conflict with urban infrastructure, is possible; this information might be useful in supporting the benefits of urban trees. As a result, the additional costs for tree maintenance and care, which are well reported [
2], can be reduced and a more effective way of managing might be possible.
Future research in this field is needed for an extended understanding of the growth behavior of urban trees and its temporal dynamic, specifically in relation to anthropogenic decisions, like paving surfaces. Last but not least, further investigations on urban tree biomass and carbon storage worldwide are important against the background of rising interest in urban air quality.
We based our study on both countries with long experience in urban tree research and countries that presently have begun caring for and investigating urban trees. As such, we tried to contribute to a continuous improvement of the appreciation, research, and knowledge base of urban trees worldwide.


