
Vulnerability of Commercial Tree Species to Water Stress in Logged Forests of the Guiana Shield

 , , ,
, , ,
Abstract
:
1. Introduction
2. Materials and Methods
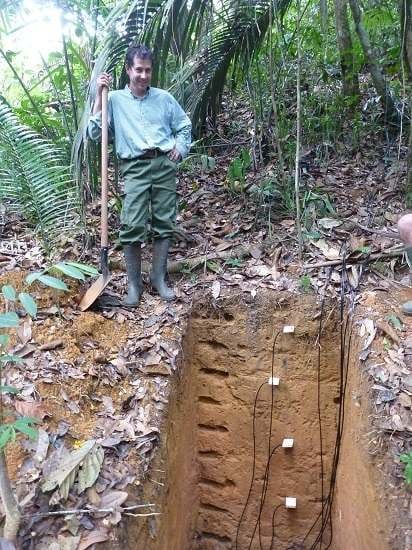
2.1. Site Characteristics
2.2. Data
2.3. Quantifying Water Stress
2.4. Model
- ;
- θ are all unknown parameters that we will infer;
- ε is an error term following a normal distribution.
- is the probability of dying between time and time t computed with Equation (3).
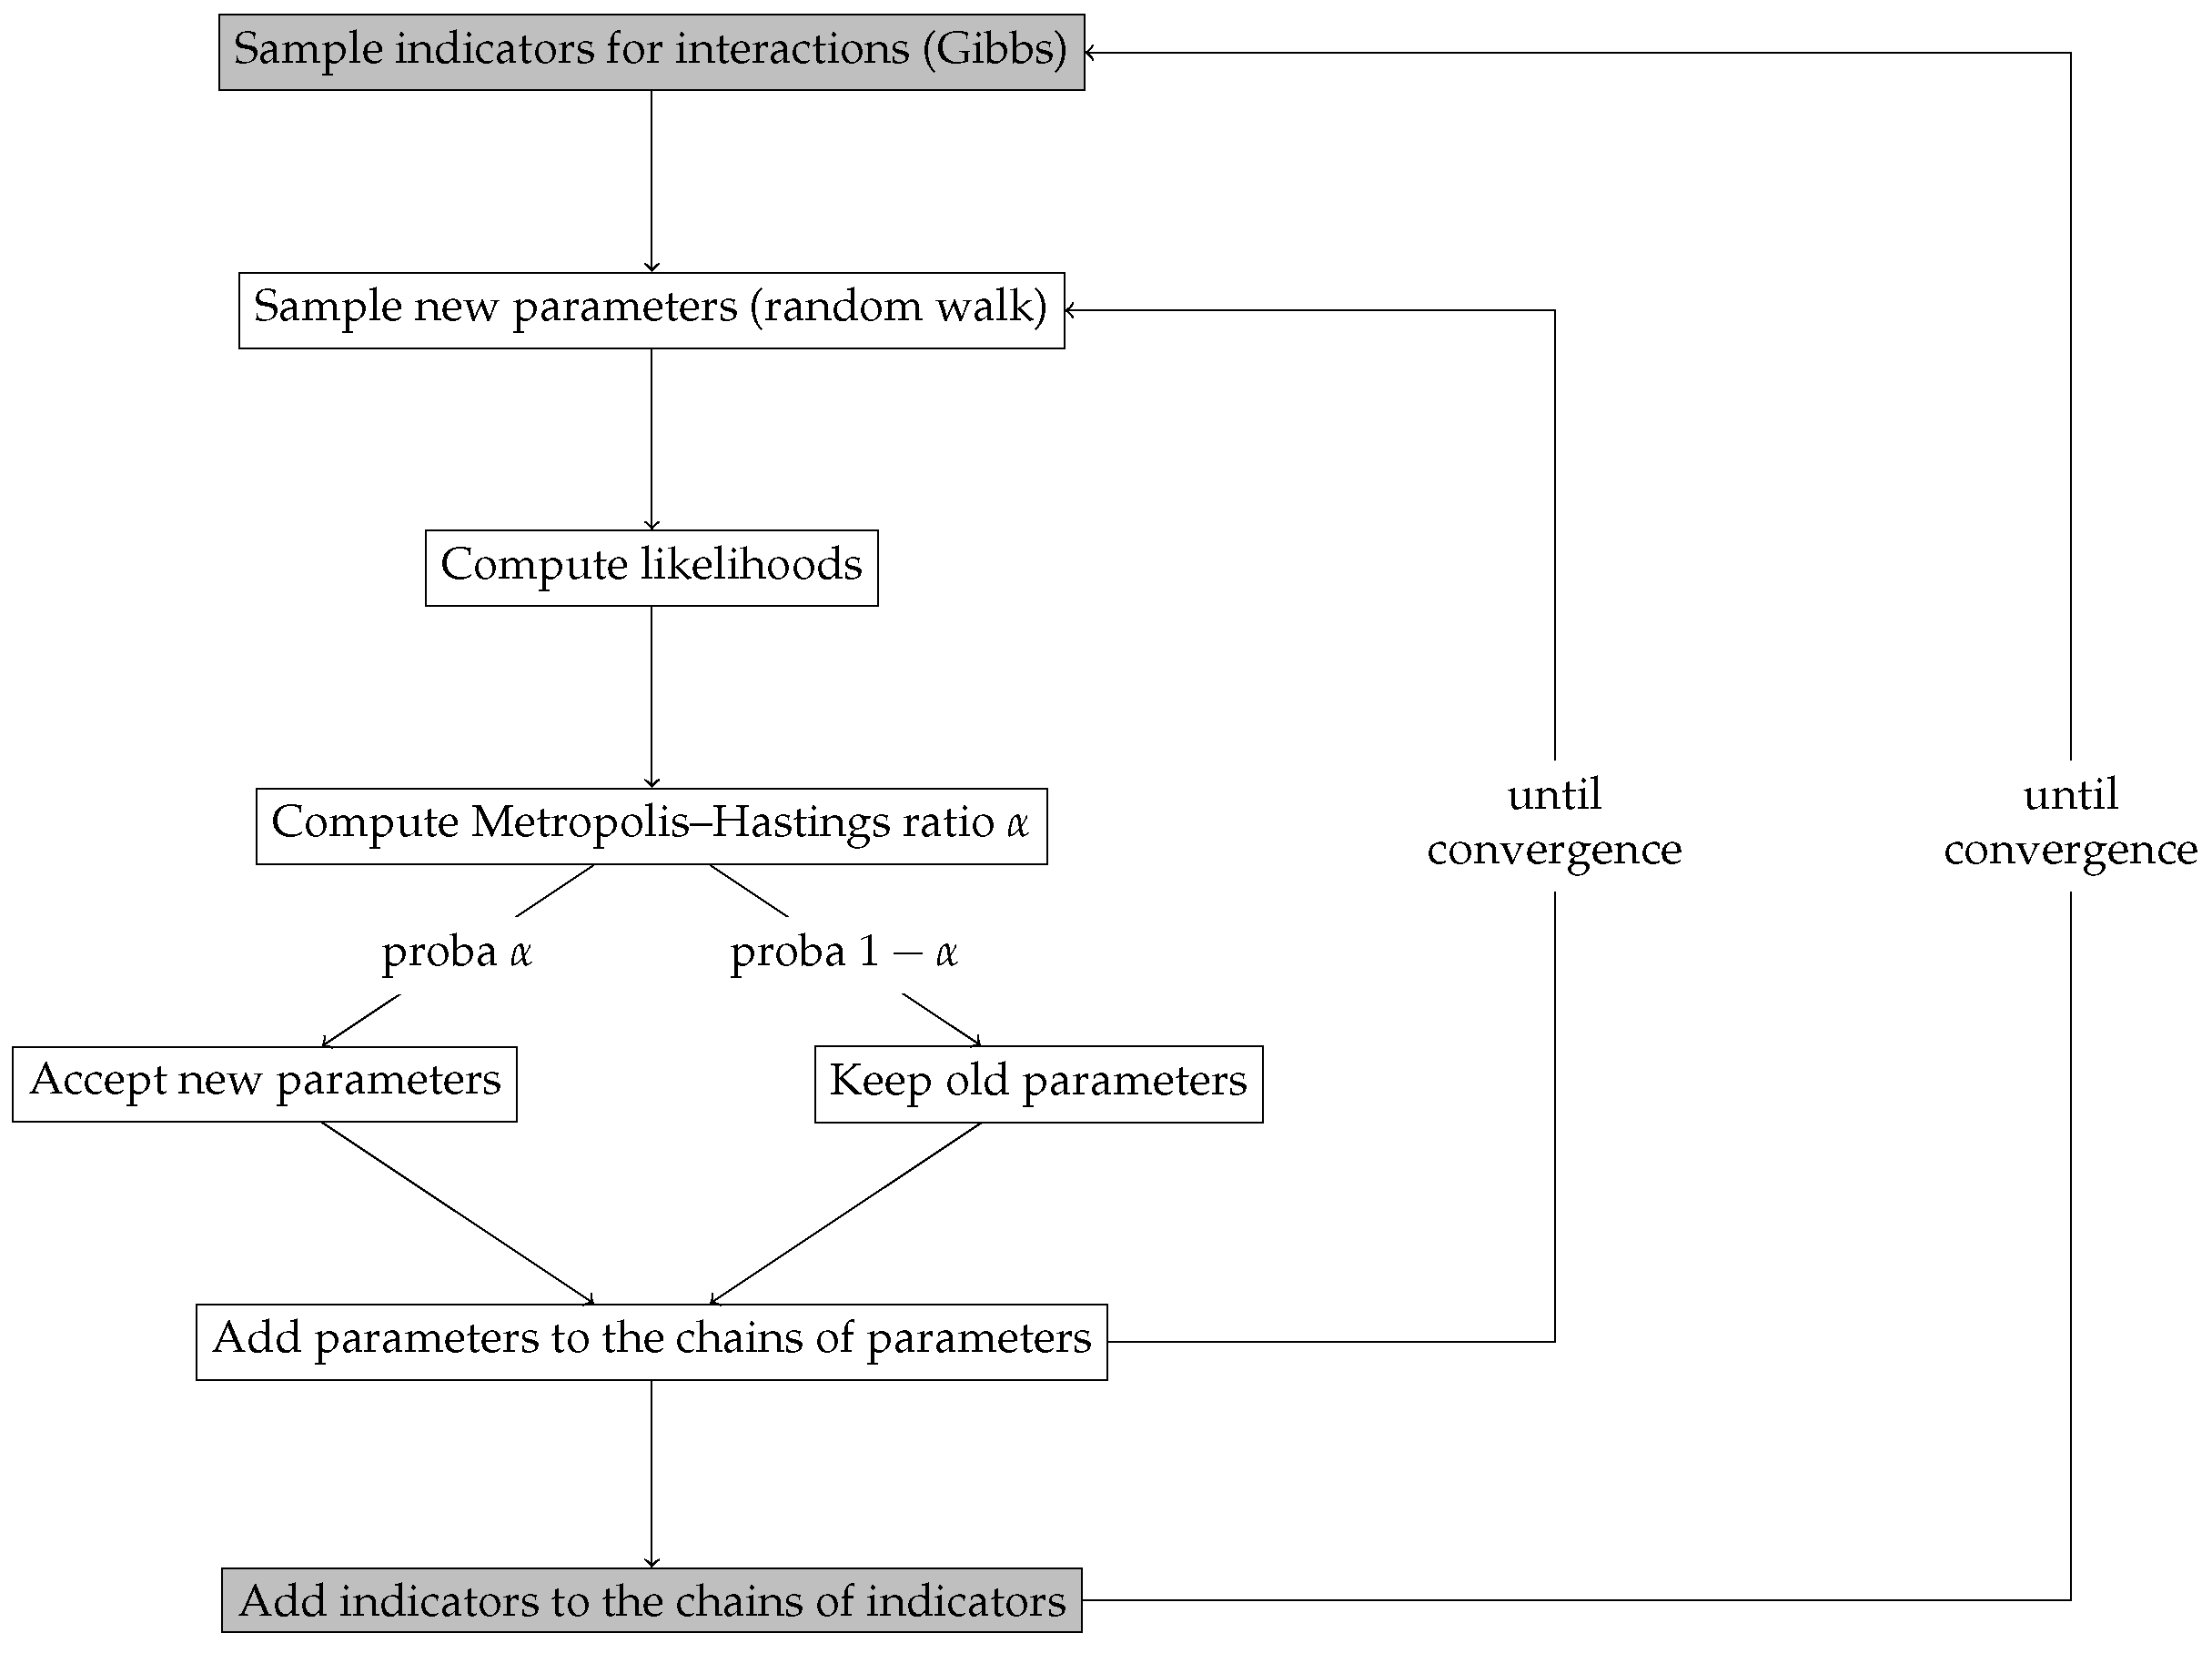
2.5. Inference and Selection Method
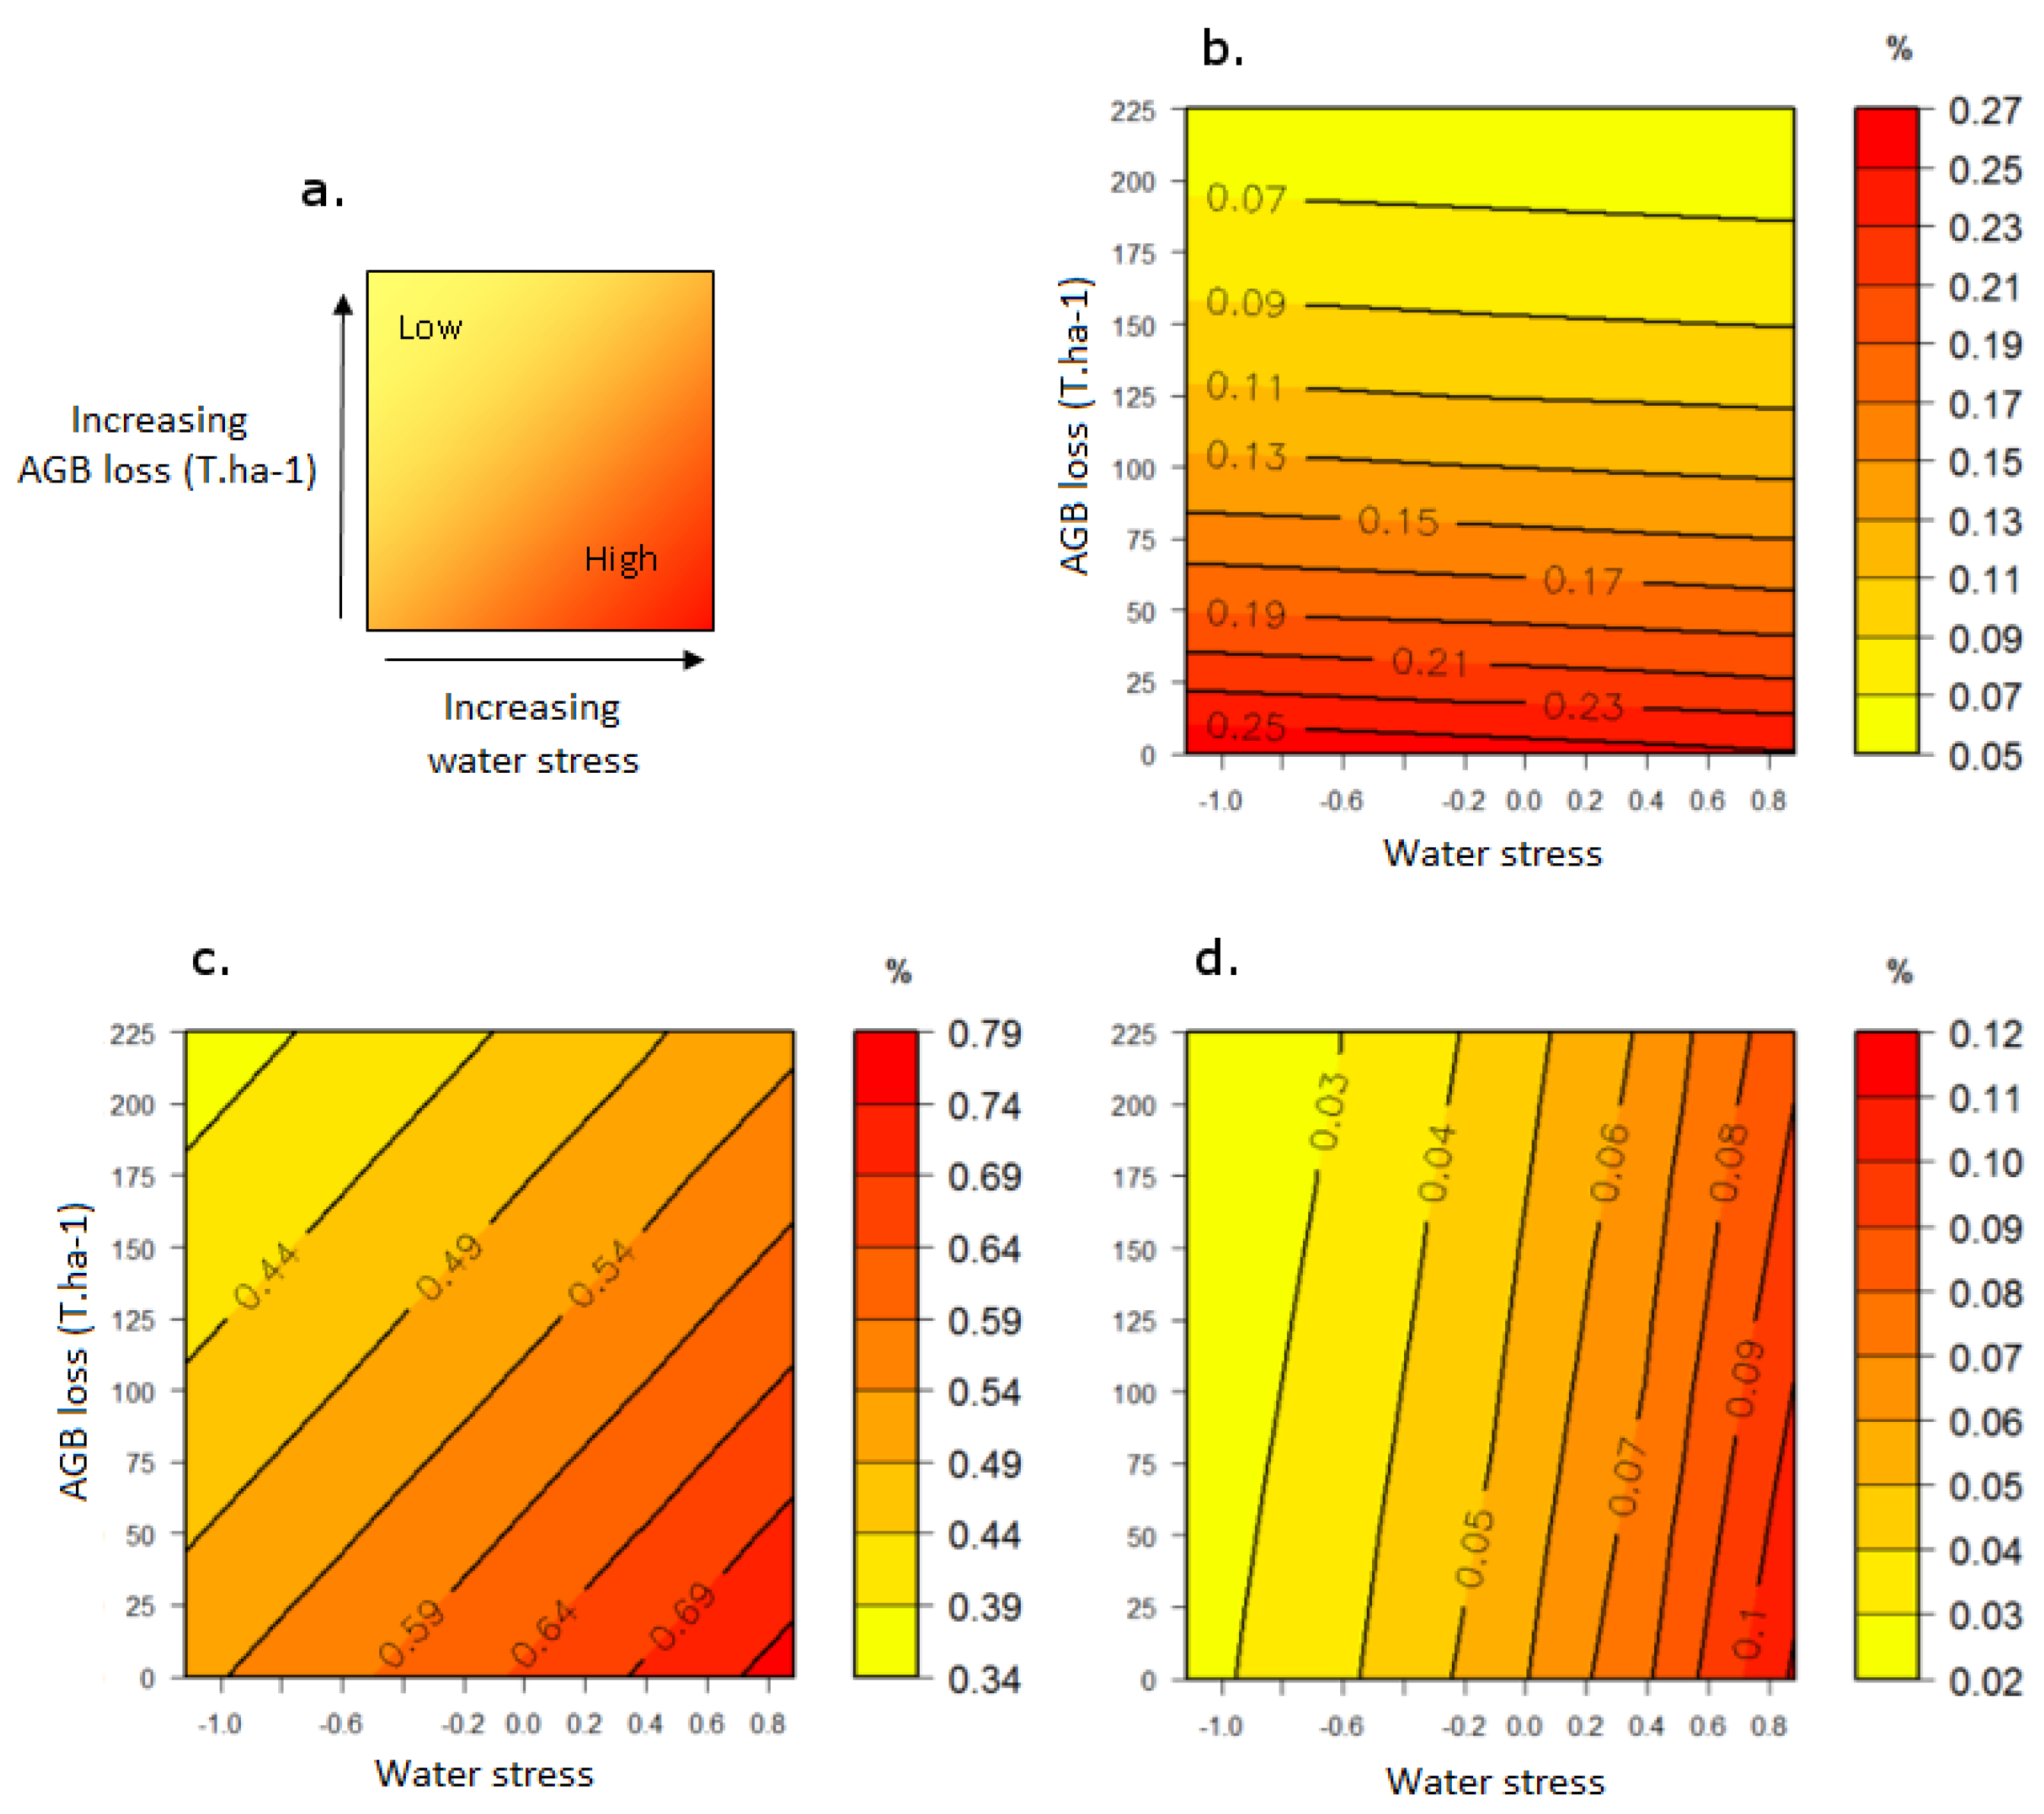
2.6. Quantifying Vulnerability
3. Results
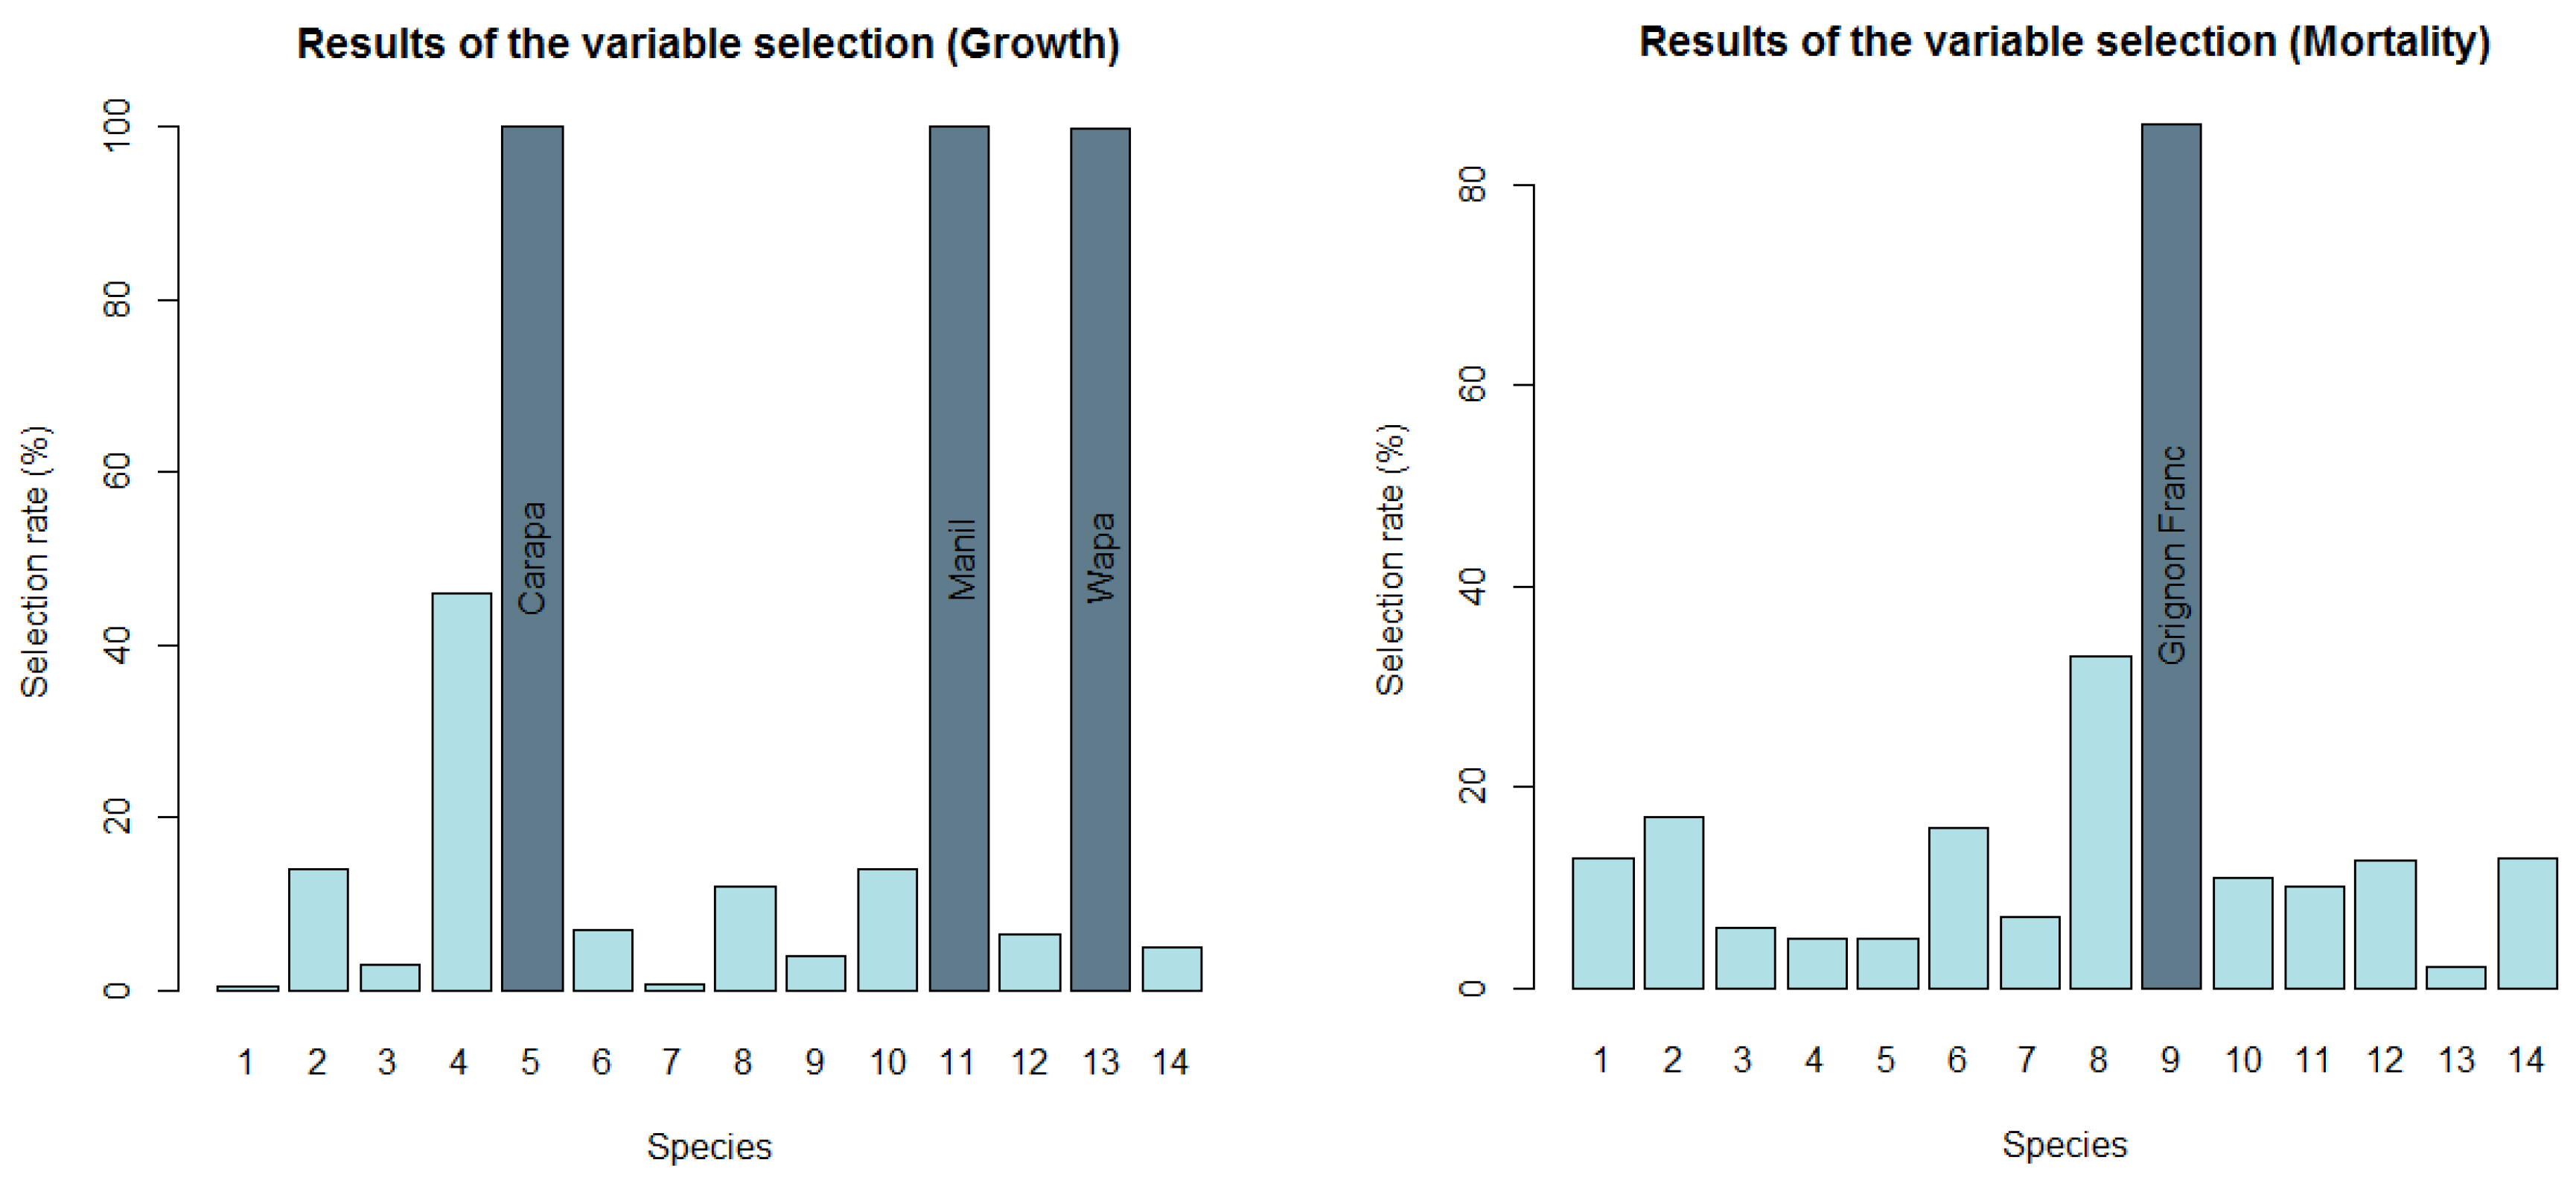
3.1. Variable Selection
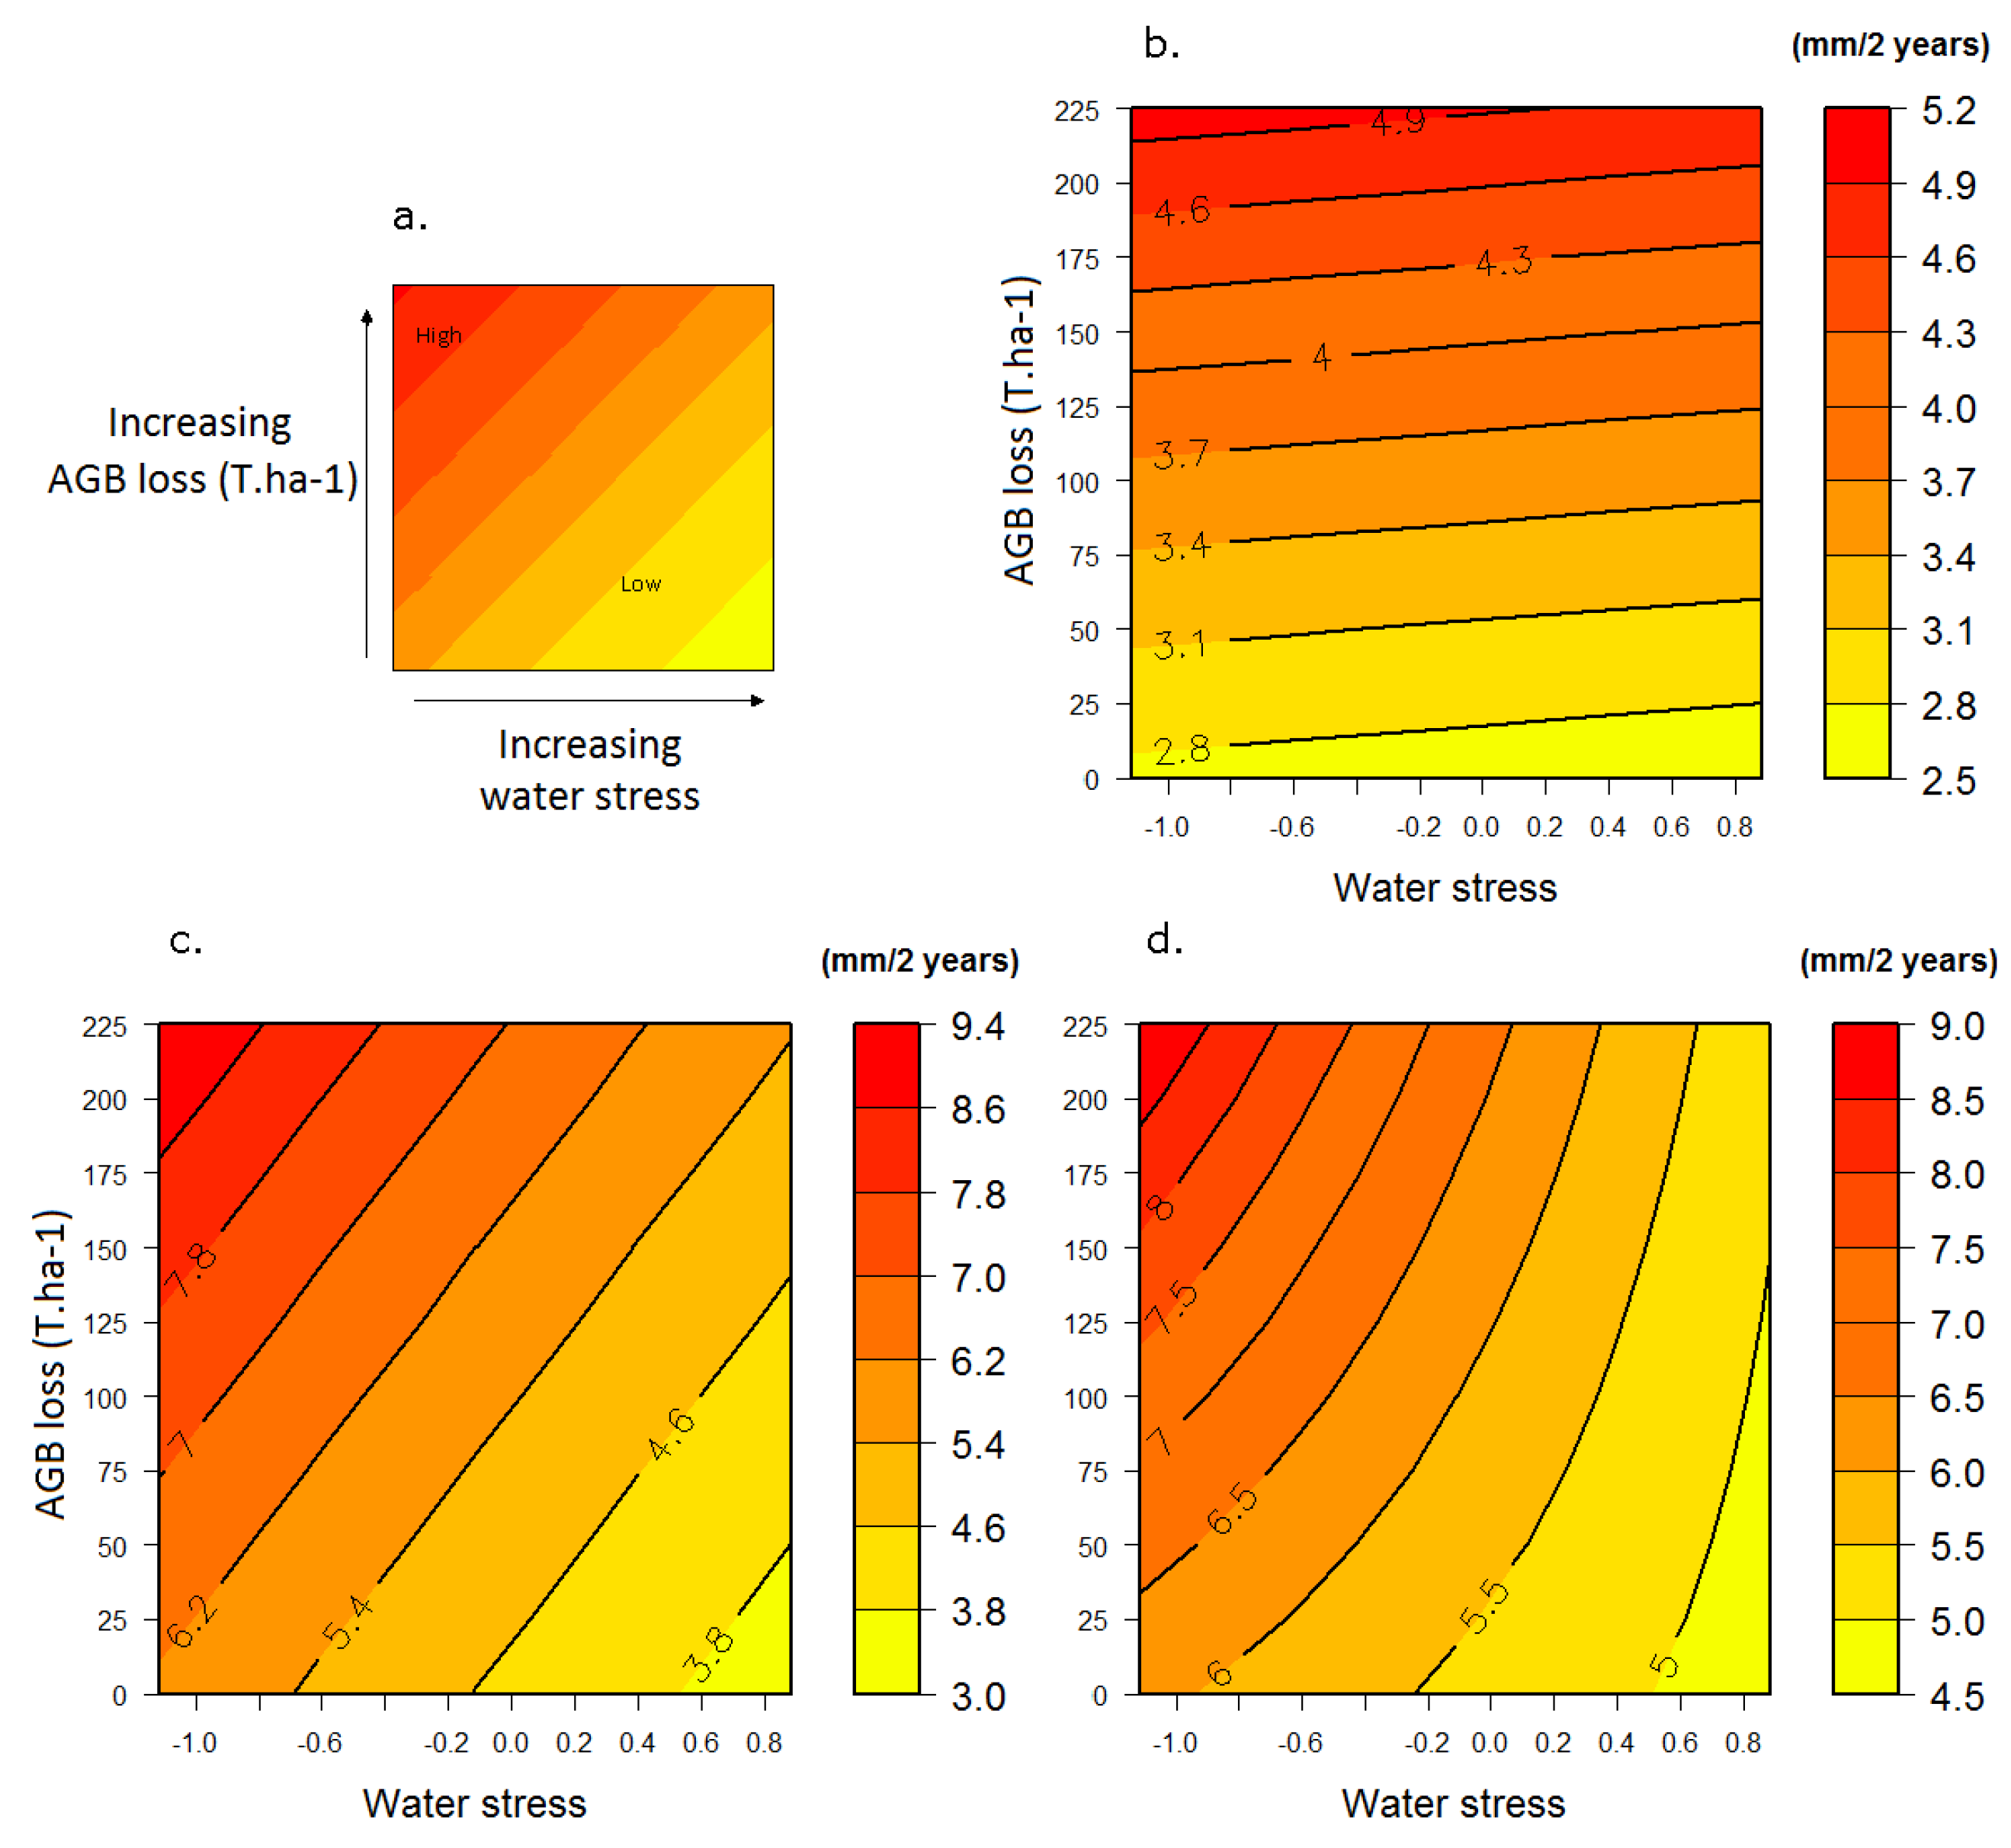
3.2. Response to the Combined Effects of Logging and Water Stress
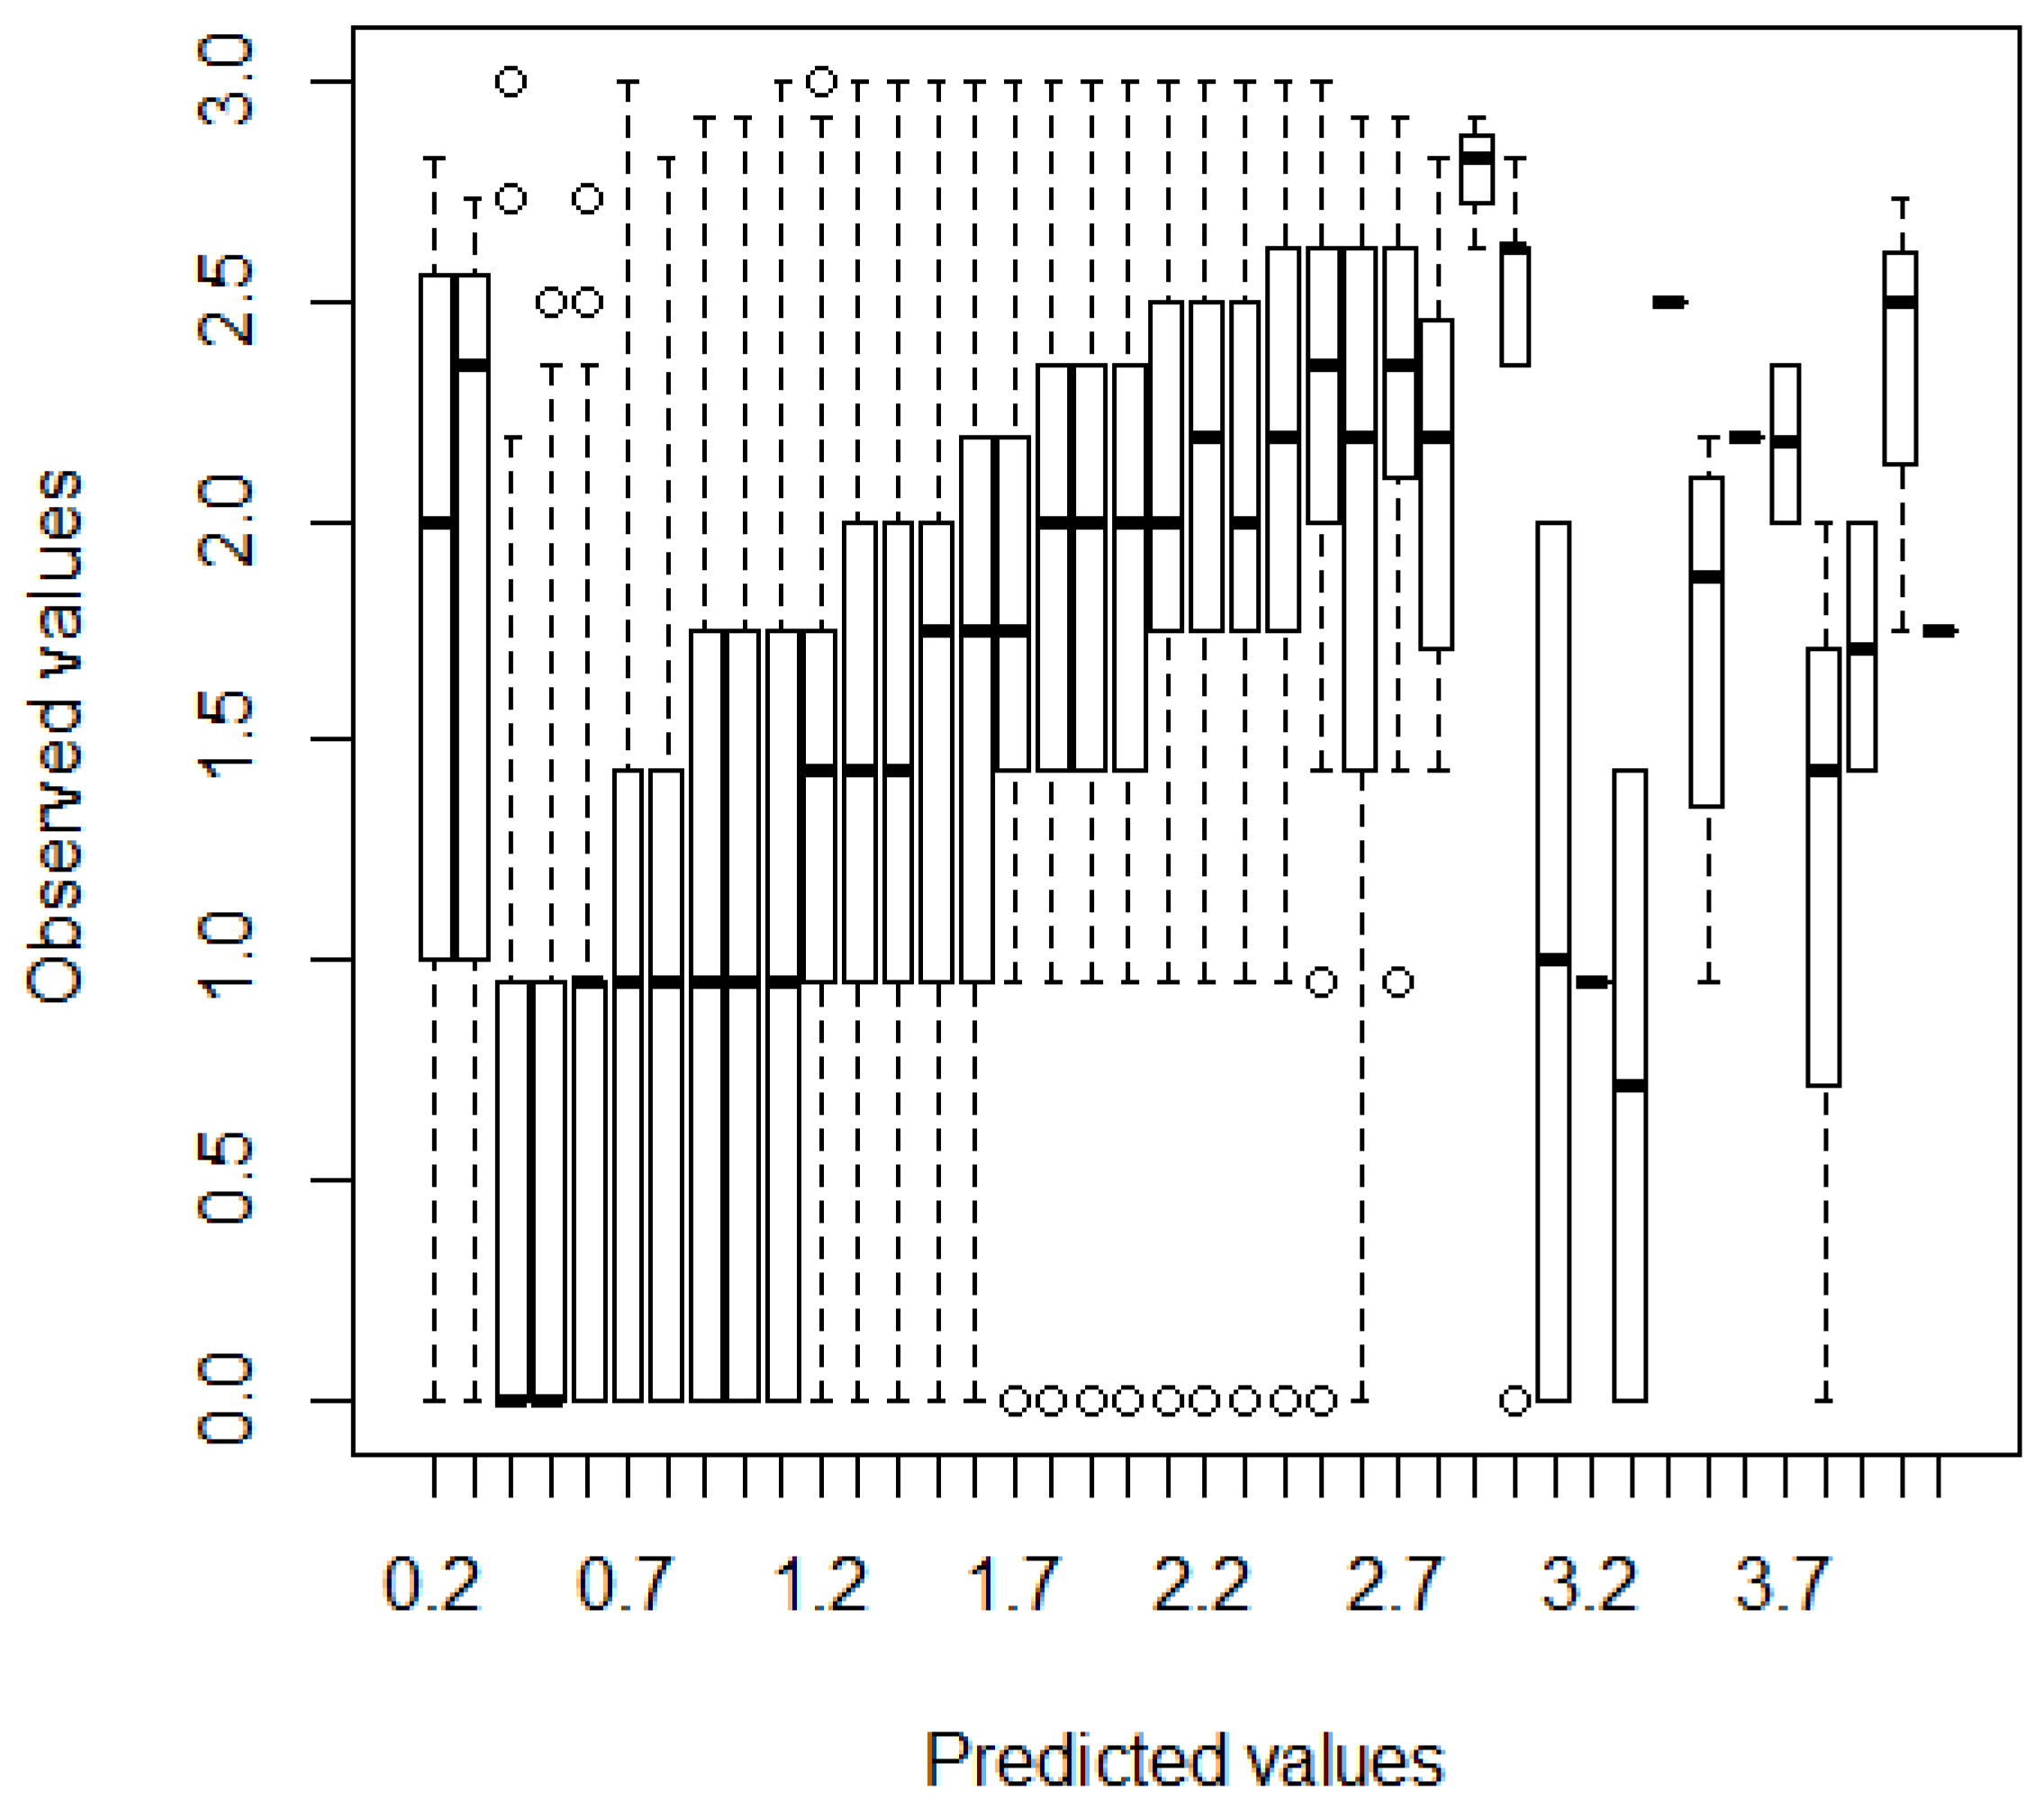
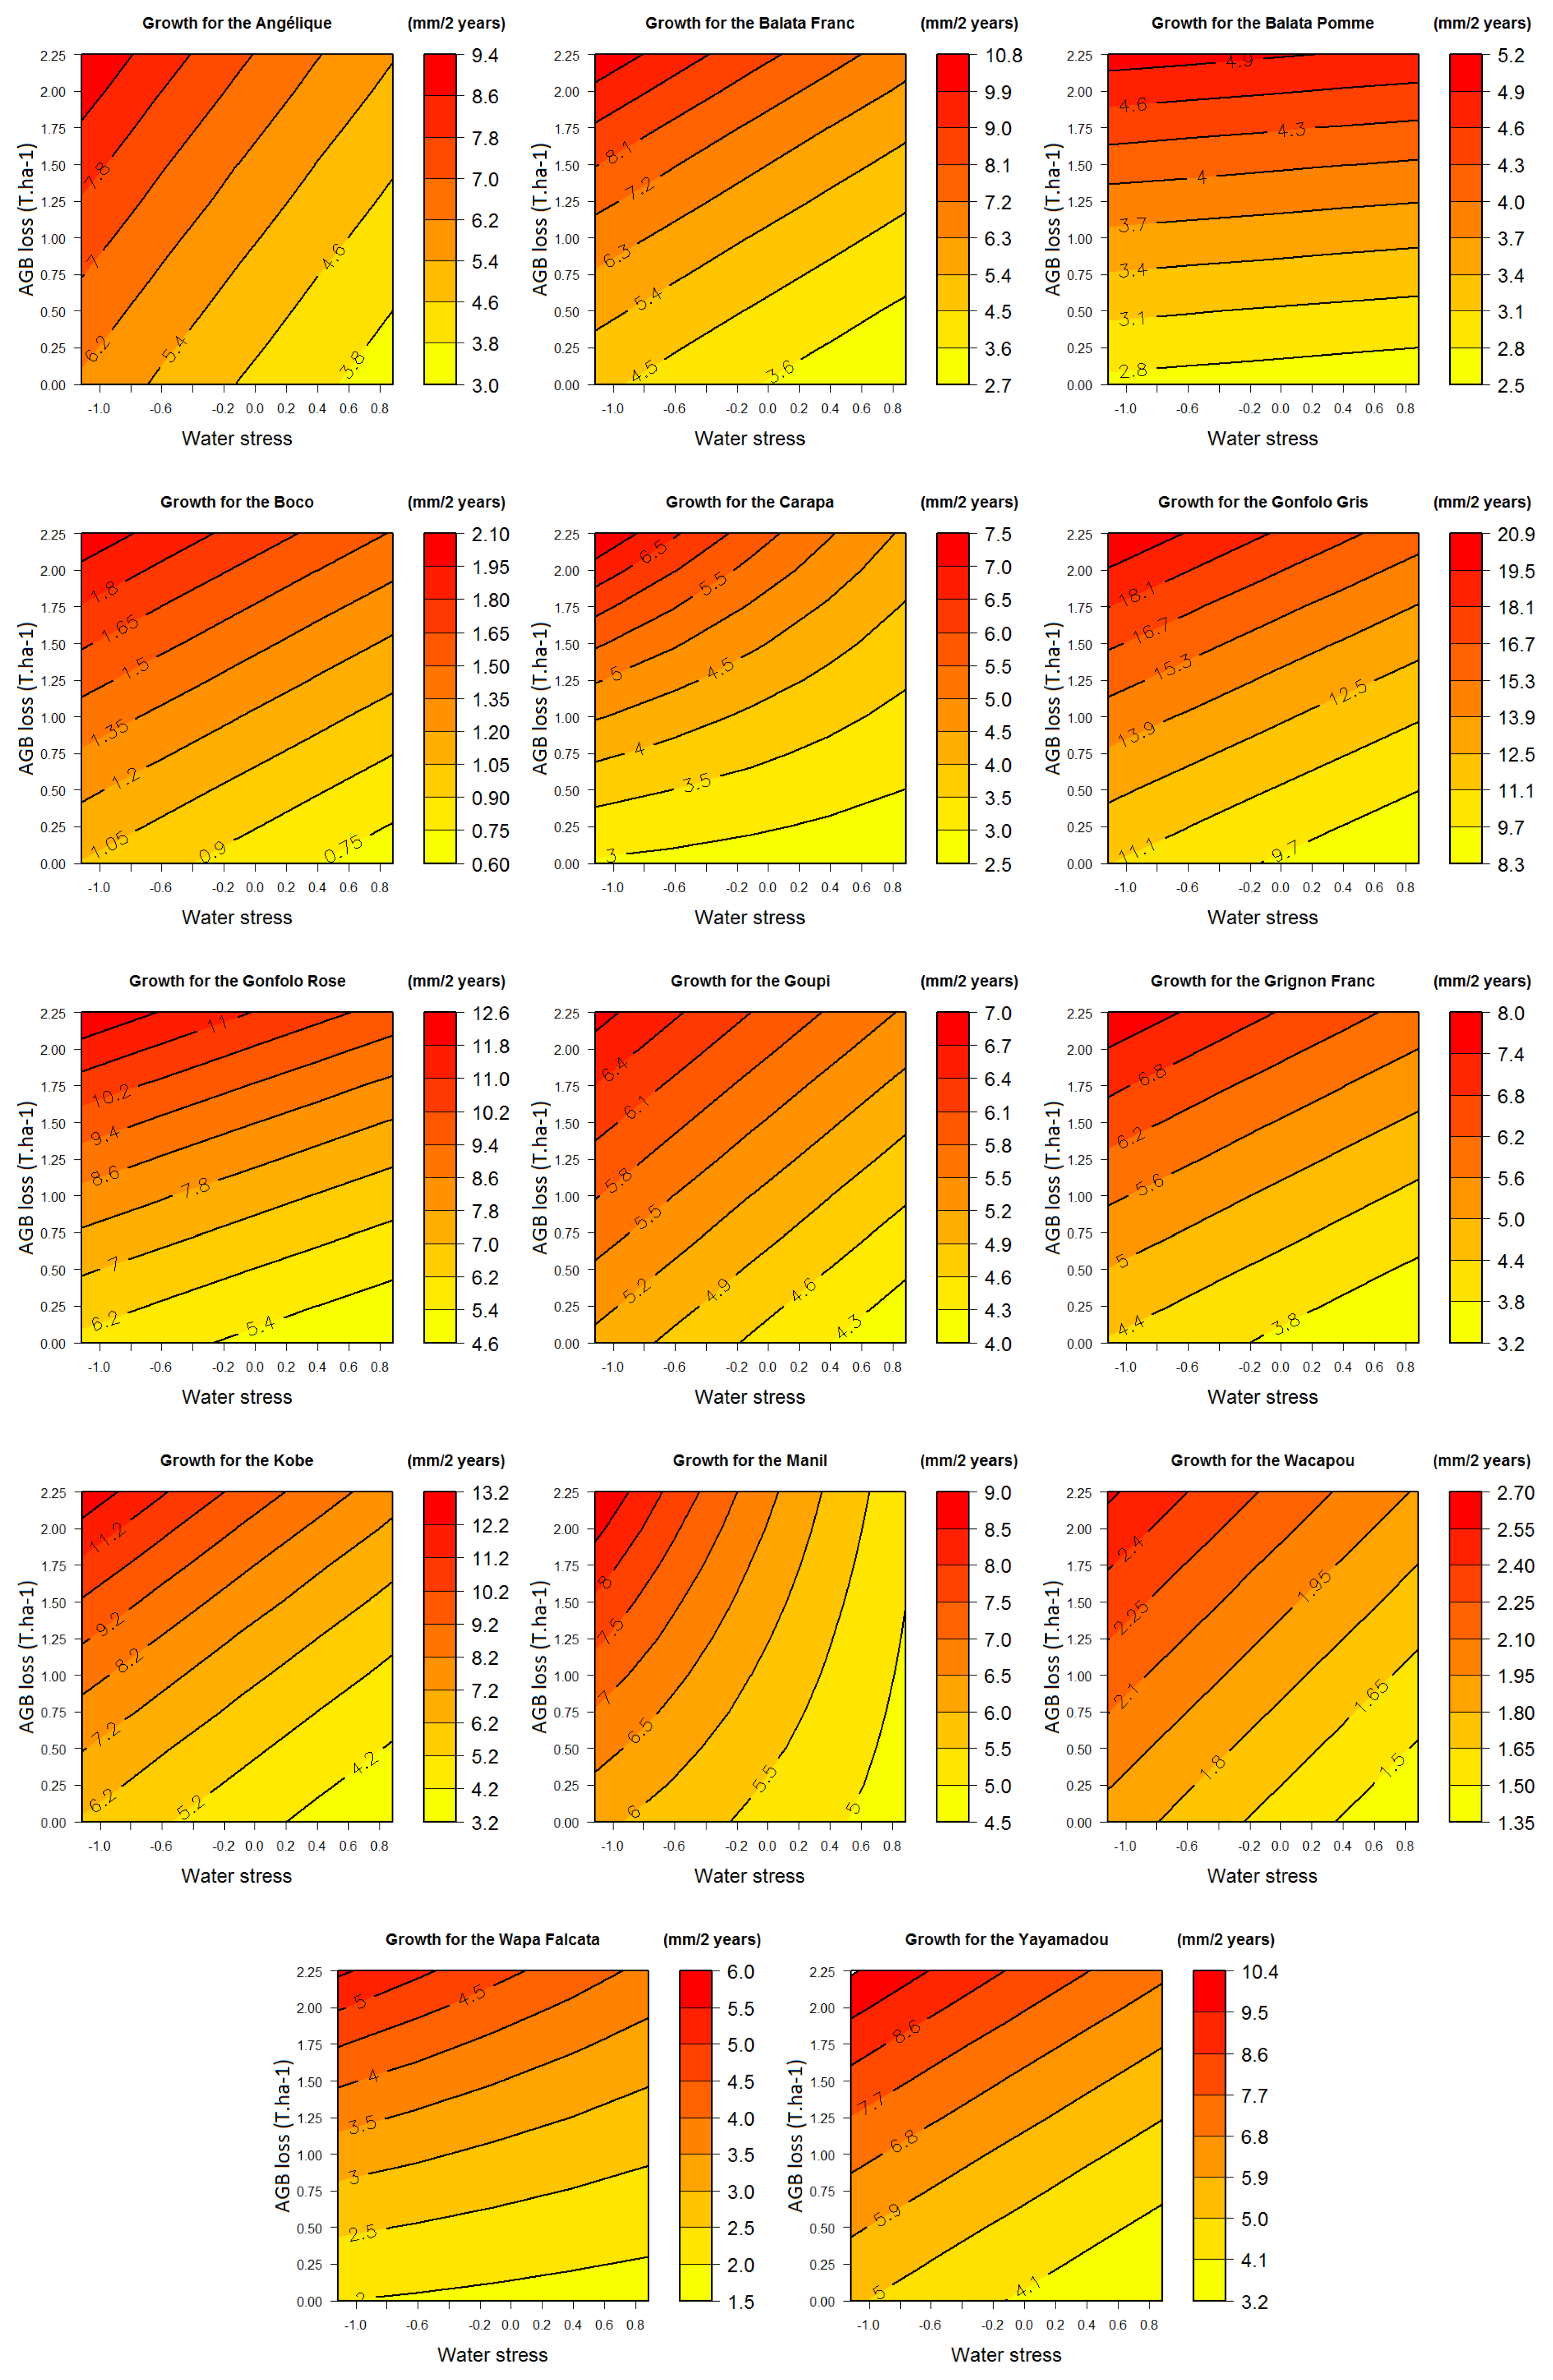
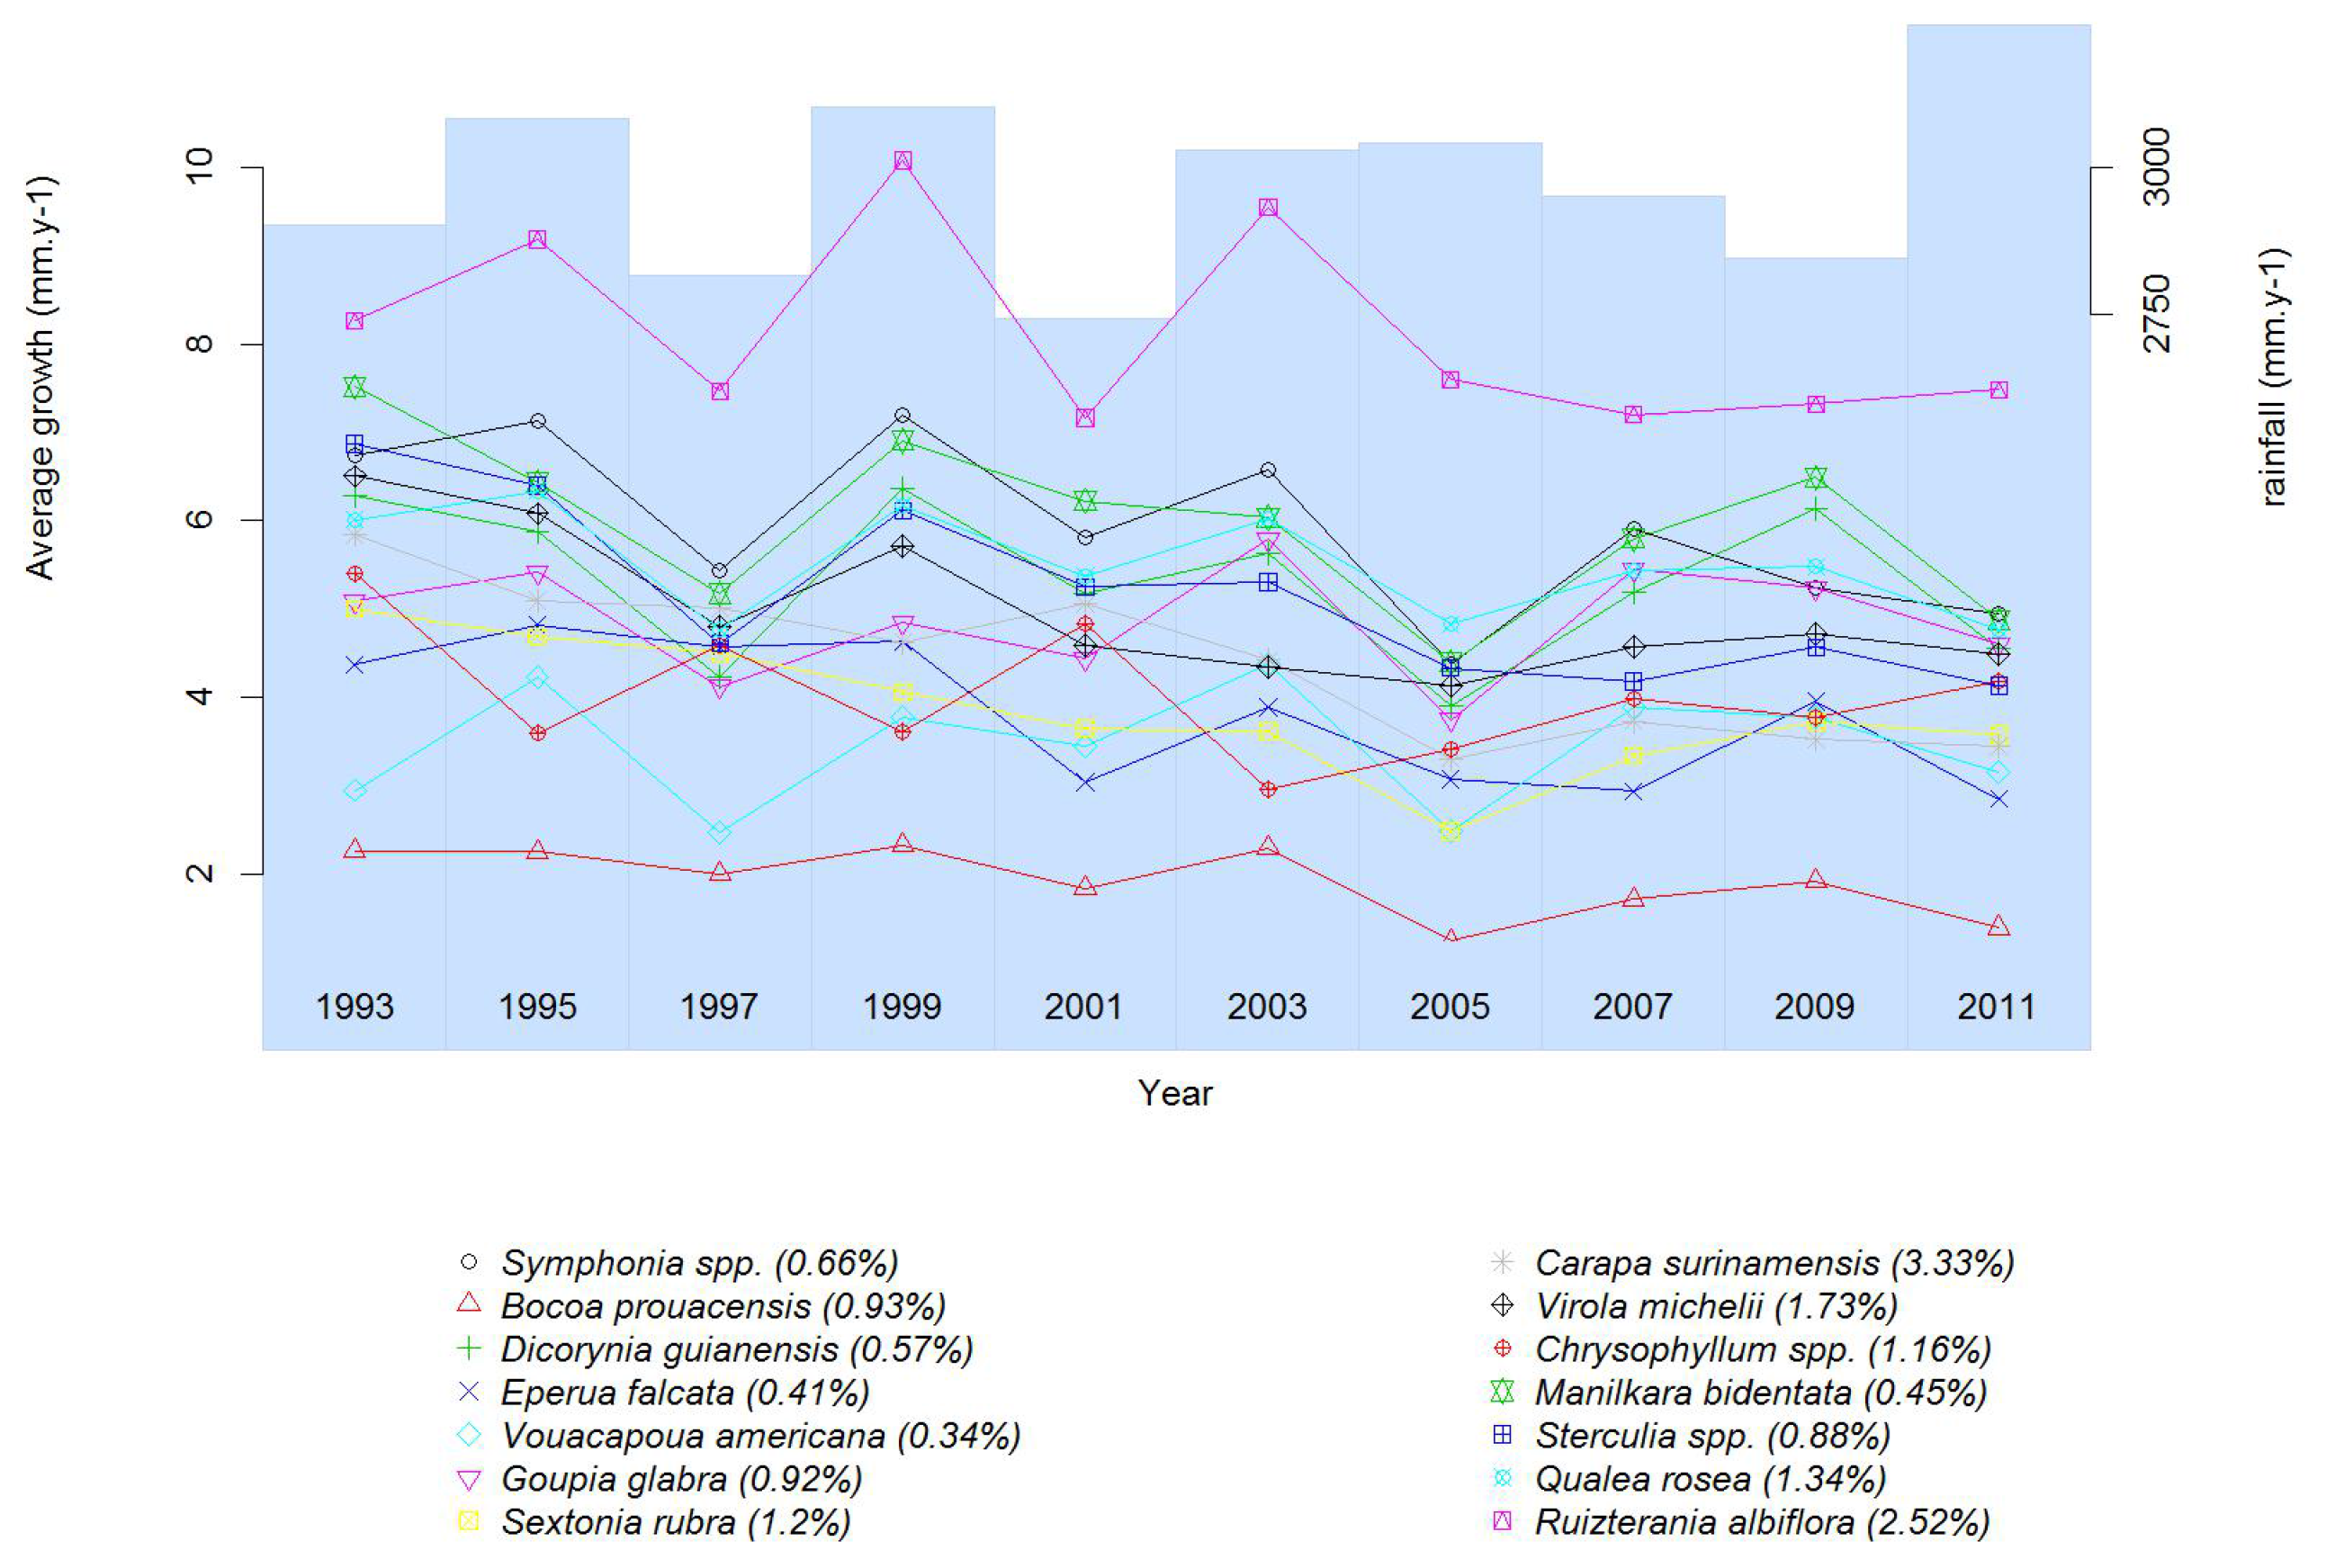
3.2.1. Growth
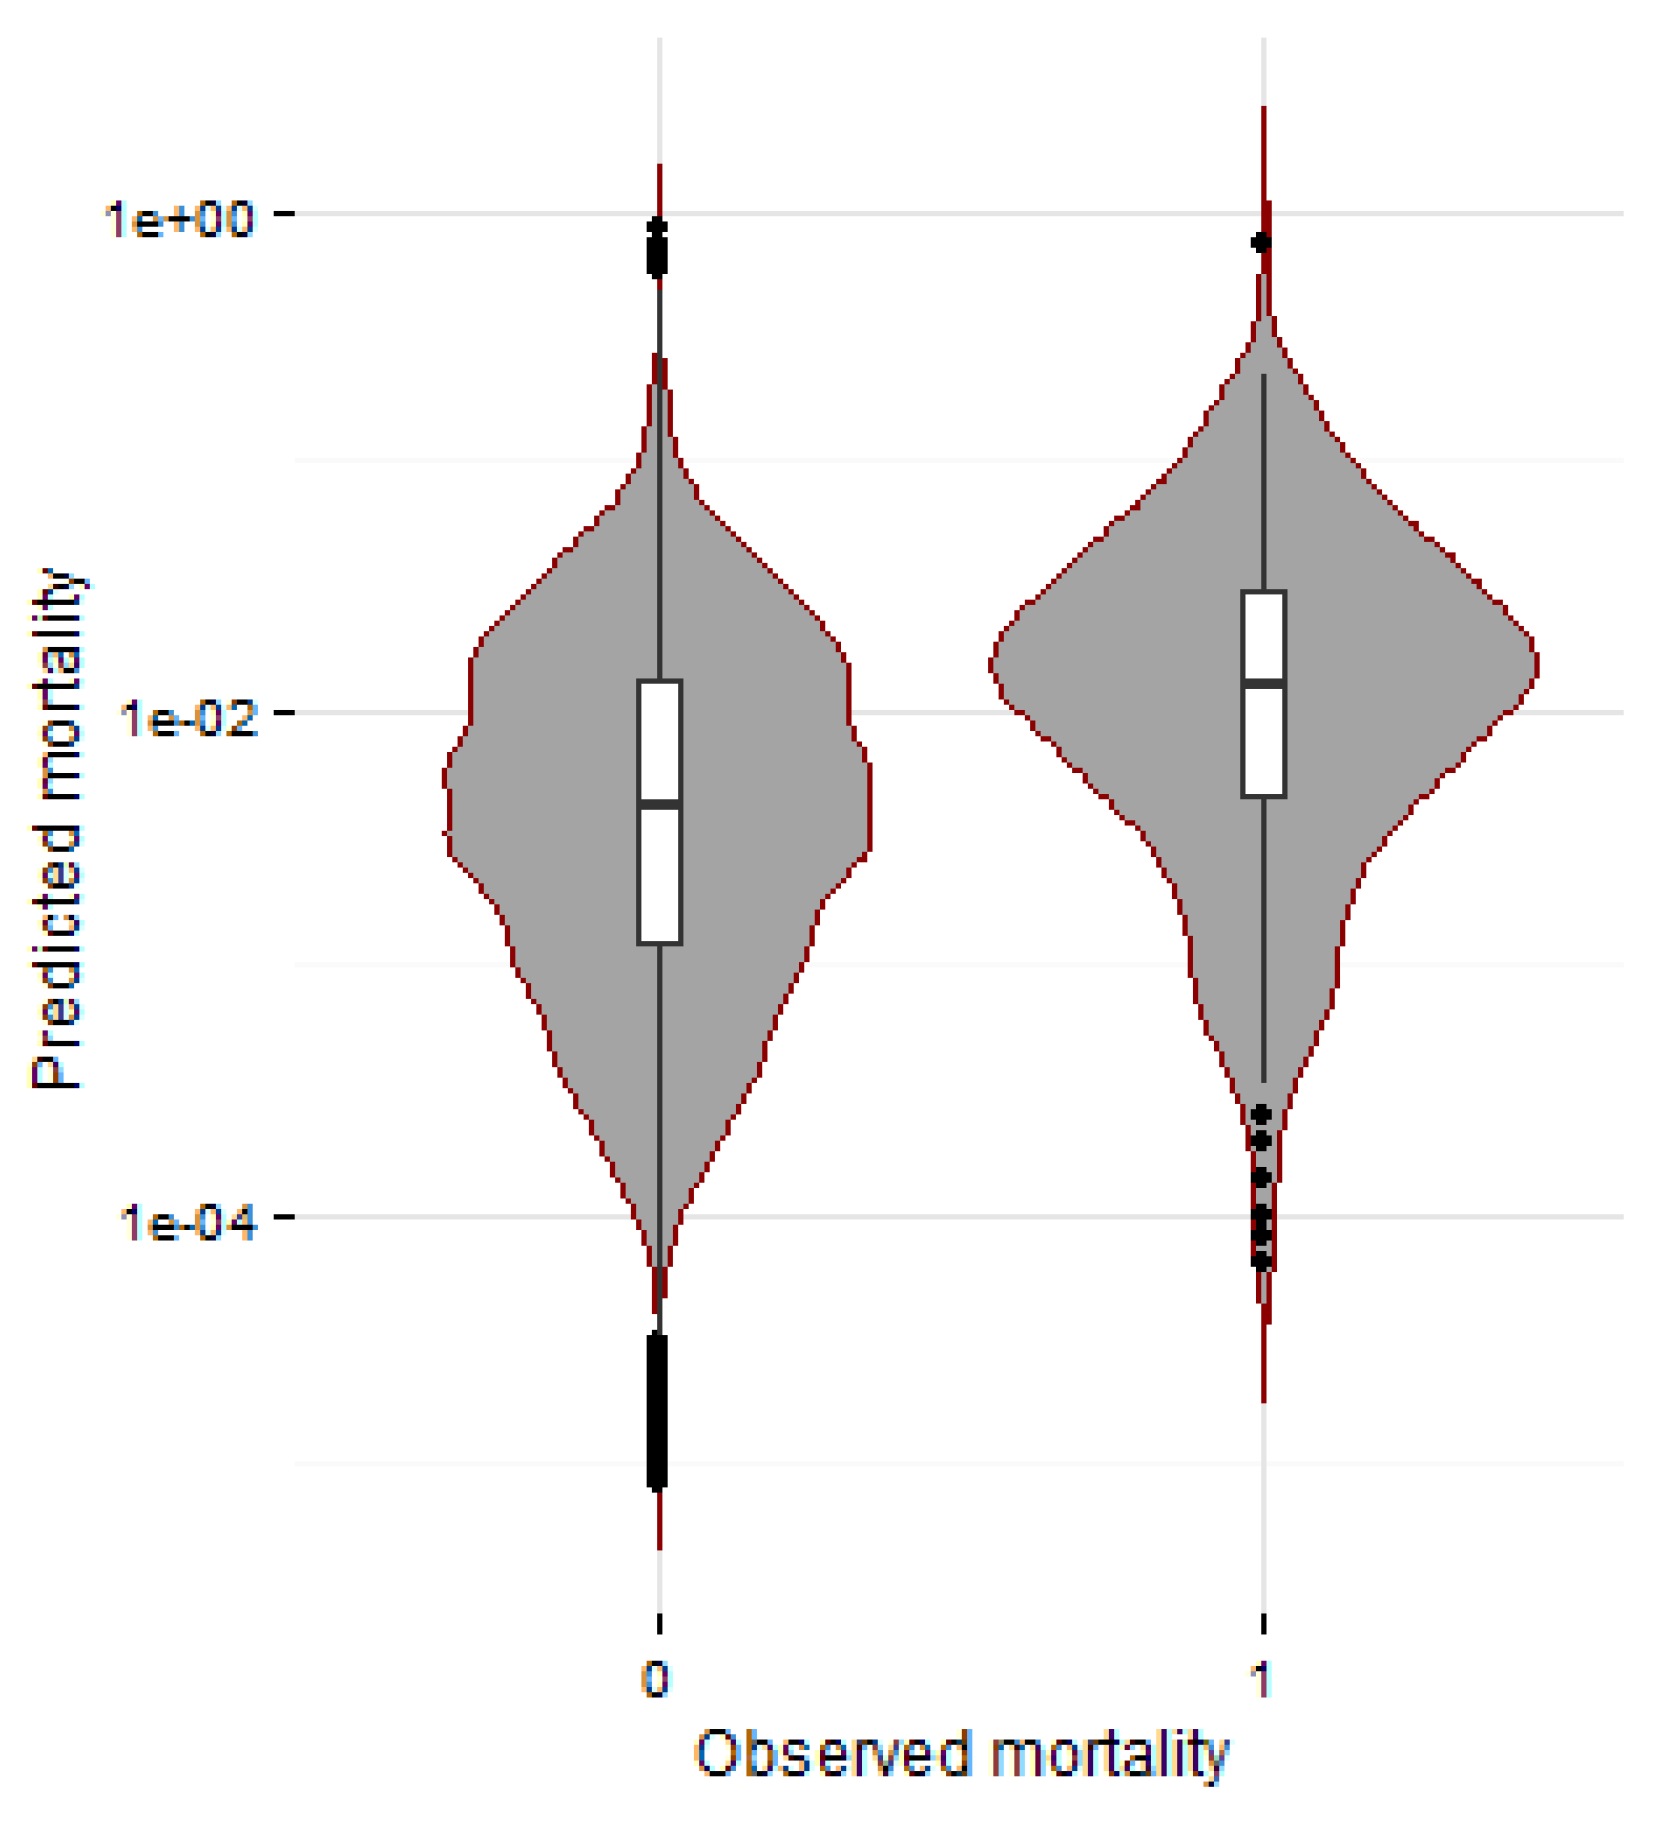
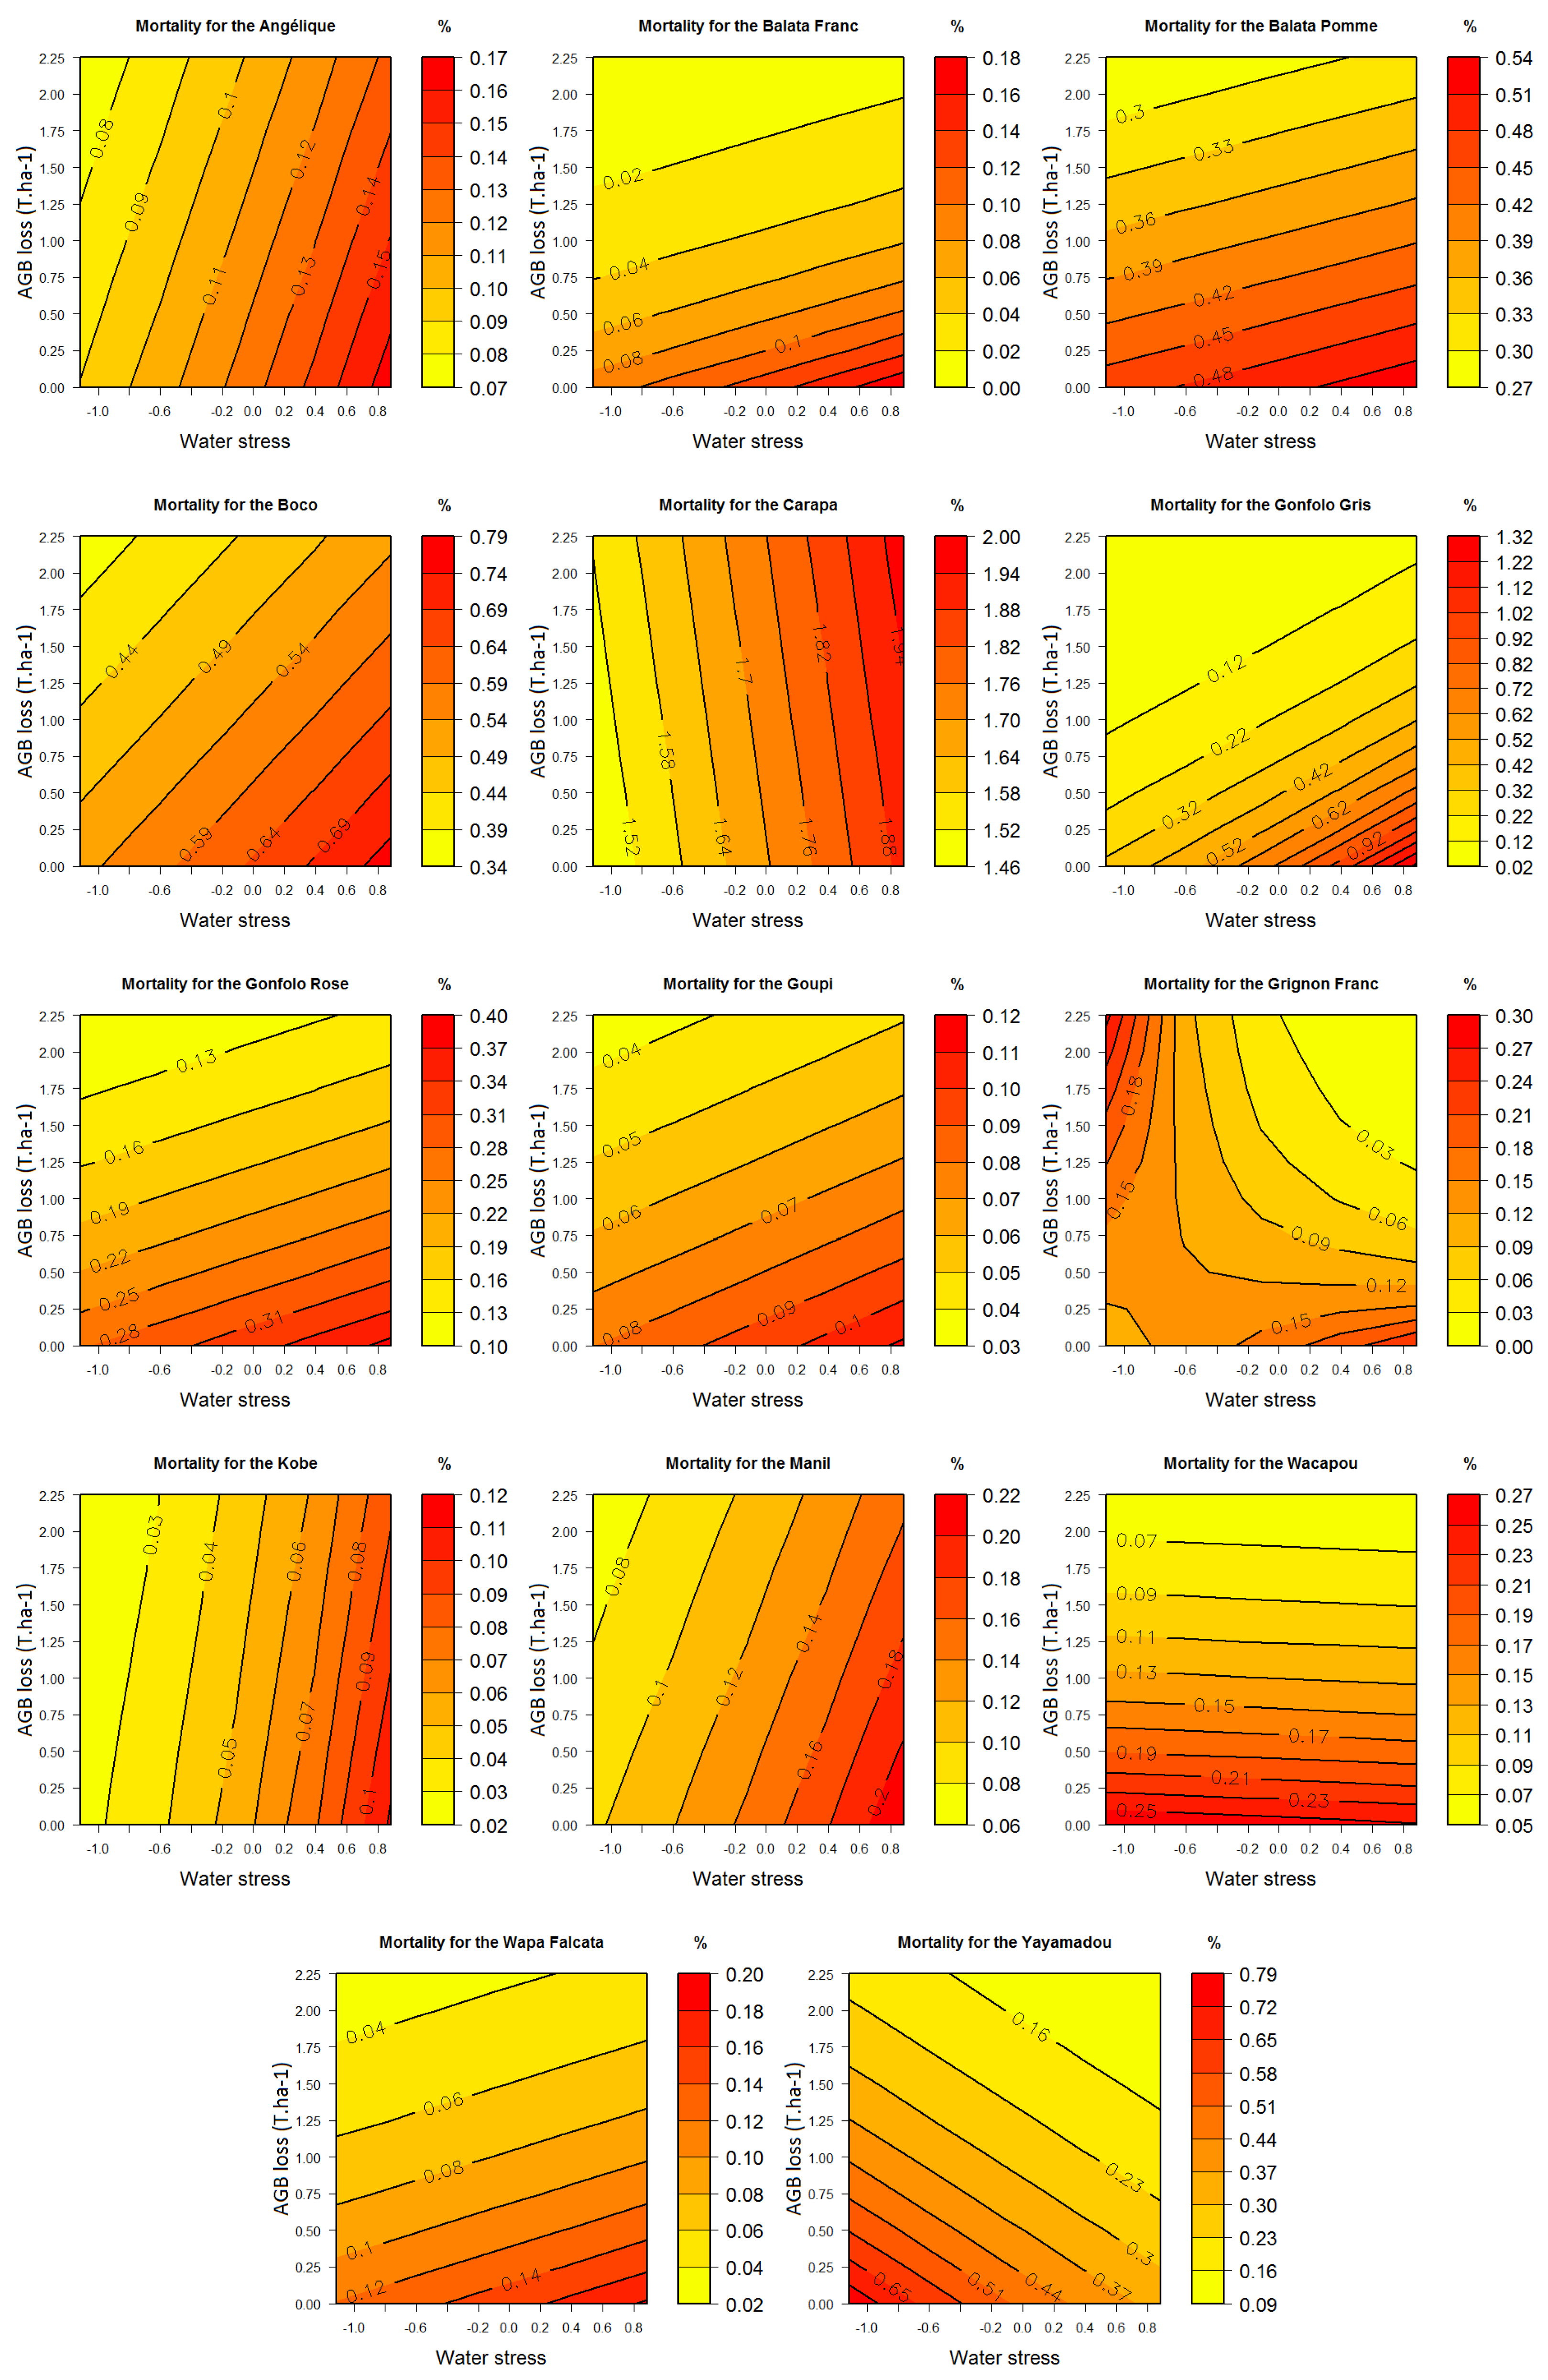
3.2.2. Mortality
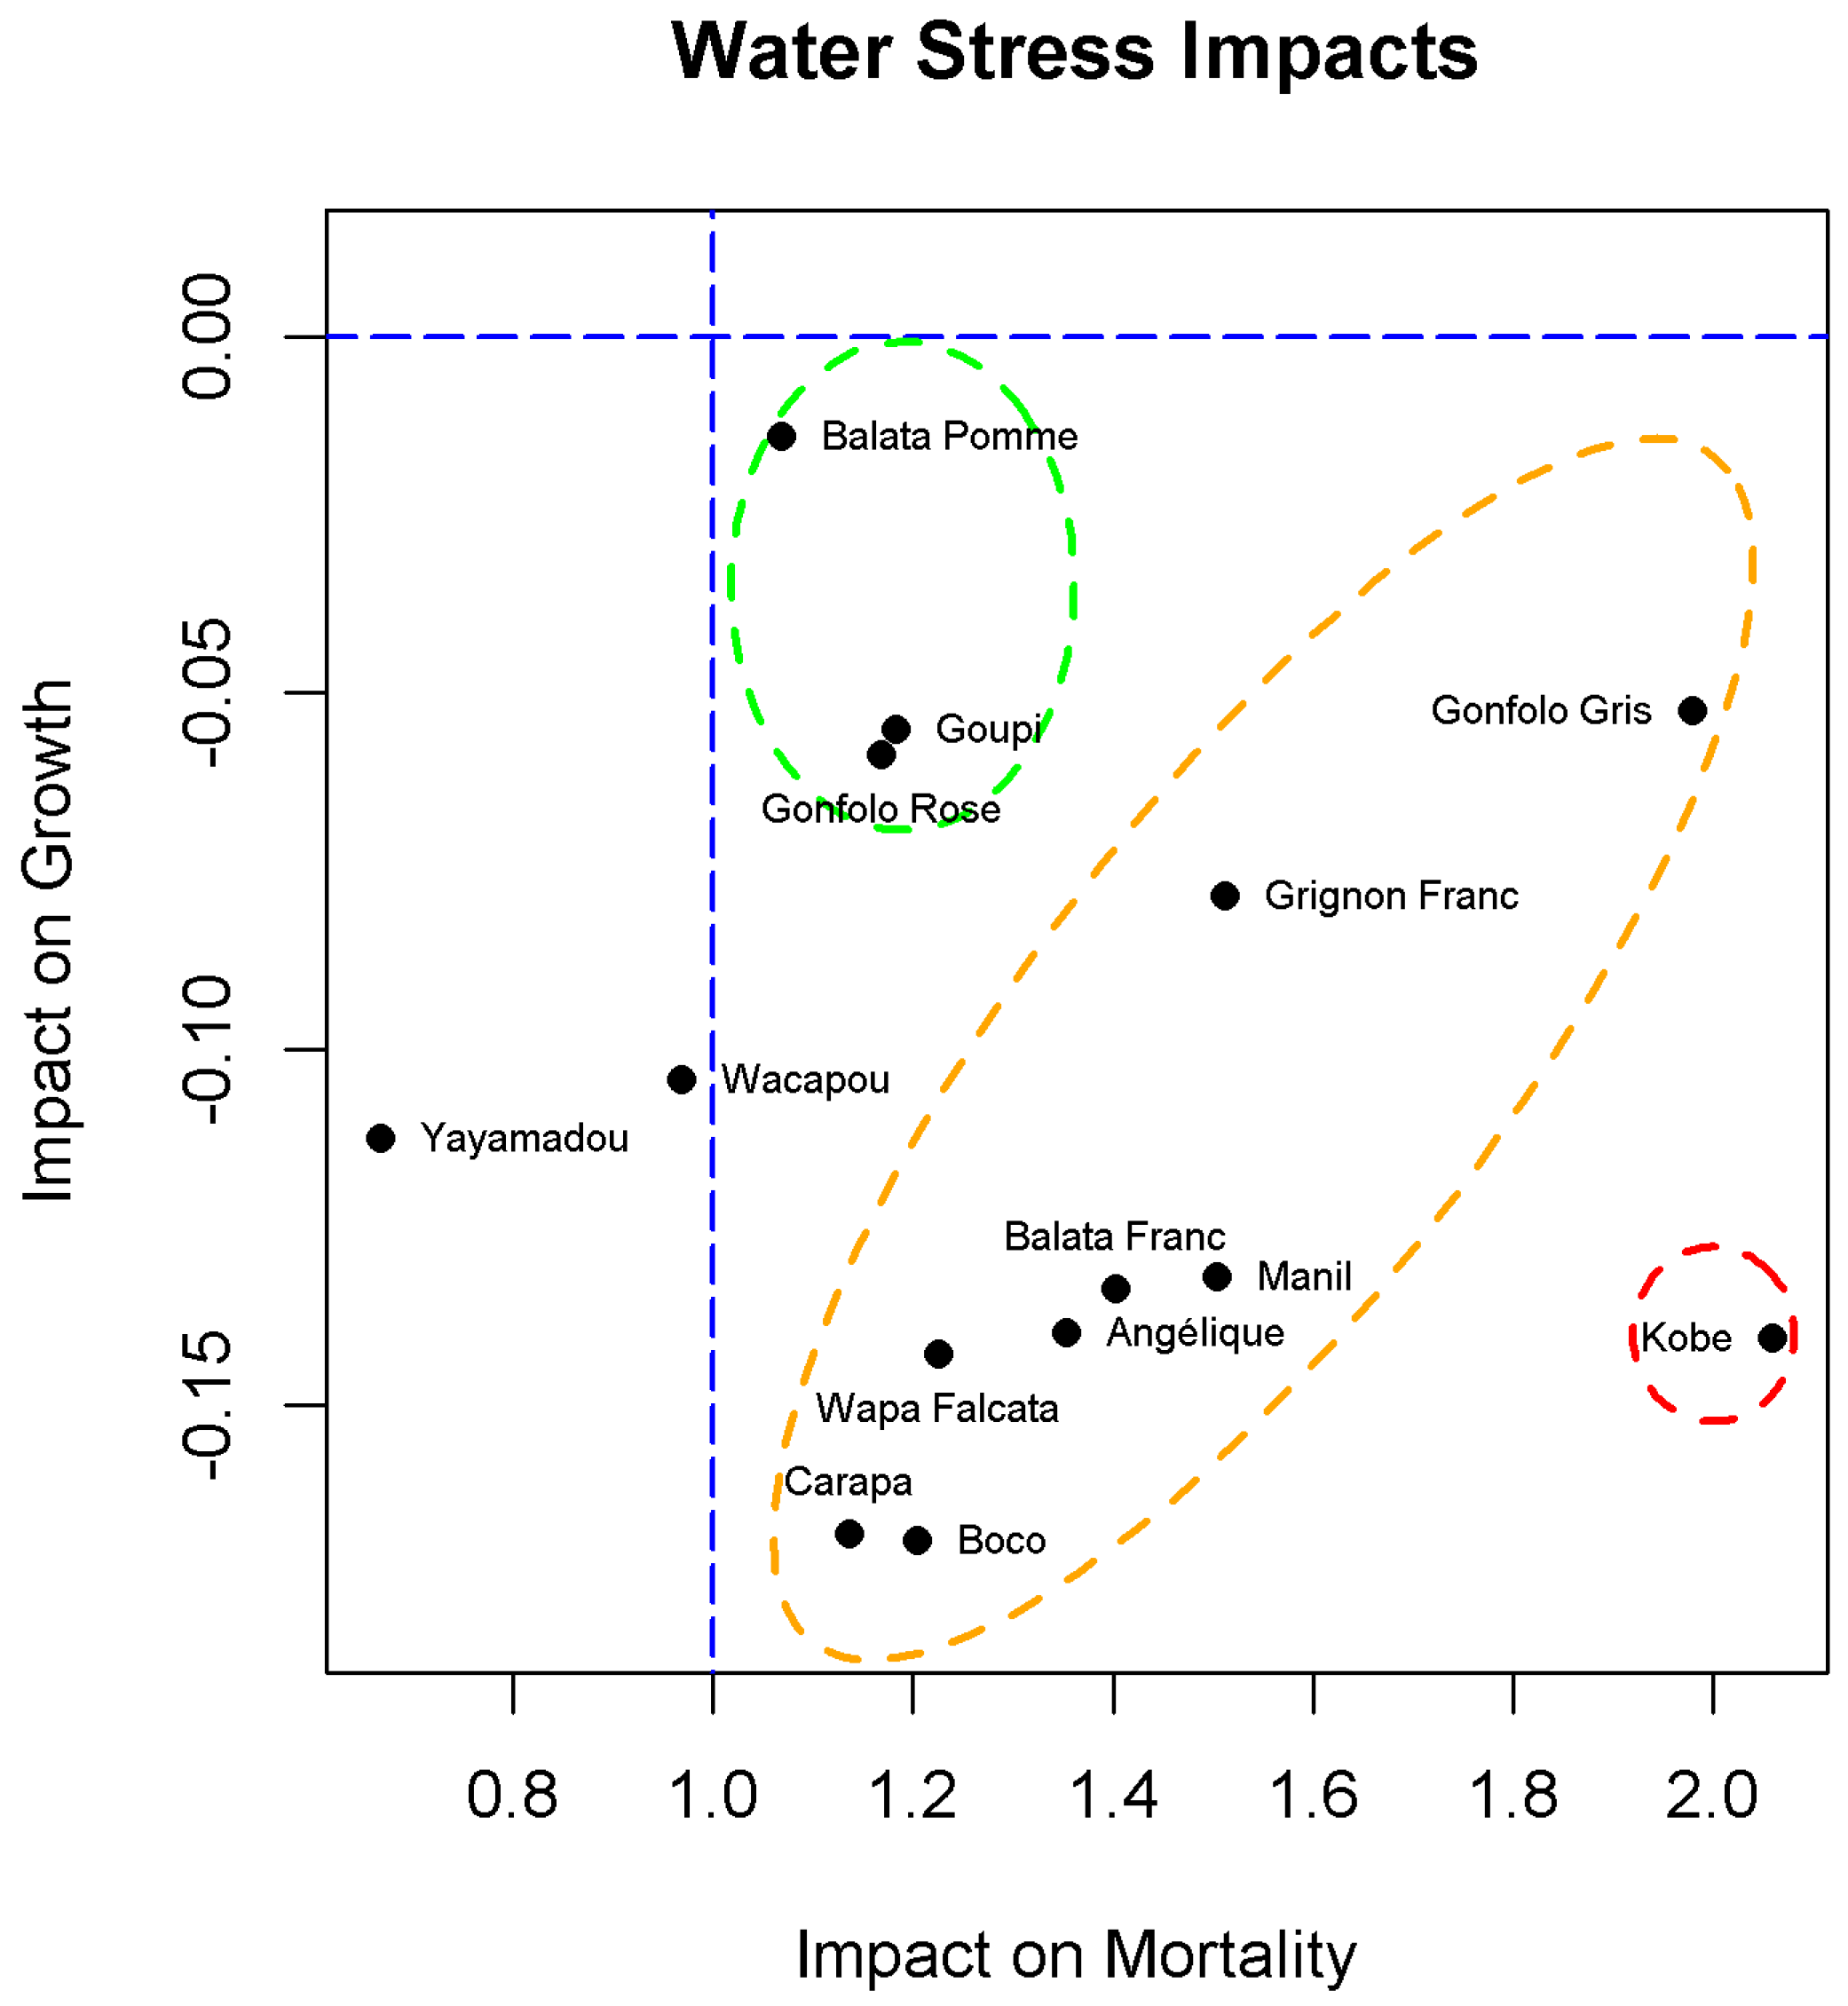
3.3. Response Profiles
4. Discussion
4.1. Growing under Water Stress
4.2. Staying Alive under Water Stress
4.3. Reducing the Competition to Improve the Water Budget
4.4. Guidelines for Forest Management
5. Conclusions
Acknowledgments
Author Contributions
Conflicts of Interest
Appendix A.


| Species | Parameter | Median | 0.05 | 0.95 | Species | Parameter | Median | 0.05 | 0.95 |
|---|---|---|---|---|---|---|---|---|---|
| Angélique | −0.534 | −0.855 | −0.162 | Balata | −0.291 | −1.44 | 0.561 | ||
| −3.14 | −3.43 | −2.87 | Franc | −2.98 | −4.11 | −2.40 | |||
| 0.320 | 0.288 | 0.355 | 0.251 | 0.105 | 0.366 | ||||
| 0.308 | −0.037 | 0.619 | 0.312 | −0.517 | 1.09 | ||||
| −0.111 | −0.461 | 0.207 | −1.17 | −2.68 | −0.103 | ||||
| - | - | - | - | - | - | ||||
| 1.69 | 1.65 | 1.73 | 1.63 | 1.57 | 1.71 | ||||
| −0.24 | −0.26 | −0.21 | −0.219 | −0.272 | −0.164 | ||||
| 0.17 | 0.14 | 0.20 | 0.339 | 0.285 | 0.399 | ||||
| - | - | - | - | - | - | ||||
| 29.7 | 29.1 | 30.4 | 46.6 | 40.7 | 61.5 | ||||
| 0.879 | 0.843 | 0.915 | 1.23 | 1.07 | 1.52 | ||||
| 0.601 | 0.577 | 0.621 | 0.490 | 0.455 | 0.536 | ||||
| Balata | −0.452 | −0.958 | −0.0182 | Boco | −0.520 | −0.733 | −0.277 | ||
| Pomme | −3.45 | −3.86 | −3.09 | −3.37 | −3.53 | −3.24 | |||
| 0.542 | 0.468 | 0.624 | 0.519 | 0.488 | 0.555 | ||||
| 0.0848 | −0.402 | 0.498 | 0.188 | 0.0113 | 0.393 | ||||
| −0.240 | −0.640 | 0.107 | −0.164 | −0.351 | −0.00925 | ||||
| - | - | - | - | - | - | ||||
| 1.30 | 1.25 | 1.38 | 0.600 | 0.582 | 0.622 | ||||
| −0.0167 | −0.0720 | 0.0302 | −0.102 | −0.118 | −0.0842 | ||||
| 0.212 | 0.175 | 0.253 | 0.179 | 0.164 | 0.193 | ||||
| - | - | - | - | - | - | ||||
| 25.7 | 24.7 | 26.6 | 28.3 | 25.1 | 39.4 | ||||
| 0.663 | 0.617 | 0.729 | 1.45 | 1.18 | 2.33 | ||||
| 0.667 | 0.632 | 0.713 | 0.494 | 0.438 | 0.506 | ||||
| Carapa | −0.559 | −0.736 | −0.386 | Gonfolo | −0.256 | −0.804 | 0.356 | ||
| −2.94 | −3.13 | −2.71 | Gris | −2.05 | −2.69 | −1.57 | |||
| 0.515 | 0.459 | 0.568 | 0.205 | 0.138 | 0.291 | ||||
| 0.131 | −0.0625 | 0.329 | 0.691 | 0.143 | 1.22 | ||||
| 0.0152 | −0.157 | 0.163 | −1.18 | −2.29 | −0.15 | ||||
| - | - | - | - | - | - | ||||
| 1.33 | 1.30 | 1.37 | 2.35 | 2.27 | 2.45 | ||||
| −0.0353 | −0.0796 | 0.00127 | −0.128 | −0.200 | −0.0593 | ||||
| 0.248 | 0.228 | 0.270 | 0.266 | 0.193 | 0.347 | ||||
| −0.0845 | −0.115 | −0.0577 | - | - | - | ||||
| 25.7 | 24.1 | 28.7 | 40.2 | 37.6 | 43.5 | ||||
| 1.20 | 1.03 | 1.55 | 1.07 | 0.965 | 1.21 | ||||
| 0.636 | 0.614 | 0.659 | 0.483 | 0.441 | 0.533 | ||||
| Gonfolo | −0.983 | −1.23 | −0.720 | Goupi | −0.960 | −1.56 | −0.385 | ||
| Rose | −2.36 | −2.55 | −2.21 | −3.01 | −3.32 | −2.66 | |||
| 0.231 | 0.212 | 0.252 | 0.280 | 0.237 | 0.325 | ||||
| 0.175 | −0.0849 | 0.423 | 0.166 | −0.297 | 0.608 | ||||
| −0.432 | −0.678 | −0.161 | −0.364 | −0.899 | 0.111 | ||||
| - | - | - | - | - | - | ||||
| 1.83 | 1.78 | 1.87 | 1.73 | 1.67 | 1.82 | ||||
| −0.107 | −0.145 | −0.0763 | −0.0960 | −0.148 | −0.0499 | ||||
| 0.289 | 0.262 | 0.314 | 0.105 | 0.0611 | 0.150 | ||||
| - | - | - | - | - | - | ||||
| 35.0 | 34.1 | 36.1 | 29.0 | 28.0 | 30.3 | ||||
| 0.960 | 0.921 | 0.999 | 0.878 | 0.805 | 0.957 | ||||
| 0.755 | 0.725 | 0.778 | 0.760 | 0.726 | 0.805 | ||||
| Grignon | −0.813 | −1.34 | −0.322 | Kobe | −0.0742 | −0.671 | 0.833 | ||
| Franc | −2.54 | −2.88 | −2.24 | −4.36 | −4.90 | −3.55 | |||
| 0.210 | 0.182 | 0.236 | 0.581 | 0.466 | 0.654 | ||||
| 0.396 | −0.0195 | 0.930 | 0.755 | −0.192 | 1.42 | ||||
| −0.682 | −1.289 | −0.0567 | −0.0818 | −0.798 | 0.604 | ||||
| −0.994 | −1.682 | −0.319 | - | - | - | ||||
| 1.61 | 1.53 | 1.68 | 1.79 | 1.71 | 1.86 | ||||
| −0.123 | −0.179 | −0.0727 | −0.253 | −0.315 | −0.190 | ||||
| 0.238 | 0.189 | 0.287 | 0.315 | 0.262 | 0.365 | ||||
| - | - | - | - | - | - | ||||
| 46.1 | 43.3 | 50.7 | 37.7 | 35.3 | 40.9 | ||||
| 0.887 | 0.825 | 0.979 | 0.958 | 0.865 | 1.07 | ||||
| 0.726 | 0.685 | 0.773 | 0.804 | 0.762 | 0.856 | ||||
| Manil | −1.06 | −1.45 | −0.605 | Wacapou | −0.443 | −0.748 | −0.171 | ||
| Marécage | −4.62 | −5.09 | −4.20 | −2.81 | −2.97 | −2.63 | |||
| 0.791 | 0.709 | 0.885 | 0.296 | 0.267 | 0.320 | ||||
| 0.404 | −0.0364 | 0.882 | −0.0224 | −0.330 | 0.257 | ||||
| −0.142 | −0.567 | 0.276 | −0.666 | −1.07 | −0.367 | ||||
| - | - | - | - | - | - | ||||
| 1.85 | 1.81 | 1.88 | 1.04 | 1.01 | 1.07 | ||||
| −0.106 | −0.131 | −0.076 | −0.108 | −0.132 | -0.0869 | ||||
| 0.0816 | 0.0610 | 0.1005 | 0.103 | 0.0821 | 0.123 | ||||
| −0.0610 | −0.0841 | −0.0365 | - | - | - | ||||
| 24.9 | 24.1 | 25.5 | 17.4 | 14.0 | 19.7 | ||||
| 0.920 | 0.865 | 0.997 | 1.46 | 1.25 | 1.79 | ||||
| 0.481 | 0.465 | 0.498 | 0.729 | 0.709 | 0.748 | ||||
| Wapa | −0.648 | −0.821 | −0.460 | Yayamadou | −1.64 | 2.01 | −1.16 | ||
| −3.08 | −3.23 | −2.97 | Montagne | −4.18 | −4.61 | −3.61 | |||
| 0.314 | 0.299 | 0.334 | 0.817 | 0.677 | 0.914 | ||||
| 0.196 | 0.0535 | 0.356 | −0.436 | −1.07 | −0.0885 | ||||
| −0.613 | −0.831 | −0.378 | −0.589 | −0.976 | −0.0941 | ||||
| - | - | - | - | - | - | ||||
| 1.06 | 1.04 | 1.07 | 1.61 | 1.54 | 1.70 | ||||
| −0.0388 | −0.0531 | −0.0228 | −0.180 | −0.231 | −0.135 | ||||
| 0.294 | 0.282 | 0.306 | 0.280 | 0.238 | 0.323 | ||||
| −0.0497 | −0.0531 | −0.0228 | - | - | - | ||||
| 31.3 | 30.4 | 32.3 | 26.4 | 25.7 | 27.4 | ||||
| 1.16 | 1.11 | 1.22 | 0.677 | 0.631 | 0.750 | ||||
| 0.648 | 0.639 | 0.658 | 0.682 | 0.641 | 0.727 |

References
- Bonal, D.; Burban, B.; Stahl, C.; Wagner, F.; Hérault, B. The response of tropical rainforests to drought lessons from recent research and future prospects. Ann. For. Sci. 2016, 73, 27–44. [Google Scholar] [CrossRef] [PubMed] [Green Version]
- Hérault, B.; Gourlet-Fleury, S. Will Tropical Rainforests Survive Climate Change? Clim. Chang. Agric. Worldw. 2016, 14, 183–196. [Google Scholar]
- Brienen, R.J.W.; Phillips, O.L.; Feldpausch, T.R.; Gloor, E.; Baker, T.R.; Lloyd, J.; Lopez-Gonzalez, G.; Monteagudo-Mendoza, A.; Malhi, Y.; Lewis, S.L.; et al. Long-term decline of the Amazon carbon sink. Nature 2015, 519, 344–348. [Google Scholar] [CrossRef] [PubMed] [Green Version]
- IPCC. Climate Change 2013: The Physical Science Basis: Working Group I Contribution to the Fifth Assessment Report of the Intergovernmental Panel on Climate Change; Cambridge University Press: Cambridge, UK, 2013. [Google Scholar]
- Joetzjer, E.; Douville, H.; Delire, C.; Ciais, P. Present-day and future Amazonian precipitation in global climate models: CMIP5 vs. CMIP3. Clim. Dyn. 2013, 41, 2921–2936. [Google Scholar] [CrossRef]
- Wagner, F.H.; Hérault, B.; Bonal, D.; Stahl, C.; Anderson, L.O.; Baker, T.R.; Becker, G.S.; Beeckman, H.; Boanerges Souza, D.; Botosso, P.C.; et al. Climate seasonality limits leaf carbon assimilation and wood productivity in tropical forests. Biogeosciences 2016, 13, 2537–2562. [Google Scholar] [CrossRef] [Green Version]
- Fu, R.; Yin, L.; Li, W.; Arias, P.A.; Dickinson, R.E.; Huang, L.; Chakraborty, S.; Fernandes, K.; Liebmann, B.; Fisher, R.; et al. Increased dry-season length over southern Amazonia in recent decades and its implication for future climate projection. Proc. Natl. Acad. Sci. USA 2013, 110, 18110–18115. [Google Scholar] [CrossRef] [PubMed]
- Malhi, Y.; Phillips, O.L. Tropical forests and global atmospheric change: A synthesis. Philos. Trans. R. Soc. Lond. Ser. B Biol. Sci. 2004, 359, 549–555. [Google Scholar] [CrossRef] [PubMed]
- Allen, C.D.; Macalady, A.K.; Chenchouni, H.; Bachelet, D.; McDowell, N.; Vennetier, M.; Kitzberger, T.; Rigling, A.; Breshears, D.D.; Hogg, E.H.; et al. A global overview of drought and heat-induced tree mortality reveals emerging climate change risks for forests. For. Ecol. Manag. 2010, 259, 660–684. [Google Scholar] [CrossRef]
- Choat, B.; Jansen, S.; Brodribb, T.J.; Cochard, H.; Delzon, S.; Bhaskar, R.; Bucci, S.J.; Feild, T.S.; Gleason, S.M.; Hacke, U.G.; et al. Global convergence in the vulnerability of forests to drought. Nature 2012, 491, 752–755. [Google Scholar] [CrossRef] [PubMed]
- Wagner, F.; Rossi, V.; Aubry-Kientz, M.; Bonal, D.; Dalitz, H.; Gliniars, R.; Stahl, C.; Trabucco, A.; Hérault, B. Pan-tropical analysis of climate effects on seasonal tree growth. PLoS ONE 2014, 9, e92337. [Google Scholar] [CrossRef] [PubMed] [Green Version]
- Aubry-Kientz, M.; Rossi, V.; Wagner, F.; Hérault, B. Identifying climatic drivers of tropical forest dynamics. Biogeosciences 2015, 12, 5583–5596. [Google Scholar] [CrossRef] [Green Version]
- Phillips, O.L.; Aragao, L.; Lewis, S.L.; Fisher, J.B.; Lloyd, J.; Lopez-Gonzalez, G.; Malhi, Y.; Monteagudo, A.; Peacock, J.; Quesada, C.A.; et al. Drought sensitivity of the Amazon Rainforest. Science 2009, 323, 1344–1347. [Google Scholar] [CrossRef] [PubMed] [Green Version]
- Lewis, S.L.; Brando, P.M.; Phillips, O.L.; van der Heijden, G.M.F.; Nepstad, D. The 2010 Amazon drought. Science 2011, 331, 554. [Google Scholar] [CrossRef] [PubMed]
- Nepstad, D.C.; Tohver, I.M.; Ray, D.; Moutinho, P.; Cardinot, G. Mortality of large trees and lianas following experimental drought in an Amazon forest. Ecology 2007, 88, 2259–2269. [Google Scholar] [CrossRef] [PubMed]
- Brando, P.M.; Nepstad, D.C.; Davidson, E.A.; Trumbore, S.E.; Ray, D.; Camargo, P. Drought effects on littefall, wood production and belowground carbon cycling in an Amazon Forest: Result of a throughfall reduction experiment. Philos. Trans. R. Soc. 2008, 363, 1839–1848. [Google Scholar] [CrossRef] [PubMed]
- Coomes, D.A.; Flores, O.; Holdaway, R.; Jucker, T.; Lines, E.R.; Vanderwel, M.C. Wood production response to climate change will depend critically on forest composition and structure. Glob. Chang. Biol. 2014, 20, 3632–3645. [Google Scholar] [CrossRef] [PubMed]
- Clark, J.S.; Bell, D.M.; Kwit, M.C.; Zhu, K. Competition-interaction landscapes for the joint response of forests to climate change. Glob. Chang. Biol. 2014, 20, 1979–1991. [Google Scholar] [CrossRef] [PubMed]
- Kunstler, G.; Falster, D.; Coomes, D.A.; Hui, F.; Kooyman, R.M.; Laughlin, D.C.; Poorter, L.; Vanderwel, M.; Vieilledent, G.; Wright, S.J.; et al. Plant functional traits have globally consistent effects on competition. Nature 2016, 529, 204–207. [Google Scholar] [CrossRef] [PubMed]
- Laurans, M.; Hérault, B.; Vieilledent, G.; Vincent, G. Vertical stratification reduces competition for light in dense tropical forests. For. Ecol. Manag. 2014, 329, 79–88. [Google Scholar] [CrossRef]
- Blaser, J. Status of Tropical Forest Management 2011; International Tropical Timber Organization: Yokohama, Japan, 2011. [Google Scholar]
- Gibson, L.; Lee, T.M.; Koh, L.P.; Brook, B.W.; Gardner, T.A.; Barlow, J.; Peres, C.A.; Bradshaw, C.J.A.; Laurance, W.F.; Lovejoy, T.E.; et al. Primary forests are irreplaceable for sustaining tropical biodiversity. Nature 2011, 478, 378–381. [Google Scholar] [CrossRef] [PubMed]
- Putz, F.E.; Zuidema, P.A.; Synnott, T.; Peña Claros, M.; Pinard, M.A.; Sheil, D.; Vanclay, J.K.; Sist, P.; Gourlet-Fleury, S.; Griscom, B.; et al. Sustaining conservation values in selectively logged tropical forests: The attained and the attainable. Conserv. Lett. 2012, 5, 296–303. [Google Scholar] [CrossRef]
- Asner, G.P.; Knapp, D.E.; Broadbent, E.N.; Oliveira, P.J.C.; Keller, M.; Silva, J.N. Selective logging in the Brazilian Amazon. Science 2005, 310, 480–482. [Google Scholar] [CrossRef] [PubMed]
- Rutishauser, E.; Hérault, B.; Baraloto, C.; Blanc, L.; Descroix, L.; Sotta, E.D.; Ferreira, J.; Kanashiro, M.; Mazzei, L.; D’Oliveira, M.V.; et al. Rapid tree carbon stock recovery in managed Amazonian forests. Curr. Biol. 2015, 25, R787–R788. [Google Scholar] [CrossRef] [PubMed]
- Clark, J.A.; Covey, K.R. Tree species richness and the logging of natural forests: A meta-analysis. For. Ecol. Manag. 2012, 276, 146–153. [Google Scholar] [CrossRef]
- D’Amato, A.W.; Bradford, J.B.; Fraver, S.; Palik, B.J. Effects of thinning on drought vulnerability and climate response in north temperate forest ecosystems. Ecol. Appl. 2013, 23, 1735–1742. [Google Scholar] [CrossRef] [PubMed]
- D’Amato, A.W.; Bradford, J.B.; Fraver, S.; Palik, B.J. Forest management for mitigation and adaptation to climate change: Insights from long-term silviculture experiments. For. Ecol. Manag. 2011, 262, 803–816. [Google Scholar] [CrossRef]
- Puettmann, K.J. Silvicultural Challenges and Options in the Context of Global Change : “ Simple ” Fixes and Opportunities for new Management Approaches. J. For. 2011, 109, 321–331. [Google Scholar]
- Baraloto, C.; Hérault, B.; Paine, C.E.T.; Massot, H.; Blanc, L.; Bonal, D.; Molino, J.; Nicolini, E.; Sabatier, D. Contrasting taxonomic and functional responses of a tropical tree community to selective logging. J. Appl. Ecol. 2012, 49, 861–870. [Google Scholar] [CrossRef]
- Ouedraogo, D.; Mortier, F.; Gourlet-Fleury, S.; Freycon, V.; Picard, N. Slow-growing species cope best with drought: Evidence from long-term measurements in a tropical semi-deciduous moist forest of Central Africa. J. Ecol. 2013, 101, 1459–1470. [Google Scholar] [CrossRef]
- Herault, B.; Ouallet, J.; Blanc, L.; Wagner, F.; Baraloto, C. Growth responses of neotropical trees to logging gaps. J. Appl. Ecol. 2010, 47, 821–831. [Google Scholar] [CrossRef]
- Silva, J.N.M.; Carvalhoa, J.O.P.D.; Lopes, J.C.A.; Almeida, B.F.D.; Costa, D.H.M.; Oliveira, L.C.; Vanclay, J.K.; Skovsgaard, J.P. Growth and yield of a tropical rain forest in the Brazilian Amazon 13 years after logging. For. Ecol. Manag. 1995, 71, 267–274. [Google Scholar] [CrossRef] [Green Version]
- Dwyer, J.M.; Fensham, R.; Buckley, Y.M. Restoration thinning accelerates structural development and carbon sequestration in an endangered Australian ecosystem. J. Appl. Ecol. 2010, 47, 681–691. [Google Scholar] [CrossRef]
- Hammond, D.S. Tropical Forests of the Guiana Shield: Ancient Forests in a Modern World. CABI 2005. [Google Scholar]
- Guitet, S.; Pithon, S.; Brunaux, O.; Jubelin, G.; Gond, V. Impacts of logging on the canopy and the consequences for forest management in French Guiana. For. Ecol. Manag. 2012, 277, 124–131. [Google Scholar] [CrossRef]
- Wagner, F.; Rutishauser, E.; Blanc, L.; Herault, B. Effects of Plot Size and Census Interval on Descriptors of Forest Structure and Dynamics. Biotropica 2010, 42, 664–671. [Google Scholar] [CrossRef]
- Fauset, S.; Johnson, M.O.; Gloor, M.; Baker, T.R.; Monteagudo M., A.; Brienen, R.J.; Feldpausch, T.R.; Lopez-Gonzalez, G.; Malhi, Y.; ter Steege, H.; et al. Hyperdominance in Amazonian forest carbon cycling. Nat. Commun. 2015, 6. [Google Scholar] [CrossRef] [PubMed] [Green Version]
- Rutishauser, E.; Wagner, F.; Hérault, B.; Nicolini, E.A.; Blanc, L. Contrasting above-ground biomass balance in a Neotropical rain forest. J. Veg. Sci. 2010, 21, 672–682. [Google Scholar] [CrossRef]
- Ter Steege, H.; Pitman, N.C.A.; Phillips, O.L.; Chave, J.; Sabatier, D.; Duque, A.; Molino, J.F.; Prévost, M.F.; Spichiger, R.; Castellanos, H.; et al. Continental-scale patterns of canopy tree composition and function across Amazonia. Nature 2006, 443, 444–447. [Google Scholar] [CrossRef] [PubMed]
- Wagner, F.; Hérault, B.; Stahl, C.; Bonal, D.; Rossi, V. Modeling water availability for trees in tropical forests. Agric. For. Meteorol. 2011, 151, 1202–1213. [Google Scholar] [CrossRef]
- Ferry, B.; Morneau, F.; Bontemps, J.D.; Blanc, L.; Freycon, V. Higher treefall rates on slopes and waterlogged soils result in lower stand biomass and productivity in a tropical rain forest. J. Ecol. 2010, 98, 106–116. [Google Scholar] [CrossRef]
- Granier, A.; Bréda, N.; Biron, P.; Villette, S. A lumped water balance model to evaluate duration and intensity of drought constraints in forest stands. Ecol. Model. 1999, 116, 269–283. [Google Scholar] [CrossRef]
- Granier, A.; Reichstein, M.; Bréda, N.; Janssens, I.A.; Falge, E.; Ciais, P.; Grünwald, T.; Aubinet, M.; Berbigier, P.; Bernhofer, C.; et al. Evidence for soil water control on carbon and water dynamics in European forests during the extremely dry year: 2003. Agric. For. Meteorol. 2007, 143, 123–145. [Google Scholar] [CrossRef]
- Wagner, F.; Rossi, V.; Stahl, C.; Bonal, D.; Hérault, B. Water Availability Is the Main Climate Driver of Neotropical Tree Growth. PLoS ONE 2012, 7, e34074. [Google Scholar] [CrossRef] [PubMed] [Green Version]
- Hérault, B.; Bachelot, B.; Poorter, L.; Rossi, V.; Bongers, F.; Chave, J.; Paine, C.E.T.; Wagner, F.; Baraloto, C. Functional traits shape ontogenetic growth trajectories of rain forest tree species. J. Ecol. 2011, 99, 1431–1440. [Google Scholar] [CrossRef]
- Aubry-Kientz, M.; Hérault, B.; Ayotte-Trépanier, C.; Baraloto, C.; Rossi, V. Toward trait-based mortality models for tropical forests. PLoS ONE 2013, 8, e63678. [Google Scholar] [CrossRef]
- Chao, K.J.; Phillips, O.L.; Gloor, E.; Monteagudo, A.; Torres-Lezama, A.; Martinez, R.V. Growth and wood density predict tree mortality in Amazon forests. J. Ecol. 2008, 96, 281–292. [Google Scholar] [CrossRef]
- Metcalf, C.J.E.; McMahon, S.M.; Clark, J.S. Overcoming data sparseness and parametric constraints in modeling of tree mortality: A new nonparametric Bayesian model. Can. J. For. Res. 2009, 39, 1677–1687. [Google Scholar] [CrossRef]
- Aubry-Kientz, M.; Rossi, V.; Boreux, J.; Hérault, B. A joint individual-based model coupling growth and mortality reveals that tree vigor is a key component of tropical forest dynamics. Ecol. Evol. 2015, 12, 2457–2465. [Google Scholar] [CrossRef] [PubMed] [Green Version]
- Dellaportas, P.; Forster, J.J.; Ntzoufras, I. On Bayesian model and variable selection using MCMC. Stat. Comput. 2002, 12, 27–36. [Google Scholar] [CrossRef]
- Team, R.C. R: A Language and Environment for Statistical Computing; R Foundation for Statistical Computing: Vienna, Austria, 2014. [Google Scholar]
- Kuo, L.; Mallick, B. Variable selection for regression models. Sankhya Ser. B 1998, 60, 65–81. [Google Scholar]
- Uriarte, M.; Canham, C.D.; Thompson, J.; Zimmerman, J.K. A neighborhood analysis of tree growth and survival in a hurricane-driven tropical forest. Ecol. Monogr. 2004, 74, 591–614. [Google Scholar] [CrossRef]
- Russo, S.E.; Brown, P.; Tan, S.; Davies, S.J. Interspecific demographic trade-offs and soil-related habitat associations of tree species along resource gradients. J. Ecol. 2008, 96, 192–203. [Google Scholar] [CrossRef]
- Stahl, C.; Hérault, B.; Rossi, V.; Burban, B.; Bréchet, C.; Bonal, D. Depth of soil water uptake by tropical rainforest trees during dry periods: Does tree dimension matter? Oecologia 2013, 173, 1191–1201. [Google Scholar] [CrossRef] [PubMed]
- Bartlett, M.K.; Scoffoni, C.; Sack, L. The determinants of leaf turgor loss point and prediction of drought tolerance of species and biomes: A global meta-analysis. Ecol. Lett. 2012, 15, 393–405. [Google Scholar] [CrossRef] [PubMed]
- Maréchaux, I.; Bartlett, M.K.; Sack, L.; Baraloto, C.; Engel, J.; Joetzjer, E.; Chave, J. Drought tolerance as predicted by leaf water potential at turgor loss point varies strongly across species within an Amazonian forest. Funct. Ecol. 2015, 29, 1268–1277. [Google Scholar] [CrossRef]
- Wagner, F.; Rossi, V.; Baraloto, C.; Bonal, D.; Stahl, C.; Hérault, B. Are Commonly Measured Functional Traits Involved in Tropical Tree Responses to Climate? Int. J. Ecol. 2014, 2014, 1–10. [Google Scholar] [CrossRef]
- Markesteijn, L. Drought Tolerance of Tropical Tree Species; Functional Traits, Trade-offs and Species Distribution. Ph.D. Thesis, Wageningen University, Wageningen, The Netherlands, 2010. [Google Scholar]
- Flores, O.; Hérault, B.; Delcamp, M.; Garnier, E.; Gourlet-Fleury, S. Functional traits help predict post-disturbance demography of tropical trees. PLoS ONE 2014, 9, e105022. [Google Scholar] [CrossRef] [PubMed] [Green Version]
- Blanc, L.; Echard, M.; Hérault, B.; Bonal, D.; Marcon, E.; Chave, J.; Baraloto, C. Dynamics of aboveground carbon stocks in a selectively logged tropical forest. Ecol. Appl. 2009, 19, 1397–1404. [Google Scholar] [CrossRef] [PubMed]
- Peña Claros, M.; Fredericksen, T.; Alarcón, A.; Blate, G.; Choque, U.; Leaño, C.; Licona, J.; Mostacedo, B.; Pariona, W.; Villegas, Z.; et al. Beyond reduced-impact logging: Silvicultural treatments to increase growth rates of tropical trees. For. Ecol. Manag. 2008, 256, 1458–1467. [Google Scholar] [CrossRef]
- Guitet, S.; Blanc, L.; Trombe, P.J.; Lehallier, B. Traitements sylvicoles en forêt tropicale guyanaise : Bilan de dix ans d’expérimentations. Bois Forêts Trop. 2009, 301, 7–19. [Google Scholar]
- Sist, P.; Mazzei, L.; Blanc, L.; Rutishauser, E. Large trees as key elements of carbon storage and dynamics after selective logging in the Eastern Amazon. For. Ecol. Manag. 2014, 318, 103–109. [Google Scholar] [CrossRef]
- Pereira, R.; Zweede, J.; Asner, G.P.; Asner, G. Forest canopy damage and recovery in reduced-impact and conventional selective logging in eastern Para, Brazil. For. Ecol. Manag. 2002, 168, 77–89. [Google Scholar] [CrossRef]
- Sist, P.; Rutishauser, E.; Peña Claros, M.; Shenkin, A.; Hérault, B.; Blanc, L.; Baraloto, C.; Baya, F.; Benedet, F.; da Silva, K.E.; et al. The Tropical managed Forests Observatory: A research network addressing the future of tropical logged forests. Appl. Veg. Sci. 2015, 18, 171–174. [Google Scholar] [CrossRef]


| Common Name | Taxonomic Identification | Number of Trees | DBH Range (cm) | % Biomass | Exploitation Level |
|---|---|---|---|---|---|
| Angélique | Dicorynia guianensis Amsh. | 647 | (10.00–99.63) | 2.40 | 41.63% |
| Balata Franc | Manilkara bidentata (A.DC.) Chevalier | 138 | (10.00–102.50) | 0.77 | 2.28% |
| Balata Pomme | Chrysophyllum spp. | 205 | (10.00–59.36) | 1.62 | 0.04% |
| Boco | Bocoa prouacensis Aubl. | 1135 | (10.00–68.75) | 2.51 | 0.01% |
| Carapa | Carapa surinamensis Miq. | 702 | (10.00–63.66) | 0.70 | 0.04% |
| Gonfolo Gris | Ruizterania albiflora (Warm.) Marcano-Berti | 73 | (10.00–81.01) | 0.59 | 1.43% |
| Gonfolo Rose | Qualea rosea Aubl. | 669 | (10.00–105.99) | 4.50 | 21.12% |
| Goupi | Goupia glabra Aubl. | 291 | (10.00–95.49) | 1.29 | 1.89% |
| Grignon Franc | Sextonia rubra (Mez) van der Werff | 188 | (10.00–126.68) | 1.23 | 8.94% |
| Kobe | Sterculia spp. | 460 | (10.00–73.68) | 0.73 | 0.0003% |
| Manil Marécage | Symphonia spp. | 69 | (10.00–75.28) | 2.30 | 0.0003% |
| Wacapou | Vouacapoua americana Aubl. | 874 | (10.00–106.31) | 3.44 | 1.29% |
| Wapa | Eperua falcata Aubl. | 2628 | (10.00–103.13) | 10.17 | 0.49% |
| Yayamadou Montagne | Virola michelii Heckel | 344 | (10.00–61.27) | 0.27 | 0.26% |
| Treatments | Plot Numbers | Timber Logging | Fuelwood Logging | Thinning | % AGB Loss |
|---|---|---|---|---|---|
| Control | P1, P6, P11 | - | - | - | - |
| T1 | P2, P7, P9 | DBH ≥ 50 cm, mean of 10 trees/ha | - | - | – |
| T2 | P3, P5, P10 | DBH ≥ 50 cm, mean of 10 trees/ha | - | DBH ≥ 40 cm, all non-valuable species, mean of 30 trees/ha | – |
| T3 | P4, P8, P12 | DBH ≥ 50 cm, mean of 10 trees/ha | 40 cm ≤ DBH ≤ 50 cm, all non-valuable species, mean of 20 trees/ha | DBH ≥ 40 cm, all non-valuable species, mean of 15 trees/ha | – |
© 2016 by the authors; licensee MDPI, Basel, Switzerland. This article is an open access article distributed under the terms and conditions of the Creative Commons Attribution (CC-BY) license (http://creativecommons.org/licenses/by/4.0/).
Share and Cite
Fargeon, H.; Aubry-Kientz, M.; Brunaux, O.; Descroix, L.; Gaspard, R.; Guitet, S.; Rossi, V.; Hérault, B. Vulnerability of Commercial Tree Species to Water Stress in Logged Forests of the Guiana Shield. Forests 2016, 7, 105. https://doi.org/10.3390/f7050105
Fargeon H, Aubry-Kientz M, Brunaux O, Descroix L, Gaspard R, Guitet S, Rossi V, Hérault B. Vulnerability of Commercial Tree Species to Water Stress in Logged Forests of the Guiana Shield. Forests. 2016; 7(5):105. https://doi.org/10.3390/f7050105
Chicago/Turabian StyleFargeon, Hélène, Mélaine Aubry-Kientz, Olivier Brunaux, Laurent Descroix, Romain Gaspard, Stéphane Guitet, Vivien Rossi, and Bruno Hérault. 2016. "Vulnerability of Commercial Tree Species to Water Stress in Logged Forests of the Guiana Shield" Forests 7, no. 5: 105. https://doi.org/10.3390/f7050105