Article

Regional Instability in the Abundance of Open Stands in the Boreal Forest of Eastern Canada

by
Rija Rapanoela
1,
Frédéric Raulier
1,*,† and
Sylvie Gauthier
2,†
1
Centre d’étude de la forêt, Faculté de foresterie, de géographie et de géomatique, Université Laval, 2405 rue de la terrasse, Québec, QC G1V 0A6, Canada
2
Natural Ressources Canada, Canadian Forest Service, Laurentian Forestry Centre, 1055 du PEPS, P.O. Box 10380, Stn. Sainte-Foy, Québec, QC G1V 4C7, Canada
*
Author to whom correspondence should be addressed.
These authors contributed equally to this work.
Forests 2016, 7(5), 103; https://doi.org/10.3390/f7050103
Submission received: 15 March 2016 / Revised: 2 May 2016 / Accepted: 5 May 2016 / Published: 12 May 2016

Abstract

:
Fires are a key disturbance of boreal forests. In fact, they are the main source of renewal and evolution for forest stands. The variability of fire through space and time results in a diversified forest mosaic, altering their species composition, structure and productivity. A resilient forest is assumed to be in a state of dynamic equilibrium with the fire regime, so that the composition, age structure and succession stages of forests should be consistent with the fire regime. Dense spruce-moss stands tend, however, to diminish in favour of more open stands similar to spruce-lichen stands when subjected to more frequent and recurring disturbances. This study therefore focused on the effects of spatial and temporal variations in burn rates on the proportion of open stands over a large geographic area (175,000 km2) covered by black spruce (Picea mariana (Mill.) Britton, Sterns, Poggenb.). The study area was divided into 10 different zones according to burn rates, as measured using fire-related data collected between 1940 and 2006. To test if the abundance of open stands was unstable over time and not in equilibrium with the current fire regime, forest succession was simulated using a landscape dynamics model that showed that the abundance of open stands should increase progressively over time in zones where the average burn rate is high. The proportion of open stands generated during a specific historical period is correlated with the burn rate observed during the same period. Rising annual burn rates over the past two decades have thereby resulted in an immediate increase in the proportion of open stands. There is therefore a difference between the current proportion of open stands and the one expected if vegetation was in equilibrium with the disturbance regime, reflecting an instability that may significantly impact the way forest resources are managed. It is apparent from this study that forestry planning should consider the risks associated with the temporal variability of fire regimes on the forest ecosystem, as the resulting changes can have a significant impact on biodiversity and allowable cut estimates.

1. Introduction

The boreal forest is the largest forest area in Canada. In Eastern Canada, it is dominated mainly by black spruce-moss stands that are composed solely of black spruce (Picea mariana (Mill.) Britton, Sterns, Poggenb.) or of a combination of black spruce, jack pine (Pinus banksiana Lamb.) or balsam fir (Abies balsamea (L.) Mill.). There is a transition area between the forest tundra in the north and the black spruce-moss forest in the south: the black spruce-lichen woodland, which is composed of stands that are less dense as well as less productive [1]. By definition, Spruce-lichen woodlands are open-structure forests with a lichen cover of over 40% [2,3]. A number of studies have shown that the lesser abundance of dense spruce-moss stands in favour of more open stands that are similar to spruce-lichen stands [2,4,5,6] is related to recurring disturbances [2,4,5,6], at least in regions where dense and open stands co-occur [7].
According to Turner et al. [8], landscapes can be divided into three categories according to the extent and frequency of the disturbances to which they are subjected. Landscapes traditionally considered to be in equilibrium with the disturbance pattern in place are characterized by small (compared to the size of the landscape in question) and locally infrequent disturbances. They also return to a state of equilibrium more rapidly in fact than the length of the disturbance cycle. Stable systems are characterized by medium-sized disturbances occurring on an intermediate basis. These systems return to a stable state in a moderate amount of time, equivalent to the length of the disturbance cycle. Potentially unstable systems are characterized by substantial disturbances (compared to the size of the area in question) occurring more frequently. Furthermore, unstable landscapes take longer than the span of the disturbance cycle to return to their original state.
The variability of fire regimes through space and time results in a diversified mosaic of species, altering their composition, structure and productivity [9]. In fact, forest composition [10,11], structure [12,13] and productivity [5,14] are all related to the fire regime. For boreal forests, forest succession models used for forest planning assume that, without harvest, the vegetation currently found in an area is adapted to its natural disturbance regime [15,16,17,18,19]. For instance, the concept of fire cycle is used in forest ecosystem management to define a minimum target value of old-growth forests to maintain in a landscape [17] or a maximum rate of clear-cut harvesting [16]. The fire cycle corresponds to the time required to burn an area equivalent to the study area [20] and in boreal forests of eastern Canada, this fire cycle varies between one and a few centuries. It is therefore defined at a time scale somewhat larger than that used for forest management planning. Significant temporal and even regional variations in burn rates observed in the boreal forest [16,21,22,23,24,25,26] however cast doubt on an unquestioned use of this assumption. Namely, an important increase in the burn rates of a number of areas in the North American boreal forest has been observed over the past few decades [25,26,27,28] and such an increase should possibly be accounted for when designing sustainable forest management strategies.
The primary objective of this study was to analyze the impact of the variation in fire frequency on the openness of the forest. We wished to assess whether the forest presents a greater abundance of open stands in areas where the current burn rate surpasses rates recorded in the recent past. We therefore tested the hypothesis that the abundance of open forest stands varied according to variation in decadal burn rate. In order to do so, we used a transition matrix model to assess succession. Matrix models are probability models [29,30,31] used to predict the long-term demographic dynamics of a population about which we have little information [29,32]. Transition matrices represent the probability of different states within systems evolving into other types at a certain moment in time. The succession of the different states depends solely on the current state of the system [30,33]. When undisturbed, these different states always evolve towards a stable long-term equilibrium, independent from a system’s initial state [18,30]. Thanks to this characteristic, we were able to assess whether there is in fact an equilibrium between the current proportion of open stands and the current burn rate by simulating the evolution of the abundance of open stands using a landscape dynamics model spanning 150 years and by testing the stability of the proportion of open stands over time.

2. Materials and Methods
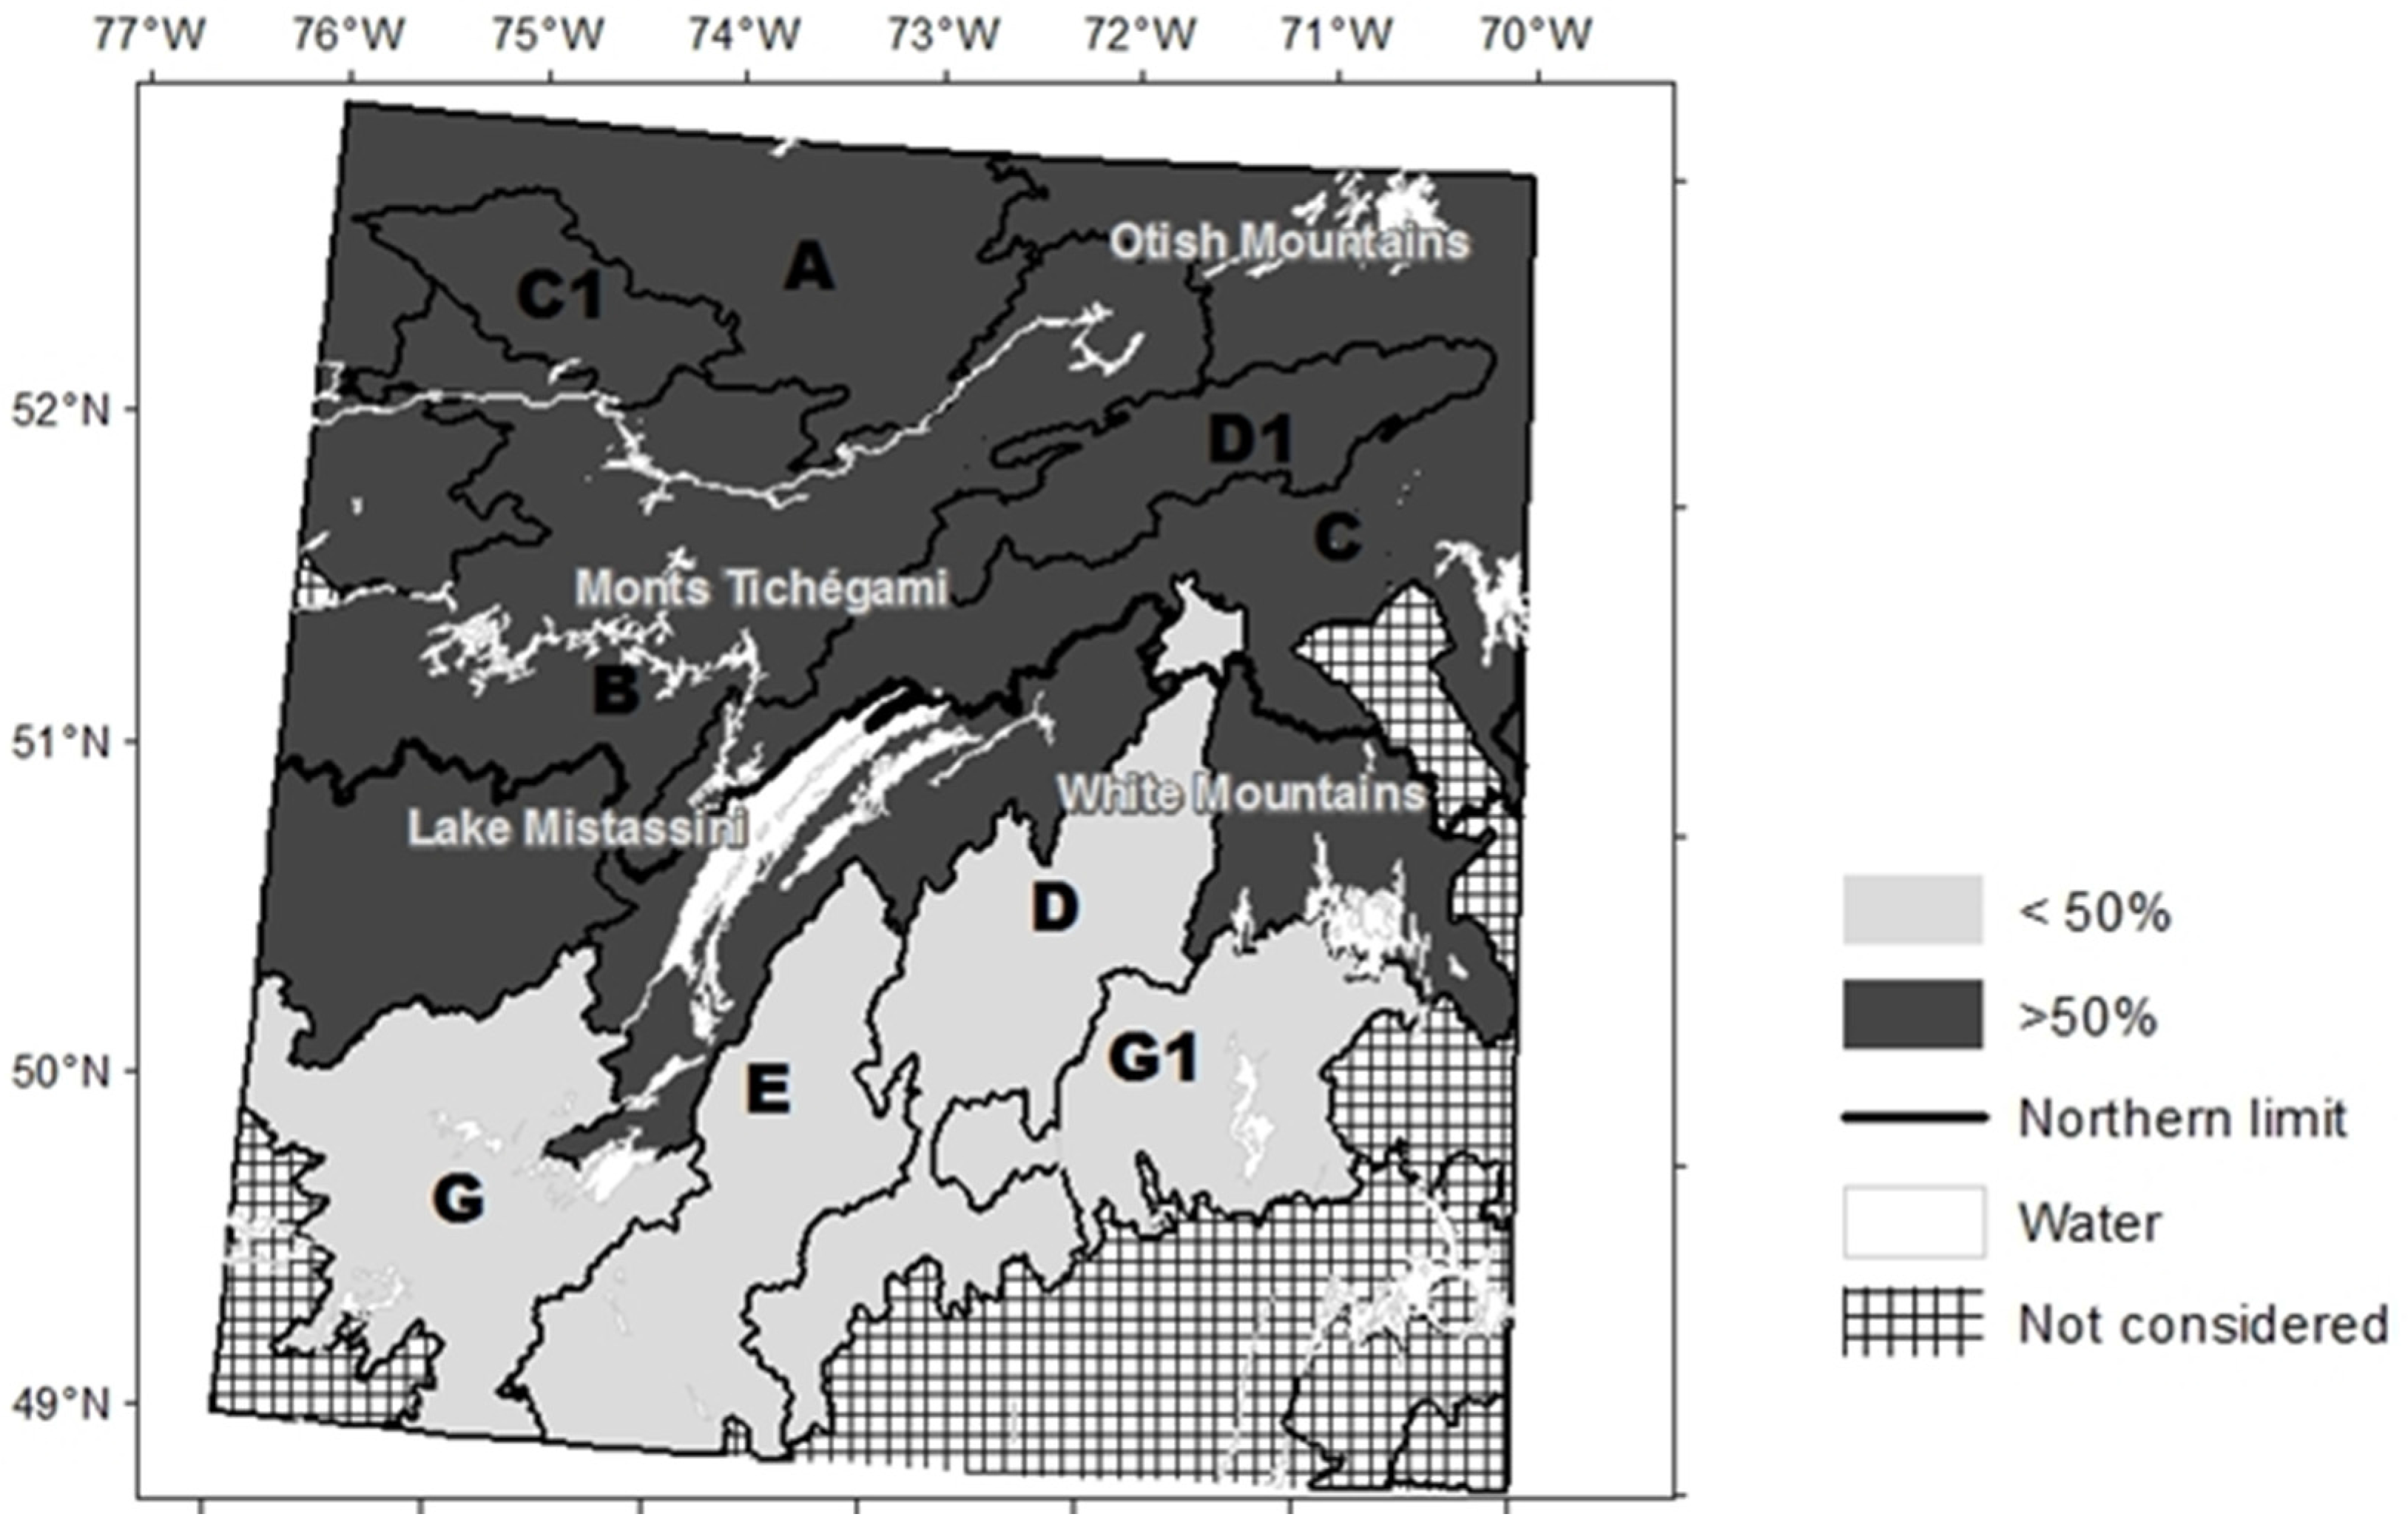
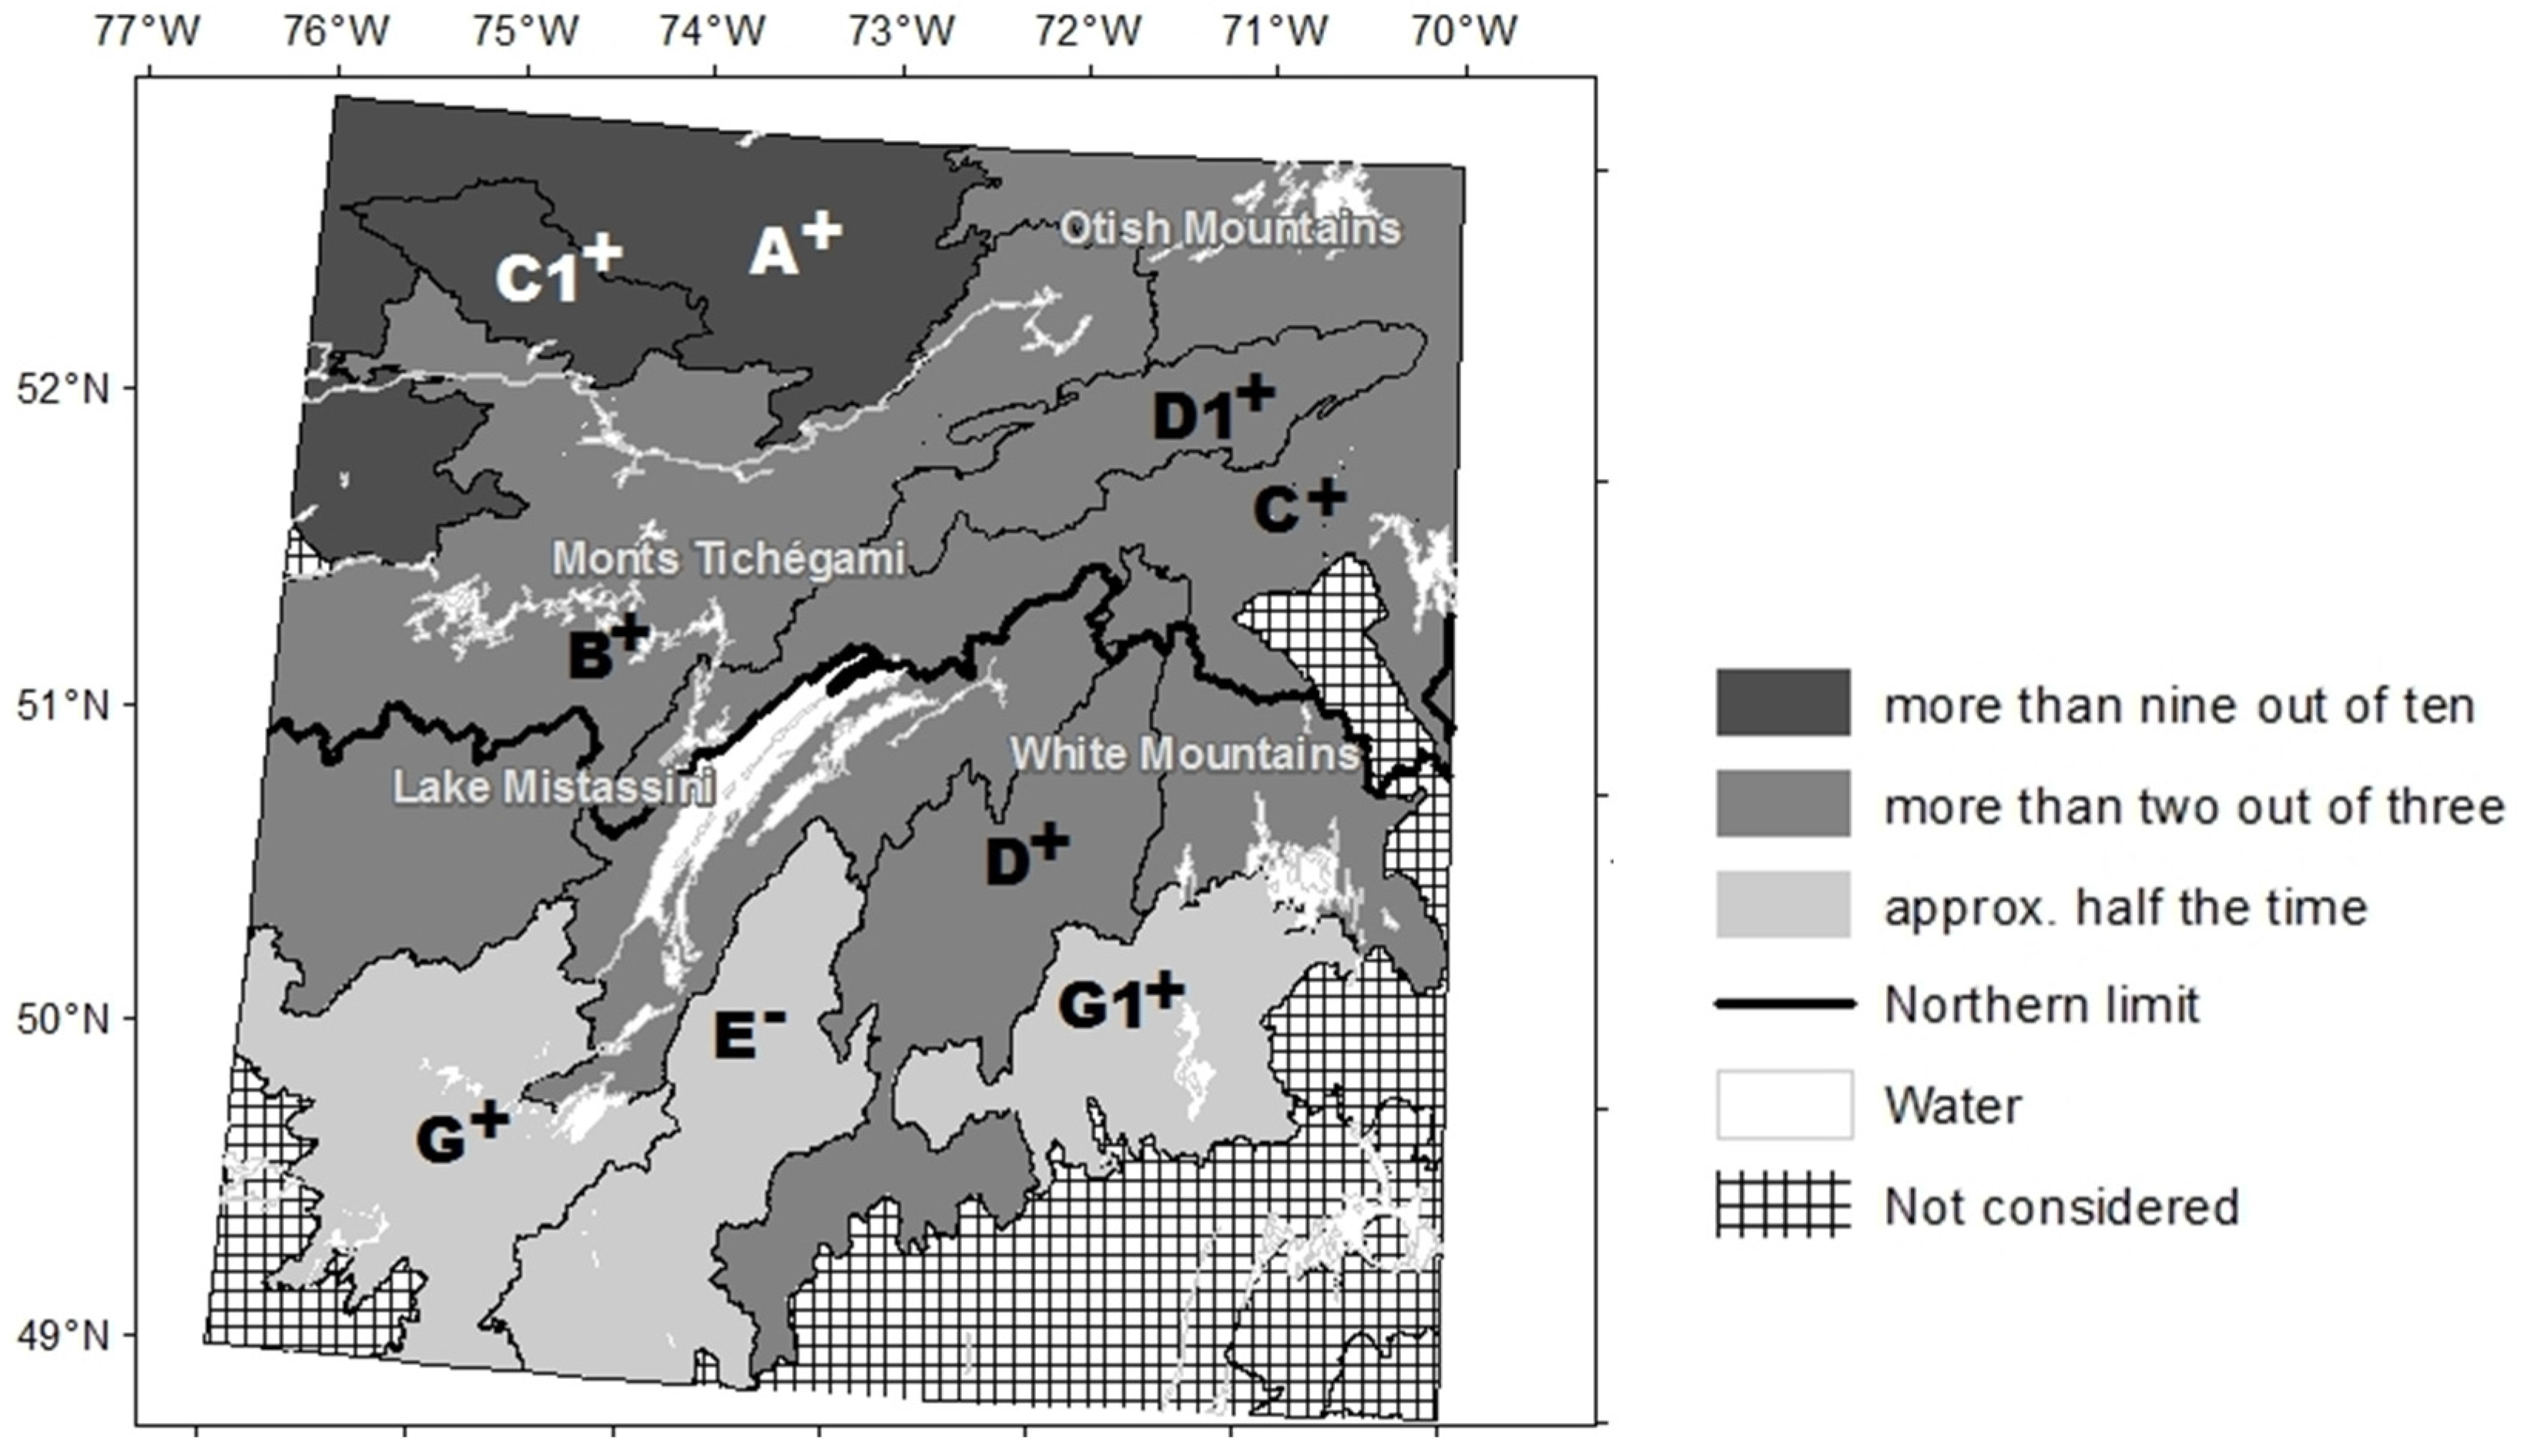
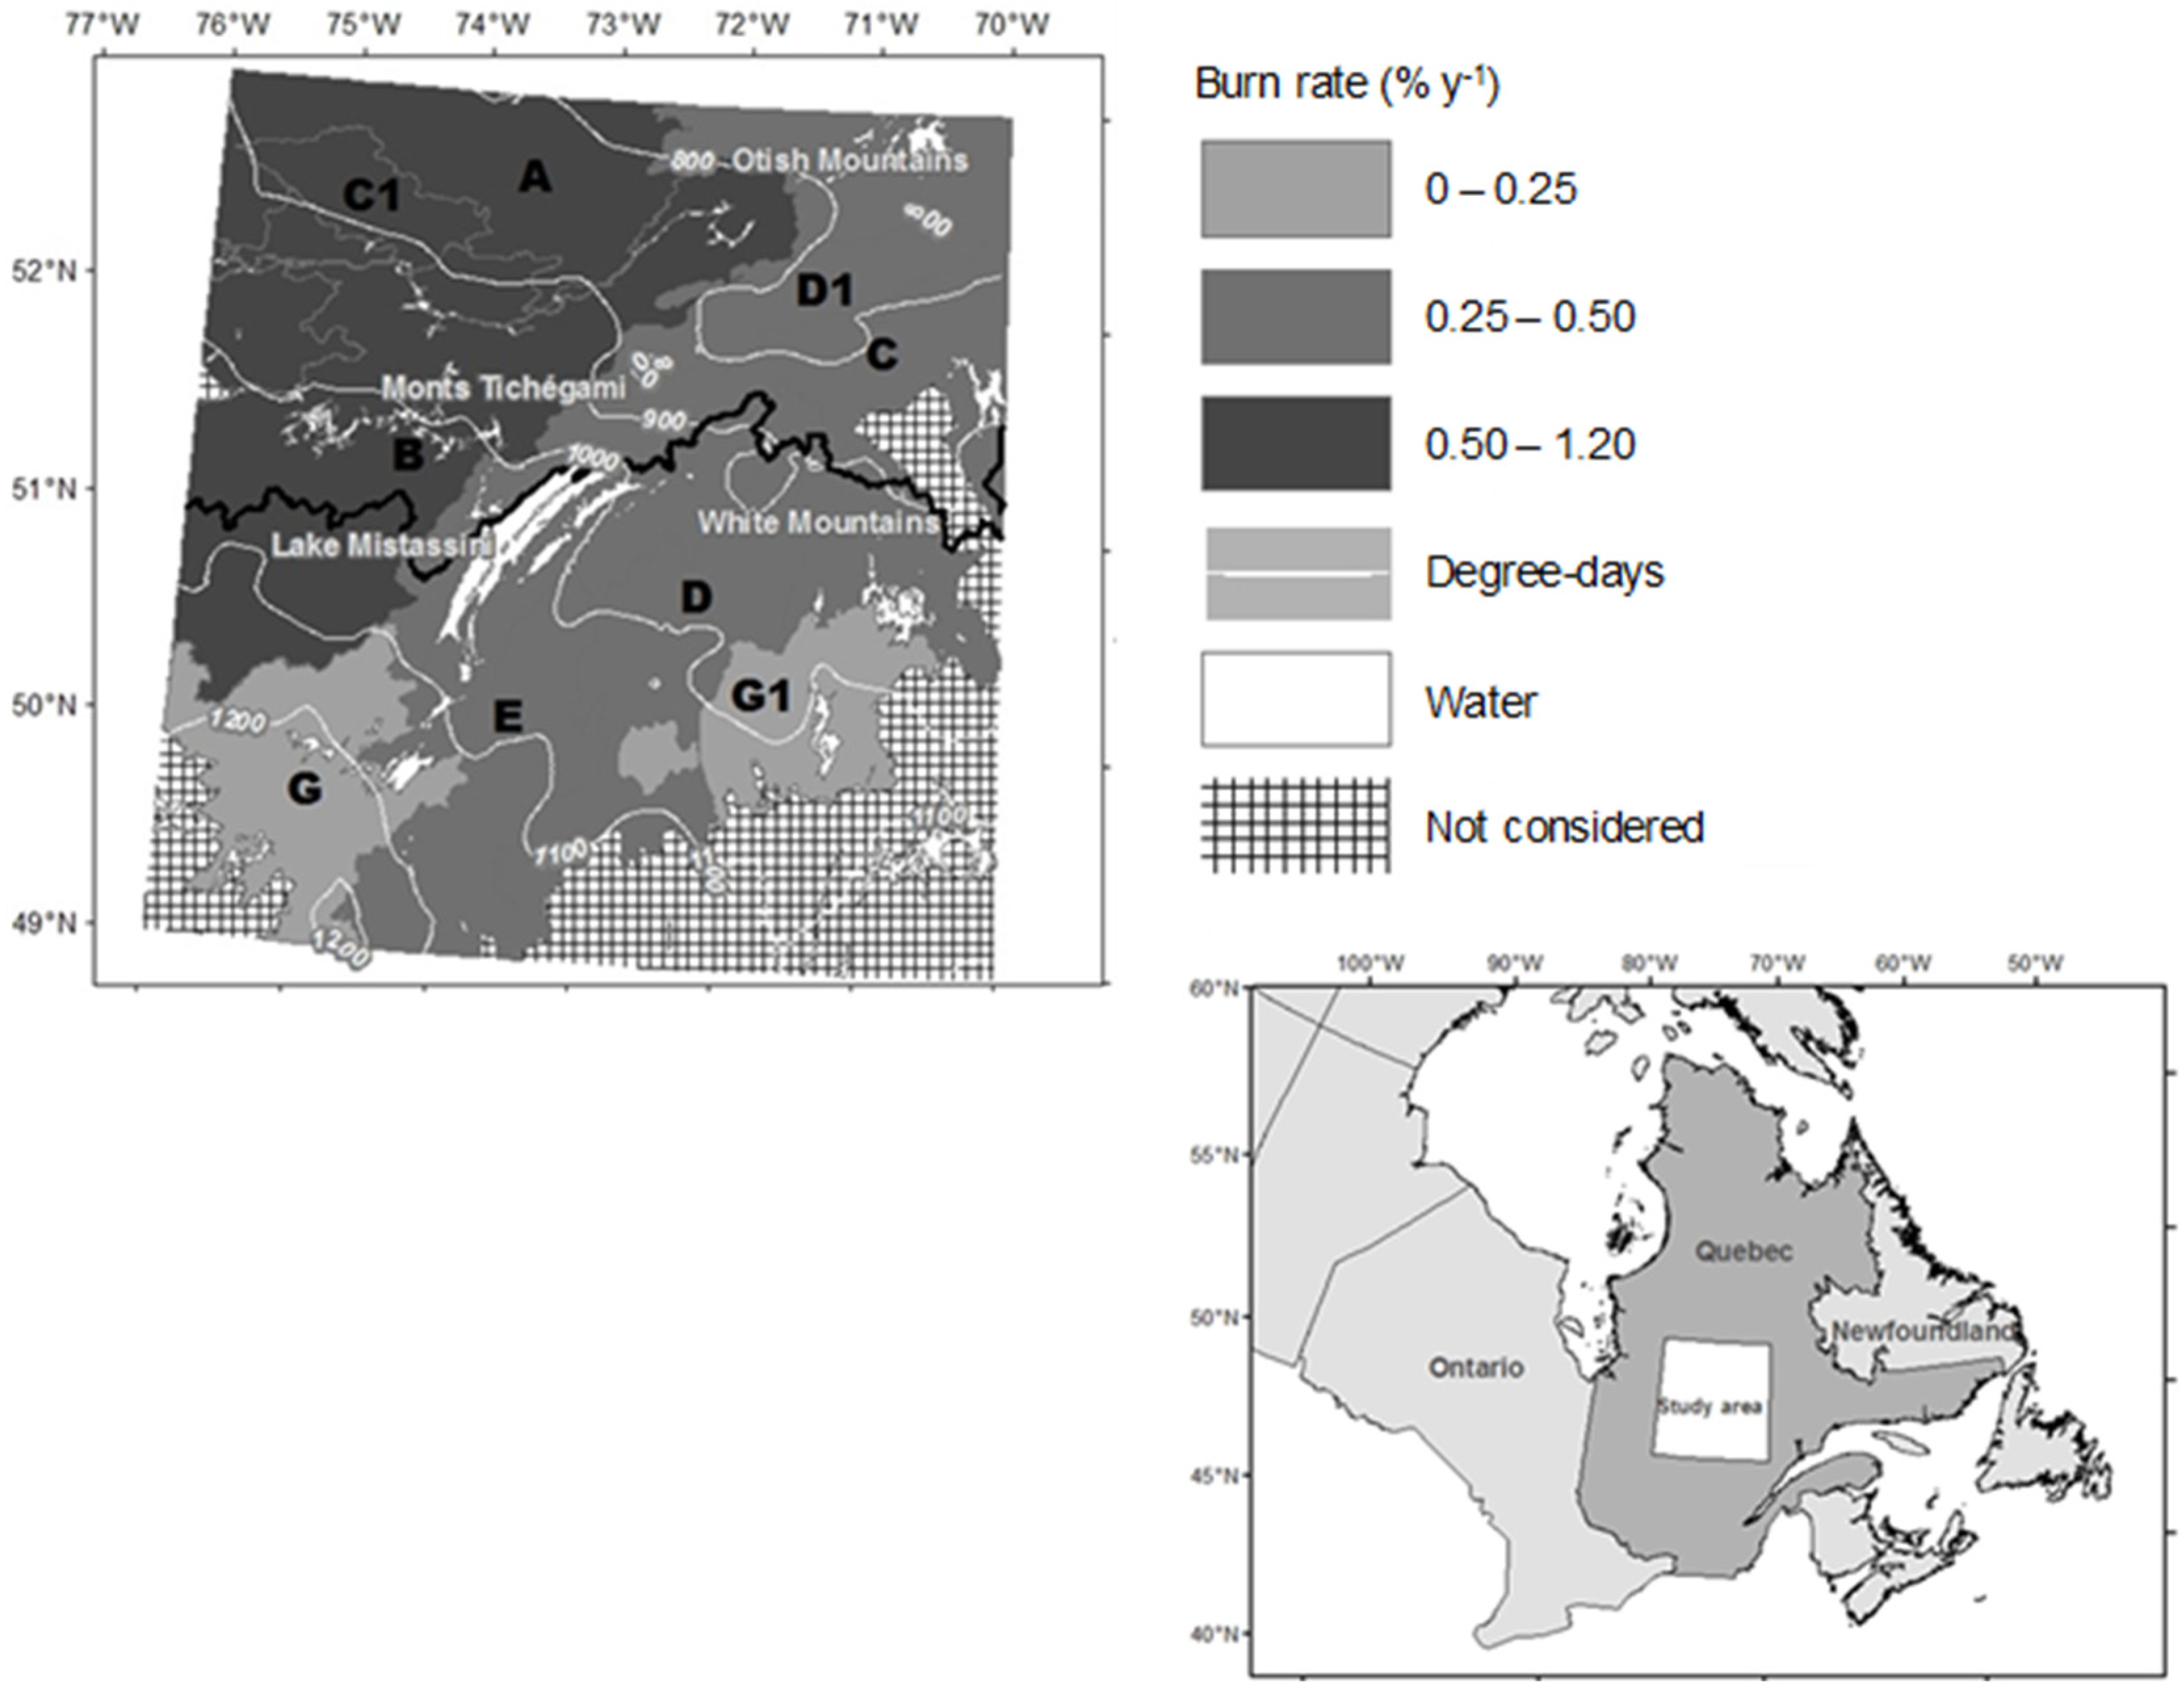
2.1. Study Area

The area that was under study (Figure 1) is located in the province of Quebec (Canada), extending from 49° N to 53° N latitude and from 70° W to 76° W longitude around Lake Mistassini. This area covering approximately 175,000 km2 is predominately covered in the south by black spruce-moss forest and by black Spruce-lichen woodland in the north. The forest mainly reflects the influence of the physical and climate characteristics of the area, as well as the impact of repeated fires [14]. Essentially, the area is marked by lower burn rates in the south (<0.30% year−1, based on data gathered on fires between 1940 and 2009 [25], and by higher burn rates in the north (between 0.30% and 1.2% year−1) (Figure 1; Table 1). The characteristics of these different fire regimes were established for 10 separate areas (fire zones) by Mansuy et al. [25]. Together with the fire regime, the climate, and particularly the temperature (number of growing degree-days above 5 °C) are key factors to the stands’ density and productivity [14]. The forest is denser and more productive in the southwest sector (growing degree-days starting at 1200 °C·year−1) than in the northeast sector (800 °C·year−1) (Figure 1; Table 1). The average annual temperature is 1.9 °C in the southwest sector and −6.0 °C than in the northeast sector [25].

2.2. Forest Data

This area straddles the northern limit for timber allocations as established by the Ministère des Forêts, de la Faune et des Parcs (MFFP) [35] in 2002. This northern limit more or less follows the 51st parallel (Figure 1). The forest data used in this study stem from two different inventory programs: the northern forest inventory program for the area above this limit, and the regular inventory program to the south. These two programs were homogenized in 2006 by the MFFP in order to generate forest maps that included surficial deposits, moisture regime, forest cover type (softwood, deciduous, or mixed), understory vegetation, cover density class, development stage, potential vegetation and disturbance of origin over an area of at least 8 ha [25,36]. South of the 51st parallel, forest maps were based on the interpretation of aerial photographs, which were taken between 1990 and 2001, and updated in 2006 by the MFFP to account for recent disturbances. North of the 51st parallel, forest vegetation was classified from satellite images (Landsat 2005), while aerial photographs at the scale of 1:40,000 were used to map surficial deposits and moisture regimes.
In our study, we used 945 permanent and temporary sample plots that predominantly consisted of black spruce and jack pine (with a 75% minimum basal area coverage per species in one plot). A total of 248 temporary and 291 permanent sample plots are located north of the 51st parallel. Temporary sample plots were measured in 2006 and 2007 with the northern forest inventory program and permanent sample plots were remeasured between 1990 and 2001 during the third regular forest inventory program. Plots are evenly distributed across the study area ([14]: their Figure S1). Within each sample plot (of 400 m2), the species and trunk diameter measured at breast height (DBH) was noted for each merchantable tree (DBH > 9 cm). Three to five dominant or co-dominant trees (taller than two-third of the canopy height [36]) were randomly selected to record their age (core at 1 m height) and total height.

2.3. Data on Forest Fires

The annual burn rate corresponds to the annual area burned, divided by the total terrestrial area (excludes lakes and other water bodies, but includes forested peatlands). The annual areas burned have been used to calculate the burn rate for each region [25]. The history of the areas burned within our study area comes from the spatial database from the MFFP for the period of 1940 to 2006. The fire map has been compiled from various sources: satellite images, aerial photographs, maps and archives. Therefore, the older fires listed are likely to be incomplete and cover about 14% of the territory north of the study area, and instead of having dates of the fires being accurate within one year, they fall within a range of 5 or 10 years [37]. In order to account for the variability of the information sources regarding burned areas, a floating average for a 7-year period (average cycle of repetition of large fires), as described by Gauthier et al. [37], was applied to obtain the annual burn rate. This method produced 61 different annual burn rates for each fire zone, from which 10,000 random draws were conducted to estimate the frequency distribution of the annual burn rate for each fire zone. A regional average burn rate was also calculated for three separate twenty-year periods (1947–1966, 1967–1986, and 1987–2006) in order to detect any temporal variations.

2.4. Description of the Landscape Dynamics Model

The structure of the forest landscape is the result of complex interactions between geomorphology, climate, disturbances and natural succession. We used a forest landscape dynamics model, the “Vermillion Landscape Model” or VLM [38] to simulate the landscape dynamics. VLM, which has been described in detail in [38,39,40,41], has been implemented in the SELES modelling tool (Spatially Explicit Landscape Event Simulator [42]) by Fall [38] to be compatible with forest map data produced by the MFFP of Québec. Different versions of this model have been used to study the sustainability of forest management strategies in northern temperate or boreal forests of Québec in interaction with fire, insect defoliation, natural succession and road building [38,39,40,41,43]. The landscape is described by a set of raster layers (e.g., forest type, stand age, and soil drainage). Processes that influence forest dynamics (fire, natural succession, and logging) are described as landscape agents (submodels) that modify properties of raster cells through time. VLM has been simplified to meet the objective of our study by keeping only succession and fire as active landscape agents (File S1).

2.4.1. Landscape Description in VLM

The VLM model uses raster layers as inputs. Due to its considerable size, the territory was divided into cells or pixels of 16 ha (400 × 400 m2) in order to correspond to twice the average size of the forest polygons of the study area. The analyses performed as part of our study focused on the opening of black spruce stands, because shade-intolerant stands that are predominantly composed of softwood conifers represented by jack pine are much less abundant [14]. The territory was therefore stratified according to three criteria: dominant species, degree of cover opening and age class. Because mapping north of the 51st parallel was performed using satellite images, without the identification of coniferous species and estimation of stand age, it was first necessary to estimate the stands’ species composition (distinguishing between black spruce and jack pine) and age class.
Species dominance within target populations (and therefore within forest map polygons) was first estimated using two logistic regression models calibrated by Rapanoela et al. [14] for the same study area and with the plot dataset described above (Section 2.2). As black spruce largely dominates in the study area, Rapanoela et al. [14] first assumed that all stands were composed of black spruce by default. The first regression model was then used to estimate the probability of jack pine occurrence mainly as a function of elevation, drainage, developmental stage and understory cover ([14]: Table 2): jack pine tends to occur more frequently on dry to mesic sites of low elevation, with a developmental stage qualified as “regenerated” or “young” and in sites dominated by lichens in the understory vegetation. Probability of jack pine dominance is more related to the presence of coarse soil deposits, often on hilly areas in the northwestern part of the study area.
The age of forest polygons was estimated using two methods. South of the 51st parallel, the age of some stands could be determined by the date of the last disturbance indicated on the forest maps and it has been recalculated by subtracting the year of origin of the disturbance (fire or cutting) from the year of production of the forest map (2006). For other polygons where a date of last disturbance was not available, the age was estimated by a non-parametric method (k-NN) [44]. This calculation method consists of estimating unknown values for forest attributes within an area unit (target polygon) by averaging the values of attributes of similar reference surface units (inventory plots) [45]. Baseline predictors were the cartographic attributes (Section 2.2) and climatic variables. Climatic variables were chosen for their potential impact on succession dynamics and forest productivity in the study area [14,46]. BioSIM 9 [34] was used to estimate these climate variables for each forest polygon within the study area. BioSim adjusts data from the closest weather stations to account for differences in exposure, elevation, latitude and longitude between these stations and the stands targeted. The similarity between the characteristics of the reference polygons and the target polygon (year) was calculated using the Gower distance [47]. We followed the process described by [14] for the variable selection to keep only one variable among correlated variables and to remove variables that do not significantly explain distances between target and reference polygons. The number k of nearest neighbours was chosen by minimizing the root mean squared error of the estimates (RMSE), determined by cross-validation [44,48]. The prediction quality of the age of stands was assessed with the coefficient of determination between predicted and observed ages and the absence of bias. With this procedure, stand age was estimated from the weighted average of 16 nearest neighbours, neighbourhood being assessed with Gower distances estimated with nine variables: six stand cartographic attributes (development stage, cover density class, potential vegetation, surficial deposit, slope and elevation) and three climatic variables (total annual radiation (MJ·m−2·year−1), annual snow precipitation (mm·year−1) and aridity index (mm·year−1, sum of the difference between Thorthwaite’s potential evapotranspiration and monthly precipitation [49])). The RMSE (6.7 year) largely exceeded the mean residual bias (−1.4 year) and the fit to observed values was considered acceptable, with a coefficient of determination of 26%.
Two classes were considered when assigning dominant species type, that being shade-tolerant conifers (Rt) and shade-intolerant conifers (Ri), and two classes of canopy openings, that is, open (O) and closed stands (C). The types of canopy opening were determined according to the forest standard mapping of the Nordic Ecoforest Inventory Program: stands where the cover percentage of the canopy of commercial species is greater than 40% (“A”, “B” and “C” density classes) were classified as closed, and those where the cover percentage was less than 40% (“D” and “L” density classes) were classified as open. For each fire zone, we simulated the evolution of 4 separate strata: strata closed and open composed of shade-tolerant or shade-intolerant conifers (RtC; RtO; RiC; RiO). Age values were regrouped into six 20-year age classes (0 to 20 (10), 21 to 40 (30), 41 to 60 (50), 61 to 80 (70), 81 to 100 (90), and >100 year old (100+)).

2.4.2. Succession Submodel

We used the approach developed by Fall et al. [38] to design an empirical semi-Markov model of succession. This approach is based on the hypothesis that trends in the distribution of stand patterns by age reflect the current succession process and will continue in the future [50]. First, we assumed that stands within the same fire zone follow the same succession dynamic [46]: a transition matrix was therefore calibrated for each fire zone. The transition probabilities were estimated by age groups based on 20-year periods for each of the four strata (RtC; RtO; RiC; RiO) in a fire zone based on the forest map of the territory. Following a fire, the age of the cell is reinitiated and the composition of a stand after a fire is randomly selected from the abundance of strata in each fire zone for the first age group (0–20 years). A cell can change succession paths randomly over time, with probabilities being derived based on how the strata are represented in the fire zone for its corresponding age group.

2.4.3. Fire Submodel

The empirical distribution of the annual burn rate (Section 2.4) was used to simulate the annual burn rate. The number of fires followed a negative exponential distribution. For each fire, a spark cell was selected at random, and the fire is propagated in all directions until it encounters an obstacle (water body or recent burn) and the number of cells defined by the planned fire area is reached. Recent burns could reburn from the next simulation period.

2.4.4. Simulation Runs

Simulations of the evolution of the abundance of open stands were performed to cover a 150-year time frame by five-year periods. Such a time period corresponds to the beginning of the conversion of even-aged stands to uneven-aged stands [51,52] and to the forest management planning horizon in Quebec. The number of simulations was set at 100. In our case, after 150 years, the coefficient of variation applicable to the abundance of open stands was less than 0.4% after 100 simulations in all fire zones.

2.5. Interpretation of Simulation Results

The primary objective of this study was to explain the abundance and variation over time of areas with open stands, according to fire zones, climate variables, physical variables, and burn rates.
If there is an equilibrium between the vegetation and disturbance rate, the breakdown of the land area into strata should remain approximately constant through time. We therefore measured the absence of equilibrium by subtracting the abundance of open stands after 150 years (as per our simulation) from the numbers observed in 2006 for each fire zone. We then attempted to explain the difference between the initial and final proportions. As we had 100 simulations, we built frequency distributions of these differences by fire zone to express the probability that the abundance of open stands could change.
We also tried to explain the abundance of open stands observed at the simulation start (in 2006). A stand’s age is equivalent to the time elapsed since its original disturbance. Variations in the abundance of open stands by age group apparent in the empirical semi-Markovian succession models for each fire zone should explain the absence of a stable equilibrium between the vegetation and fire regime. The abundance of open stands for three age groups (0–20 years, 20–40 years and 40–60 years) as observed in 2006 was therefore calculated to identify and explain any trends in three burn rate temporal periods (1947–1966, 1967–1986, and 1987–2006) (Section 2.4) as a function of biophysical variables (see Section 2.2 and Section 2.3). We then applied with this data a backward selection model for variables, using the LOGISTIC procedure from SAS. All independent variables were tested and those that contributed the least to the model were eliminated, according to a 5% threshold. The best model was selected with the Akaike information criterion (AIC) and the adjusted coefficient of determination (adjusted R2) [53].

3. Results

The study area can be divided into two zones according to the abundance of open stands observed in 2006 for each fire zone (Figure 2). Indeed, open stands are less abundant in areas located in the southern areas covered by the study (average abundance of less than 50% in D, E, G, and G1 areas), while they dominate the northern portions of the territory (A, B, C, C1, and D1 areas), precisely where the burn rate is higher (>0.3% year−1) (Figure 1). This division also coincides with a climatic transition zone with a colder climate zone in the north (A, B, C, C1, and D1 areas) and warmer in the south (D, E, G, and G1 areas) (Figure 1). The division between the two zones straddles the northern limit for timber allocations.

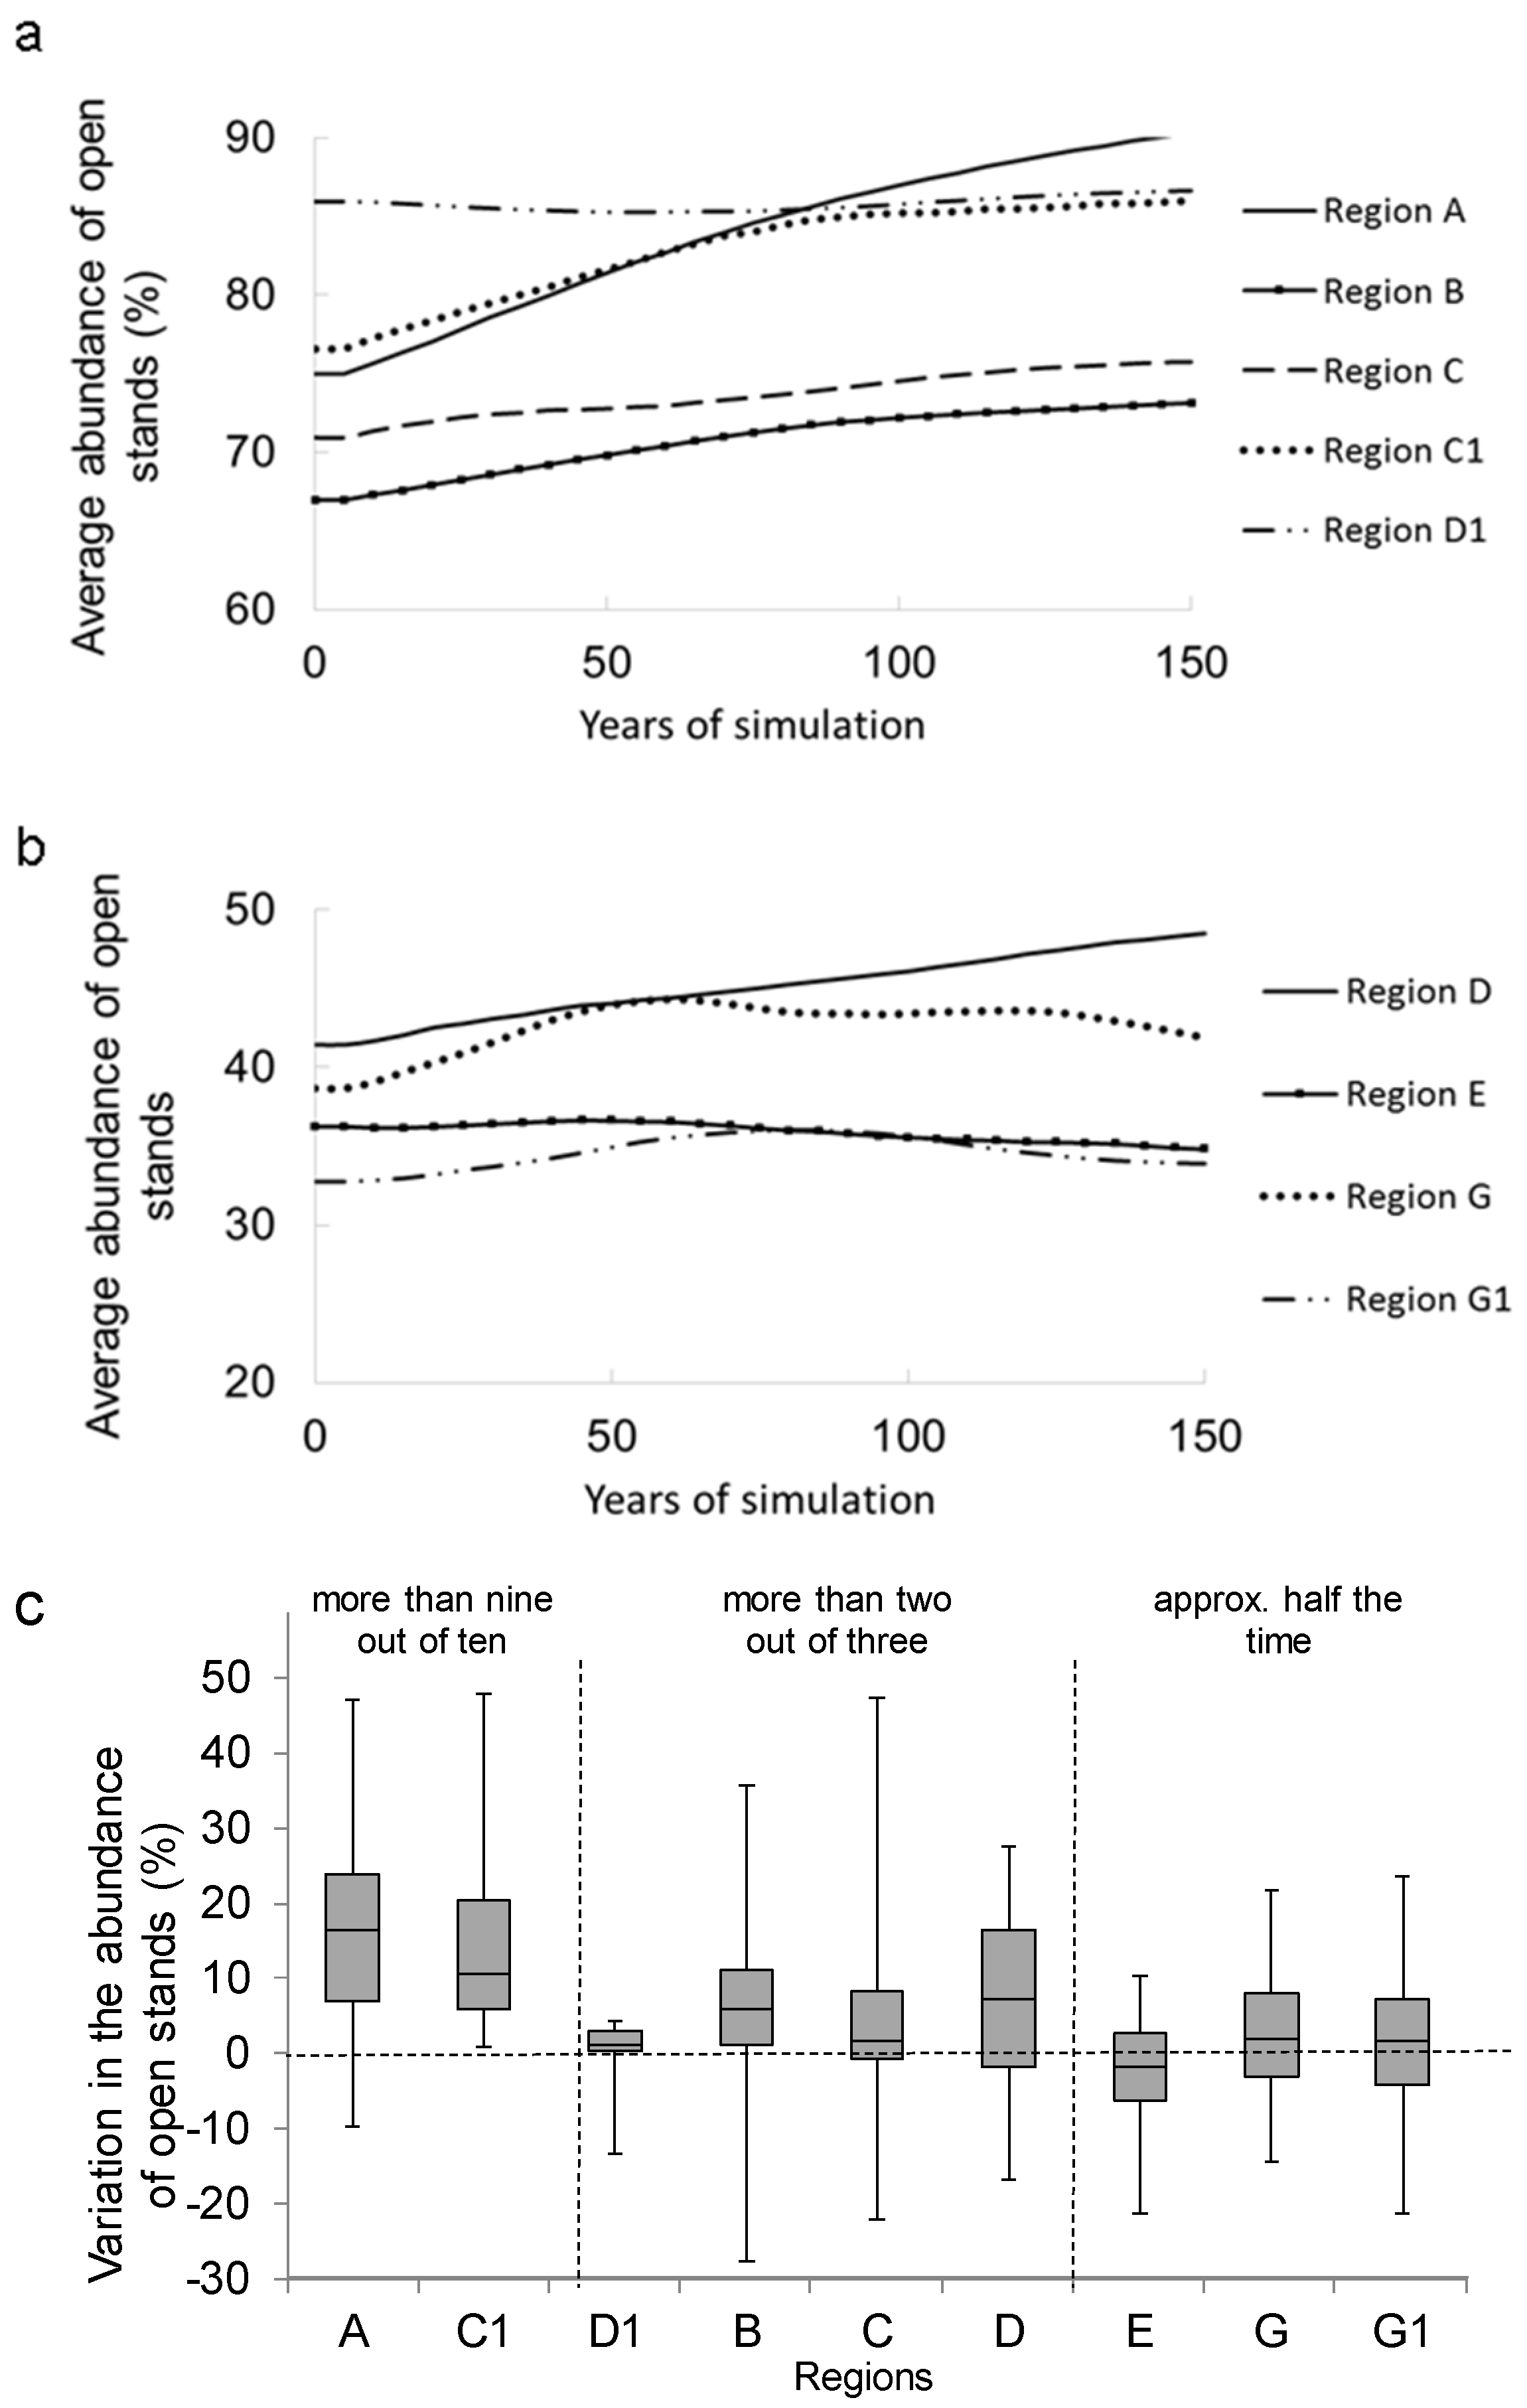
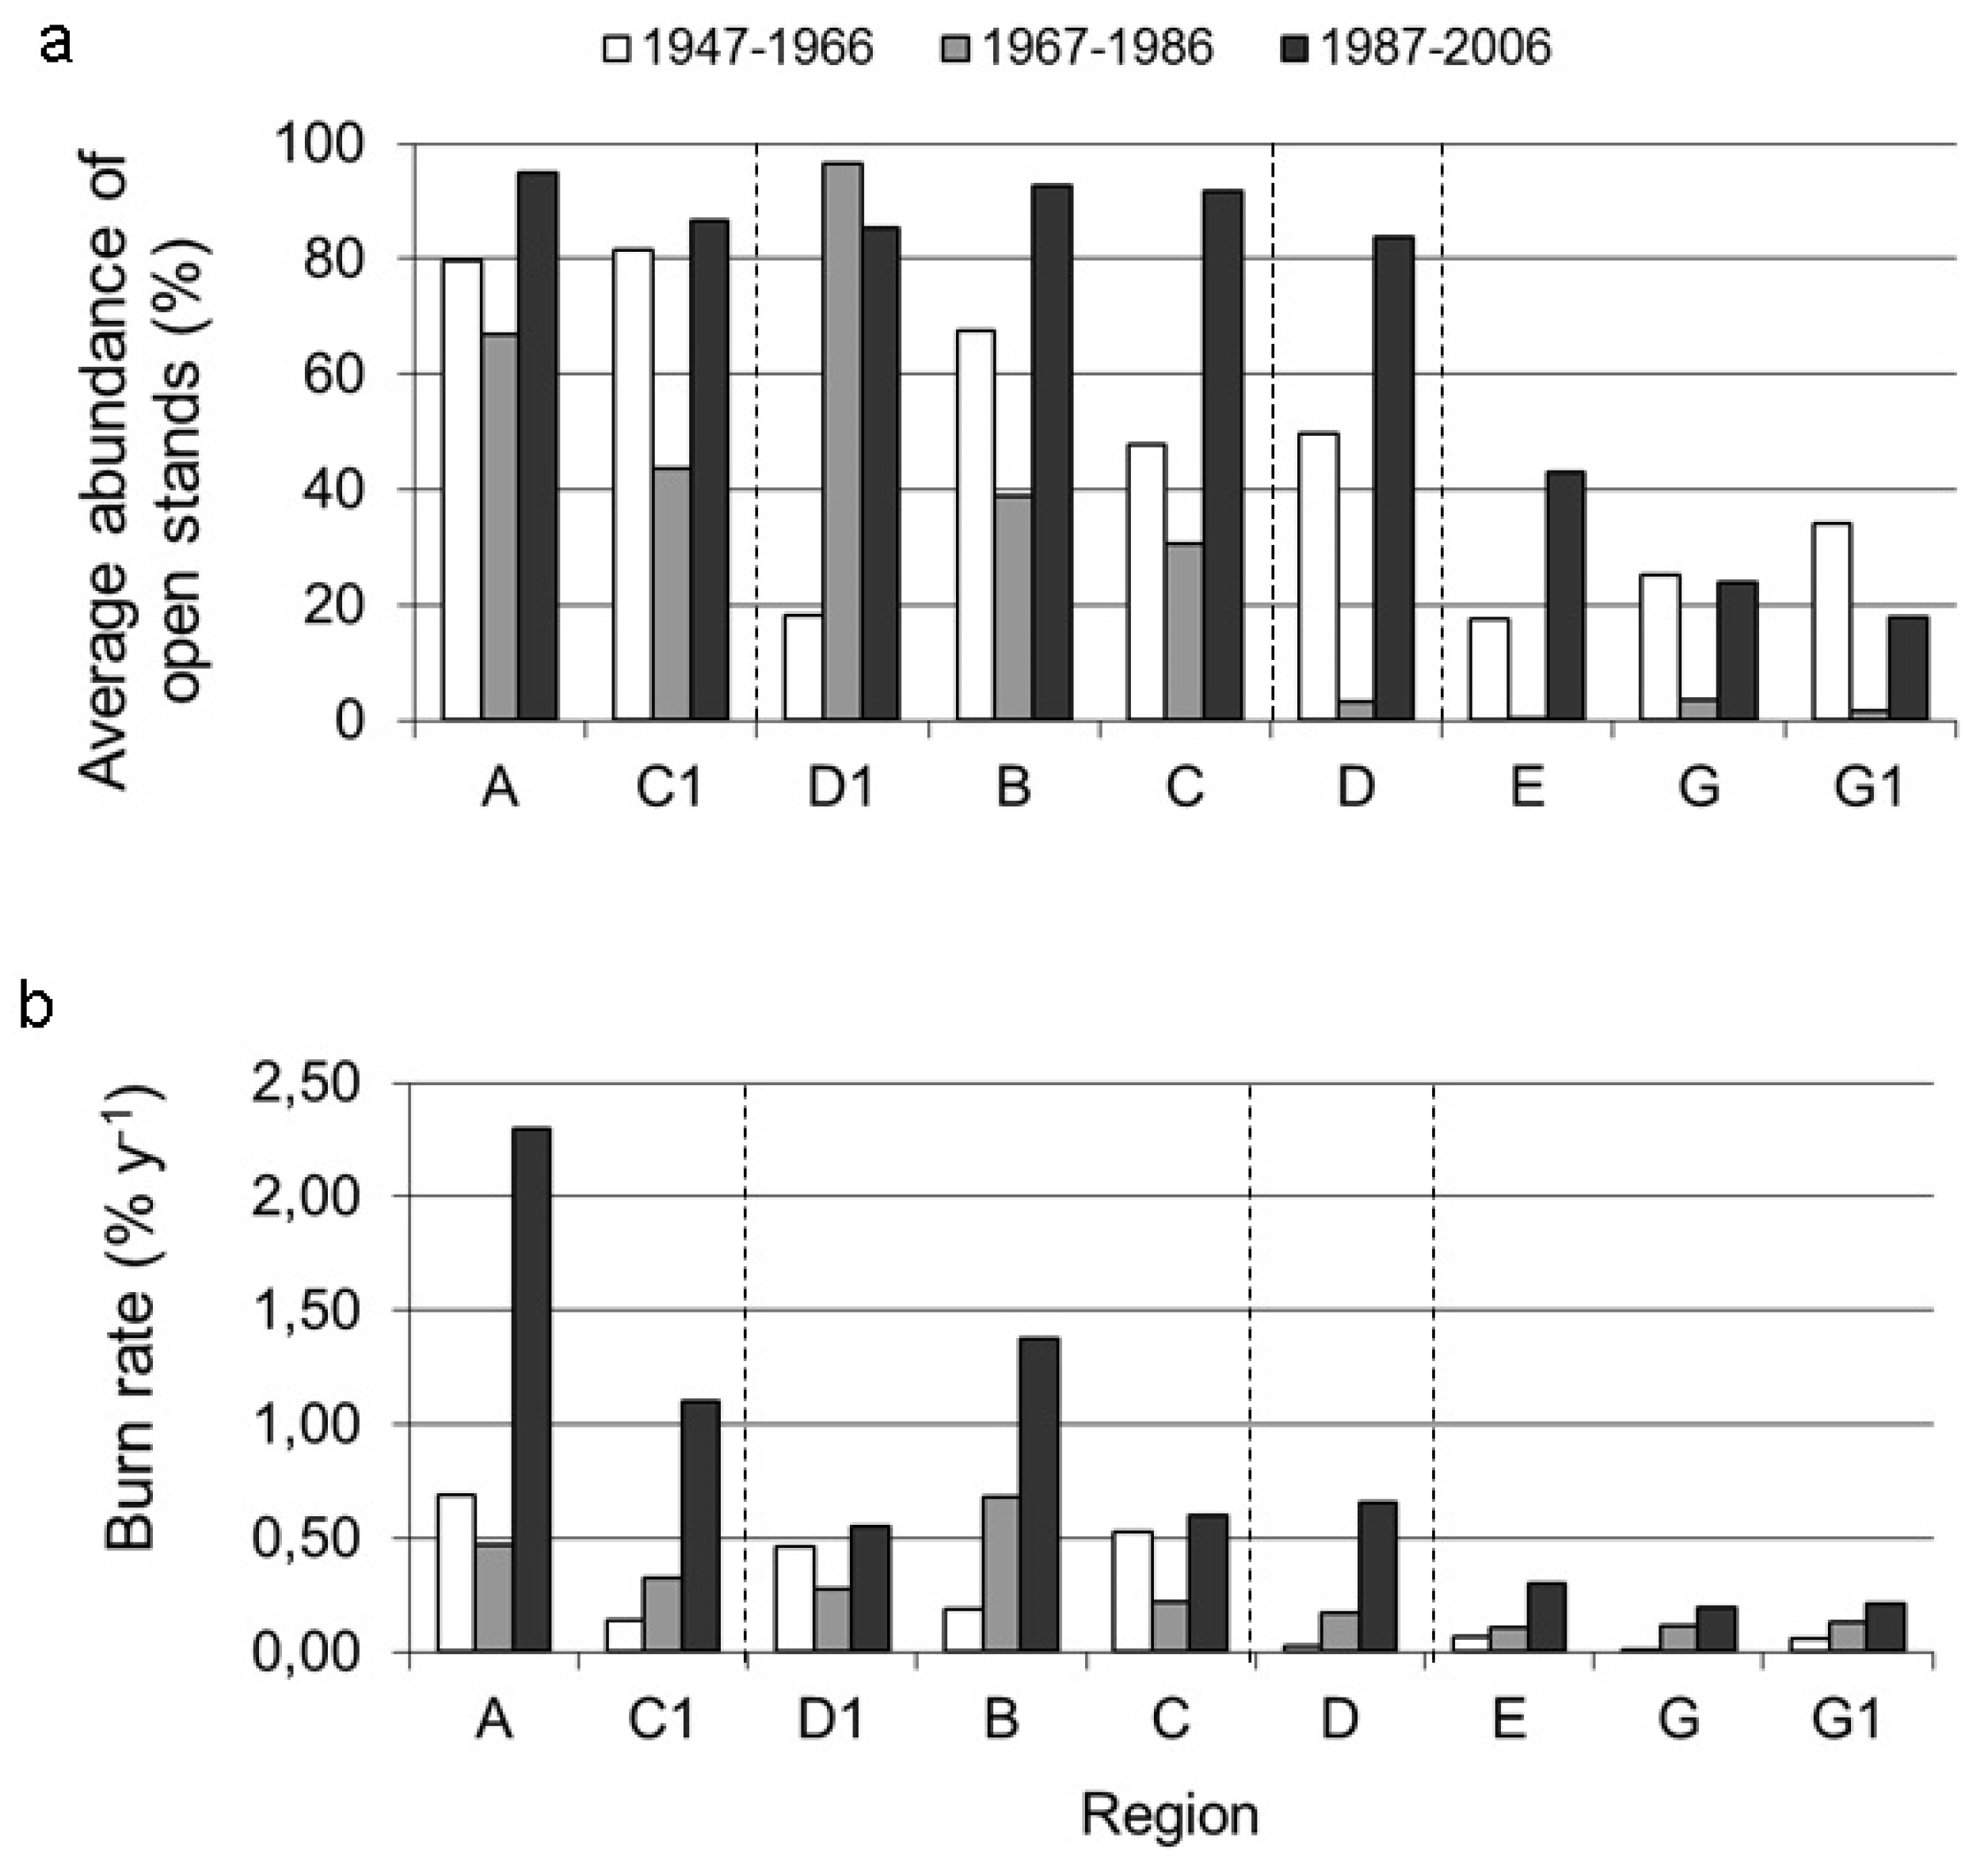
3.1. Temporal Variation in the Abundance of Open Stands

Simulations using the landscape dynamics model show a sometimes substantial variation in the abundance of open stands over the 150-year period covered for virtually all ten fire zones (Figure 3). In the area dominated by open stands, only the D1 area seemed to show an equilibrium between the abundance of open stands and the disturbance rate. However, the abundance of open stands seems to increase by more than 10% over 150 years in two other fire zones (areas A and C1). Both of these zones are in fact located the furthest north among the areas covered by the study. The increase is not as significant for B and C areas that abut the area dominated by closed stands (Figure 3). In the area dominated by closed stands, only the D area seems to show a substantial increase in the abundance of open stands and this feature is related to the fact that this area is one that has sustained the highest burn rate between 1940 and 2006 in this fire zone (Figure 1).

3.2. Long-Term Change in Abundance of Open Stands

A transition matrix has been calibrated for each fire zone based on the empirical strata’s abundance distribution by age groups. The existence of different transition rates for each age group within a fire zone may partly explain the changes observed in the abundance of open stands during the simulations (Figure 3). The classification of open stands by date of origin (1947–1966, 1967–1986, and 1987–2006) shows the actual changes in their relative abundance over long periods (Figure 4a). A general increase in the abundance of open stands was recorded between 1987 and 2006, except for the D1 area. Where burn rates are the highest (in A, B, C1, D, and D1 areas), with the exception of the C fire zone, the increase was higher (up to 70%) between 1987 and 2006 (Figure 4a). This increase in the abundance of open stands observed during the past 20 years is related, with one exception (in the area C), with a recent increase in the regional burn rate (Figure 4b).

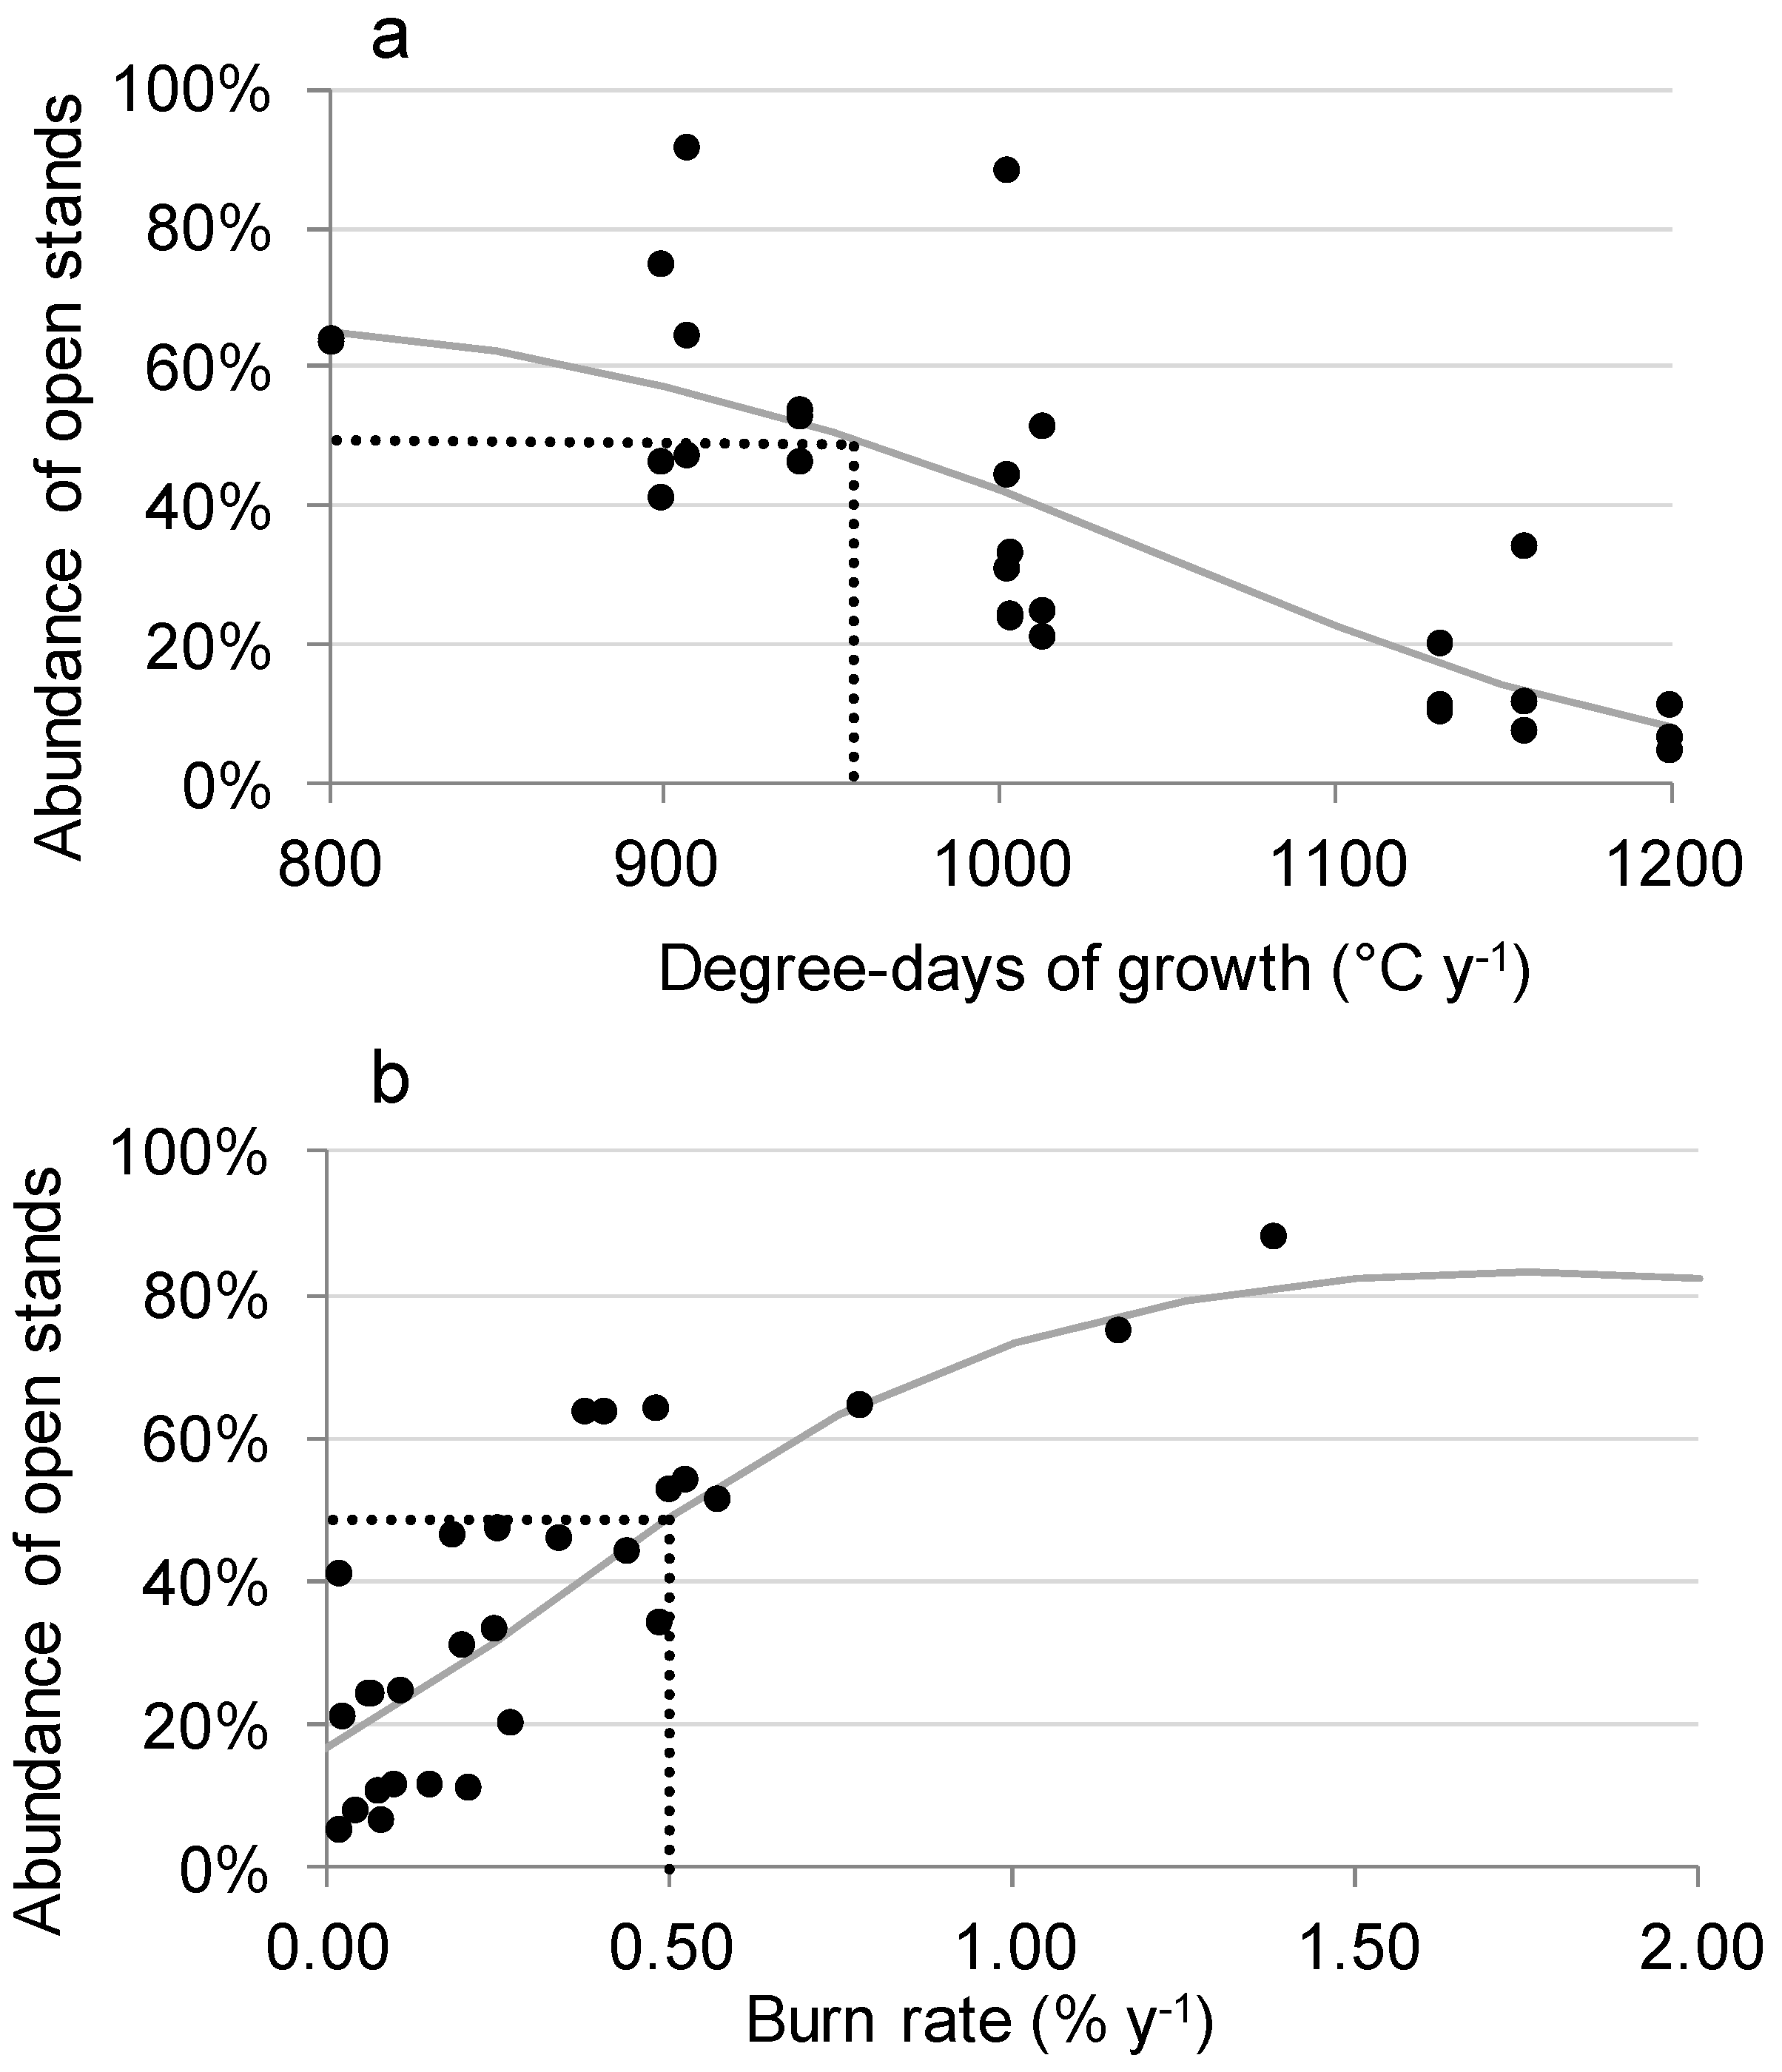
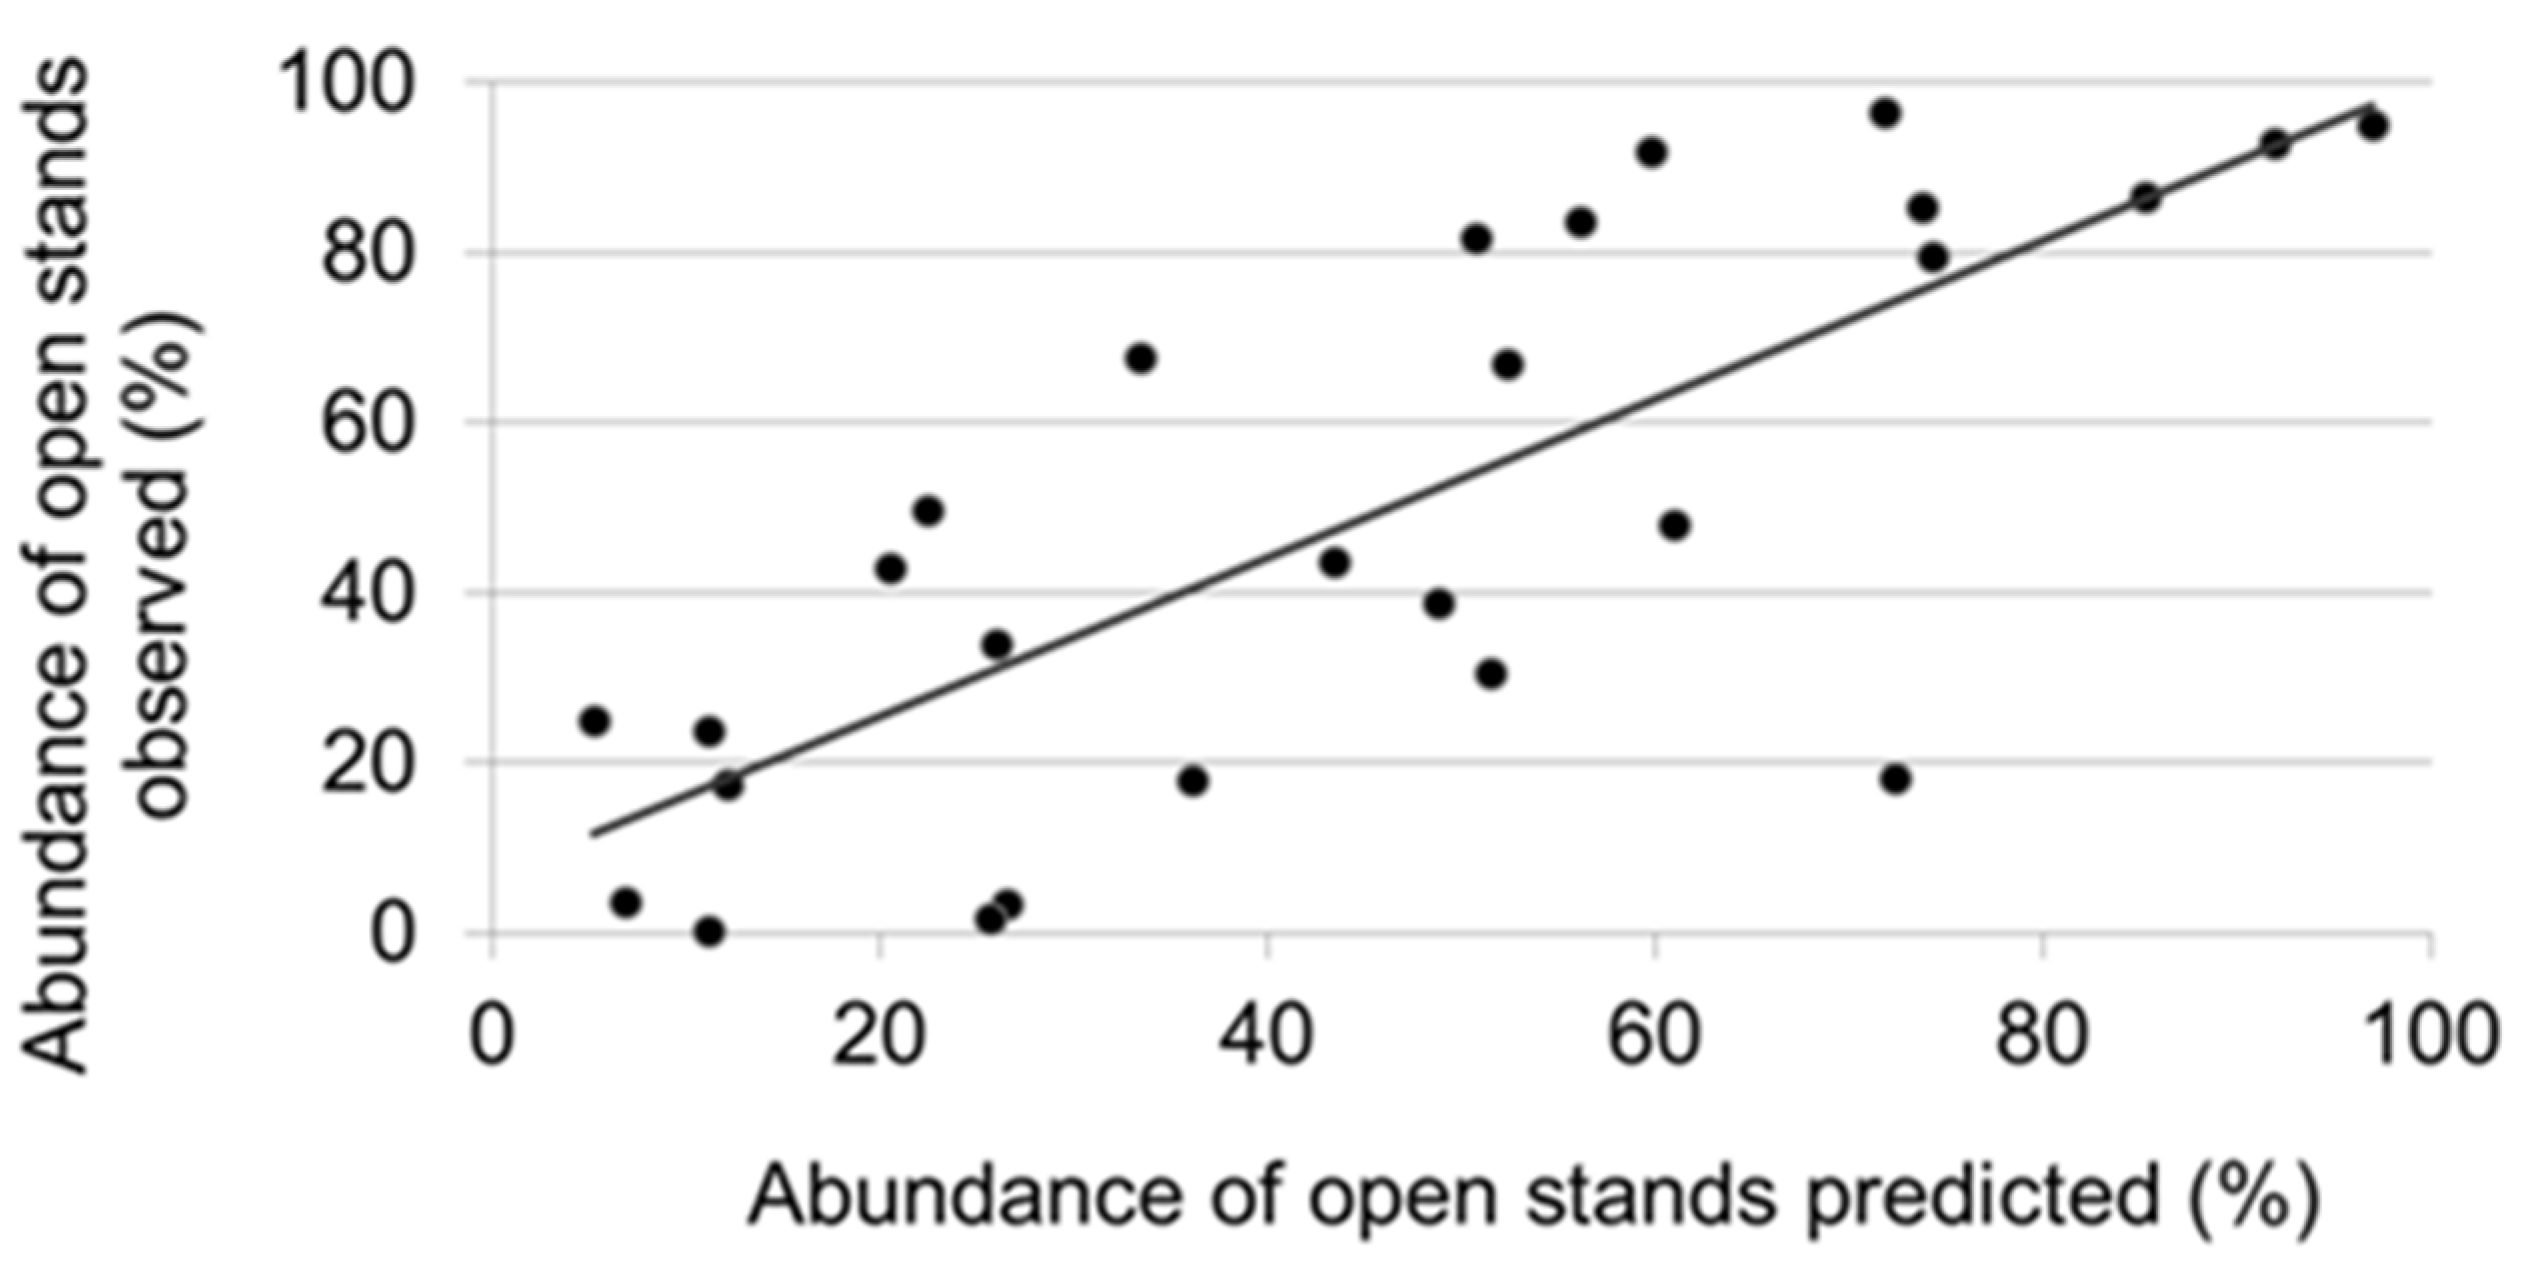
3.3. Factors Responsible for the Variation in the Abundance of Open Stands

The abundance of open stands observed at the simulation start (2006) by fire zone is explained mainly by the number of degree-days and the average burn rate (Table 2). The abundance of open stands exceeds 50% when the degree-days of growth are lower than 1000 °C·year−1 or when the burn rate is above 0.5% year−1 (Figure 5). The logistic model explains 60% of the regional variation in the abundance of open stands (Figure 6).
The increase in the abundance of open stands after 150 years of simulations is explained mainly by the total precipitation, the last day of frost and the burn rate (Table 1). The increase was more significant in the A and C1 areas, which are drier and/or cooler (total precipitation < 900 mm·year−1; average last day of frost > 170 Julian day), and/or when the burn rate is higher (>0.5% year−1). According to the simulation results (Figure 3c, Figure 7), the abundance of open stands increases in more than 90% of the simulations in the A and C1 areas and in more than two-third of the simulations in B, C, D, and D1 areas.

4. Discussion

4.1. Correlation of Fire Frequency with the Abundance of Open Stands

The abundance of open stands by fire zone is mainly explained by the burn rate and the regional climate [12] (Figure 2), but also by the periodic variations in the burn rate. Our results show that the vegetation is not in equilibrium with the disturbance regime in all regions and that it may respond immediately to changes in the fire burn rate over a time scale shorter than that of fire cycle (Figure 4). This vegetation/fire regime discrepancy (or lack of resilience) is accentuated when the degree-days of growth are low (less than 1000 °C·year−1) and/or when the burn rate is higher than 0.5% year−1. These results are consistent with the analysis of Chapin et al. [54] on the resilience of boreal forests and changes in forest composition: these forests are resilient to disturbances but when biophysical factors become strongly limiting to forest species, these forests start to lack resilience and their composition may change gradually. Some of the fire zones of our study area are indeed subject to a rather cold climate that does not help trees get established after a disturbance [55,56]. Simulations showed that the abundance of open stands should increase over a 150-year period in all fire zones, except for area E, if the burn rate remains equivalent to that observed between 1987 and 2006. As the importance of the simulated changes is related to climate (Figure 4, Table 2), they are predicted to occur over a clear north–south gradient (Figure 7).
The burn rate is defined as the mean annual area burned in a given territory [20,57]. In fact, the burn rate varies according to the area being calculated and the periods of time selected being covered by the calculation [58]. This can lead to considerable variability of burn rate values or to their overestimation [59,60] that obscures the influence of fire regimes on the actual distribution of ecological patterns [61]. Landscape dynamics models often apply the assumption that fire regimes do not change for long periods of time, while significant variations in burn rates are observed from one year to the next, and from one decade to the next [58,62]. Our analysis indicates that periodic variations of the burn rate between 1947 and 2006 (Figure 5) had an immediate impact on the abundance of open stands (Figure 4). Such variations have also been observed throughout the entire study area and are related to the recent increase in the burn rate (1987 to 2006), except for area C. The increase in the abundance of open stands in this fire zone is probably due to a greater amount of precipitation because of the higher altitude that may have mitigated the severity of fires [63,64]. Indeed, when fires are less severe, they do not entirely consume the soil’s organic matter, and the absence of mineralized soil limits the regeneration of seeds [1,65,66,67,68]. Conversely, severe and more frequent fires promote the regeneration of pioneer species, such as jack pine. This is what is occurring in area A, where a higher proportion of jack pine has been noted by Rapanoela et al. [14], even though the stand density there is less [14] due to more frequent deficient postfire recovery [46].
Our results are based on simulations with empirical models: they are not based on an understanding of the underlying processes that drive forest succession. The semi-Markovian transition matrices used in the present study were calibrated from forest maps and therefore suffer from the defects of chronosequences, in which time is substituted by space [69,70]. They reflect past average effects of underlying processes that occurred at specific times and these effects may not exactly repeat themselves in the future. For instance, Markovian transition matrices are aspatial and ignore the importance of local neighbouring effects on forest succession [71]: if the abundance of open forest changes with time, local effects (historical legacies) should also change, which would impact the prediction of successive forest succession events. Forest succession is also conditioned by fire severity [65,66,67,68] that has been shown to be related to specific fire events [72]. As a consequence, changes of abundances and their variability, as simulated here (Figure 3c), cannot be used for predictive purposes (for instance to account for climate change effects [73]). Therefore, the present results served to demonstrate that the abundance of open forest stands has indeed increased in response to a recent increase in burn rates and to show the existence of a state of non-equilibrium over a relatively short time scale (in comparison with black spruce longevity), in line with the variability of the burn rate.

4.2. Natural Dynamics of the Spruce-Moss Forest and Lichen Woodland

The boreal forest is a vast ecosystem that was formed about 8000 years ago. From north to south, it encompasses four bioclimatic domains: forest tundra, Spruce-lichen woodland, spruce-moss forest and the balsam fir-white birch domain [9,74,75]. The spruce-moss forest is part of the sub-area of the boreal forest, where stands are relatively dense. Forest cover is essentially dominated by black spruce, and fire is the primary disruption that causes forest renewal [76,77]. Spruce-lichen woodland and spruce-moss forest used to be considered two separate communities [9,75,76]. The existence of these two communities under the same environmental and climatic conditions has led to the conclusion that the Spruce-lichen woodland and spruce-moss forest are stable alternative states [1,78]. However, our findings challenge this notion of stability, at least at the regional level and over a short time scale of decades.
Ecosystems can move from one state to another due to a severe disruption that acts directly on state variables [79]. State variables are quantities that change rapidly to ecologically relevant time scales, such as the density of the population [79]. In closed spruce-moss stands, the opening of stands is attributed to a poor regeneration of the main species after several disturbances [2,6,78,80] that leads a burned area unable to recover from a disruption [81]. If regeneration is good, the amount of black spruce should increase during the first 90 years and decline thereafter [52]. After 100 years but before 200 years have lapsed, the recruitment of young plants initiates the beginning of a structural change [82] and stands become irregular [52,83]. In our study area, the rate of regeneration is particularly slow and stand density is low [46,84]. Mansuy et al. [46] estimated that in our study area, it takes an average of 25 years for a majority of burned-over areas to reach a regenerated stage, and 45 years for stands over 7 m in height to dominate burned sites. The increase in plant density seems to happen gradually since the time of the last fire [85] and therefore, the abundance of closed stands is favoured by a low burn rate (Figure 4). The openness of the forest in connection with a temporarily higher burn rate demonstrates a potential instability of the spruce-moss forest, since a temporal change in the fire regime triggers a change in the forest mosaic, by altering the abundance of open and closed stands.

4.3. Vulnerability and Adaptation to Disturbance Regimes

The vulnerability of boreal forest ecosystems depends on the extent of their adaptive capacity and resilience to disturbances. In terms of resilience, it is assumed that the boreal forest is locally vulnerable to the loss of forest cover resulting from permafrost degradation [56], successive disturbances [78,86], or drought [87]. However, the persistence of wide landscapes of greater canopy opening caused by an increase in the burn rate could result in a long-term major change in the composition and structure of the spruce-moss forest, with a greater dominance of the less dense stands in the landscape. Consideration of species adaptation is key to effective and sustainable forest management [88]. Indeed, when assessing the risk of changes in stands or productivity losses [14,37], management decisions should be taken in a view to try to reduce the vulnerability of ecosystems. Following this study, a vulnerability threshold can be established with regard to the proportions of open stands in a landscape composed of spruce-moss stands (Figure 5), based on tolerance to change. The proportion of closed landscapes and acceptable biodiversity losses related to a decrease of closed stand abundance [89] will depend on forest management objectives.

5. Conclusions

Our objective was to evaluate if the closure of the forest was unstable over time and not in stable equilibrium with the current fire regime. As the proportion of open stands is explained mainly by the frequency of fires and the regional climate, but also by the periodic variations of the burn rate, our results showed that vegetation responds quickly to occasional changes in the fire activity. When the burn rate is higher, there is a significant increase in the abundance of open stands. The recent increase in the burn rate over the past two decades has led to a greater abundance of open stands, which can already be observed in the current landscape. It is apparent from this study that forestry planning should consider the risks associated with the temporal variability of fire regimes on the forest ecosystem, as the resulting changes can have a significant impact on biodiversity and allowable cut estimates.

Supplementary Materials

The supplementary materials of this paper are available online at www.mdpi.com/1999-4907/7/5/103/s1. File S1: Programming code used for the landscape dynamics model. SELES is required to run such code and is available upon request by contacting its author, Andrew Fall ([email protected], http://www.gowlland.ca/). Furthermore, we could not share all the data used for the simulations as forest maps and inventory plots are owned by the Ministry of Forests, Wildlife and Parks of Quebec. The programming code comes however with a sample dataset. Any interested person can access the data as we did: this data is available upon request by contacting [email protected] (Direction des inventaires forestiers, 5700, 4e Avenue Ouest, A-108, Québec (Québec) G1H 6R1, Canada. Phone: +(1)418-627-8669).

Acknowledgments

We thank Quebec’s Ministère de la Forêt, Faune et Parcs for giving us access to the data of the Nordic Ecoforest Inventory Program. This project was financially supported by the Fonds de recherche du Québec—Nature et technologies and by the scientific committee that was tasked to evaluate the northern timber allocation limit.

Author Contributions

R.R. and F.R. conceived the experiments. R.R. and F.R. analyzed the data. All authors discussed the results, and co-wrote the paper. All authors contributed to writing the paper.

Conflicts of Interest

The authors declare no conflict of interest.

References

  1. Pollock, S.L.; Payette, S. Stability in the patterns of long-term development and growth of the Canadian spruce-moss forest. J. Biogeogr. 2010, 37, 1684–1697. [Google Scholar] [CrossRef]
  2. Payette, S.; Bhiry, N.; Delwaide, A.; Simard, M. Origin of the lichen woodland at its southern range limit in eastern Canada: The catastrophic impact of insect defoliators and fire on the spruce-moss forest. Can. J. For. Res. 2000, 30, 288–305. [Google Scholar] [CrossRef]
  3. Ministère des Ressources Naturelles et de la Faune. Programme d’Inventaire Écoforestier Nordique. Norme de Cartographie Écoforestière. Direction des Inventaires Forestiers; Gouvernement du Québec: Québec, QC, Canada, 2008.
  4. Payette, S.; Delwaide, A. Shift of conifer boreal forest lichen-heath parkland caused by successive stand disturbances. Ecosystems 2003, 6, 540–550. [Google Scholar] [CrossRef]
  5. Simard, M.; Lecomte, N.; Bergeron, Y.; Bernier, P.Y.; Paré, D. Forest productivity decline caused by successional paludification of boreal soils. Ecol. Appl. 2007, 17, 1619–1637. [Google Scholar] [CrossRef] [PubMed]
  6. Girard, F.; Payette, S.; Gagnon, R. Rapid expansion of lichen woodlands within the closed-crown boreal forest zone over the last 50 years caused by stand disturbances in eastern Canada. J. Biogeogr. 2008, 35, 529–537. [Google Scholar] [CrossRef]
  7. Scheffer, M.; Hirota, M.; Holmgren, M.; Nes, E.H.V.; Chapin, F.S. Thresholds for boreal biome transitions. Proc. Natl. Acad. Sci. USA 2012, 109, 21384–21389. [Google Scholar] [CrossRef] [PubMed]
  8. Turner, M.G.; Romme, W.H.; Gardner, R.H.; O’Neill, R.V.; Kratz, T.K. A revised concept of landscape equilibrium: Disturbance and stability on scaled landscapes. Landsc. Ecol. 1993, 3, 213–227. [Google Scholar] [CrossRef]
  9. Robitaille, A.; Saucier, J.P. Paysages Régionaux du Québec Méridional. Ministère des Ressources Naturelles, Gouvernement du Québec; Les publications du Québec: Québec, QC, Canada, 1998. [Google Scholar]
  10. Bergeron, Y.; Dansereau, P.R. Fire history in the southern boreal forest of north-western Quebec. Can. J. For. Res. 1993, 23, 25–32. [Google Scholar]
  11. Le Goff, H.; Sirois, L. Black spruce and jack pine dynamics simulated under varying fire cycles in the northern boreal forest of Quebec, Canada. Can. J. For. Res. 2004, 34, 2399–2409. [Google Scholar] [CrossRef]
  12. Lavoie, L.; Sirois, L. Vegetation changes caused by recent fires in the northern boreal forest of eastern Canada. J. Veg. Sci. 1998, 9, 483–492. [Google Scholar] [CrossRef]
  13. Boucher, D.; Gauthier, S.; De Grandpré, L. Structural changes in coniferous stands along a chronosequence and a productivity gradient in the northeastern boreal forest of Québec. Ecoscience 2006, 13, 172–180. [Google Scholar] [CrossRef]
  14. Rapanoela, R.; Raulier, F.; Gauthier, S.; Ouzennou, H.; Saucier, J.P.; Bergeron, Y. Contrasting current and potential productivity and the influence of fire and species composition in the boreal forest: A case study in eastern Canada. Can. J. For. Res. 2015, 45, 541–552. [Google Scholar] [CrossRef]
  15. Van Wagner, C.E. Age-class distribution and the forest fire cycle. Can. J. For. Res. 1978, 8, 220–227. [Google Scholar] [CrossRef]
  16. Gauthier, S.; Leduc, A.; Bergeron, Y.; Le Goff, H. La fréquence des feux et l’aménagement forestier inspiré des perturbations naturelles. In Aménagement Écosystémique en Forêt Boréale; Gauthier, S., Vaillancourt, M.-A., Leduc, A., de Granpré, L., Kneeshaw, D., Morin, H., Drapeau, P., Bergeron, Y., Eds.; Presses de l’Université du Québec: Montréal, QC, Canada, 2008; pp. 61–78. [Google Scholar]
  17. Cyr, D.; Gauthier, S.; Bergeron, Y.; Carcaillet, C. Forest management is driving the eastern North American boreal forest outside its natural range of variability. Front. Ecol. Environ. 2009, 7, 519–524. [Google Scholar] [CrossRef]
  18. Liang, J.; Picard, N. Matrix model of forest dynamics: An overview and outlook. For. Sci. 2013, 59, 359–378. [Google Scholar] [CrossRef]
  19. Landres, P.; Morgan, P.; Swanson, F. Overview of the use of natural variability concepts in managing ecological systems. Ecol. Appl. 1999, 9, 1179–1188. [Google Scholar]
  20. Johnson, E.A.; Gutsell, S.L. Fire frequency models, methods and interpretations. Adv. Ecol. Res. 1994, 25, 239–287. [Google Scholar]
  21. Bergeron, Y.; Gauthier, S.; Kafka, V.; Lefort, P.; Lesieur, D. Natural fire frequency for the eastern Canadian boreal forest: Consequences for sustainable forestry. Can. J. For. Res. 2001, 31, 384–391. [Google Scholar] [CrossRef]
  22. Bergeron, Y.; Flannigan, M.; Gauthier, S.; Leduc, A.; Lefort, P. Past, current and future fire frequency in the Canadian boreal forest: Implications for sustainable forest management. Ambio 2004, 33, 356–360. [Google Scholar] [CrossRef] [PubMed]
  23. Bergeron, Y.; Gauthier, S.; Flannigan, M.; Kafka, V. Fire regimes at the transition between mixedwood and coniferous boreal forest in northwestern Quebec. Ecology 2004, 85, 1916–1932. [Google Scholar] [CrossRef]
  24. Stocks, B.J.; Mason, J.A.; Todd, J.B.; Bosch, E.M.; Wotton, B.M.; Amiro, B.D.; Flannigan, M.D.; Hirsch, K.G.; Logan, K.A.; Martell, D.L.; et al. Large forest fires in Canada, 1959–1997. J. Geophys. Res. 2003, 108D1, FFR-5. [Google Scholar] [CrossRef]
  25. Mansuy, N.; Gauthier, S.; Robitaille, A.; Bergeron, Y. The effects of surficial deposit-drainage combinations on spatial variations of fire cycles in the boreal forest of eastern Canada. Int. J. Wildland Fire 2010, 19, 1083–1098. [Google Scholar] [CrossRef]
  26. Metsaranta, J.M.; Kurz, W.A. Inter-annual variability of ecosystem production in boreal jack pine forests (1975–2004) estimated from tree-ring data using CBM-CFS3. Ecol. Model. 2012, 224, 111–123. [Google Scholar] [CrossRef]
  27. Mouillot, F.; Field, C.B. Fire history and the global carbon budget: A 1 × 1 fire history reconstruction for the 20th century. Glob. Chang. Biol. 2005, 11, 398–420. [Google Scholar] [CrossRef]
  28. Kasischke, E.S.; Turetsky, M.R. Recent changes in the fire regime across the North American boreal region—Spatial and temporal patterns of burning across Canada and Alaska. Geophys. Res. Lett. 2006, 33, L09703. [Google Scholar] [CrossRef]
  29. Morris, W.; Doak, D.; Groom, M.; Kareiva, P.; Fieberg, J.; Gerber, L.; Murphy, P.; Thomson, D. A Practical Handbook for Population Viability Analysis; The Nature Conservancy: Arlington, VA, USA, 1999. [Google Scholar]
  30. Buongiorno, J.; Gilless, J.K. Decision Methods for Forest Resource Management; Academic Press: Amsterdam, The Netherlands, 2003. [Google Scholar]
  31. Zhou, M.; Buongiorno, J. Forest landscape management in a stochastic environment, with an application to mixed loblolly pine-hardwood forest. For. Ecol. Manag. 2006, 223, 170–182. [Google Scholar] [CrossRef]
  32. Caswell, H. Matrix Population Models: Construction, Analysis and Interpretation; Sinauer: Sunderland, MA, USA, 1989. [Google Scholar]
  33. Yemshanov, D.G.; Perera, A.H. A spatially explicit stochastic model to simulate boreal forest cover transitions: General structure and properties. Ecol. Model. 2002, 150, 189–209. [Google Scholar] [CrossRef]
  34. Régnière, J.; Saint-Amant, R. BioSIM 9—Manuel de l’Utilisateur; Rapport d’information LAU-X-134F; Ressources Naturelles Canada, Service Canadien des Forêts, Centre de Foresterie des Laurentides: Québec, QC, Canada, 2008. Available online: ftp://ftp.cfl.scf.rncan.gc.ca/regniere/software/BioSIM/ (accessed on 11 December 2013).
  35. Ministère des Ressources Naturelles et de la Faune (MRNFQ). Limite Nordique des Forêts Attribuables; Rapport Final du Comité; Ministère des Ressources Naturelles et de la Faune: Québec, QC, Canada, 2000. Available online: http://www.mrn.gouv.qc.ca/publications/forets/consultation/partie1.pdf (accessed on 12 November 2013).
  36. Létourneau, J.P.; Matajek, S.; Morneau, C.; Robitaille, A.; Roméo, T.; Brunelle, J.; Leboeuf, A. Norme de Cartographie Écoforestière du Programme d’Inventaire Écoforestier Nordique; Ministère des Ressources Naturelles et de la Faune: Québec, QC, Canada, 2008.
  37. Gauthier, S.; Raulier, F.; Ouzennou, H.; Saucier, J.-P. Strategic analysis of forest vulnerability to risk related to fire: An example from the coniferous boreal forest of Quebec. Can. J. For. Res. 2015, 45, 553–565. [Google Scholar] [CrossRef]
  38. Fall, A.; Fortin, M.-J.; Kneeshaw, D.D.; Yamasaki, S.H.; Messier, C.; Bouthillier, L.; Smyth, C. Consequences of various landscape-scale ecosystem management strategies and fire cycles on age-class structure and harvest in boreal forests. Can. J. For. Res. 2004, 34, 310–322. [Google Scholar] [CrossRef] [Green Version]
  39. Didion, M.; Fortin, M.-J.; Fall, A. Forest age structure as indicator of boreal forest sustainability under alternative management and fire regimes: A landscape level sensitivity analysis. Ecol. Model. 2007, 200, 45–58. [Google Scholar] [CrossRef]
  40. James, P.M.A.; Fortin, M.-J.; Sturtevant, B.R.; Fall, A.; Kneeshaw, D.D. Modelling spatial interactions among fire, spruce budworm, and logging in the boreal forest. Ecosystems 2011, 14, 60–75. [Google Scholar] [CrossRef]
  41. Tittler, R.; Messier, C.; Fall, A. Concentrating anthropogenic disturbance to balance ecological and economic values: Applications to forest management. Ecol. Appl. 2012, 22, 1268–1277. [Google Scholar] [CrossRef] [PubMed]
  42. Fall, A.; Fall, J. A domain-specific language for models of landscape dynamics. Ecol. Model. 2001, 141, 1–18. [Google Scholar] [CrossRef]
  43. Raulier, F.; Dhital, N.; Racine, P.; Tittler, R.; Fall, A. Increasing resilience of timber supply: How a variable buffer stock of timber can efficiently reduce exposure to shortfalls caused by wildfires. For. Pol. Econ. 2014, 46, 47–55. [Google Scholar] [CrossRef]
  44. McRoberts, R.E.; Nelson, M.D.; Wendt, D.G. Stratified estimation of forest area using satellite imagery, inventory data, and the k-nearest neighbors technique. Remote Sens. Environ. 2002, 82, 457–468. [Google Scholar] [CrossRef]
  45. McRoberts, R.E.; Tomppo, E.O.; Finley, A.O. Heikkinen, J. Estimating areal means and variances of forest attributes using the k-Nearest Neighbors technique and satellite imagery. Remote Sens. Environ. 2007, 111, 466–480. [Google Scholar] [CrossRef]
  46. Mansuy, N.; Gauthier, S.; Robitaille, A.; Bergeron, Y. Regional patterns of post fire canopy recovery in the northern boreal forest of Quebec: Interactions between surficial deposit, climate, and fire cycle. Can. J. For. Res. 2012, 42, 1328–1343. [Google Scholar] [CrossRef]
  47. Gower, J.C. A general coefficient of similarity and some of its properties. Biometrics 1971, 27, 857–871. [Google Scholar] [CrossRef]
  48. Tuominen, S.; Fish, S.; Poso, S. Combining remote sensing, data from earlier inventories, and geostatistical interpolation in multisource forest inventory. Can. J. For. Res. 2003, 33, 624–634. [Google Scholar] [CrossRef]
  49. Dunne, T.; Leopold, L.B. Water in Environmental Planning, 1st ed.; W.H. Freeman & Company: New York, NY, USA, 1978. [Google Scholar]
  50. Sutherland, G.D.; Eng, M.; Fall, S.A. Effects of uncertainties about stand-replacing natural disturbances on forest-management projections. J. Ecosyst. Manag. 2004, 4, 1–18. Available online: http://www.forrex.org/jem/2004/vol4/no2/art5.pdf (accessed on 9 May 2016). [Google Scholar]
  51. Hatcher, R.J. A Study of Black Spruce Forests in Northern Quebec; Department of Forests: Ottawa, ON, Canada, 1963.
  52. Bouchard, M.; Pothier, D.; Gauthier, S. Fire return intervals and tree species succession in the North Shore region of eastern Quebec. Can. J. For. Res. 2008, 38, 1621–1633. [Google Scholar] [CrossRef]
  53. Confais, J.; le Guen, M. Premiers pas en Régression Linéaire avec SAS; Revue MODULAD; SAS Institute Inc.: Cary, NC, USA, 2006. [Google Scholar]
  54. Chapin, F.S., III; Callaghan, T.V.; Bergeron, Y.; Fukuda, M.; Johnstone, J.F.; Juday, G.; Zimov, S.A. Global change and the boreal forest: Thresholds, shifting states or gradual changes. Ambio 2004, 33, 361–365. [Google Scholar] [CrossRef] [PubMed]
  55. Sirois, L.; Bonan, G.B.; Shugart, H.H. Development of a simulation model of forest-tundra transition zone of northeastern Canada. Can. J. For. Res. 1994, 24, 697–706. [Google Scholar] [CrossRef]
  56. Price, D.T.; Alfaro, R.I.; Brown, K.J.; Flannigan, M.D.; Fleming, R.A.; Hogg, E.H.; Girardin, M.P.; Lakusta, T.; Johnston, M.; McKenney, D.W.; et al. Anticipating the consequences of climate change for Canada’s boreal forest ecosystems. Environ. Rev. 2013, 21, 322–365. [Google Scholar] [CrossRef]
  57. Johnson, E.A.; Van Wagner, C.E. The theory and use of two fire history models. Can. J. For. Res. 1985, 15, 214–220. [Google Scholar] [CrossRef]
  58. Metsaranta, J.M. Potentially limited detectability of short-term changes in boreal fire regimes: A simulation study. Int. J. Wildland Fire 2010, 19, 1140–1146. [Google Scholar] [CrossRef]
  59. Li, C. Estimation of fire frequency and fire cycle: A computational perspective. Ecol. Model. 2002, 154, 103–120. [Google Scholar] [CrossRef]
  60. Ter-Mikaelian, M.T.; Colombo, S.J.; Chen, J. Estimating natural forest fire return interval in northeastern Ontario, Canada. For. Ecol. Manag. 2009, 258, 2037–2045. [Google Scholar] [CrossRef]
  61. Boulanger, Y.; Gauthier, S.; Burton, P.J. A refinement of models projecting future Canadian fire regimes using homogeneous fire regime zones. Can. J. For. Res. 2014, 44, 365–376. [Google Scholar] [CrossRef]
  62. Le Goff, H.; Flannigan, M.D.; Bergeron, Y.; Girardin, M.P. Historical fire regime shifts related to climate teleconnections in the Waswanipi area, central Quebec, Canada. Int. J. Wildland Fire 2007, 16, 607–618. [Google Scholar] [CrossRef]
  63. Sirois, L. Impact of fire on Picea mariana and Pinus banksiana seedlings in subarctic lichen woodlands. J. Veg. Sci. 1993, 4, 795–802. [Google Scholar] [CrossRef]
  64. Barrett, K.; Kasischke, E.S.; McGuire, A.D.; Turetsky, M.R.; Kane, E.S. Modeling fire severity in black spruce stands in the Alaskan boreal forest using spectral and non-spectral geospatial data. Remote Sens. Environ. 2010, 114, 1494–1503. [Google Scholar] [CrossRef]
  65. Johnstone, J.F.; Kasischke, E.S. Stand-level effects of soil burn severity on postfire regeneration in a recently burned black spruce forest. Can. J. For. Res. 2005, 35, 2151–2163. [Google Scholar] [CrossRef]
  66. Lecomte, N.; Simard, M.; Bergeron, Y. Effects of fire severity and initial tree composition on stand structural development in the coniferous boreal forest of northwestern Québec, Canada. Ecoscience 2006, 13, 152–163. [Google Scholar] [CrossRef]
  67. Johnstone, J.F.; Chapin, F.S. Effects of soil burn severity on post-fire tree recruitment in boreal forest. Ecosystems 2006, 9, 14–31. [Google Scholar] [CrossRef]
  68. Jin, Y.; Randerson, J.T.; Goetz, S.J.; Beck, P.S.A.; Loranty, M.M.; Goulden, M.L. The influence of burn severity on post-fire vegetation recovery and albedo change during early succession in North American boreal forests. J. Geophys. Res. 2012, 117, G01036. [Google Scholar] [CrossRef]
  69. Johnson, E.A.; Miyanishi, K. Testing the assumptions of chronosequences in succession. Ecol. Lett. 2008, 11, 419–431. [Google Scholar] [CrossRef] [PubMed]
  70. Taylor, A.R.; Chen, H.Y.H. Multiple successional pathways of boreal forest stands in central Canada. Ecography 2011, 34, 208–219. [Google Scholar] [CrossRef]
  71. Frelich, L.E.; Reich, P.B. Neighborhood effects, disturbance severity, and community stability in forests. Ecosystems 1999, 2, 151–166. [Google Scholar] [CrossRef]
  72. Miller, J.D.; Skinner, C.N.; Safford, H.D.; Knapp, E.E.; Ramirez, C.M. Trends and causes of severity, size, and number of fires in northwestern California, USA. Ecol. Appl. 2012, 22, 184–203. [Google Scholar] [CrossRef] [PubMed]
  73. Gauthier, S.; Bernier, P.; Kuuluvainen, T.; Shvidenko, A.Z.; Schepaschenko, D.G. Boreal forest health and global change. Science 2015, 349, 819–822. [Google Scholar] [CrossRef] [PubMed]
  74. Rowe, J.S. Forest Regions of Canada. Bulletin 123; Government of Canada, Department of Northern Affairs and National Resources, Forestry Branch, Headquarters: Ottawa, ON, Canada, 1959.
  75. Hare, F.K.; Ritchie, J.C. The boreal Bioclimates. Geogr. Rev. 1972, 62, 333–65. [Google Scholar] [CrossRef]
  76. Heinselman, M.L. The natural role of fire in northern conifer forests. In Proceedings of the Fire in the Northern Environment: A symposium, Fairbanks, AK, USA, 13–14 April 1971; Slaughter, C.W., Barney, R.J., Hansen, G.M., Eds.; USDA, Forest Service, Pacific Northwest Research Station: Portland, OR, USA; pp. 61–72.
  77. Payette, S. Fire as a controlling process in the North American boreal forest. In Systems Analysis of the Global Boreal Forest; Shugart, H.H., Leemans, R., Bonan, G.B., Eds.; Cambridge University Press: Cambridge, UK, 1992; pp. 144–169. [Google Scholar]
  78. Jasinski, J.P.P.; Payette, S. The creation of alternative stable states in the southern boreal forest, Québec, Canada. Ecol. Monogr. 2005, 75, 561–583. [Google Scholar] [CrossRef]
  79. Beisner, B.E.; Haydon, D.T.; Cuddington, K. Alternative stable states in ecology. Front. Ecol. Environ. 2003, 1, 376–382. [Google Scholar] [CrossRef]
  80. Gagnon, R.; Morin, H. Les forêts d'épinette noire au Québec: Dynamique, perturbations et biodiversité. Nat. Can. 2001, 125, 26–35. [Google Scholar]
  81. Holling, C.S. Resilience and stability of ecological systems. Ann. Rev. Ecol. Syst. 1973, 4, 1–23. [Google Scholar] [CrossRef]
  82. Groot, A.; Horton, B.J. Age and size structure of natural and second-growth peatland Picea mariana stands. Can. J. For. Res. 1994, 24, 225–233. [Google Scholar] [CrossRef]
  83. Garet, J.; Raulier, F.; Pothier, D.; Cumming, S.G. Forest age class structures as indicators of sustainability in boreal forest: Are we measuring them correctly? Ecol. Indic. 2012, 23, 202–210. [Google Scholar] [CrossRef]
  84. Van Bogaert, R.K.; Gauthier, S.; Raulier, F.; Saucier, J.P.; Boucher, D.; Robitaille, A.; Bergeron, Y. Exploring forest productivity at an early age after fire: A case study at the northern limit of commercial forests in Quebec. Can. J. For. Res. 2015, 45, 579–593. [Google Scholar] [CrossRef]
  85. Irulappa Pillai Vijayakumar, D.B.; Raulier, F.; Bernier, P.; Paré, D.; Gauthier, S.; Bergeron, Y.; Pothier, D. Cover density recovery after fire disturbance controls landscape aboveground biomass carbon in the boreal forest of eastern Canada. For. Ecol. Manag. 2016, 360, 170–180. [Google Scholar] [CrossRef]
  86. Girard, F.; Payette, S.; Gagnon, R. Origin of the lichen-spruce woodland in the closed-crown forest zone of eastern Canada. Glob. Ecol. Biogeogr. 2009, 18, 291–303. [Google Scholar] [CrossRef]
  87. Hogg, E.H.; Bernier, P.Y. Climate change impacts on drought-prone forests in western Canada. For. Chron. 2005, 81, 675–682. [Google Scholar] [CrossRef]
  88. Gauthier, S.; Bernier, P.; Burton, P.J.; Edwards, J.; Isaac, K.; Isabel, N.; Jayen, K.; Le Goff, H.; Nelson, E.A. Climate change vulnerability and adaptation in the managed Canadian boreal forest. Environ. Rev. 2014, 22, 256–285. [Google Scholar] [CrossRef]
  89. Imbeau, L.; St-Laurent, M.-H.; Marzell, L.; Brodeur, V. Current capacity to conduct ecologically sustainable forest management in northeastern Canada reveals challenges for conservation of biodiversity. Can. J. For. Res. 2015, 45, 567–578. [Google Scholar] [CrossRef]
Figure 1. Burn rates [25] and degree-days [34] for the study area. The hatched area lies outside of the spruce-moss bioclimatic domain [9] or a regional burn rate could not be estimated [25]. The northern limit of commercial forests was set in 2002 by the Ministère des Ressources Naturelles et de la Faune [35].
Forests 07 00103 g001
Figure 2. Average proportion by fire zones of the abundance of open stands in 2006.
Forests 07 00103 g002
Figure 3. Dynamics of the average abundance of open stands in fire zones dominated by open stands (a); and in fire zones dominated by closed stands (b) with 100 simulations over 150 years of a forest succession model in interaction with natural disturbances. (c) Box and whisker plots representing the frequency distributions of the differences between final and initial abundances of open stands of 100 simulations over 150 years. Cumulative frequencies of positive changes were regrouped into frequency classes (more than nine out of ten: 0.90–0.99; more than two out of three: 0.66–0.90; and approximately half the time: 0.33–0.66).
Forests 07 00103 g003
Figure 4. Average abundance of open stands by fire region for three 20-year periods (1947–1966, 1967–1986, and 1987–2006) (a); and corresponding regional burn rates by periods (b).
Forests 07 00103 g004
Figure 5. Relationship between the abundance of open stands by fire zone and degree-days of growth (a) and burn rate (b). Continuous lines refer to the logistic regression presented in Table 2.
Forests 07 00103 g005
Figure 6. Predicted vs. observed abundance of open stands by fire zone. Predicted values stem from the logistic regression presented in Table 2.
Forests 07 00103 g006
Figure 7. Frequency of change in the abundance of open stands after 150 years of simulation of a forest succession model in interaction with natural disturbances.
Forests 07 00103 g007
Table 1. General information on the 10 fire zones of the study area.
RegionArea (km2)Degree Day (°C·year−1)Burn Rate (%·year−1) [25]Abundance of Open Stands (Median) in 2006 (%)
A18,5259001.1189
B35,15710000.7888
C142659000.6754
C42,4689400.4885
D164928000.4281
D14,29110100.3793
E11,52211300.2844
G115,04310000.1634
G13,50912000.1428
Table 2. List of variables selected with logistic regression to explain the variability of abundance of open stands by fire zones and increase in open stands after 150 years of simulations with a forest succession model in interaction with natural disturbances.
Abundance of Open StandsProbability of Increase of Open Stands
VariablesEstimate (SE)Wald χ2VariablesEstimate (SE)Wald χ2
Degree day0.0078 (0.0007)106.7Last frost day0.0595 (0.0109)29.8
Degree day × burn rate−1.058 (0.217)23.9Total precipitation−0.00886 (0.0019)22.0
Burn rate794 (207)14.7Burn rate1.248 (0.269)21.6

