Article

Effects of Elevated Ozone on Stoichiometry and Nutrient Pools of Phoebe Bournei (Hemsl.) Yang and Phoebe Zhennan S. Lee et F. N. Wei Seedlings in Subtropical China

1
Institute of Forest Ecology, Environment and Protection, Chinese Academy of Forestry, Key Laboratory of Forest Ecology and Environment, State Forestry Administration, Beijing 100091, China
2
College of Soil and Water Conservation, Beijing Forestry University, Beijing 100083, China
*
Author to whom correspondence should be addressed.
Forests 2016, 7(4), 78; https://doi.org/10.3390/f7040078
Submission received: 29 December 2015 / Revised: 25 March 2016 / Accepted: 28 March 2016 / Published: 31 March 2016

Abstract

:
Tropospheric ozone (O3) is considered one of the most critical air pollutants in many parts of the world due to its detrimental effects on plants growth. However, the stoichiometric response of tree species to elevated ozone (O3) is poorly documented. In order to understand the effects of elevated ozone on the stoichiometry and nutrient pools of Phoebe bournei (Hemsl.) Yang (P. bournei)and Phoebe zhennan S. Lee et F. N. Wei (P. zhennan), the present study examined the carbon (C), nitrogen (N), and phosphorous (P) concentrations, stoichiometric ratios, and stocks in foliar, stem, and root for P. bournei and P. zhennan with three ozone fumigation treatments (Ambient air, 100 ppb and 150 ppb). The results suggest that elevated ozone significantly increased the N concentrations in individual tissues for both of P. bournei and P. zhennan. On the contrary, elevated ozone decreased the C:N ratios in individual tissues for both of P. bournei and P. zhennan because the C concentration remained stable under the ozone stress. The P concentration, and C:P and N:P ratios in individual tissues for both P. bournei and P. zhennan did not exhibit consistent variation tendency with elevated ozone. Elevated ozone sharply reduced the total C, N, and P stocks and altered the pattern of C, N, and P allocation for both P. bournei and P. zhennan. The present study suggests that tropospheric ozone enrichment should be considered an important environmental factor on stoichiometry of tree species.

1. Introduction

Tropospheric ozone (O3) is one of the most important secondary air pollutants in many parts of the world [1], and its background levels in the Northern Hemisphere have increased by around 2–4.5 times since the pre-industrial age [2]. According to prediction, the O3 concentration of the Northern Hemisphere will increased by 40%–70%, and the peak value will frequently exceed 100 ppb in 2100 [3]. Tropospheric O3 has raised global concern due to its detrimental effects on crops, semi-natural vegetation, and forest trees [4]. A realistic prediction of the effects of global change on the terrestrial ecosystems in the future, not only requires to consider altered precipitation, temperature, and carbon dioxide (CO2) concentrations, but also needs to understand the impacts of elevated O3 concentrations [5,6]. O3 is produced in the troposphere by catalytic reactions among nitrogen oxides (NOx = NO + NO2), carbon monoxide (CO), methane (CH4), and non-methane volatile organic compounds (NMVOCs) in the presence of sunlight [7]. Over the past two decades, China has experienced rapid economic growth [8]; however, fast-paced industrialization and urbanization have produced large quantity of O3 precursors emissions, which have led to a significant increase in atmospheric O3 concentrations [9].
It was well documented that elevated O3 induced a range of detrimental impacts on tree species, including visible foliar symptoms, chlorophyll degradation, decreasing stomatal conductance, depressing photosynthesis, accelerating senescence, and diminishing biomass accumulation [5,10]. Although the molecular mechanisms leading to O3 damage have not been fully elucidated, physiological studies suggested that depressing photosynthesis was a key factor causing damage [1,10]. Previous studies also investigated the effects of elevated O3 on carbon (C) and nitrogen (N) allocation in tree species. Many case studies showed that O3 stress decreased carbon allocation to roots with subsequent reductions in root biomass [11]. In contrast, other studies showed that the partitioning of total N were not different between O3 treatments in tree species [12,13]. However, there is little information on the effects of elevated O3 on the C, N, and phosphorous (P) stoichiometry in tree species. The changes in environmental conditions may elicit the variations of stoichiometric ratios in plants [14], and further influence the growth of plants and nutrient cycles within ecosystems [15]. Therefore, a better understanding of the stoichiometric responses to environmental changes is crucial for predicting the future biogeochemical cycles in terrestrial ecosystems [16].
Both of Phoebe bournei (Hemsl.) Yang (P. bournei) and Phoebe zhennan S. Lee et F. N. Wei (P. zhennan) are native tree species in subtropical China. During the past centuries, the natural forest population of P. bournei and P. zhennan decreased sharply due to the overexploitation; thus, the two species were listed as national Class 2 protect plants in China [17,18]. The studies on the response of P. bournei and P. zhennan to O3 stress will contribute to building adaptive strategies of threatened tree species to environmental changes. The objectives of the study reported here are (1) to determine the effects of elevated O3 on the C, N, and P concentrations and stoichiometric ratios in different tissues of P. bournei and P. zhennan, and (2) investigate the response of C, N, and P pools in different tissues of P. bournei and P. zhennan to elevated O3.

2. Materials and Methods

2.1. Site Description

The present study was conducted in the Qianyanzhou experimental station (115°03′29.2″ E, 26°44′29.1″ N) of the Chinese Academy of Sciences, situated on the typical red earth hilly region in Taihe county, Jiangxi province, China. The average elevation is approximately 100 m, and relative altitude difference is 20–50 m. This region belongs to the subtropical monsoon climate with an annual mean temperature of 17.8 °C and annual precipitation of 1471.2 mm. The frost free period is 290 d, and the annual evaporation is 259.9 mm. About 76% of the total area is covered by evergreen vegetation, mainly including Pinus massoniana Lamb., Pinus elliottii Engelm., and Cunninghamia lanceolata (Lamb.) Hook. [19].

2.2. O3 Fumigation Treatment

In April 2014, one-year-old container seedlings of P. bournei and P. zhennan were transplanted to flower pots (20 cm in diameter and 30 cm in height) with red paddy soil under ambient air conditions. This type of soil formed under interchange between drying and wetting rice field conditions, and derived from red soil, which is classified as Ultisols in the Soil Taxonomy System of the USA and Acrisols and Ferralsols in the FAO legend [19,20]. On 5 June 2014, 15 seedlings of similar height and basal diameter were selected for each species and randomly assigned to each of nine open-top chambers (OTCs, octagonal base, 2 m in diameter, and 2.2 m in height.). All OTCs were set in the field in advance. The seedlings were well watered to avoid drought stress during the experiment.
Before the experiment was conducted, we observed the peak O3 concentrations of ambient air to be close to 100 ppb in the field of the study site. The plants at the study site have a high potential of being damaged by elevated O3. O3 fumigation treatments were set to three levels, including ambient air (AA), 100 ppb (Elevated O3 treatments 1, E1–O3), and 150 ppb (Elevated O3 treatments 2, E2–O3), with three replicated OTCs for each treatment. For the two elevated O3 treatments, O3 was generated from pure oxygen by an electric discharge O3 generator (CFG-70, Jinan Sankang Environmental Technology Co., Ltd., Jinan, China) and then mixed with charcoal-filtered ambient air to achieve the target O3 concentration. O3 concentration in OTCs was regulated by mass flowmeters (SY-9312D, Beijing Shengye Technology Development Co, Ltd., Beijing, China) through controlling oxygen volume. The average air velocity in the OTCs corresponded to approximately two complete air changes per minute. The O3 concentrations within the OTCs were monitored by an UV absorption O3 analyzer (Model 49i, Thermo, Waltham, MA, USA). O3 fumigation started on 25 June and lasted until 12 November 2014, with a daily maximum of 8 h (from 9:00 to 17:00), when there was no rain, thunderstorm, fog, or dew. Table 1 shows the 8 h mean O3 concentration and the accumulated exposure over a threshold of 40 ppb O3 (AOT40) based on hourly averages [21].

2.3. Measurements

Plants were harvested after O3 fumigation experiment. In each OTC, five plants were randomly collected, and then the foliage, stem and roots were separately sampled. Samples of different seedling tissues of the two species were oven dried at 70 °C to constant weight for dry biomass determination. Oven dried samples of different tissues were ground by a laboratory grinder and passed through a fine screen (0.15 mm) for C, N and P concentrations analyses. Total C concentration was determined by the potassium dichromate oxidation method in the laboratory [22]. Total N concentration was determined by automatic azotometer (UK152 Distillation & Titration Unit, Velp Co., Milano, Italy). Total P concentration was determined by inductively coupled plasma-atomic emission spectrometry (IRIS Intrepid II XSP, Thermo, Waltham, MA, USA). The C, N and P stocks of different tissues were calculated by multiplying the tissue biomass and the corresponding C, N and P concentrations, respectively.

2.4. Statistical Analysis

Statistical analysis was performed using the SPSS software package (ver. 17.0; SPSS, Chicago, IL, USA). Data were first checked for normality using the Shapiro-Wilk test, and for homogeneity of variance using Levene’s test. As the data met these analysis of variance (ANOVA) assumptions, the difference among the means of different treatments and variation of different seedling tissues within the same treatment for each species were respectively examined via one-way ANOVA and least significant difference (LSD) post-hoc test. A significance level of 0.05 was the basis of statistical decision. Based on the sum of squares (SS) of three-way ANOVA with species (S), tissues (T), and O3 fumigation treatments (O) as factors, variance partitioning was used to indicate their contribution to the variance in the C, N, and P concentrations and stoichiometric ratios [23]. The total SS of the ANOVA was decomposed as: SStotal = SSS + SST + SSO + SSS × T + SSS × O + SST × O + SSS × T × O + SSerror. The variance contribution of each factor was expressed as percentage of total SS.

3. Results

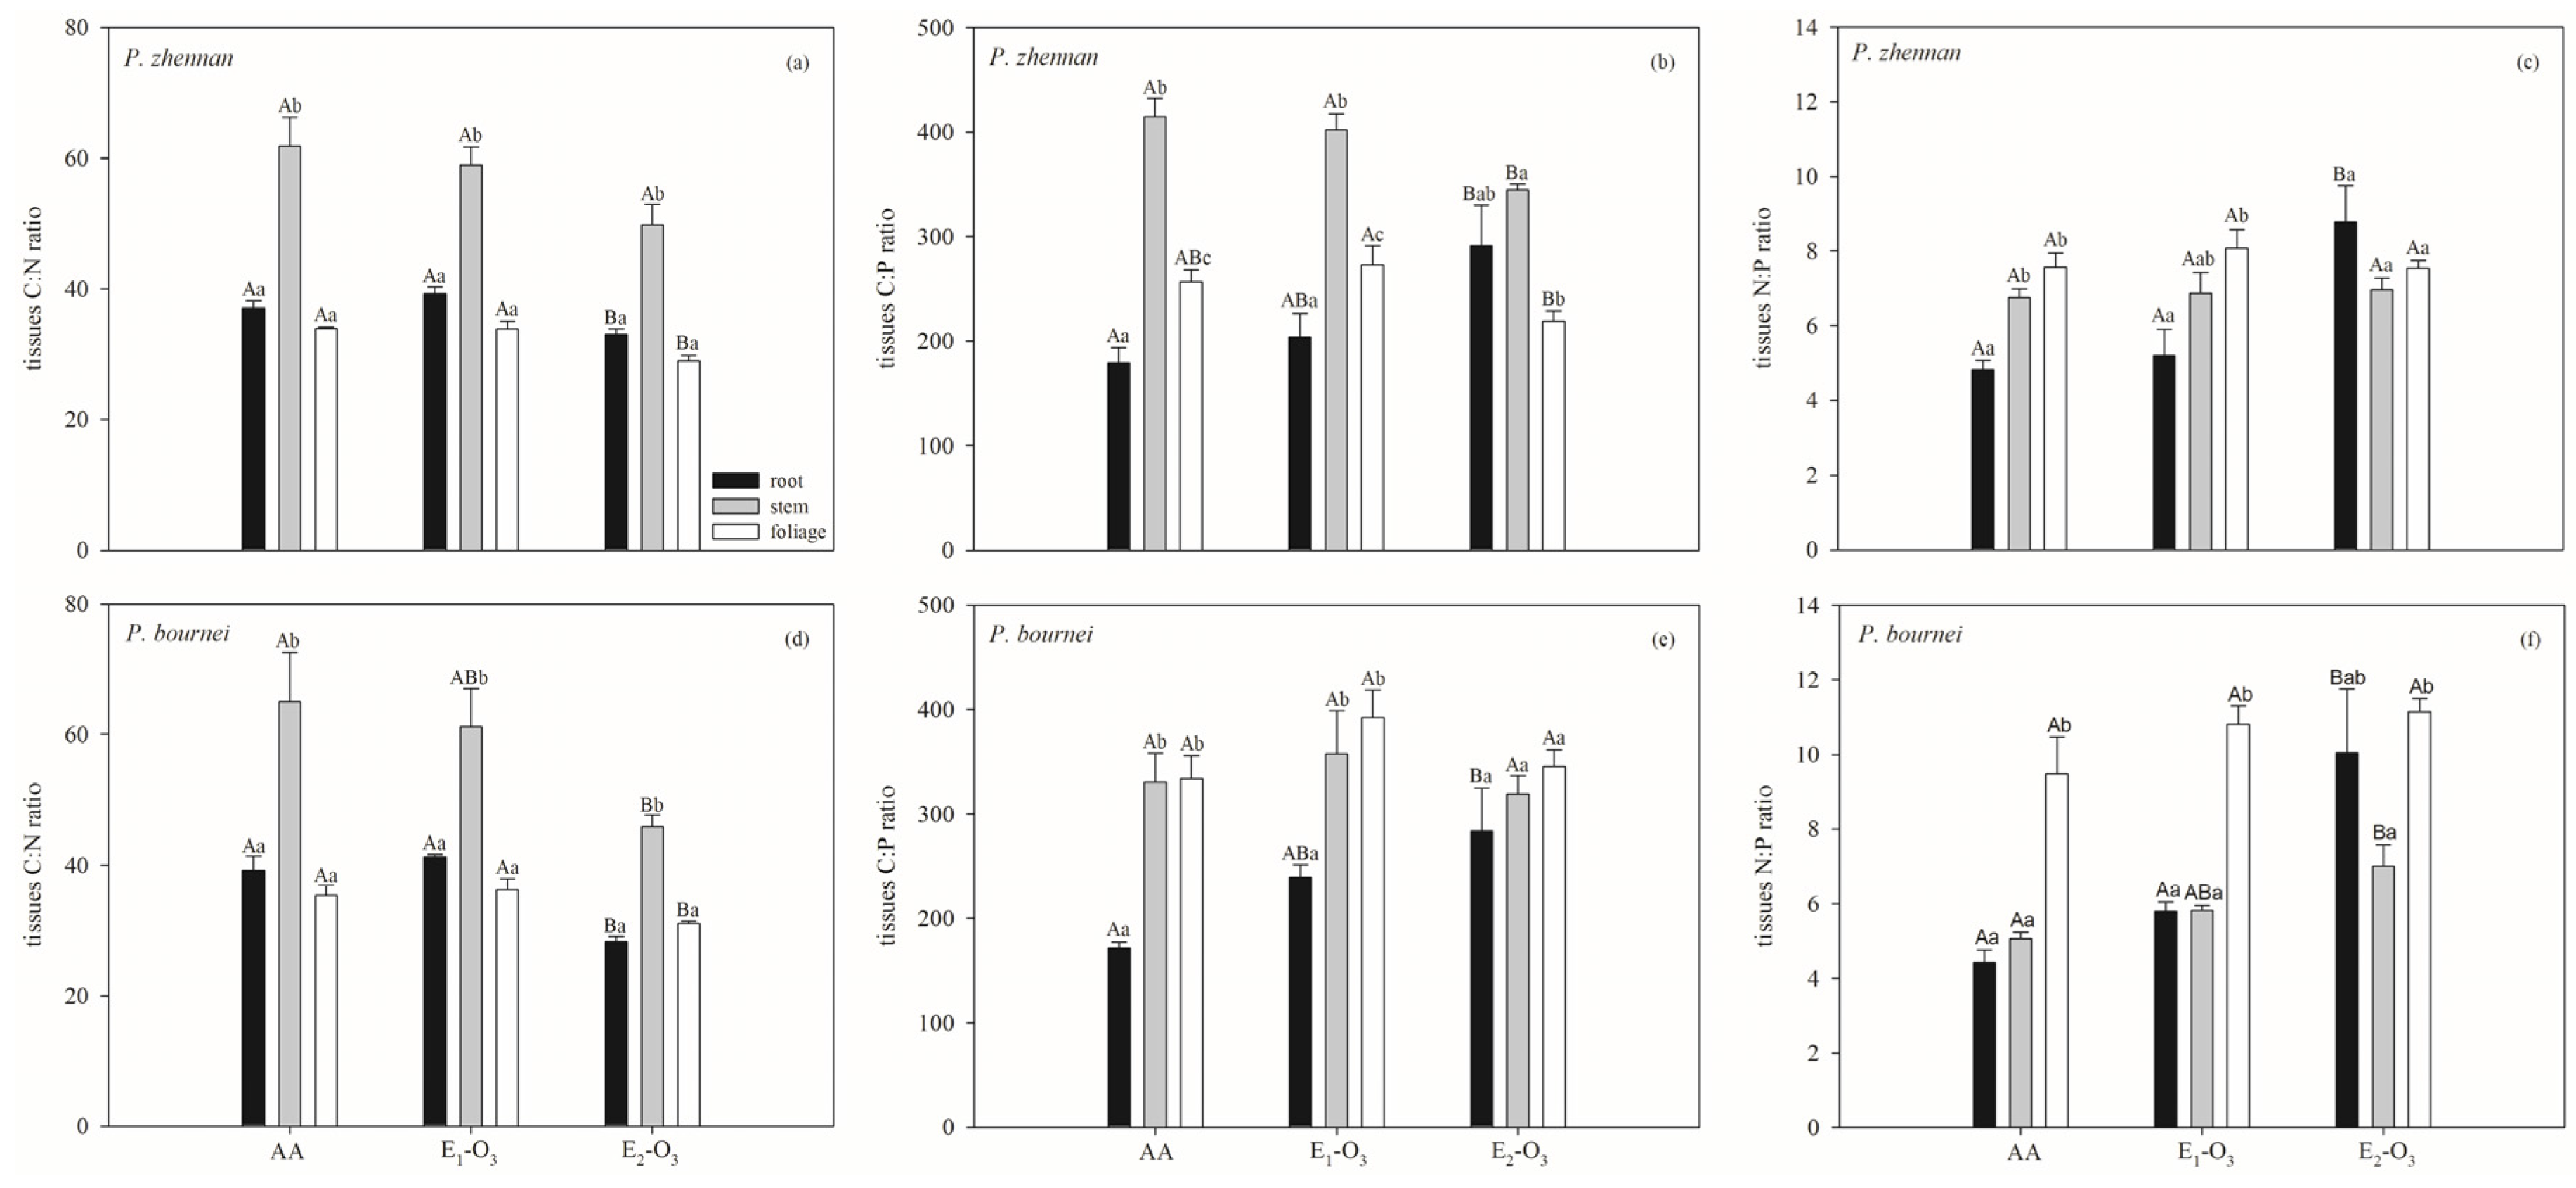
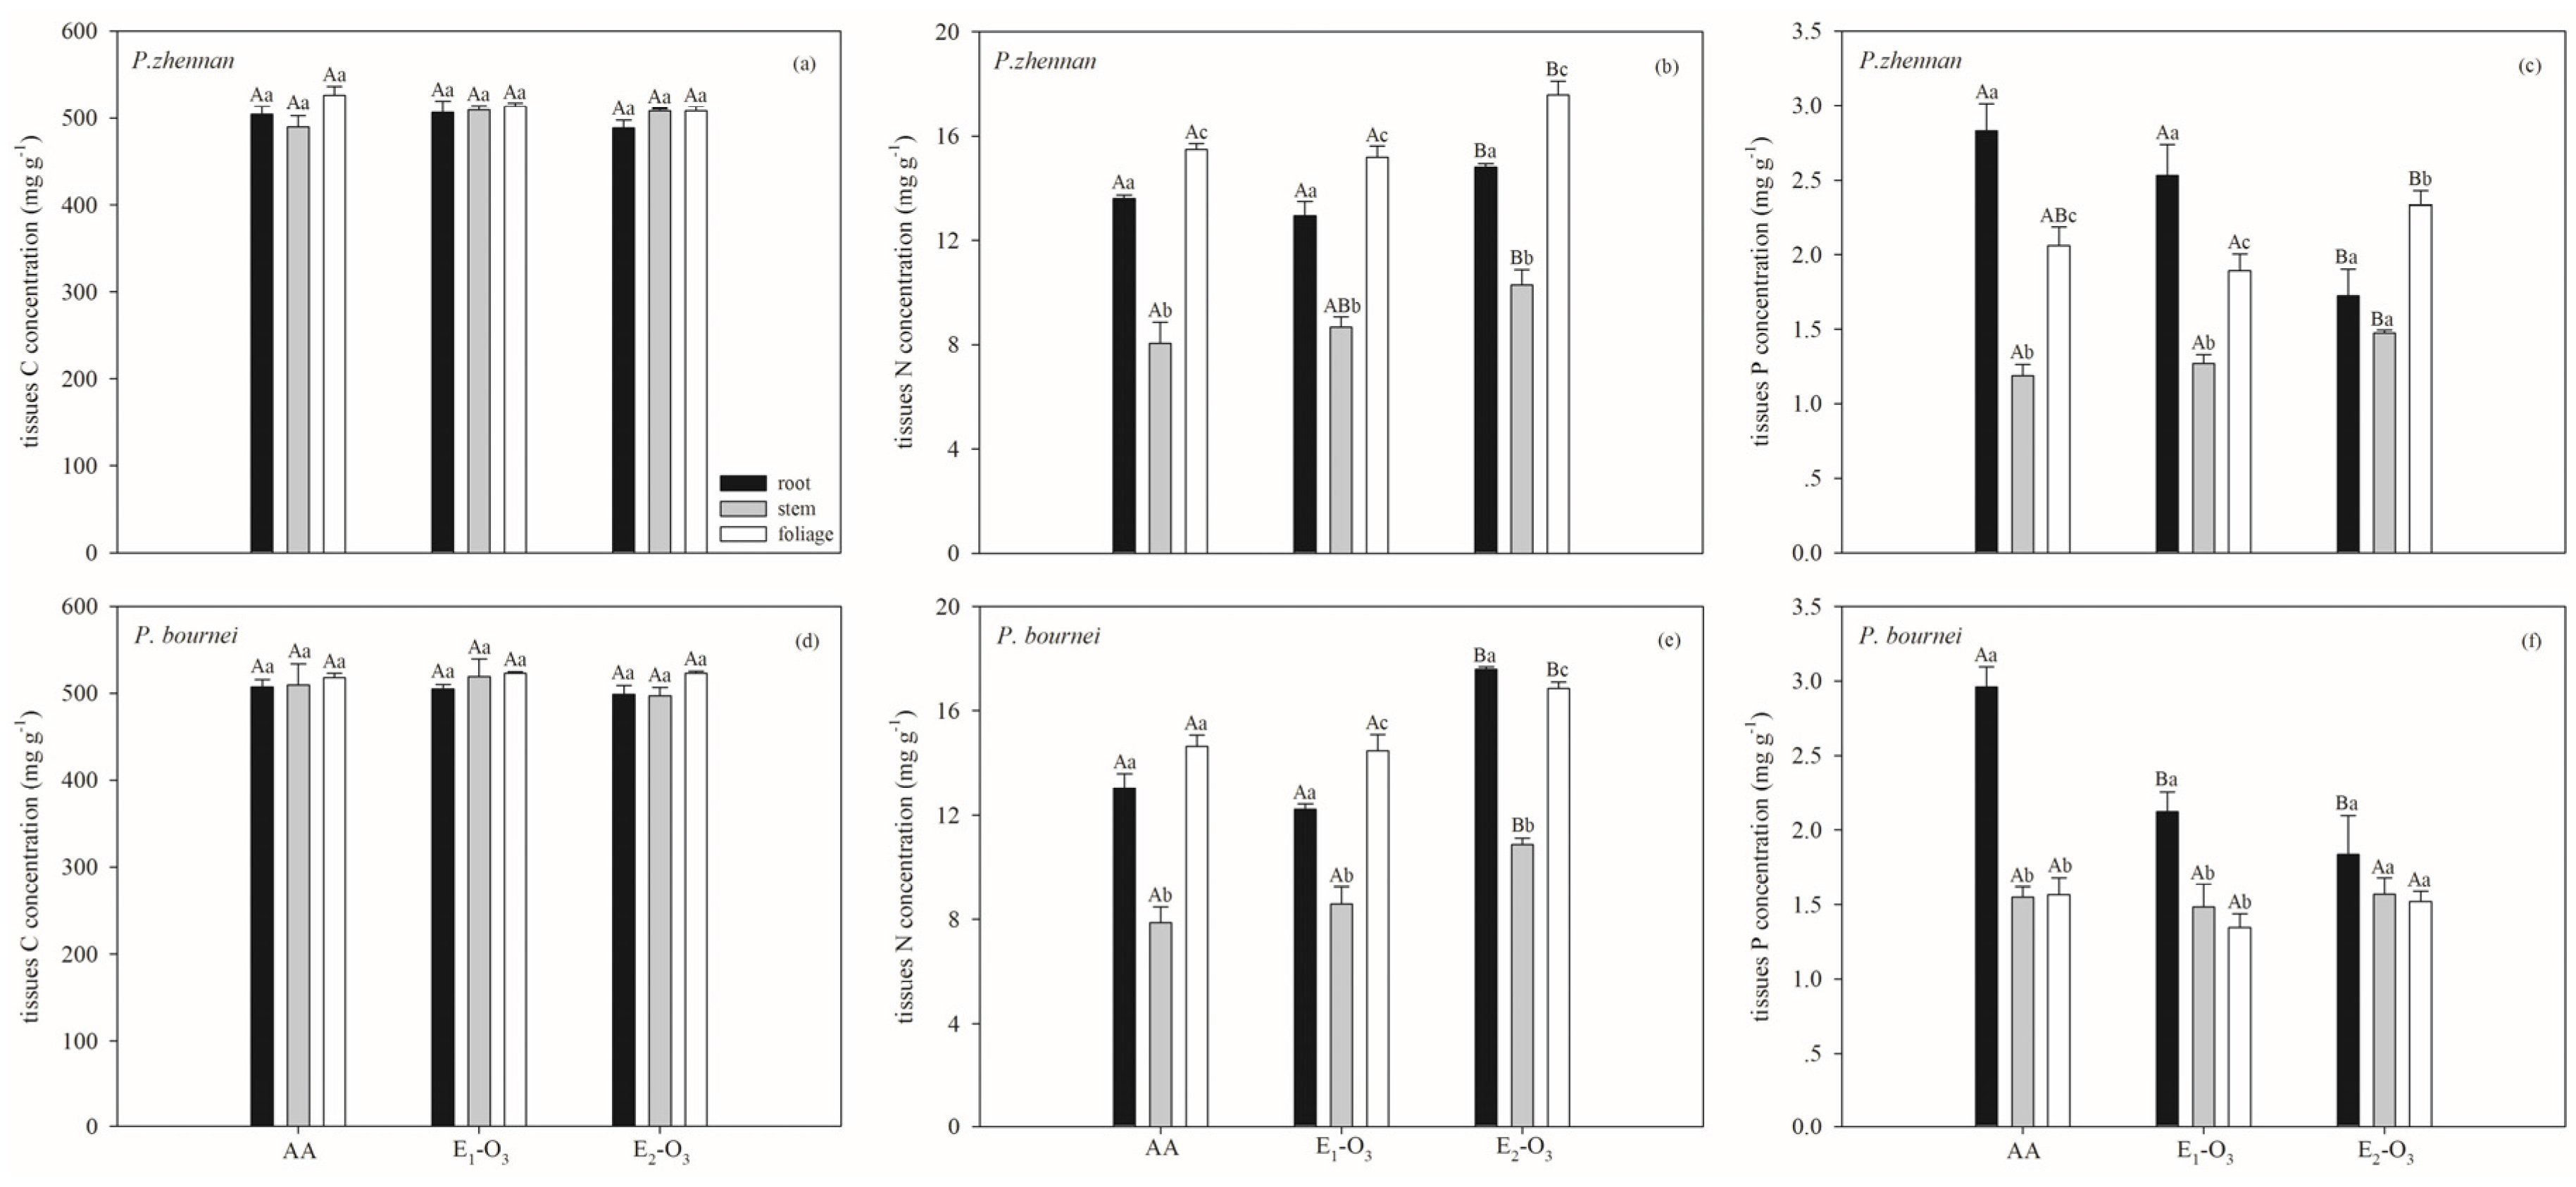
3.1. Effects of Elevated O3 on C, N, and P Concentrations and Stoichiometric Ratios

The C concentration of individual tissues in two tree species varied from 468.22 mg·g‒1 to 558.98 mg·g‒1, and did not differ significantly among the three O3 fumigation treatments (Figure 1a,d). The C concentrations in foliage were slightly higher than those in stems and roots in two tree species in all three O3 fumigation treatments; however, the differences were not significant (Figure 1a,d). The N concentration of individual tissues in two tree species under E2–O3 was much higher than that under the other two treatments (Figure 1b,e). The N concentrations of different tissues in two tree species were ranked by foliage > stem > root except for P. bournei under E2–O3 treatment (Figure 1b,e). With elevated O3, the P concentration of the root in both two tree species decreased (Figure 1c,f). In contrast, the P concentration of the stem in P. zhennan increased with elevated O3, and the P concentration of other tissues in two tree species did not exhibit an obvious changing trend. The P concentrations of root in two tree species were much higher than other tissues except for P. zhennan under E2–O3 treatment (Figure 1c,f).
The C:N and C:P ratios across tissues in two tree species ranged from 27.16 and 153.47 to 73.95 and 445.07, respectively (Figure 2a,b,d,e). Elevated O3 significantly increased the N:P ratios in root of P. zhennan, root, and stem of P. bournei from 4.84, 4.56, and 5.07 to 8.79, 8.21, and 7.00, respectively (Figure 2c,f). The N:P ratio in other tissues of the two tree species was relatively stable (Figure 2c,f).
O3 fumigation treatments significantly affected N concentration, P concentration, C:N ratio and N:P ratio. Species only significantly affected P concentration and N:P ratio (Table 2). Tissues and O3 fumigation treatments together explained more than 50% the total variance in N concentration, P concentration, C:N ratio and N:P ratio, and more than 85% in the N concentration and C:N ratio (Table 2). For P. zhennan, there were significantly positive relationships between the foliage biomass and C:N ratio and between the stem biomass and C:P ratio (p < 0.05) (Table 3). The root biomass of P. bournei showed significantly negative correlations with C:P and N:P ratios (p < 0.05) (Table 3). However, the root biomass of P. zhennan, the foliage and stem biomass of P. bournei, and the total biomass of P. zhennan and P. bournei did not exhibit significant correlations with any one of stoichiometric ratios (Table 3).

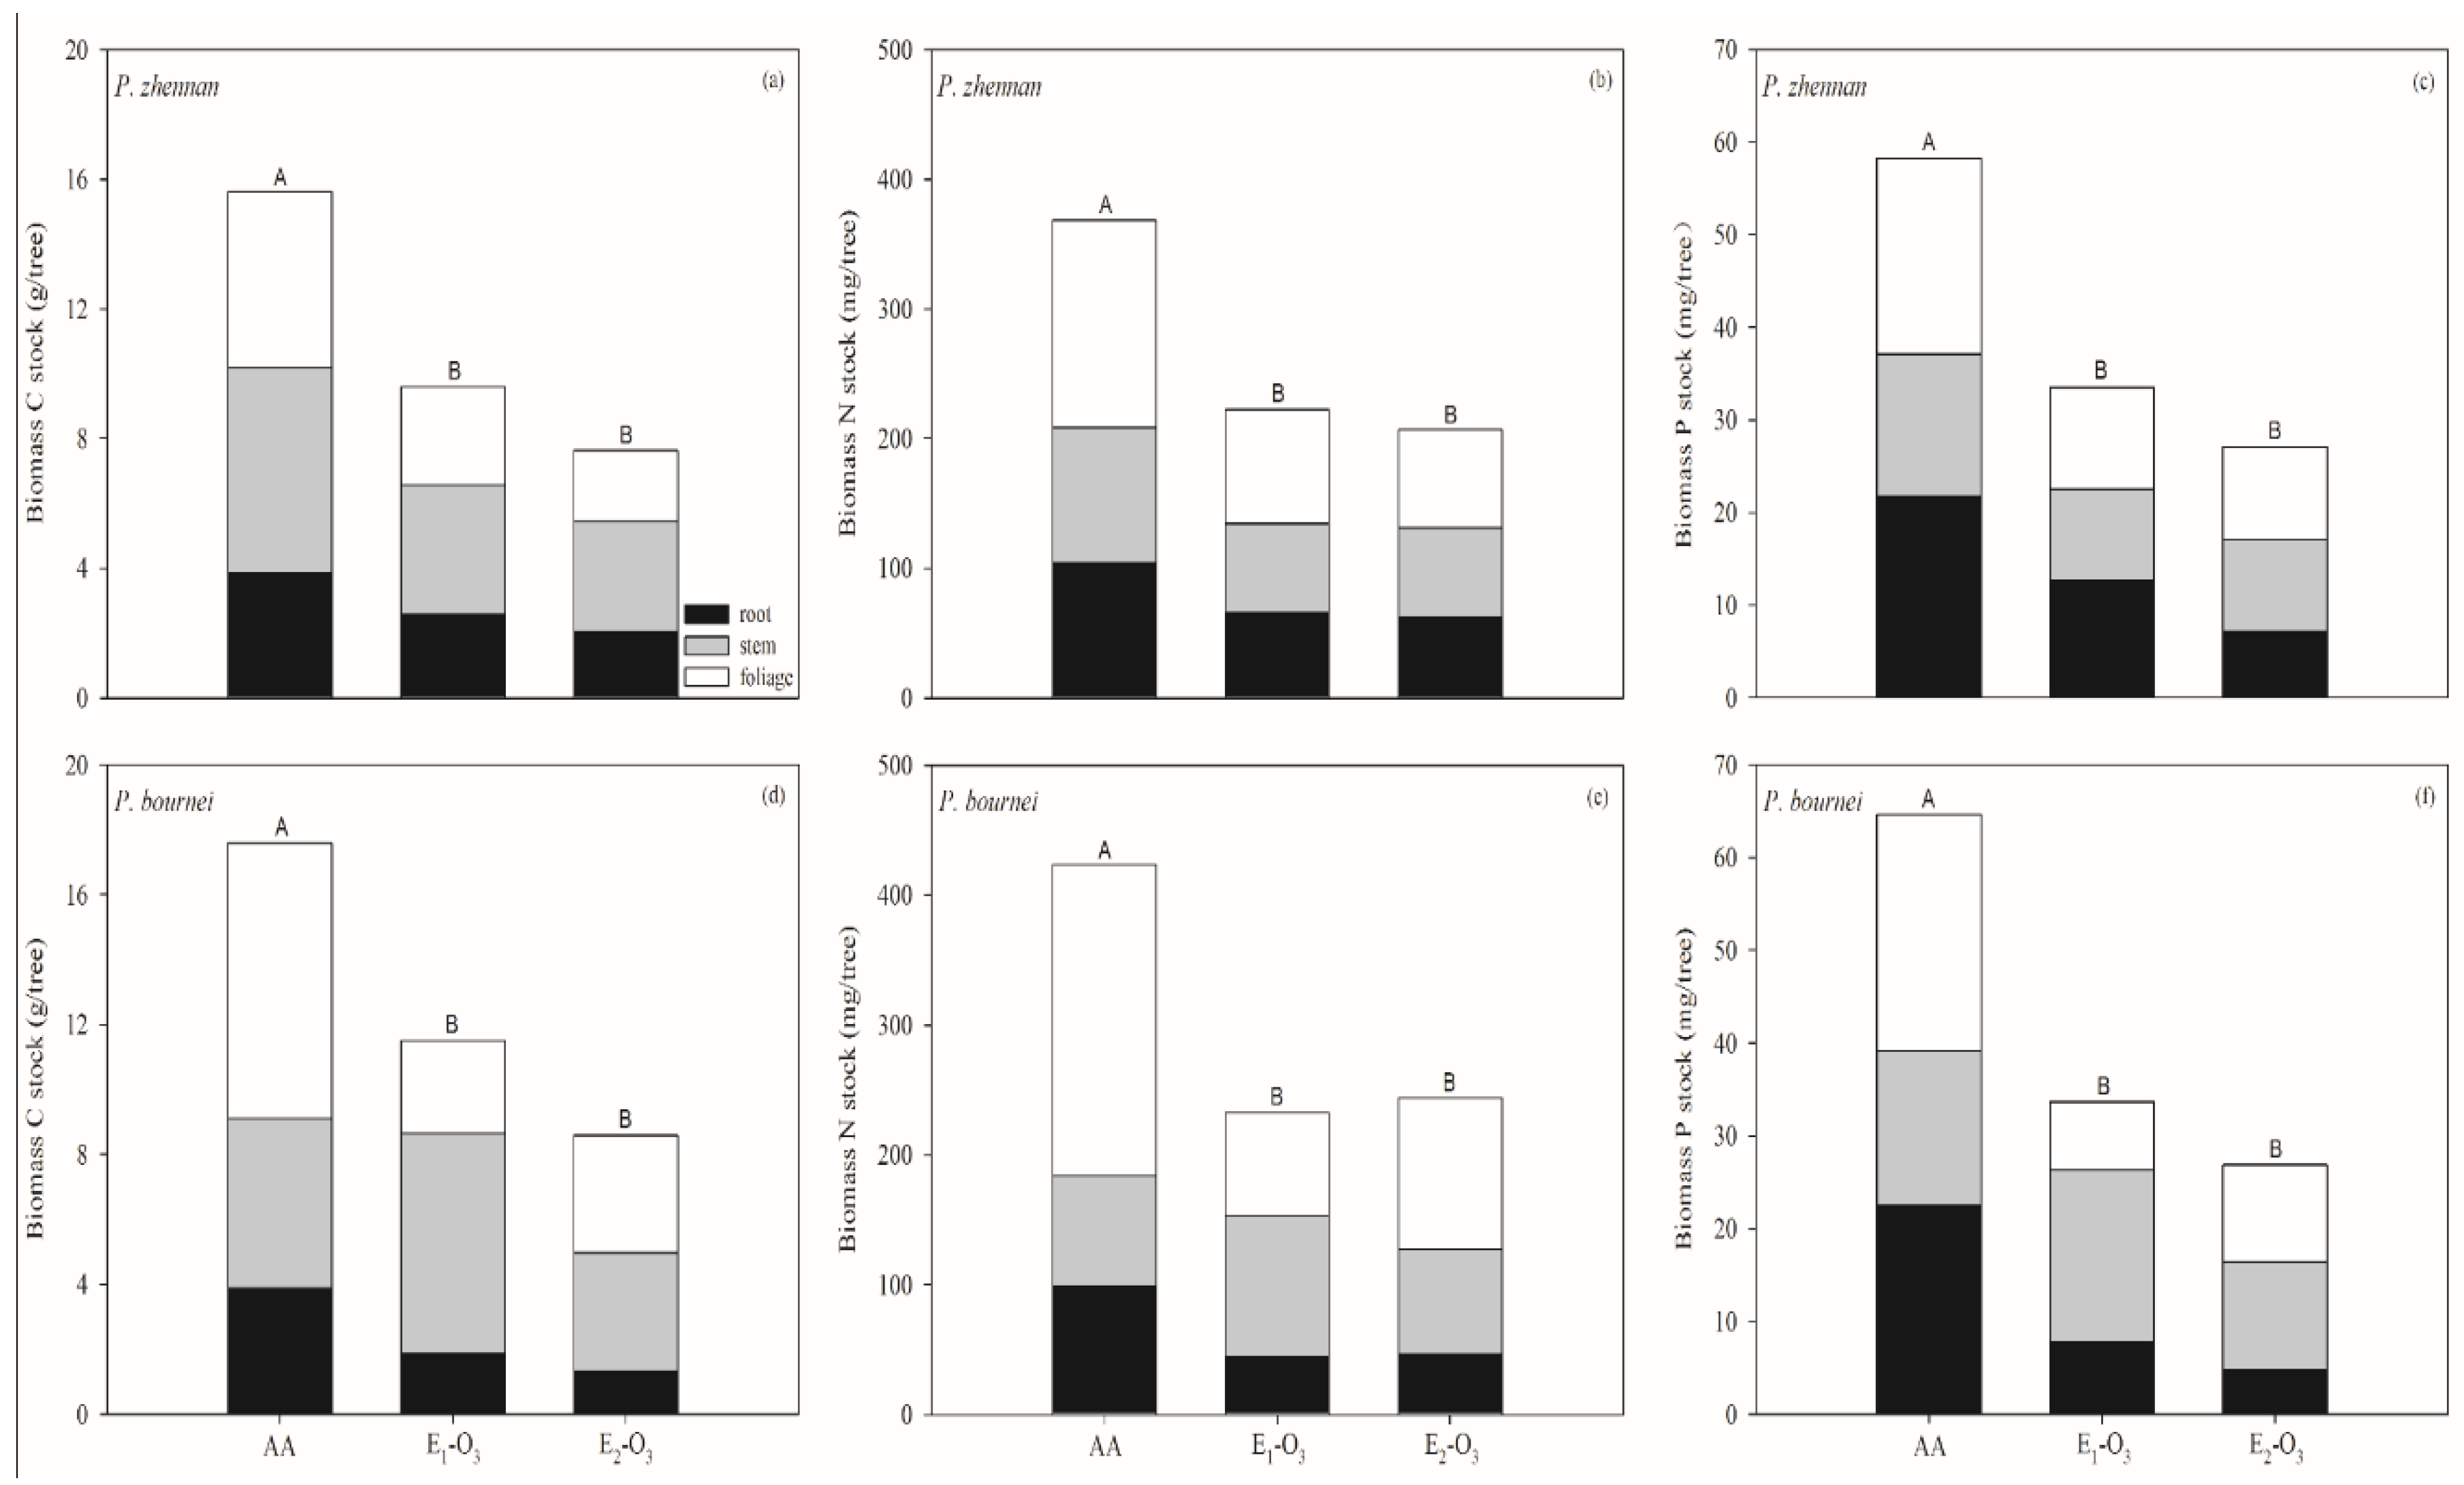
3.2. Response of C, N, and P Pools to Elevated O3

The biomass C, N, and P stocks of individual P. zhennan tissues continuously decreased with elevated O3 except for the stem N (Figure 3a–c). The average total biomass C, N, and P stocks of P. zhennan decreased from 15.61 g·tree−1, 368.21 mg·tree−1, and 58.27 mg·tree−1 in AA treatment to 7.64 g·tree−1, 206.64 mg·tree−1, and 27.11 mg·tree−1 in E2–O3 treatment, respectively (Figure 3a–c). As for P. bournei, the C and P stocks in total and root biomass decreased with elevated O3; for other tissues, C, N, and P stock did not show an obvious tendency (Figure 3d–f). The contribution of foliage C to total C of P. zhennan decreased from 34.78% in AA treatment to 28.66% in E2–O3 treatment, while the contribution of stem C increased from 40.49% to 44.54% (Figure 3a). With elevated O3, the contribution of root C of P. zhennan firstly increased from 24.73% to 26.82%, and then remained relatively stable (Figure 3a). The contribution of root and stem N to total N of P. zhennan continuously increased with elevated O3, while the contribution of foliage N decreased from 43.37% to 36.60% (Figure 3b). The contribution of stem P to total P of P. zhennan increased from 26.31% to 36.45% with elevated O3; however, the contribution of root and foliage P did not show a stable variation tendency (Figure 3c). As for P. bournei, the contributions of root C, N, and P respectively decreased from 22.07%, 23.28%, and 34.90% to 15.31%, 19.05%, and 17.92% with elevated O3 (Figure 3d–f). The contributions of C, N, and P of stem firstly increased and then decreased, whereas the contribution of C, N, and P of foliage showed inverse variation with elevated O3 (Figure 3d–f).

4. Discussion

Many studies have reported that the plant N and P concentrations are affected by many factors, such as soil fertility, temperature, precipitation, developmental stage, and herbivores [24,25]. In the present study, we found that elevated O3 altered the N and P concentrations for P. zhennan and P. bournei but did not exert significant impact on C concentration. The N concentration of different tissues in P. zhennan and P. bournei increased with elevated O3, which was similar to the results reported for Fagus crenata Blume [26] and Pinus ponderosa Laws [27]. This may be because the reallocation N from premature abscised leaves to the tree living tissue under O3 stress. Increasing N concentration may be an adaptive strategy for these plants and can enhance the defense capability against O3 stress. High N concentrations may mitigate the damage caused by O3 stress for P. bournei and P. zhennan seedlings. However, there is some controversy regarding species-specific response to elevated O3 [28]. The present study found that the N and P concentrations of root and foliage were higher than those in stem in all three O3 treatments for P. zhennan. In contrast, the P concentration of foliage was similar to that of stem for P. bournei, indicating that there are also differences in the response to elevated O3 for these two species, though they belong to the same plant genus. A previous study suggested species-specific response to the O3 stress was caused by differences in genotype [29]. Hence, the future composition and productivity of forests community may be changed by O3 stress. With elevated O3, the P concentration of root in P. zhennan and P. bournei decreased, whereas that of stem and foliage increased or remain stable. This result indicates that the root may perform a buffering function for P during the seedling growth stage of these two tree species under environmental stress.
N:P ratios of individual tissues in all three O3 fumigation treatments for P. zhennan and P. bournei were lower than the critical value (<14), indicating that N was a limitation factor for seedling growth in the present study [30]. The growth rate hypothesis (GRH) argues that low biomass C:P and N:P ratio are associated with fast growth rate, since fast-growing organisms need relatively more P-rich RNA to support rapid rates of protein synthesis [31,32]. This hypothesis was widely verified in the studies on zooplankton, arthropods, and bacteria; however, the research conclusions on the terrestrial plants are not consistent [33]. Previous studies have suggested the GRH may not hold for plants when P is not limiting [34]. The present study found that only the root biomass accumulation of P. bournei had a significantly negative relationship with C:P and N:P ratios under O3 stress. P levels offer a crude gauge of the “machinery” driving plant growth [35]. Decreasing root C:P and N:P ratios may inhibit nutrient and water uptake, and accelerate plant senescence. In the present study, the changing tendencies of C:N and C:P ratios with elevated O3 (Figure 2a,b,d,e) were both opposite to that of the N and P concentrations in two tree species (Figure 1b,c,e,f). We observed that elevated O3 decreased the C:N ratio of individual tissues in P. zhennan and P. bournei. Due to the strong negative correlation between the C:N ratio in litter and the rate of litter mass loss [36], tropospheric O3 enhancement may increase the litter decomposition rate and accelerate the nutrient cycle in terrestrial ecosystem.
In the present study, the biomass C, N, and P stocks of P. zhennan and P. bournei sharply decreased under the E1–O3 treatments compared to those under the AA treatment. In contrast, there was no significant difference between the two elevated O3 treatments. This result indicates that about 50 ppm·h (AOT40) sharply reduced the C, N, and P stocks for P. zhennan and P. bournei. In the similar regions, a previous study found that visible injury of two deciduous tree species (Liriodendron chinense (Hemsl.) Sarg. and Liquidambar formosana Hance) was first observed at AOT40 of about 10 ppm·h [10], which was higher than the critical level (5 ppm·h) for European forests [37]. Therefore, the broadleaf tree species may be less sensitive to the O3 in subtropical China compared to the European forests. Most previous studies found that seedlings were more sensitive to the O3 stress than adult trees; however, adult trees would present a similar symptom under the chronically elevated O3 level [38]. Fowler et al. [39] predicted that half of the world’s forests will be at risk of O3 damage and reduced productivity by 2100. As for P. bournei, elevated O3 continuously decreased the C, N, and P allocation to root, which is similar to the results of previous studies [11]. In contrast, the C and N contributions of P. zhennan roots slightly increased under O3 stress. These results indicate that the variations of element allocation may also be species-specific with elevated O3. Increasing the aboveground proportion of nutrients may be conducive to enhancing antioxidant level for plants under O3 stress. During the experiment, both of the total biomass C of P. zhennan and P. bournei decreased by more than 50% with elevated O3, which were much more than the average value of 7.7% for Chinese forests [40], indicating that tropospheric high O3 concentration may significantly reduce the seedling tree growth and drastically decrease forest C sequestration in subtropical regions. The total biomass N of both P. zhennan and P. bournei reduced to a lesser extent, because elevated O3 increased the N concentration of individual tissues for the two tree species. In the context of climate change, elevated CO2 could increase the forest biomass accumulation and net CO2 assimilation [41]; however, tropospheric O3 enhancement may offset these positive effects because atmospheric CO2 and O3 concentrations increase concomitantly [42].

5. Conclusions

It is suggested that elevated O3 is an important influencing factor on plant stoichiometry in subtropical regions. In the future, chronically elevated O3 concentration may profoundly impact the nutrient cycle of terrestrial ecosystems in some particular regions. The present study found that high O3 concentration significantly increased the N concentration in different tissues for P. zhennan and P. bournei. In contrast, high O3 concentration had no significant effects on the C concentration in different tissues and thus significantly decreased C:N ratio in different tissues for the two species. The response of P concentration, C:P, and N:P ratio to elevated O3 was species-specific. For both P. bournei and P. zhennan, the relationship between the total biomass accumulation and stoichiometric ratio did not accord with the GRH under O3 stress. Elevated O3 significantly decreased the C, N, and P stocks. The variations of C, N, and P allocation in P. zhennan and P. bournei with elevated O3 were not consistent. The information provided by the present study will improve our understanding of the effects of elevated O3 on plants and can be used for seedling tree protection practice. Due to the limitation in the experiment period and tree growth stage, the stoichiometric response of these two species to elevated O3 remains to be further verified with an extended experiment or on adult trees.

Acknowledgment

This work was supported by the National Public Benefit Special Fund of China for Forestry Research (No. 201304313).

Author Contributions

He Shang, Zhan Chen and Jixin Cao conceived and designed the experiments; He Shang, Zhan Chen, Jixin Cao and Hao Yu performed the experiments; Jixin Cao and Yun Tian analyzed data; Jixin Cao and Yun Tian contributed reagents/materials/analysis tools; Jixin Cao wrote the manuscript.

Conflicts of Interest

The authors declare no conflict of interest.

References

  1. Feng, Z.; Pang, J.; Kobayashi, K.; Zhu, J.; Ort, D.R. Differential responses in two varieties of winter wheat to elevated ozone concentration under fully open-air field conditions. Glob. Chang. Biol. 2011, 17, 580–591. [Google Scholar] [CrossRef]
  2. Vingarzan, R. A review of surface ozone background levels and trends. Atmos. Environ. 2004, 38, 3431–3442. [Google Scholar] [CrossRef]
  3. Zhang, W. Effects of Elevated O3 Level on the Native Tree Species in Subtropical China. Ph.D. Thesis, Research center for eco-environmental sciences, Chinese Academy of Sciences, Beijing, China, 2011. [Google Scholar]
  4. Zhang, W.; Feng, Z.; Wang, X.; Niu, J. Elevated ozone negatively affects photosynthesis of current-year leaves but not previous-year leaves in evergreen Cyclobalanopsis glauca seedlings. Environ. Pollut. 2014, 184, 676–681. [Google Scholar] [CrossRef] [PubMed]
  5. Wittig, V.E.; Ainsworth, E.A.; Long, S.P. To what extent do current and projected increases in surface ozone affect photosynthesis and stomatal conductance of trees? A meta-analytic review of the last 3 decades of experiments. Plant Cell Environ. 2007, 30, 1150–1162. [Google Scholar] [CrossRef] [PubMed]
  6. Pérez-Soba, M.; Dueck, T.A.; Puppi, G.; Kuiper, P.J. Interactions of elevated CO2, NH3 and O3 on mycorrhizal infection, gas exchange and N metabolism in saplings of Scots pine. Plant Soil. 1995, 176, 107–116. [Google Scholar] [CrossRef]
  7. Avnery, S.; Mauzerall, D.L.; Liu, J.; Horowitz, L.W. Global crop yield reductions due to surface ozone exposure: 2. Year 2030 potential crop production losses and economic damage under two scenarios of O3 pollution. Atmos. Environ. 2011, 45, 2297–2309. [Google Scholar] [CrossRef]
  8. Wang, Z.; Li, Y.; Chen, T.; Zhang, D.; Sun, F.; Wei, Q.; Dong, X.; Sun, R.; Huan, N.; Pan, L. Ground-level ozone in urban Beijing over a 1-year period: Temporal variations and relationship to atmospheric oxidation. Atmos. Res. 2015, 164, 110–117. [Google Scholar] [CrossRef]
  9. Li, J.; Lu, K.; Lv, W.; Li, J.; Zhong, L.; Ou, Y.; Chen, D.; Huang, X.; Zhang, Y. Fast increasing of surface ozone concentrations in Pearl River Delta characterized by a regional air quality monitoring network during 2006–2011. J. Environ. Sci. 2014, 26, 23–36. [Google Scholar] [CrossRef]
  10. Zhang, W.; Feng, Z.; Wang, X.; Niu, J. Responses of native broadleaved woody species to elevated ozone in subtropical China. Environ. Pollut. 2012, 163, 149–157. [Google Scholar] [CrossRef] [PubMed]
  11. Andersen, C.P. Source-sink balance and carbon allocation below ground in plants exposed to ozone. New Phytol. 2003, 157, 213–228. [Google Scholar] [CrossRef]
  12. Wright, L.M.; Lockaby, B.G.; Meldahl, R.; Thornton, F.; Chappelka, A.H. The influence of acid precipitation and ozone on nitrogen nutrition of young loblolly pine. Water Air Soil Pollut. 1990, 54, 135–142. [Google Scholar] [CrossRef]
  13. Weigt, R.B.; Häberle, K.H.; Rötzer, T.; Matyssek, R. Whole-tree seasonal nitrogen uptake and partitioning in adult Fagus sylvatica L. and Picea abies L. [Karst.] trees exposed to elevated ground-level ozone. Environ. Pollut. 2015, 196, 511–517. [Google Scholar] [CrossRef] [PubMed]
  14. Sardans, J.; Rivas-Ubach, A.; Peñuelas, J. The C:N:P stoichiometry of organisms and ecosystems in a changing world: A review and perspectives. Perspect. Plant Ecol. 2012, 14, 33–47. [Google Scholar] [CrossRef]
  15. González, A.L.; Fariña, J.M.; Pinto, R.; Pérez, C.; Weathers, K.C.; Armesto, J.J.; Marquet, P.A. Bromeliad growth and stoichiometry: Responses to atmospheric nutrient supply in fog-dependent ecosystems of the hyper-arid Atacama Desert, Chile. Oecologia 2011, 167, 835–845. [Google Scholar] [CrossRef] [PubMed]
  16. Yang, Y.; Luo, Y.; Lu, M.; Schädel, C.; Han, W. Terrestrial C: N stoichiometry in response to elevated CO2 and N addition: A synthesis of two meta-analyses. Plant Soil 2011, 343, 393–400. [Google Scholar] [CrossRef]
  17. Wang, Z.; Zhu, J.; Wang, J.M.; Wang, Y.; Lu, Y.X.; Zheng, Q.R. The response of photosynthetic characters and biomass allocation of P. bournei young trees to different light regimes. Acta Ecol. Sin. 2012, 32, 3841–3848. (In Chinese) [Google Scholar] [CrossRef]
  18. He, W.; Hu, T.; Wang, R.; Zhong, Y.; Zhou, X.; Jing, L. Effects of fertilization on photosynthetic physiology and growth characteristics of Phoebe zhannan seedlings. Acta Bot. Boreal.–Occident. Sin. 2014, 34, 1187–1197. (In Chinese) [Google Scholar]
  19. Dong, W.; Zhang, X.; Wang, H.; Dai, X.; Sun, X.; Qiu, W.; Yang, F. Effect of different fertilizer application on the soil fertility of paddy soils in red soil region of southern China. PLoS ONE 2012, 7, e44504. [Google Scholar] [CrossRef] [PubMed]
  20. Tsao, S. The peculiarity of soil formation of the paddy soils derived from red earth in Kiangsi, China. Acta Pedol. Sin. 1964, 12, 155–163. (In Chinese) [Google Scholar]
  21. De Leeuw, F.A.A.M.; van Zantvoort, E.D.G. Mapping of exceedances of ozone critical levels for crops and forest trees in the Netherlands: Preliminary results. Environ. Pollut. 1997, 96, 89–98. [Google Scholar] [CrossRef]
  22. Liu, G.S. Soil Physical and Chemical Analysis and Description of Soil Profiles, 1st ed.; Standards Press of China: Beijing, China, 1996; pp. 166–167. (In Chinese) [Google Scholar]
  23. Güsewell, S.; Koerselman, W. Variation in nitrogen and phosphorus concentrations of wetland plants. Perspect. Plant Ecol. 2002, 5, 37–61. [Google Scholar] [CrossRef]
  24. Sardans, J.; Rivas-Ubach, A.; Peñuelas, J. Factors affecting nutrient concentration and stoichiometry of forest trees in Catalonia (NE Spain). For. Ecol. Manag. 2011, 262, 2024–2034. [Google Scholar] [CrossRef]
  25. Li, W.; Cao, T.; Ni, L.; Zhang, X.; Zhu, G.; Xie, P. Effects of water depth on carbon, nitrogen and phosphorus stoichiometry of five submersed macrophytes in an in situ experiment. Ecol. Eng. 2013, 61, 358–365. [Google Scholar] [CrossRef]
  26. Yamaguchi, M.; Watanabe, M.; Iwasaki, M.; Tabe, C.; Matsumura, H.; Kohno, Y.; Izuta, T. Growth and photosynthetic responses of Fagus crenata seedlings to O3 under different nitrogen loads. Trees 2007, 21, 707–718. [Google Scholar] [CrossRef]
  27. Beyers, J.L.; Riechers, G.H.; Temple, P.J. Effects of long-term ozone exposure and drought on the photosynthetic capacity of ponderosa pine (Pinus ponderosa Laws.). New Phytol. 1992, 122, 81–90. [Google Scholar] [CrossRef]
  28. Niu, J. Effects of Elevated Ozone and Nitrogen Deposition on the Growth and Physiology of Cinnamomum Camphora Seedlings. Ph.D. Thesis, Research center for eco-environmental sciences, Chinese Academy of Sciences, Beijing, China, 2012. [Google Scholar]
  29. Zak, D.R.; Holmes, W.E.; Pregitzer, K.S.; King, J.S.; Ellsworth, D.S.; Kubiske, M.E. Belowground competition and the response of developing forest communities to atmospheric CO2 and O3. Glob. Chang. Biol. 2007, 13, 2230–2238. [Google Scholar] [CrossRef]
  30. Koerselman, W.; Meuleman, A.F.M. The vegetation N:P ratio: A new tool to detect the nature of nutrient limitation. J. Appl. Ecol. 1996, 33, 1441–1450. [Google Scholar] [CrossRef]
  31. Elser, J.J.; Sterner, R.W.; Gorokhova, E.; Fagan, W.F.; Markow, T.A.; Cotner, J.B.; Harrison, J.F.; Hobbie, S.E.; Odell, G.M.; Weider, L.J. Biological stoichiometry from genes to ecosystems. Ecol. Lett. 2000, 3, 540–550. [Google Scholar] [CrossRef]
  32. Matzek, V.; Vitousek, P.M. N:P stoichiometry and protein:RNA ratios in vascular plants: An evaluation of the growth-rate hypothesis. Ecol. Lett. 2009, 12, 765–771. [Google Scholar] [CrossRef] [PubMed]
  33. Yan, Z.B.; Kim, N.Y.; Han, T.S.; Fang, J.Y.; Han, W.X. Effects of nitrogen and phosphorus fertilization on leaf carbon, nitrogen and phosphorus stoichiometry of Arabidopsis thaliana. Chin. J. Plant Ecol. 2013, 37, 551–557. (In Chinese) [Google Scholar] [CrossRef]
  34. Elser, J.J.; Fagan, W.F.; Kerkhoff, A.J.; Swenson, N.G.; Enquist, B.J. Biological stoichiometry of plant production: Metabolism, scaling and ecological response to global change. New Phytol. 2010, 186, 593–608. [Google Scholar] [CrossRef] [PubMed]
  35. Niklas, K.J.; Cobb, E.D. N, P, and C stoichiometry of Eranthis hyemalis (Ranunculaceae) and the allometry of plant growth. Am. J. Bot. 2005, 92, 1256–1263. [Google Scholar] [CrossRef] [PubMed]
  36. Ågren, G.I.; Hyvönen, R.; Berglund, S.L.; Hobbie, S.E. Estimating the critical N:C from litter decomposition data and its relation to soil organic matter stoichiometry. Soil Biol. Biochem. 2013, 67, 312–318. [Google Scholar] [CrossRef]
  37. Paoletti, E. Impact of ozone on Mediterranean forests: A review. Environ. Pollut. 2006, 144, 463–474. [Google Scholar] [CrossRef] [PubMed]
  38. Nunn, A.J.; Kozovits, A.R.; Reiter, I.M.; Heerdt, C.; Leuchner, M.; Lütz, C.; Liu, X.; Löw, M.; Winkler, J.B.; Grams, T.E.E.; et al. Comparison of ozone uptake and sensitivity between a phytotron study with young beech and a field experiment with adult beech (Fagus sylvatica). Environ. Pollut. 2005, 137, 494–506. [Google Scholar] [CrossRef] [PubMed]
  39. Fowler, D.; Cape, J.N.; Coyle, M.; Flechard, C.; Kuylenstierna, J.; Hicks, K.; Derwent, D.; Johnson, C.; Stevenson, D. The gobal exposure of forests to air pollutants. Water Air Soil Pollut. 1999, 116, 5–32. [Google Scholar] [CrossRef]
  40. Ren, W.; Tian, H.; Tao, B.; Chapelka, A.; Sun, G.; Lu, C.; Liu, M.; Chen, G.; Xu, X. Impacts of tropospheric ozone and climate change on net primary productivity and net carbon exchange of China’s forest ecosystems. Glob. Ecol. Biogeogr. 2011, 20, 391–406. [Google Scholar] [CrossRef]
  41. Curtis, P.S.; Wang, X. A meta-analysis of elevated CO2 effects on woody plant mass, form, and physiology. Oecologia 1998, 113, 299–313. [Google Scholar] [CrossRef]
  42. Zak, D.R.; Holmes, W.E.; Pregitzer, K.S. Atmospheric CO2 and O3 alter the flow of 15N in developing forest ecosystems. Ecology 2007, 88, 2630–2639. [Google Scholar] [CrossRef] [PubMed]
Figure 1. The C, N, and P concentrations of individual tissues of P. zhennan and P. bournei under different O3 fumigation treatments. Different capital letters indicate a significant difference between O3 fumigation treatments for the same tree tissues (p < 0.05), and different lower-case letters indicate a significant difference between different tree tissues within the same O3 fumigation treatments (p < 0.05).
Forests 07 00078 g001
Figure 2. The C, N, and P stoichiometric ratios of individual tissues of P. zhennan and P. bournei under different O3 fumigation treatments. Different capital letters indicate a significant difference between O3 fumigation treatments for the same tree tissues (p < 0.05), and different lower-case letters indicate a significant difference between different tree tissues within the same O3 fumigation treatments (p < 0.05).
Forests 07 00078 g002
Figure 3. The C, N, and P stocks of individual tissues of P. zhennan and P. bournei under different O3 fumigation treatments. Different capital letters indicate a significant difference between O3 fumigation treatments for the same total biomass nutrient stocks (p < 0.05).
Forests 07 00078 g003
Table 1. 8 h mean O3 concentration and accumulated exposure over a threshold of 40 ppb (AOT 40) for the three O3 fumigation treatments.
Treatments8 h Mean O3 Concentration (ppb)AOT40 (ppm·h)
AA26.922.23
E1–O399.6654.44
E2–O3147.0896.23
AA, E1–O3 and E2–O3 denote ambient air, elevated O3 treatments 1, and elevated O3 treatments 2, respectively.
Table 2. Variance contributions of species (P. zhennan and P. bournei), tissues (foliage, stem, and root), and O3 fumigation treatments (AA, E1–O3, and E2–O3) for C, N, and P concentrations and stoichiometric ratios.
ObjectsPercentage of Total Sum of Squares (%)
stos × ts × ot × os × t × oError
C1.9915.89 *3.790.060.034.147.2566.85
N0.0177.34 ***14.62 ***0.661.06 *1.001.144.17
P1.90 *47.42 ***5.39 **10.32 ***0.9720.22 ***1.6712.11
C:N0.1273.68 ***12.16 ***0.130.752.700.4110.05
C:P1.7247.04 ***2.4417.04 ***1.3513.28 ***0.6216.51
N:P3.17 *32.67 ***18.09 ***11.88 ***2.5114.95 ***0.0316.70
s, t, and o denote species, tissues, and O3 fumigation treatments, respectively. * Significances are indicated at p < 0.05. ** Significances are indicated at p < 0.01. *** Significances are indicated at p < 0.001.
Table 3. Results of correlation analysis between different tissues biomass accumulation and corresponding stoichiometric ratio in two tree species among different O3 fumigation treatments.
Tree SpeciesTissues BiomassC:NC:PN:P
P. zhennanfoliage biomass0.722 *NSNS
stem biomassNS0.685 *NS
root biomassNSNSNS
total biomassNSNSNS
P. bourneifoliage biomassNSNSNS
stem biomassNSNSNS
root biomassNS−770 *−798 **
total biomassNSNSNS
The results were calculated by log10-transformed data. * Significances are indicated at p < 0.05, while NS means the correlation is insignificant (p > 0.05).

