1. Introduction
Teak (
Tectona grandis L. f) is one of the most valuable timber species in tropical regions, and it has been planted in various countries [
1]. The natural distribution of teak is in tropical deciduous forests in India, Myanmar, Thailand, and Laos [
1,
2]. In natural teak forests, there are obvious rainy and dry seasons, and the leaves of teak fall in the dry season [
1,
3,
4].
Water is one of the most important factors for the growth of teak. The period of the rainy and dry seasons affect the growth of teak, and increasing the length of the dry season shortened the leaf foliation period [
4,
5]. In terms of its typical morphological traits, teak has large simple leaves (maximum size is over 2,500 cm
2) [
6]. Transpiration and stomatal conductance showed high values compared with other tropical woody species [
7,
8,
9]. As a result, teak consumes large amounts of water for its growth. In addition, the leaves of teak are sensitive to drought stress [
10]. Below ground, the majority of the roots are concentrated within a soil depth of 60 cm [
1,
11], and ground water at this depth can readily run dry [
12]. On a suitable substance, teak prefers deep, moist, well-drained sandy loam soil [
1,
13]. In contrast, habitats with waterlogging suppressed the growth of teak [
1,
14].
Representative soils in Southeast Asia are acrisols (ultisols in USDA soil taxonomy) [
15,
16]. Acrisols are characterized by low pH, low nutrient content, and aluminum toxicity [
15,
17,
18]. The growth of teak is restricted by nutrient availability, and deficiency of nutrients. In particular, nitrogen, calcium, and phosphorus affect its growth drastically [
3,
19,
20]. The growth of teak is also suppressed by low pH and aluminum toxicity [
3,
21]. Moreover, clays in acrisols at the surface are leached, and the water holding capacity at the surface is low [
16,
17]. The growth of teak showed negative correlations with the content of sand, and a plantation with a high content of sand in the soil showed low growth potential for teak [
3,
22,
23]. Acrisols in Northeast Thailand are described as a “light textured sandy soil” (abbreviated to sandy soil), with low content of clay, low pH, low fertility, and low water holding capacity [
24,
25]. To improve the low pH and poor fertility of acrisol, correction of acidity and fertilization could be applied to accelerate the growth of teak [
21,
26,
27]. However, there has been no research examining how improvements in water holding capacity of acrisols could affect teak growth.
To improve the low water holding capacity of acrisols, some materials have been shown to be effective. In a previous experiment, Ramesh
et al. [
28] added fly ash to planted teak growing on lixisols. The growth of teak was accelerated by the addition of fly ash; however, an obvious increase in water holding capacity was not observed with this treatment. On the other hand, among materials to increase water holding capacity, bentonite is a clay consisting mostly of montmorillonite that has a high water holding capacity [
23,
29]. In addition, charcoal (biochar) and corncob have a high water holding capacity [
30,
31,
32,
33,
34]. We considered that these materials may increase the water holding capacity of acrisols, and thereby accelerate the growth of teak. However, previous research did not examine the effects of these materials on the growth of teak.
The aim of our research was to examine the availability of materials to improve suitable water holding capacity and increase teak growth. We conducted a pot experiment with teak seedlings in acrisol with the addition of bentonite, charcoal, or corncob. To verify the effects of these three materials, we examined the ecophysiological traits of teak seedlings, specifically (1) the growth characteristics of seedlings, (2) leaf water potential, (3) photosynthetic rate, and (4) concentrations of elements in plant organs. These parameters were compared with seedlings potted in only acrisol. Our research is a preliminary step to establish silvicultural methods for teak in acrisol in Southeast Asia.
2. Materials and Methods
2.1. Study Site
Our experiment was conducted at the Northeast Forest Seed Center located in Khon Kaen Province in northeastern Thailand (16°16′ N, 102°47′ E, 191 m a.s.l.). This center has been measuring meteorological data. The mean annual precipitation was 1104 mm·year
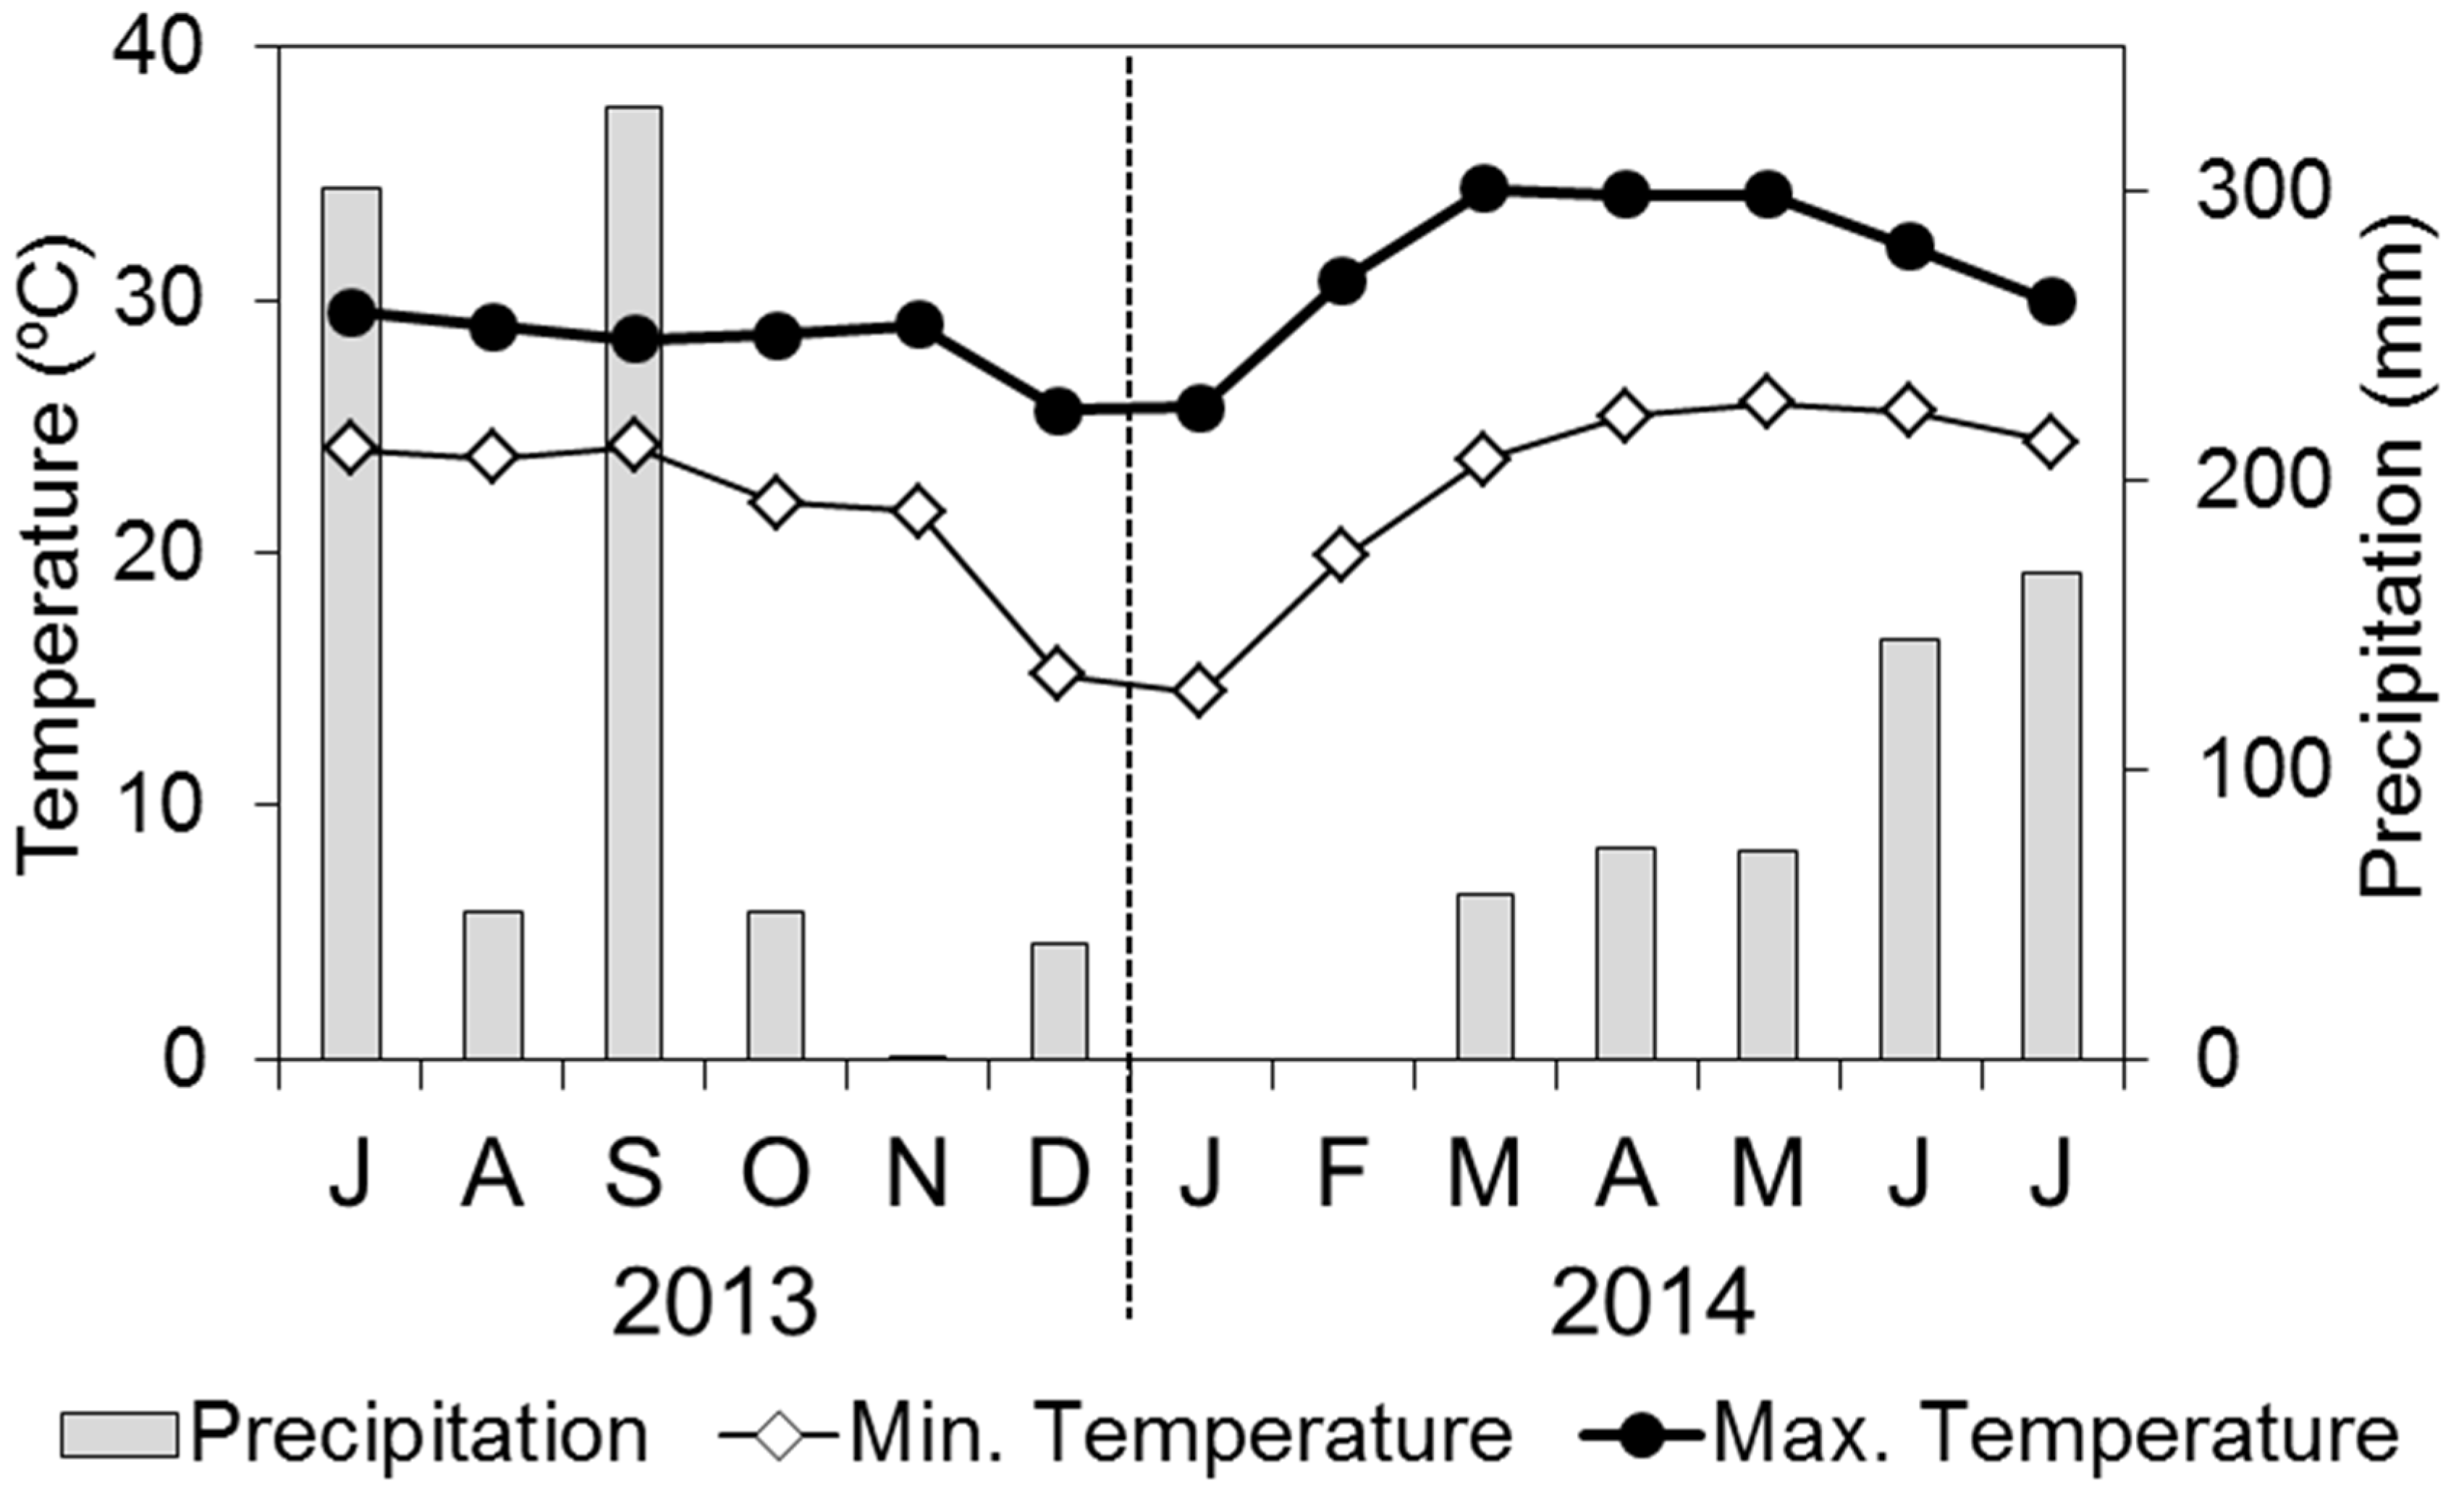
−1 and annual mean, maximum, and minimum temperatures were 28.3 °C, 40 °C, and 13 °C, respectively (from 2008 to 2012, Northeast Forest Seed Center, unpublished data). Precipitation is concentrated from May to October (Northeast Forest Seed Center, unpublished data). During the experimental period, monthly precipitation and average maximum and minimum temperatures are shown in
Figure 1.
Farmers living in this district are interested in the farming of teak [
35]. In Khon Kaen Province, we previously published a soil suitability map of teak plantation for farmers [
36]. Khon Kaen Province spreads from lowland areas along several rivers (36.9%). These areas suffer waterlogging and are recognized as unsuitable for teak planting. Sandy soil is also distributed over a large area (13.5%). These areas are categorized as moderately suitable areas for teak planting. To accelerate the growth of teak planted in sandy soil, improvement of the water holding capacity is essential. In the case of agriculture in northeast Thailand, soil improvement using clay could increase a yield in crops [
37]. We considered that the method of soil improvement will also apply for silviculture.
Figure 1.
Monthly precipitation and maximum and minimum temperatures at the Northeast Forest Seed Center, Khon Kaen (from July 2013 to July 2014). Note: letters under the horizontal axis are the start of each month. The same format is used in subsequent figures.
Figure 1.
Monthly precipitation and maximum and minimum temperatures at the Northeast Forest Seed Center, Khon Kaen (from July 2013 to July 2014). Note: letters under the horizontal axis are the start of each month. The same format is used in subsequent figures.
2.2. Preparation of Materials, Soil, and Teak Seedlings
For the ratio of bentonite, charcoal, and corncob to add to sandy soil, we established 4% as being suitable because the literature showed positive effects at this ratio [
26,
28,
38]. In July 2013, we prepared 7 kg each of bentonite and charcoal (made from
Acacia sp.) bought from a market in Thailand. For the corncob treatment, we received 7 kg from a farmer in Khon Kaen Province. Charcoal and corncob were crushed to particle sizes under 5 mm and 1 cm in diameter, respectively. We also collected 600 kg of sandy soil from a land at the Northeast Forest Seed Center. Our experiment was conducted without fertilization because we had to examine the effects of nutrients in bentonite, charcoal, and corncob.
The teak seedlings were prepared by a tissue culture technique. The locality of the teak clone was the Province of Mae Hong Son (clone number 21), and this clone has been planted in various places (Royal Forest Department, unpublished data). Teak seedlings were raised from March to June 2013 at the Teak Improvement Center, Lampang, Thailand. In July 2013, 74 teak seedlings were transported to the Northeast Forest Seed Center, Khon Kaen. In addition, we prepared eight tables for raising the teak seedlings.
2.3. Establishment of the Pot Experiment
We established bentonite, charcoal, and corncob treatments by adding them at a rate of 4% into the sandy soil. We mixed the components, and the total weight of the mixed soil was 153 kg per treatment. These mixed soils were put into 17 pots (depth: 22.5 cm, diameter: 27 cm, volume: 8.5 L), and the soil weight per pot was 9 kg. We also prepared 17 pots filled with 9 kg each of sandy soil alone as the control treatment. Before transplantation, 50 g of soil samples were collected from four pots for each treatment.
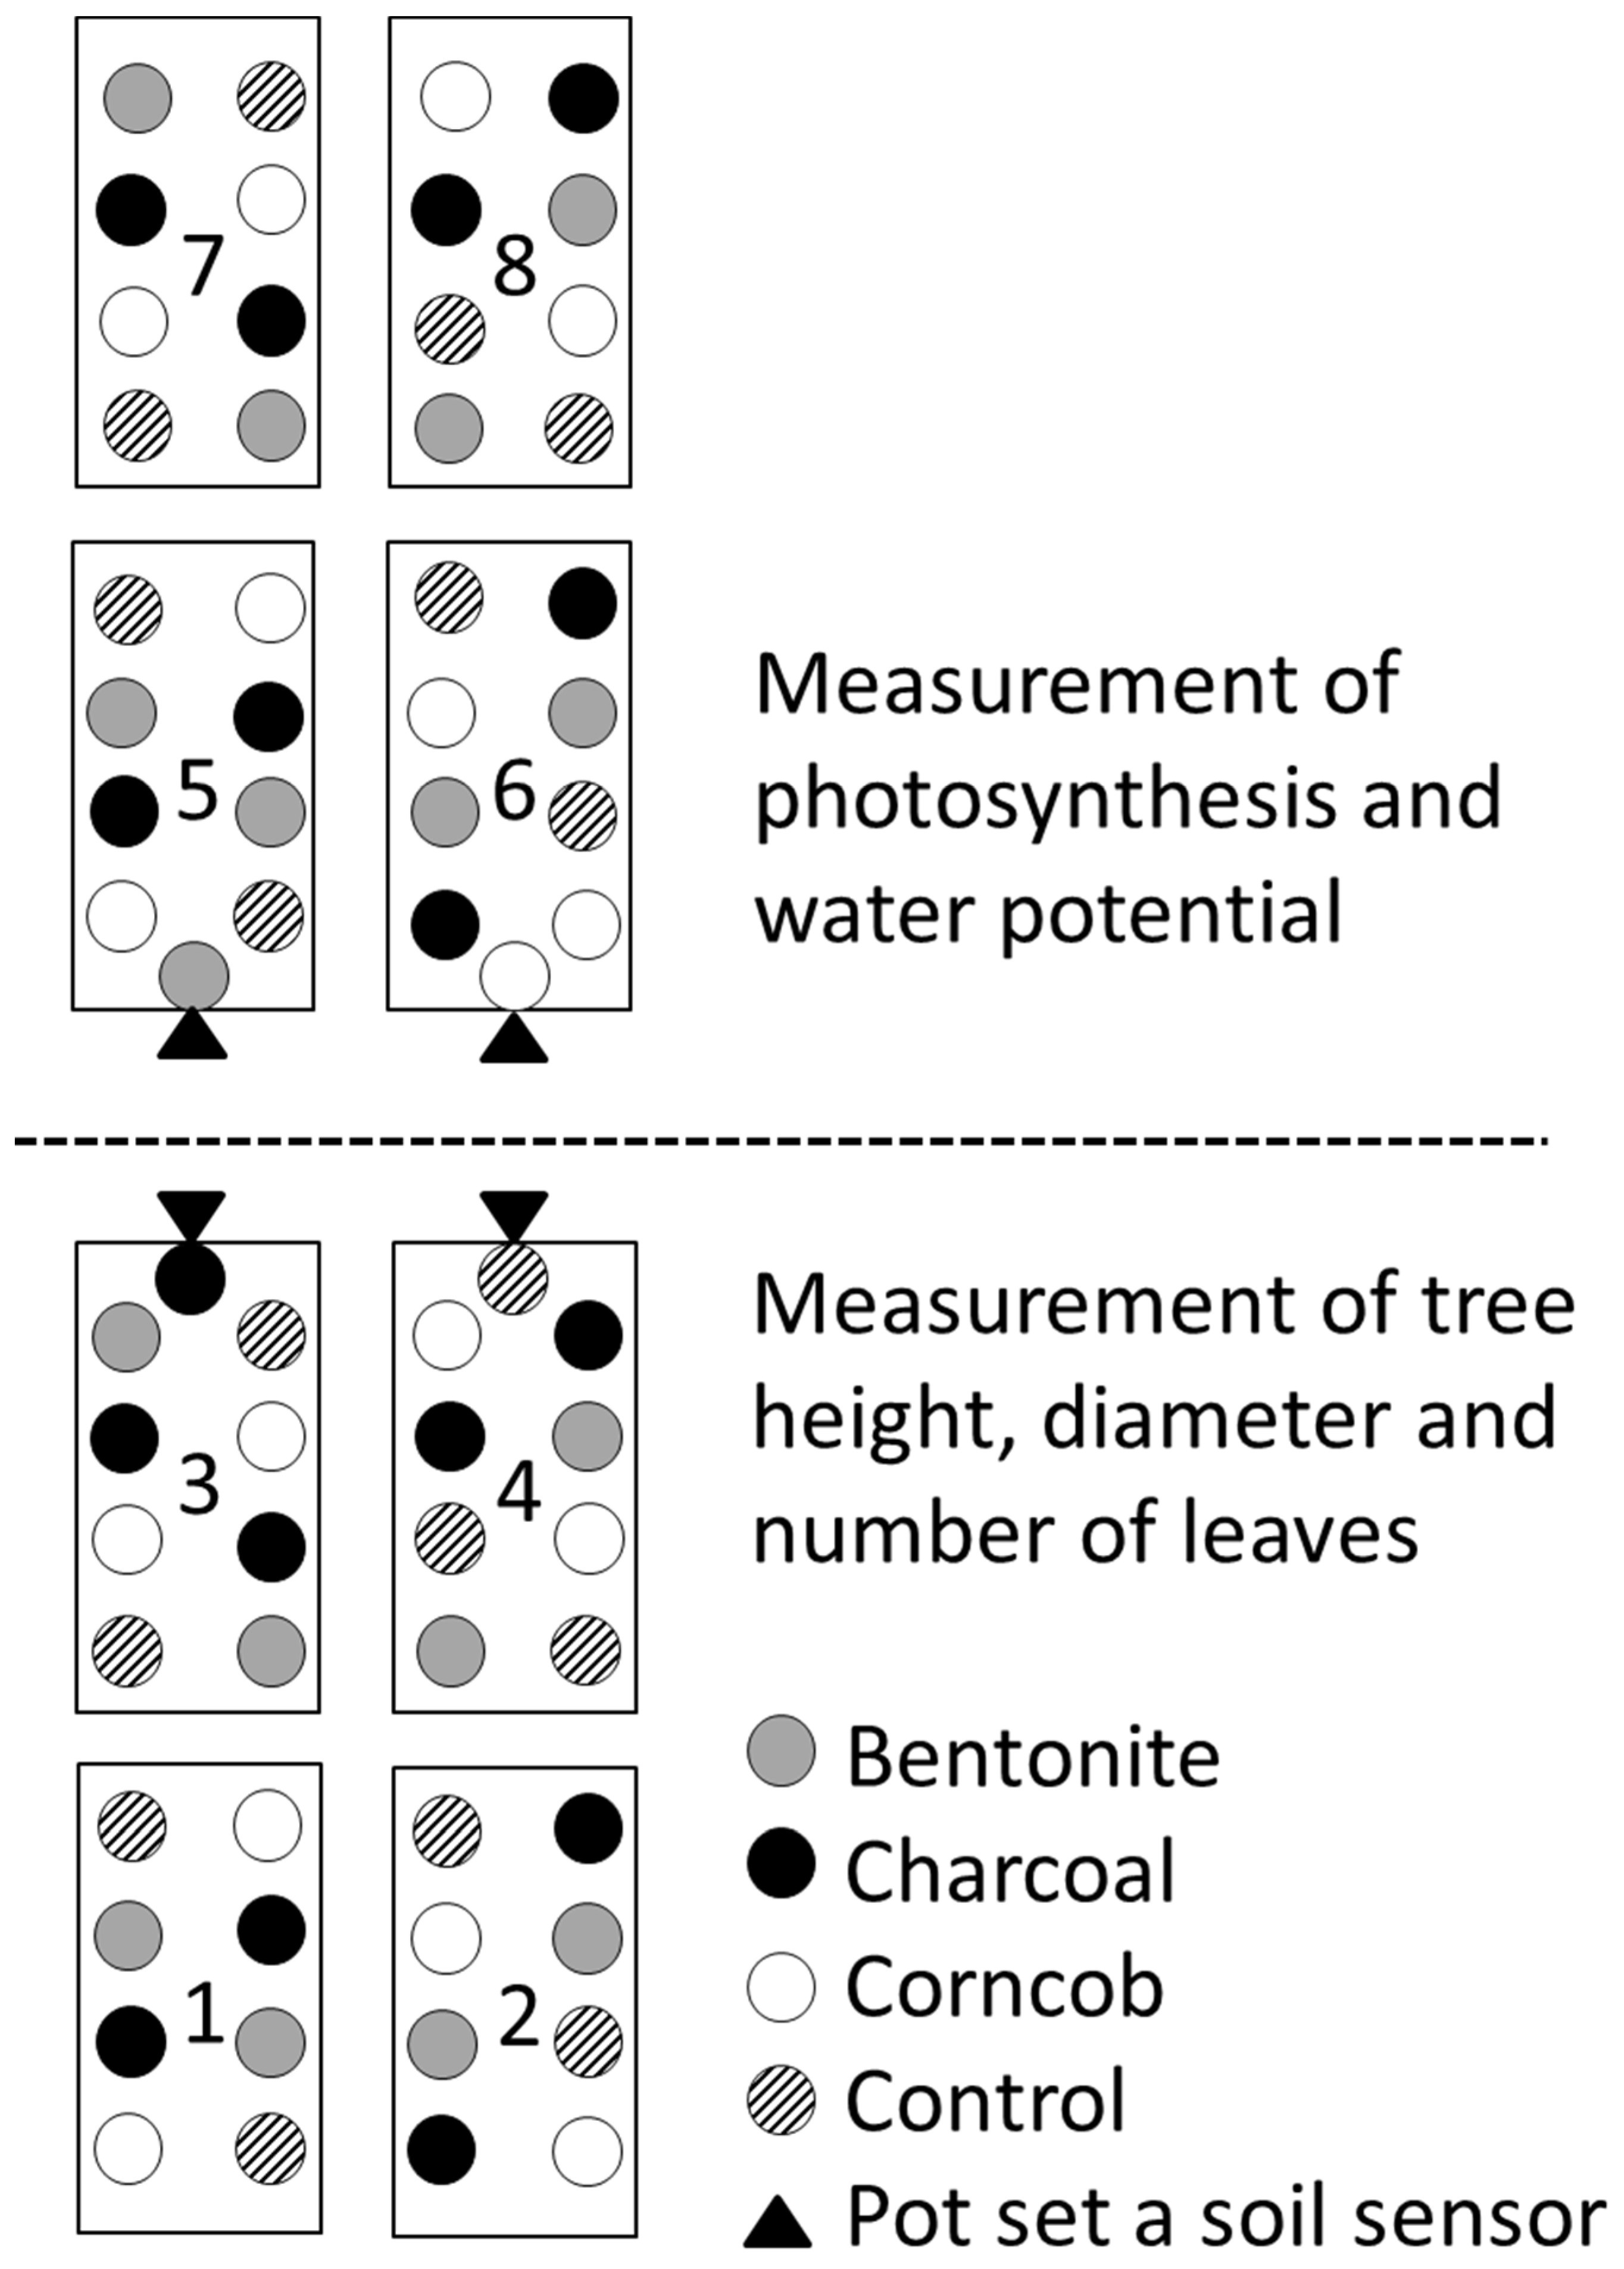
We potted 64 teak seedlings in 16 of pots for each treatment in July 2013. In each seedling, 0.3 kg of original soil was retained, and this soil was buried in the pot. We also set a soil sensor (ML2, Delta-T Devices Ltd., Cambridge, UK) in one pot per treatment. The water content of the soil was measured continuously. The remaining 10 teak seedlings were sampled at this time. Eight pots (two pots per treatment) were put on the eight tables, and these tables were established in the field in sunny conditions (
Figure 2). The four pots containing the soil sensors were also put on the tables (
Figure 2). The logger connected to the soil sensor was fixed to a pole made of concrete.
After these works, all pots (including pots with soil sensors) were irrigated with 1 L of water in the morning of every other day. In rainy days, irrigation was not conducted. Irrigation was carried out until the end of our experiment (July 2014).
Figure 2.
Schematic of experimental treatment design, eight seedlings (two pots per treatment) were put on a table.
Figure 2.
Schematic of experimental treatment design, eight seedlings (two pots per treatment) were put on a table.
2.4. Soil Analysis
We measured soil texture and chemical properties including pH and concentrations of C, N, exchangeable P, base cations, Al, and Fe. Four soils of each treatment sampled before transplantation were used. We also collected four samples of original soil from seedlings sampled in July 2013. To determine the pH of the soil, 25 mL of distilled water was added to 10 g fresh soil to make a homogenized mixture [
39]. This mixture was then shaken for 1 h and the pH was measured using a pH meter (SG2, Mettler Toledo, Zürich, Switzerland). Prior to chemical analysis, we conducted air-drying of soil samples.
The soil texture was determined by the hydrometer method [
40]. The concentrations of C and N in dried soils were determined using a nitrogen and carbon analyzer (Flash 2000, Thermo Fisher Scientific, Waltham, MA, USA). Exchangeable P was separated using dilute acid fluoride [
41] by shaking for 1 minute. P in the extracted solution was determined by the molybdenum blue method [
42] using a spectrophotometer (U-1800, Shimadzu, Kyoto, Japan). Exchangeable base cations (Ca, Mg, K, Na) and Mn were quantified by mixing 4 g of dry soil with 100 ml of 1 M ammonium acetate solution, and shaking for 1 h [
41]. Solutions for exchanged Fe and Al were obtained by adding 20 ml of 1 M KCl to 1 g of dry soil and shaking for 1 h [
41]. Base cations in the extracted solutions were analyzed using an atomic absorption spectrophotometer (AAnalyst 300, Perkin-Elmer, Norwalk, CT). For Al and Fe, the extracted solution was analyzed using an inductivity coupled plasma (ICP) analyzer (ICPE-9000, Shimadzu, Kyoto, Japan).
2.5. Measurement of Teak Seedlings
For the measurement of teak seedlings, eight seedlings for each treatment were used for growth measurements (seedlings put on No.1 to 4 tables,
Figure 2). We measured tree height and basal diameter at six time points (July 2013, October 2013, December 2013, February 2014, April 2014, and July 2014). We also measured length and width for all leaves of the teak seedlings. The leaf area of teak seedling was calculated from the equation of Tondjo
et al. [
43], as follows:
where
A is the leaf area,
L is the leaf length, and Wi is the leaf width.
From September 2013, some teak seedlings elongated new shoots from the base of the root. Leaves foliated from new shoots were called “low position leaves”, and separated from other leaves, which were called “high position leaves”.
From our observations, teak leaves foliated in response to continuous irrigation. To estimate leaf productivity and turnover, the numbers of leaves of seedlings were counted every week for eight individuals in each treatment. We calculated the leaf longevity from the dates of occurrence and defoliation of leaves. In addition, we counted the total number of leaves produced in the experimental period.
2.6. Measurement of Photosynthetic Rate
We measured area-based photosynthetic rate at light saturation (
Psat) and stomatal conductance (gs) for teak leaves located second from the top. For the measurement of photosynthetic rate and leaf water potential, the eight teak seedlings not used for the measurement of growth parameters were used by treatment (seedlings put on No. 5 to 8 tables,
Figure 2). There was no irrigation to eliminate the effects of water in a pot on the day when we conducted these measurements.
When we measured the photosynthetic rate, the leaves of some seedlings were immature or senescent. To provide uniformly mature teak leaves, we selected four teak leaves among eight seedlings. We measured Psat five times (October 2013, December 2013, February 2014, April 2014, and July 2014), and the time of measurement was uniformly from 09:00 to 11:00 (UTC+7).
Measurements were made using a portable gas analyzer (LI-6400, LiCor, Lincoln, NE, USA) under steady-state conditions, an ambient temperature of 27 °C, and ambient CO2 concentration of 38.0 Pa. The LED light source was adjusted to a saturation light level of 1800 µmol m−2·s−1 PPF.
2.7. Measurement of Leaf Water Potential, Concentration of Chlorophyll, and Leaf Mass Per Area
After measurement of photosynthetic rate, we measured the leaf water potential of teak leaves five times (October 2013, December 2013, February 2014, April 2014, and July 2014). The leaf used to measure water potential was the same as that used to measure photosynthetic rate. In general, leaf water potential showed the lowest value in the afternoon by transpiration, and showed the highest value by recovery of water during the night [
44]. We measured leaf water potential in the afternoon and predawn. Four teak leaves for each treatment were sampled at 1–2 p.m. and 5:30–6:00 a.m. the next day (UTC+7). Sampled shoots were put in a plastic bag that contained a wet filter paper, and kept in a refrigerator. We measured leaf water potential using a pressure chamber (Model 600, PMS Instrument Co., Albany, OR, USA).
After measuring leaf water potential, we analyzed the concentration of nitrogen, chlorophyll, and leaf mass per area (LMA). Photosynthetic rate is closely related to concentrations of nitrogen [
44,
45,
46], chlorophyll [
47,
48], and leaf thickness [
49,
50]. We sampled 0.66 cm
2 of teak leaf samples in a freezer. Chlorophyll was extracted from the leaves using dimethyl sulfoxide (DMSO), and then measured using a spectrophotometer. The amounts of chlorophylls a and b were calculated in accordance with the previously reported equation [
51]. The remaining leaf samples were oven-dried at 70 °C for three days, and LMA (g·m
−2) measured by the method of Larcher [
44]. Leaf samples were ground to a fine powder using a sample mill (WB-1; Osaka Chemical Co., Osaka, Japan). The concentration of N was determined using an NC analyzer (Sumigraph NC-220F, Sumika Chemical Analysis Service, Tokyo, Japan). The results of the concentration of N were calculated from the area based on N (
Narea) from the data of LMA.
2.8. Analysis of Biomass and Element Concentrations of Teak Seedlings
To determine the biomass of teak seedlings, we measured the dry mass of leaves, stems and branches, and roots. In July 2014, eight teak seedlings from each treatment used for growth measurements were sampled (seedlings put on No. 1 to 4 tables,
Figure 2). Roots of seedlings were washed twice with water to remove soil. The washed seedlings were divided into leaves, stems and branches, and roots. Each component was put into its own envelope and oven-dried at 70 °C for three days. After drying, the dry mass of each component was determined. We also examined the root/shoot ratio as an indicator of teak growth [
10,
19,
21].
Of the elements in the plant organs, we measured the mass base of concentrations of N, P, K, Ca, Mg, Al, and Fe in leaves and roots. Dried samples were ground to a fine powder, and N concentration was determined using the NC analyzer. The remaining samples were digested by the HNO
3-HCl-H
2O
2 method [
52]. Concentrations of K, Ca, Mg, Al, and Fe were analyzed using an ICP analyzer. During analysis, we analyzed standard solutions of each element after 30 samples to verify the reliability of the analyses. Concentration of P was determined by the molybdenum blue method using a spectrophotometer (UV-2500PC, Shimadzu, Kyoto, Japan).
2.9. Statistical Analysis
Significant pairwise differences for each variable were tested by Tukey’s test using Stat View 5.0 (SAS Institute Inc., Cary, NC, USA). Comparisons were made among the bentonite, charcoal, corncob, and control treatments.
3. Results
3.1. Climate during the Experimental Period
Precipitation in July and September 2013 was high compared with other months (
Figure 1). However, precipitation in August 2013 was low, and precipitation was not stable. Precipitation decreased from October 2013, and there was no rain in January or February 2014. From March 2014, precipitation increased gradually.
The maximum temperature was around 29 °C, and this value was stable from July 2013 to November 2013. In December 2013 and January 2014, the maximum temperature decreased below 26 °C, then from February 2014, the maximum temperature increased. The maximum temperature reached the highest value in March 2014 (34.4 °C). The minimum temperature was around 23 °C from July 2013 to November 2013. However, the minimum temperature decreased to 15 °C in December 2013 and January 2014. In March 2014, minimum temperature increased to 25 °C, and this value was stable until July 2014.
3.2. Water Contents in Soil
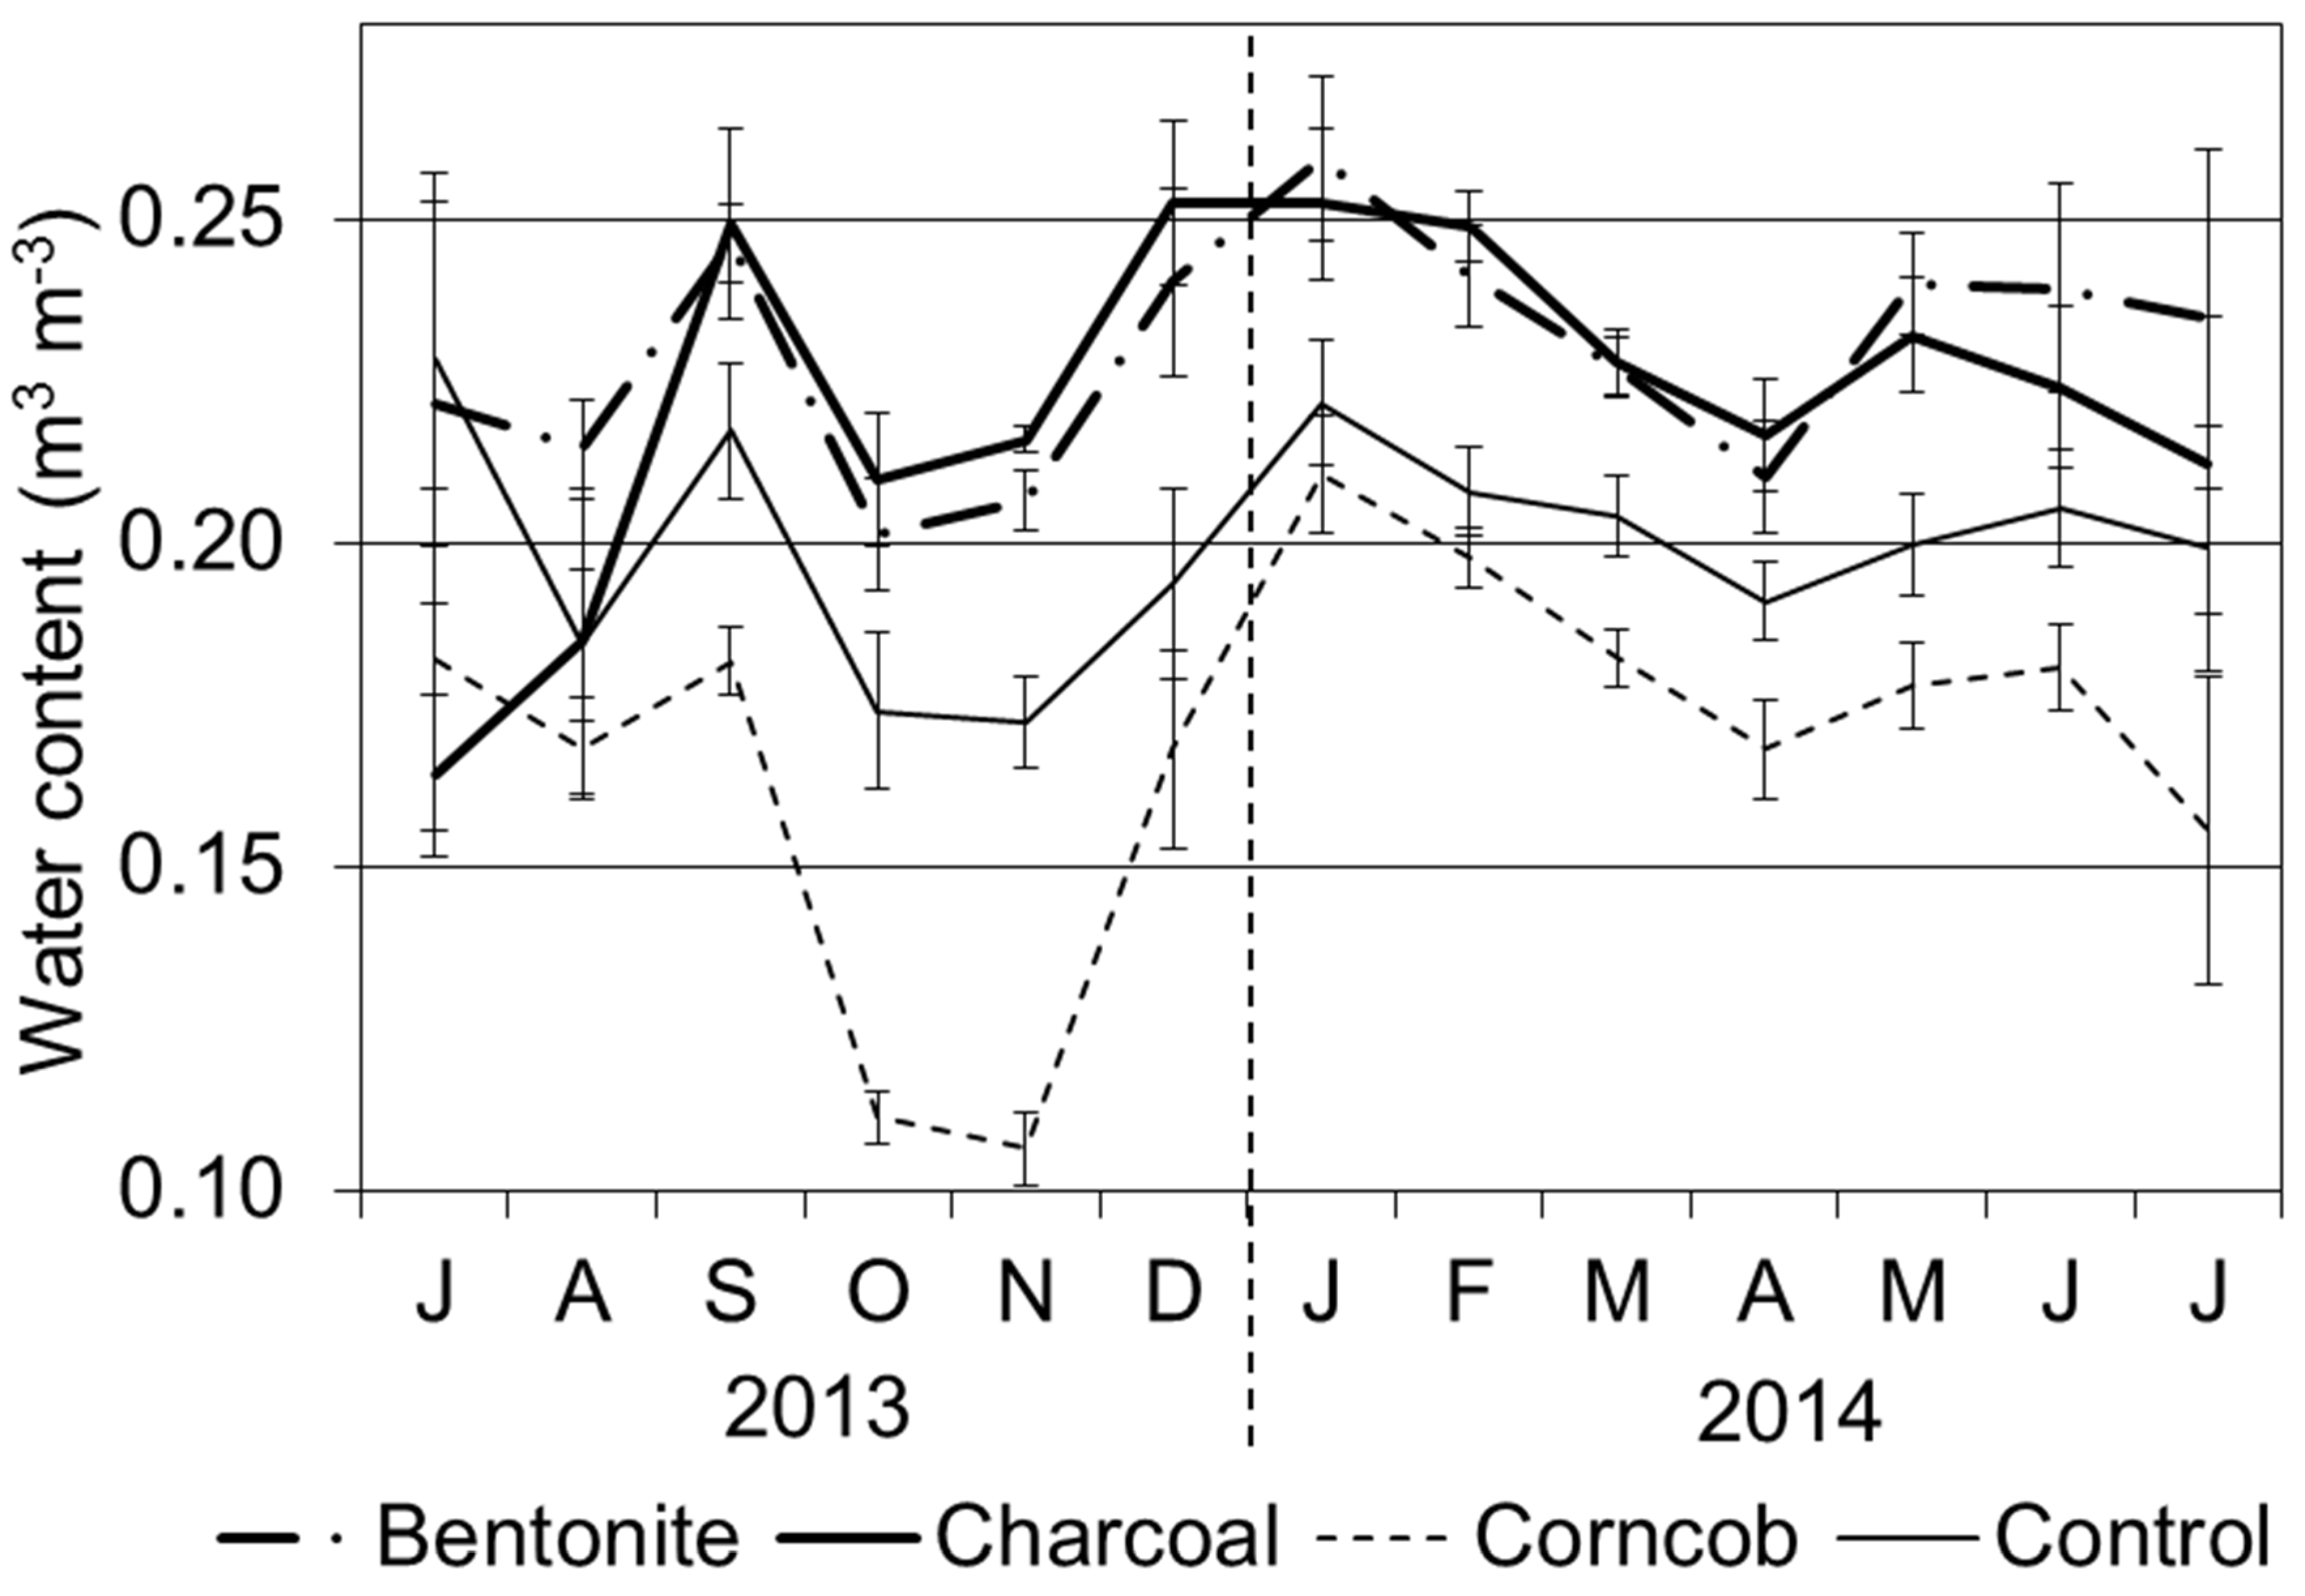
To examine the minimum value of water content in soil for each season, we collected the lowest water contents before irrigation and rainfall. Averages of these values for each month are shown in
Figure 3. The water content was high for the bentonite treatment throughout the whole period. For the charcoal treatment, water content increased from September 2013. In contrast, the corncob treatment showed low water content compared with the other three treatments. Water content in the corncob treatment increased and approached the value of the control treatment from January 2014. Comparing months, the water contents in October and November 2013 were lower than those in other months. From December 2013, water content increased for each treatment, and water content also decreased in April 2014 for each treatment.
Figure 3.
Average of soil water content among the four treatments before irrigation or rainfall (from July 2013 to July 2014, Mean ± SE). Note: the values of water content were averaged among several dates with low values before irrigation.
Figure 3.
Average of soil water content among the four treatments before irrigation or rainfall (from July 2013 to July 2014, Mean ± SE). Note: the values of water content were averaged among several dates with low values before irrigation.
Water contents for each treatment were increased by rainfall in September 2013. The maximum values of water contents for each treatment were 0.59 m3·m−3 for bentonite, 0.41 m3·m−3 for charcoal, 0.27 m3·m−3 for corncob, and 0.30 m3·m−3 for control.
3.3. Soil Properties
For soil texture, the content of sand was over 88.0% for each treatment (
Table 1). The contents of silt and clay were low for each treatment. However, the clay content of the bentonite treatment was significantly higher than those for other treatments (
p < 0.05). Clay content for bentonite alone was 66%.
The pH value was significantly higher for the charcoal treatment than those of other treatments (p < 0.05). The concentrations of C, N, Ca, and Mg for the charcoal treatment were also significantly higher than those for the control treatment (p < 0.05). In contrast, bentonite treatment resulted in significantly higher concentrations of Mg and Na compared with the control treatment (p < 0.05). Fe concentrations with the bentonite treatment were significantly lower than with the control treatment. In the corncob treatment, the concentrations of elements did not show a significant trend. There was no significant difference in the concentrations of P and Al among the four treatments.
The original soil contained in the seedling pots showed high contents of silt and clay compared with the sandy soil used for each treatment. Concentrations of C, N, Ca, and Mg showed higher values than sandy soil.
Table 1.
Texture and chemical properties on soils of four treatments and original soil with the seedlings (Mean ± SE, n = 4). Different letters indicate significant differences among the four treatments calculated by Tukey’s test (p < 0.05).
Table 1.
Texture and chemical properties on soils of four treatments and original soil with the seedlings (Mean ± SE, n = 4). Different letters indicate significant differences among the four treatments calculated by Tukey’s test (p < 0.05).
| Treatment | Texture (%) | pH |
|---|
| Sand | Silt | Clay |
|---|
| Bentonite | 89.5 ± 0.1 | b | 4.5 ± 1.0 | a | 6.0 ± 0.0 | a | 5.03 ± 0.11 | c |
| Charcoal | 91.0 ± 0.1 | ab | 5.5 ± 1.9 | a | 3.5 ± 1.0 | b | 6.23 ± 0.07 | a |
| Corncob1 | 88.5 ± 0.1 | bc | 4.3 ± 1.0 | a | 3.4 ± 1.0 | b | 5.47 ± 0.10 | b |
| Control | 92.0 ± 0.0 | a | 4.0 ± 0.0 | a | 4.0 ± 0.0 | b | 5.24 ± 0.06 | bc |
| Original | 75.7 ± 0.2 | | 15.3 ± 0.1 | | 9.0 ± 0.0 | | 5.92 ± 0.16 | |
| | C (mol·kg−1) | N (mmol·kg−1) | P (mmol·kg−1) | Ca (mmol·kg−1) |
| Bentonite | 0.34 ± 0.04 | b | 7 ± 0 | b | 0.267 ± 0.127 | a | 3.3 ± 0.2 | b |
| Charcoal | 1.57 ± 0.17 | a | 31 ± 3 | a | 0.343 ± 0.086 | a | 10.7 ± 1.1 | a |
| Corncob | 0.65 ± 0.27 | b | 7 ± 0 | b | 0.102 ± 0.035 | a | 1.9 ± 0.0 | b |
| Control | 0.54 ± 0.21 | b | 6 ± 2 | b | 0.173 ± 0.081 | a | 2.4 ± 0.3 | b |
| Original | 2.82 ± 1.18 | | 178 ± 46 | | 0.406 ± 0.066 | | 18.2 ± 2.9 | |
| | Mg (mmol·kg−1) | K (mmol·kg−1) | Na (mmol·kg−1) | Al (mmol·kg−1) |
| Bentonite | 2.0 ± 0.1 | a | 1.03 ± 0.08 | b | 0.926 ± 0.091 | a | 0.150 ± 0.010 | a |
| Charcoal | 1.8 ± 0.1 | a | 3.02 ± 0.19 | a | 0.081 ± 0.023 | b | 0.159 ± 0.003 | a |
| Corncob | 1.3 ± 0.0 | b | 2.79 ± 0.88 | ab | 0.012 ± 0.012 | b | 0.145 ± 0.008 | a |
| Control | 1.3 ± 0.0 | b | 1.14 ± 0.06 | ab | 0.083 ± 0.064 | b | 0.147 ± 0.010 | a |
| Original | 11.8 ± 1.1 | | 2.48 ± 0.20 | | 0.651 ± 0.096 | | 0.147 ± 0.003 | |
| | Fe (µmol·kg−1) | | | | | |
| Charcoal | 9.4 ± 1.1 | ab | | | | | | |
| Bentonite | 9.0 ± 0.7 | b |
| Corncob | 10.9 ± 1.5 | ab |
| Control | 14.0 ± 0.9 | a |
| Original | 12.0 ± 0.6 | |
3.4. Growth Characteristics
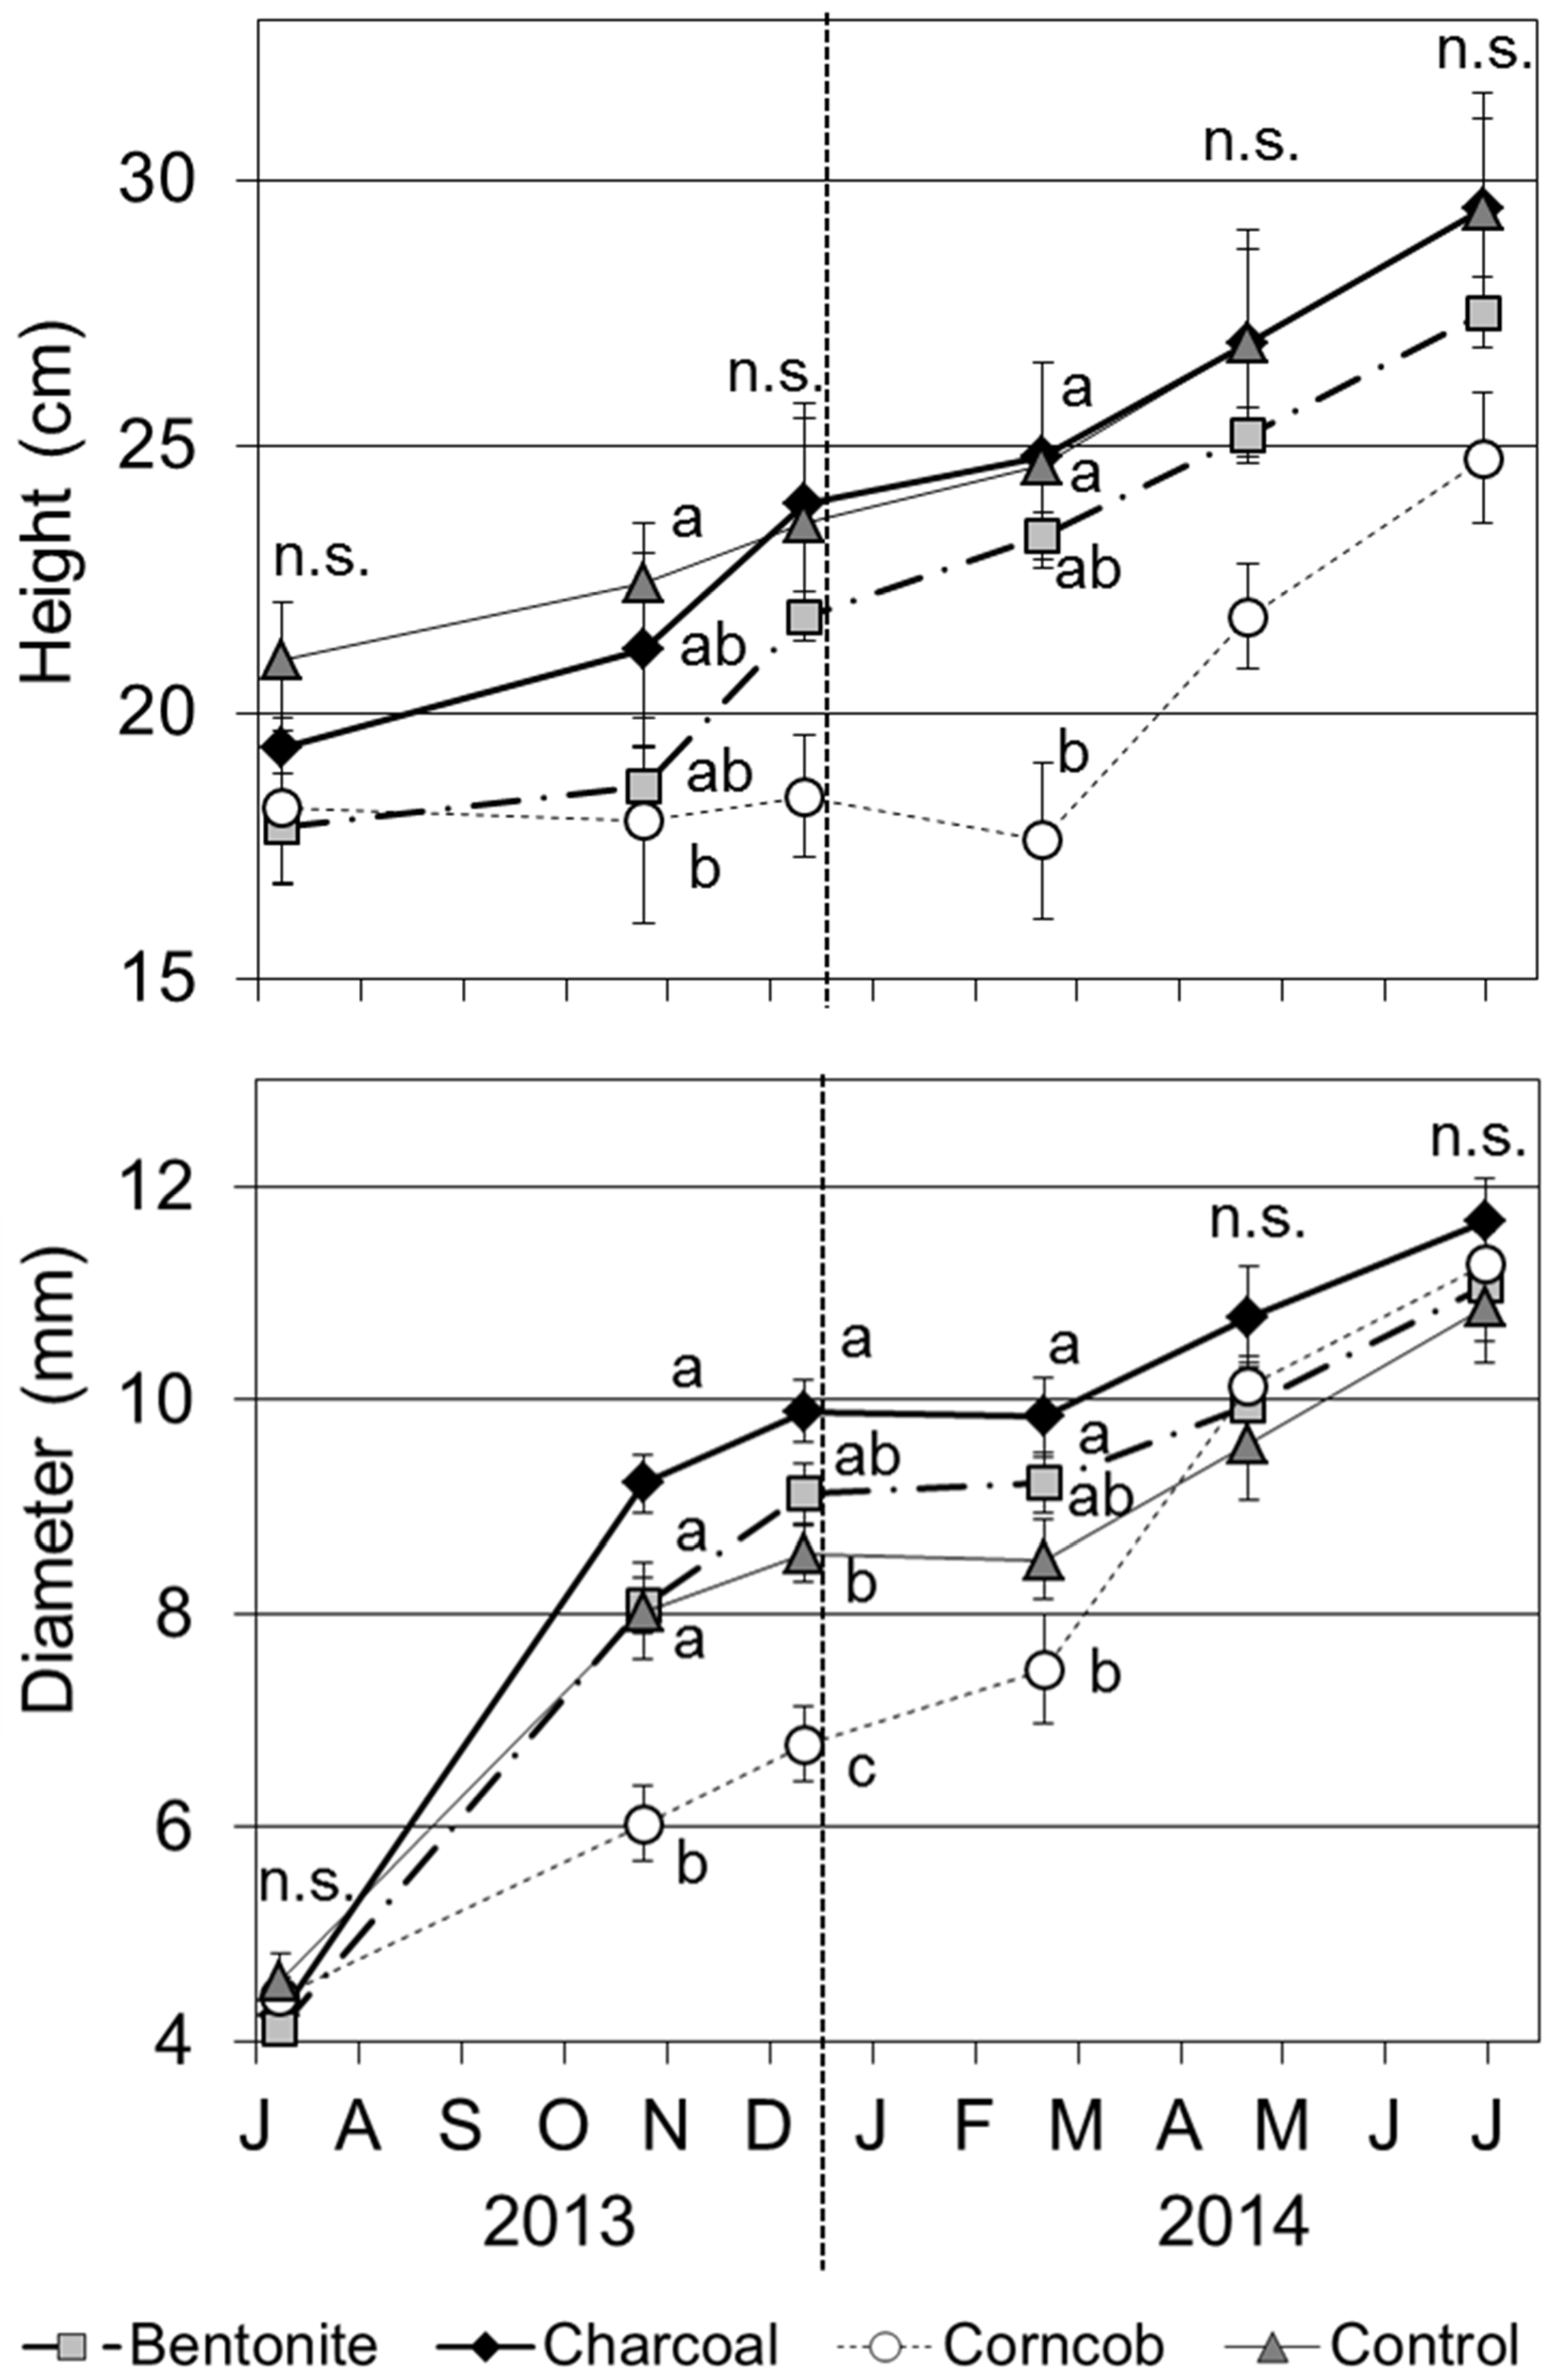
The tree height with the corncob treatment was significantly lower than that for the control treatment in October 2013 and February 2014 (
Figure 4,
p < 0.05). The basal diameter was also significantly smaller for the corncob treatment than the other treatments from October 2013 to February 2014 (
p < 0.05). In February 2014, some of the original shoots of seedlings in the corncob treatment had died, and as a result the tree height decreased compared with December 2013. However, these seedlings elongated new shoots grown from the base of the roots. From April 2014, seedlings in the corncob treatment accelerated their growth, and the tree height and basal diameter did not show a significant difference among the four treatments. For growth in the other treatments, charcoal treatment showed the highest value of basal diameter in December 2013 (
p < 0.05); however, this trend did not show from February 2014.
Figure 4.
Tree height and basal diameter of teak seedlings grown in four treatments (Mean ± SE, n = 8). Note: divisions on horizontal axis over the letters are the first day of each month. The same format is used in subsequent figures.
Figure 4.
Tree height and basal diameter of teak seedlings grown in four treatments (Mean ± SE, n = 8). Note: divisions on horizontal axis over the letters are the first day of each month. The same format is used in subsequent figures.
3.5. Leaf Dynamics of Teak Seedling
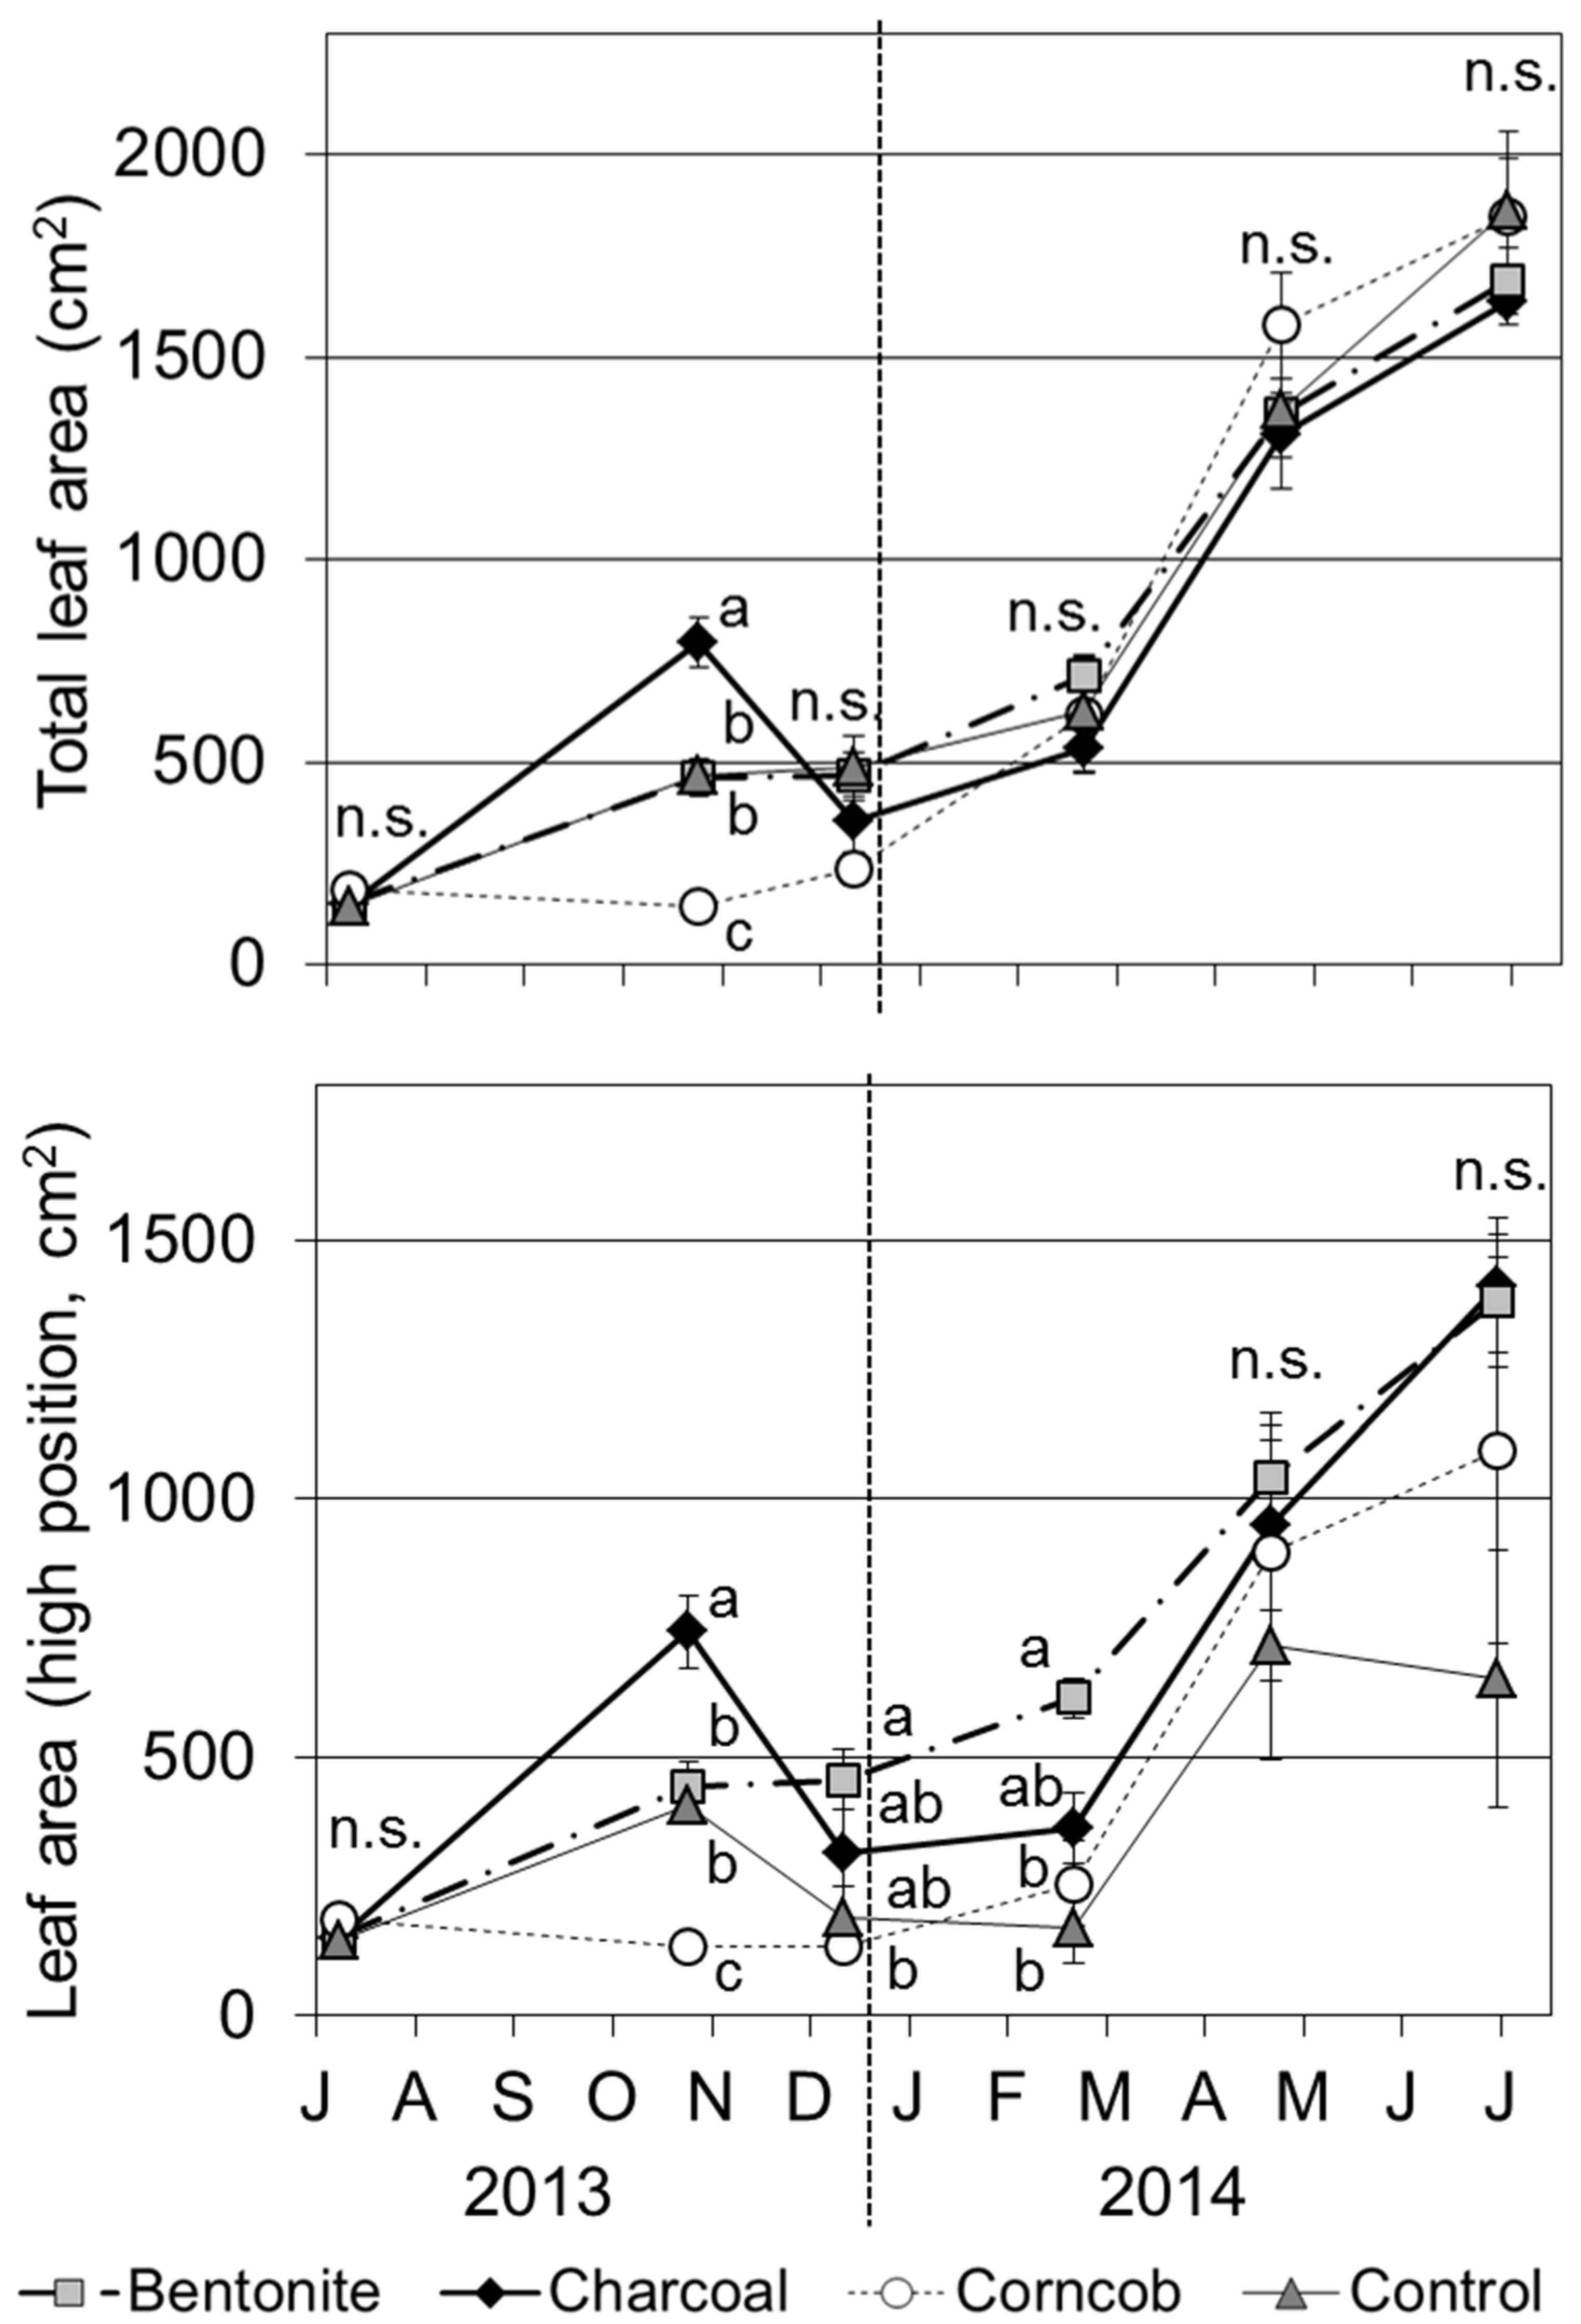
The total leaf area in October 2013 was significantly larger for the charcoal treatment than those of other treatments (
Figure 5,
p < 0.001). In contrast, the corncob treatment showed small total leaf areas compared with other treatments (
p < 0.001). However, the total leaf area of the charcoal treatment decreased in December 2013. From this month, the total leaf area did not show a significant difference among the four treatments. For the leaf area at high positions, bentonite treatment resulted in significantly larger areas than those of other treatments in December 2013 and February 2014 (
p < 0.05). In the control treatment, the leaf area at the high position was decreased in December 2013 (
p < 0.05) and showed a small trend after this month.
Figure 5.
Total and high position (located at the top of stem) leaf areas for teak seedlings grown in the four treatments (Mean ± SE, n = 8).
Figure 5.
Total and high position (located at the top of stem) leaf areas for teak seedlings grown in the four treatments (Mean ± SE, n = 8).
The average leaf longevity at high positions was 116 days for bentonite, 90 days for charcoal, 115 days for corncob, and 76 days for control treatments. Leaf longevity was significantly longer for the bentonite and corncob treatments than for the control treatment (Tukey’s test, p < 0.01). Comparing seasons, the trend in leaf longevity was individually specific and did not show a definite trend for each treatment. During this experiment, the total numbers of leaves produced were 27.6 for bentonite, 28.1 for charcoal, 26.8 for corncob, and 37.4 for control. There was no significant difference in leaf production among the four treatments.
3.6. Photosynthetic Rate
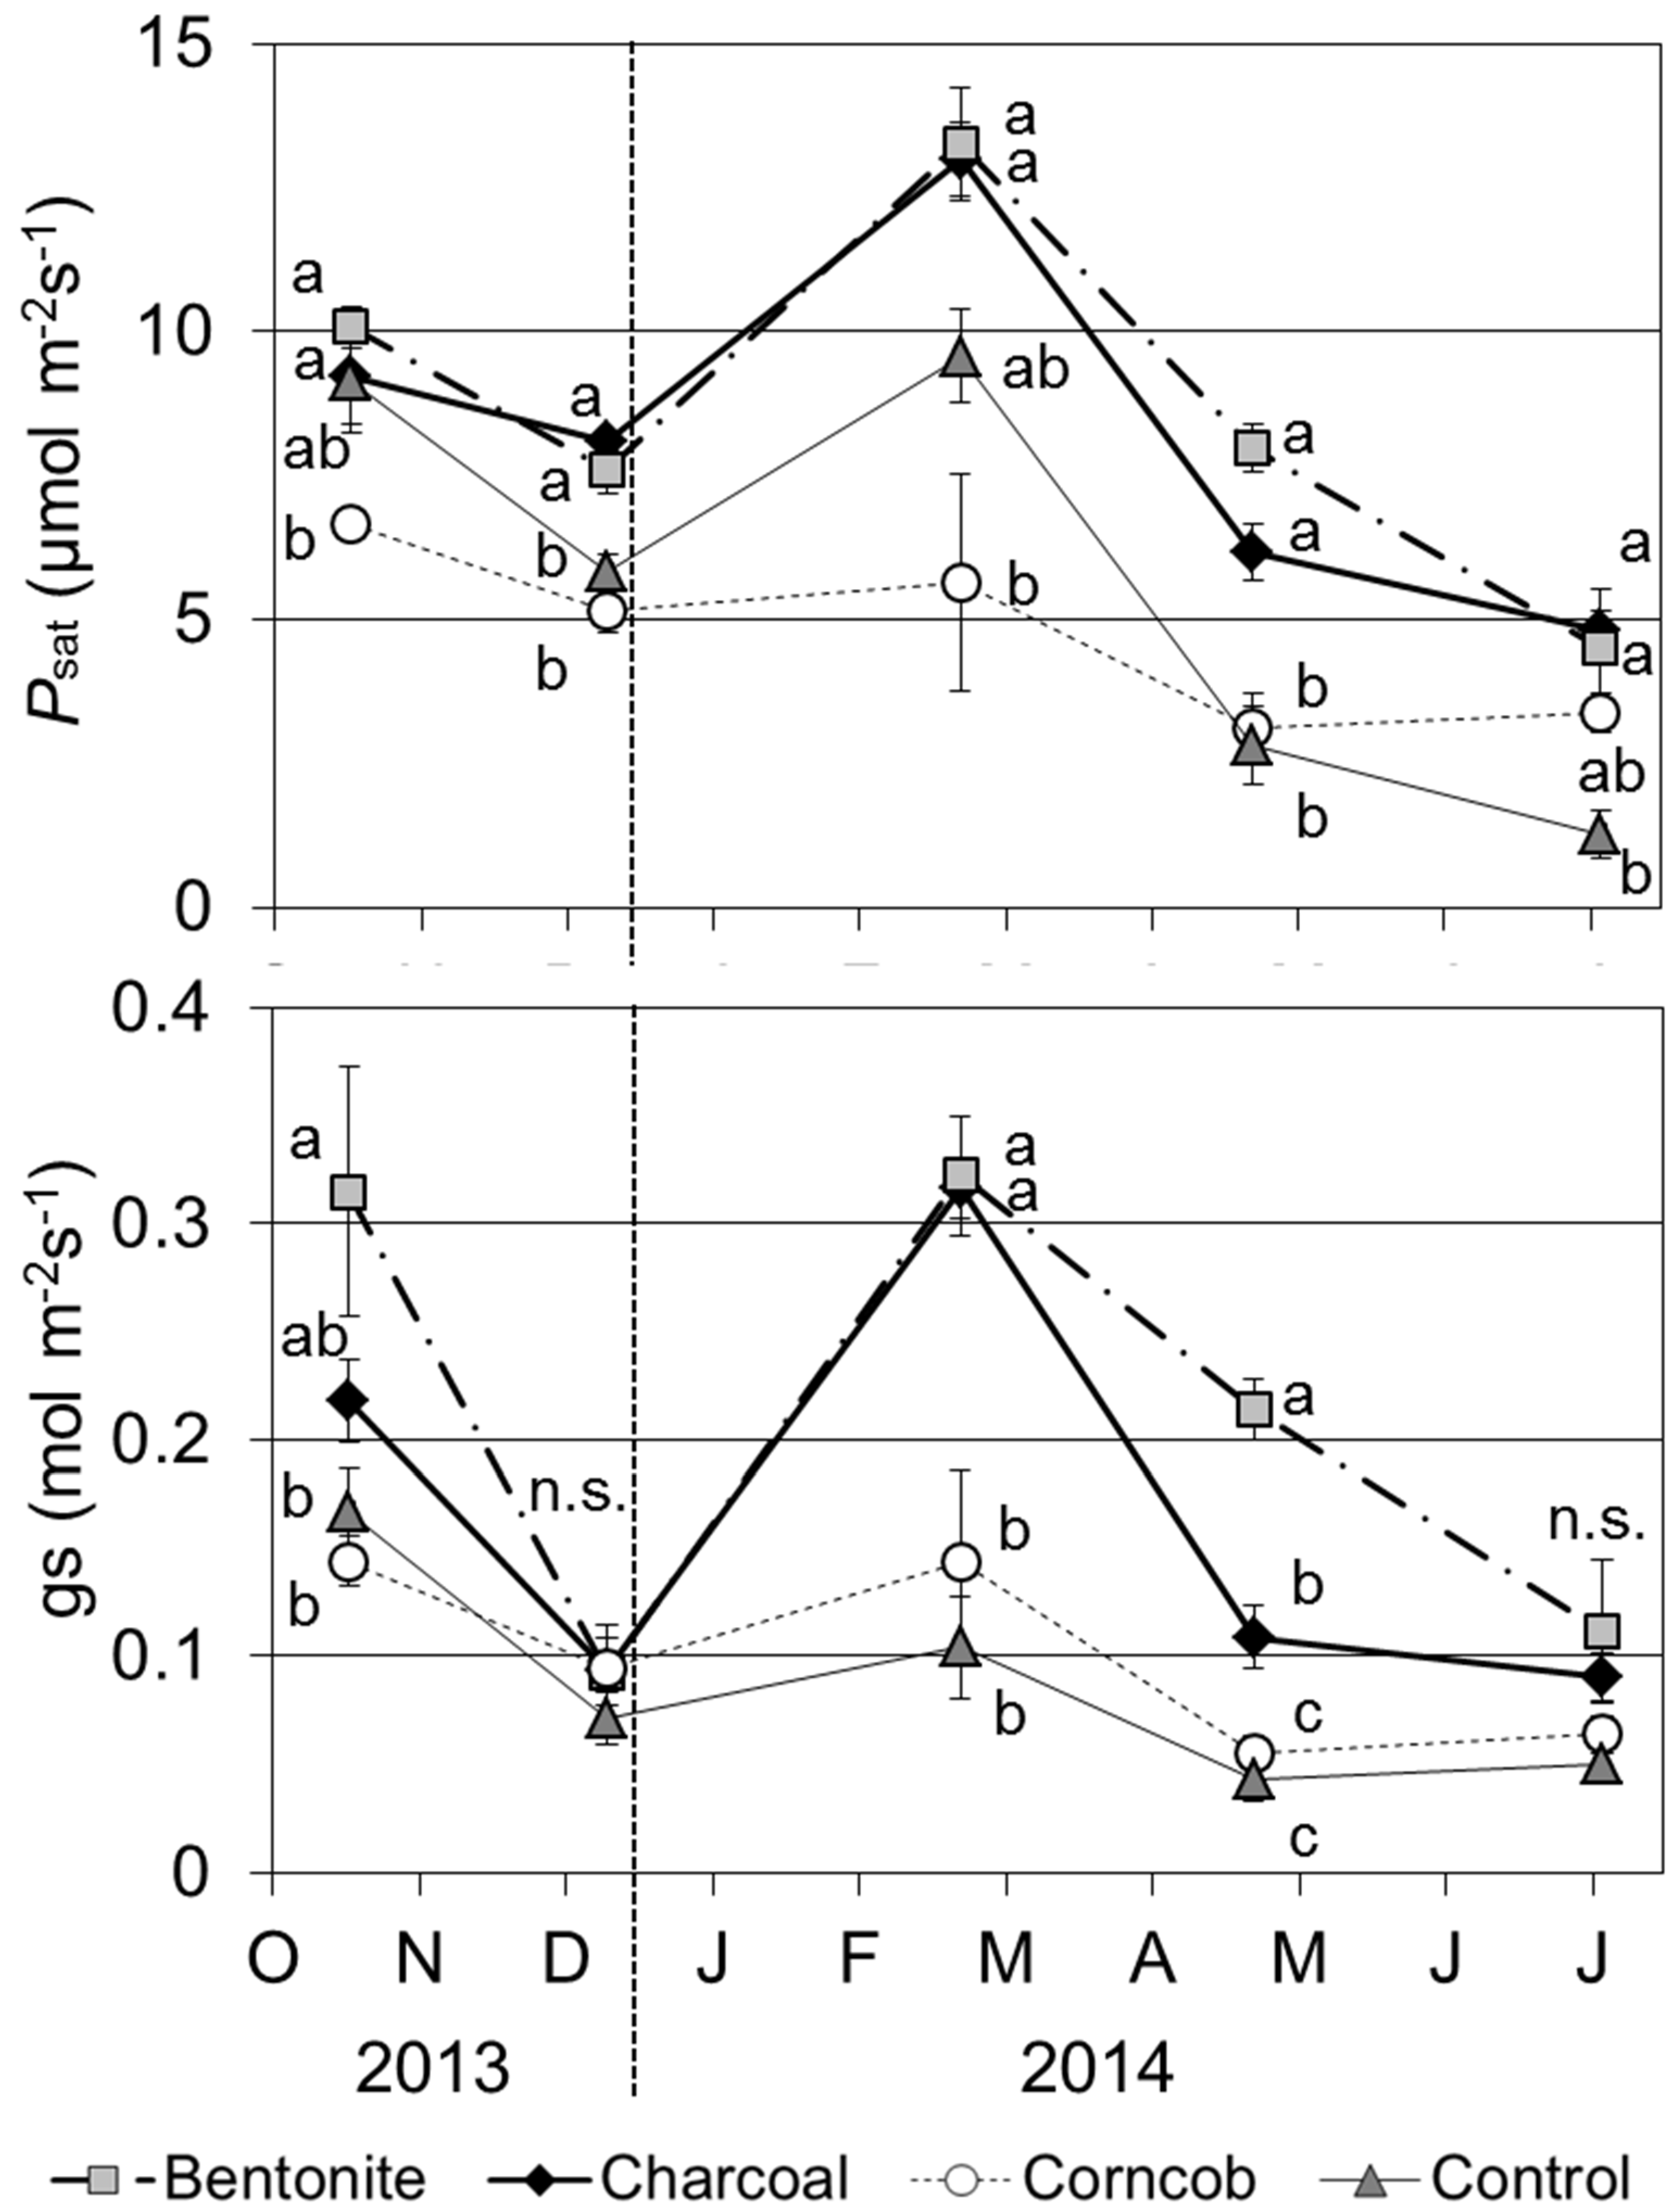
The
Psat was significantly higher for bentonite and charcoal treatments than for the corncob treatment at each time point (
Figure 6,
p < 0.05). The
Psat for the control treatment decreased drastically from April 2014. Comparing the five time points,
Psat in February 2014 was highest for bentonite, charcoal, and control treatments. In the corncob treatment,
Psat was highest in October 2013.
Figure 6.
Photosynthetic rate at light saturation (Psat) and stomatal conductance (gs) for teak seedlings grown in the four treatments (9–11 a.m., Mean ± SE, n = 4).
Figure 6.
Photosynthetic rate at light saturation (Psat) and stomatal conductance (gs) for teak seedlings grown in the four treatments (9–11 a.m., Mean ± SE, n = 4).
The stomatal conductance (gs) with the bentonite treatment was significantly higher than those for the corncob and control treatments in October 2013 and February and April 2014. In the charcoal treatment, gs in February was also high compared with those for the corncob and control treatments. The value of gs decreased in December 2013 and April 2014.
3.7. Leaf Water Potential
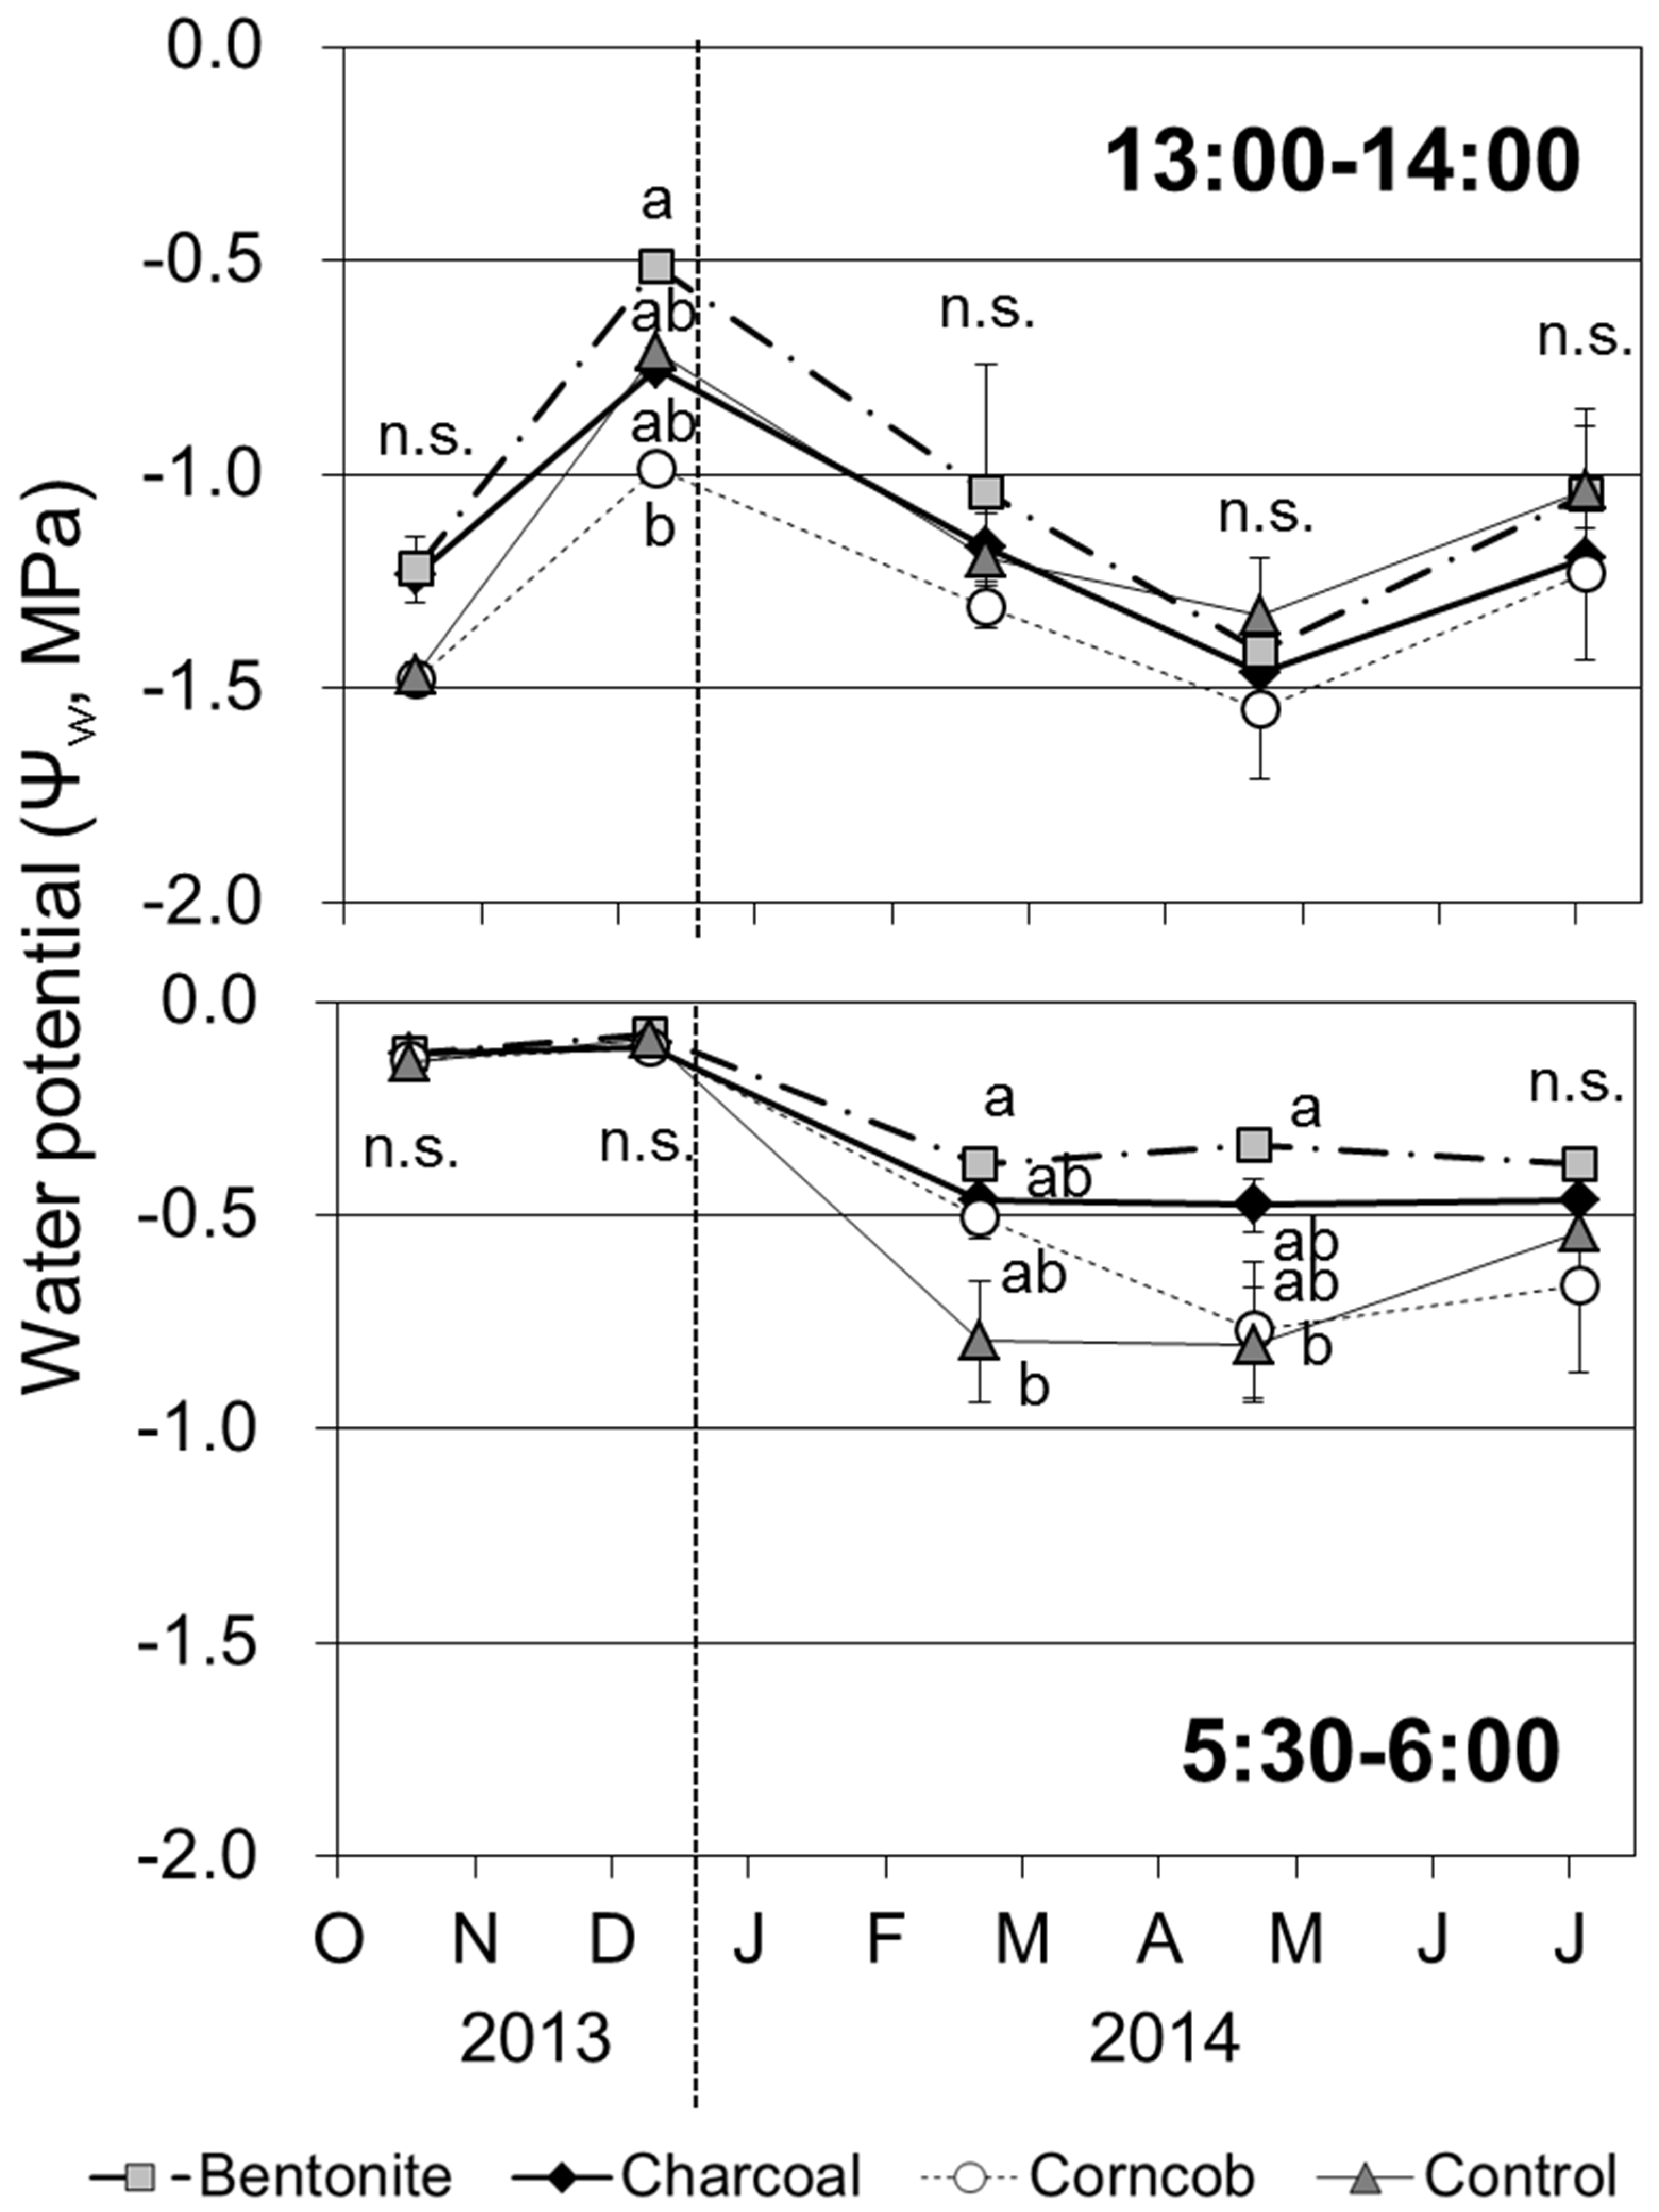
Leaf water potential in the afternoon was highest in December 2013 (
Figure 7). In contrast, leaf water potential decreased in April 2014, except for the control treatment. Comparing the four treatments, leaf water potential in December 2013 was significantly lower for the corncob treatment than those for the other treatments (
p < 0.05). At other time points, leaf water potential did not show a significant difference among the four treatments.
Figure 7.
Leaf water potential in the afternoon (1–2 p.m.) and predawn (5:30–6:00 a.m.) for teak seedlings grown in the four treatments (Mean ± SE, n = 4).
Figure 7.
Leaf water potential in the afternoon (1–2 p.m.) and predawn (5:30–6:00 a.m.) for teak seedlings grown in the four treatments (Mean ± SE, n = 4).
The predawn leaf water potential was −0.12 MPa in October and December 2013. The values of leaf water potential decreased in 2014, and in February and April 2014, the value was significantly lower for the control treatment than that for the bentonite treatment (p < 0.05).
3.8. Concentrations of Nitrogen and Chlorophyll, and LMA
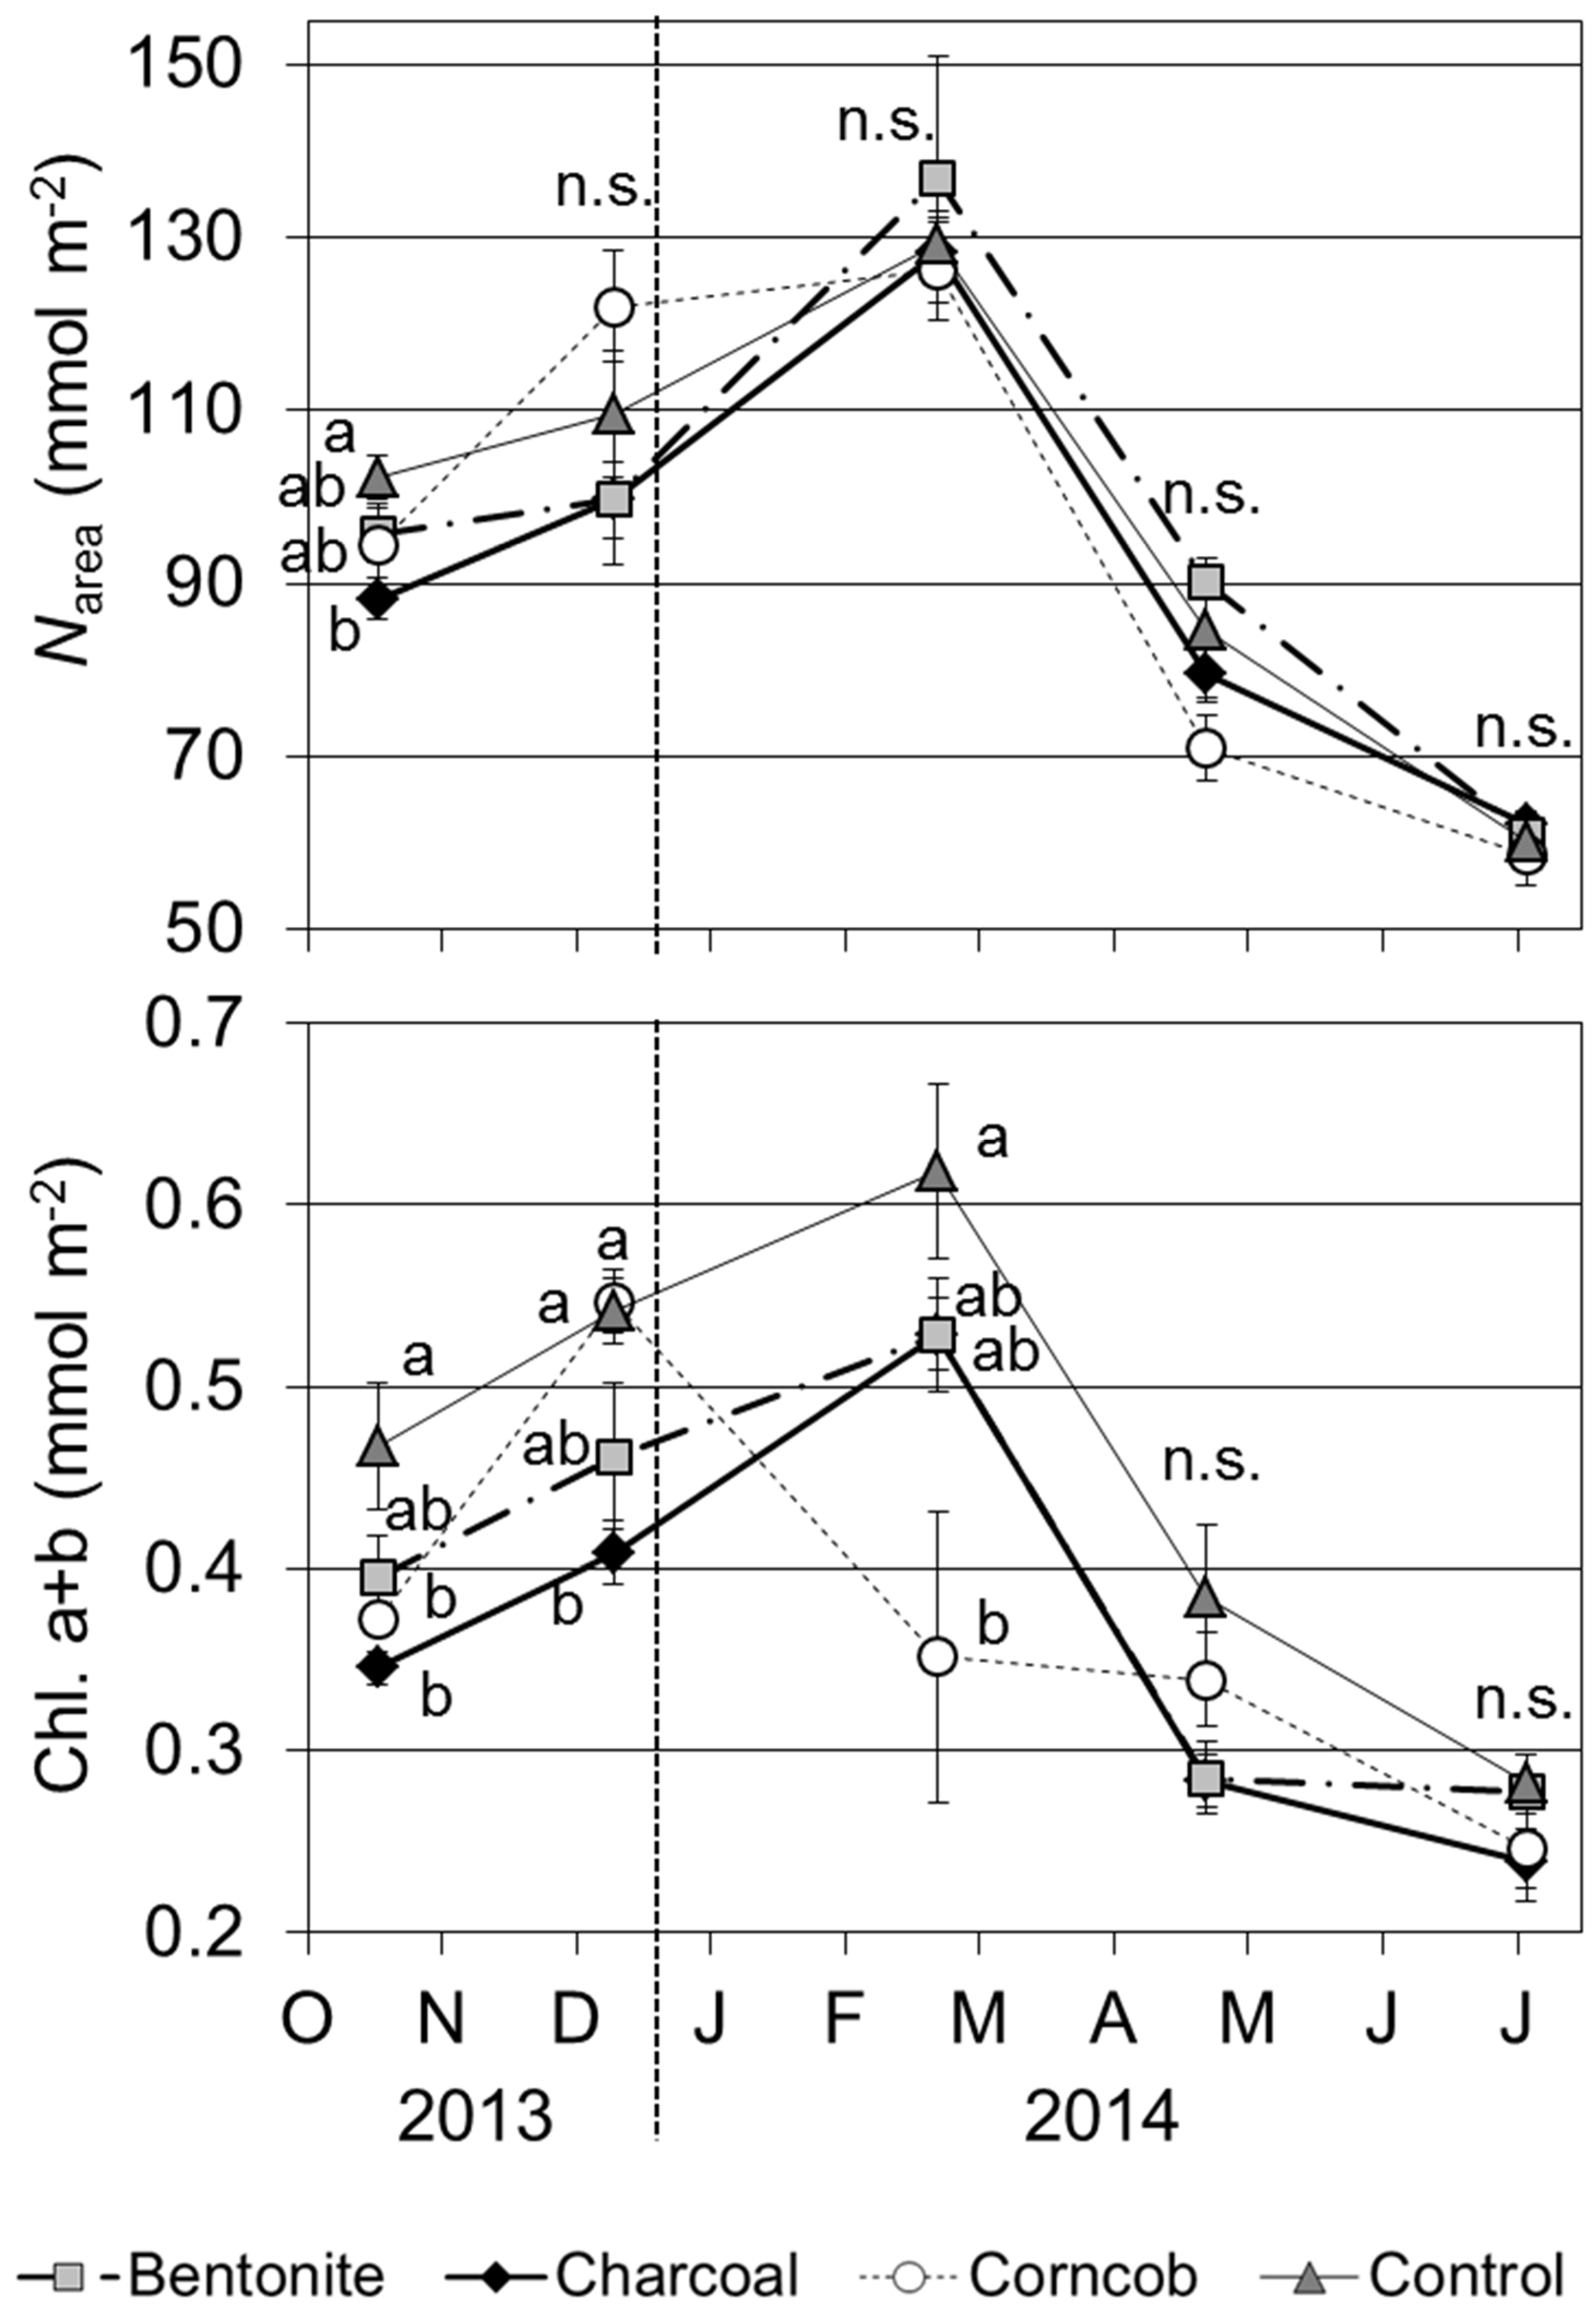
Narea showed the highest value in February 2014; however,
Narea decreased from April 2014 (
Figure 8). Compared the treatments,
Narea was significantly lower for the charcoal treatment than for the control treatment in October 2013 (
p < 0.05). At other time points, there were no significant differences among the four treatments.
Figure 8.
Concentrations of area-based nitrogen (Narea) and total chlorophyll (a + b) for teak seedlings grown in the four treatments (9–11 a.m., Mean ± SE, n = 4).
Figure 8.
Concentrations of area-based nitrogen (Narea) and total chlorophyll (a + b) for teak seedlings grown in the four treatments (9–11 a.m., Mean ± SE, n = 4).
The concentration of total chlorophyll was also highest in February 2014 for the bentonite, charcoal, and control treatments (
Figure 8). From April 2014, the concentrations of chlorophyll decreased for these three treatments. In the case of the corncob treatment, chlorophyll decreased from February 2014, and the value was significantly lower than the control treatment (
p < 0.05). In October and December 2013, the concentrations of chlorophyll were significantly lower for the charcoal treatment than the control treatment (
p < 0.05).
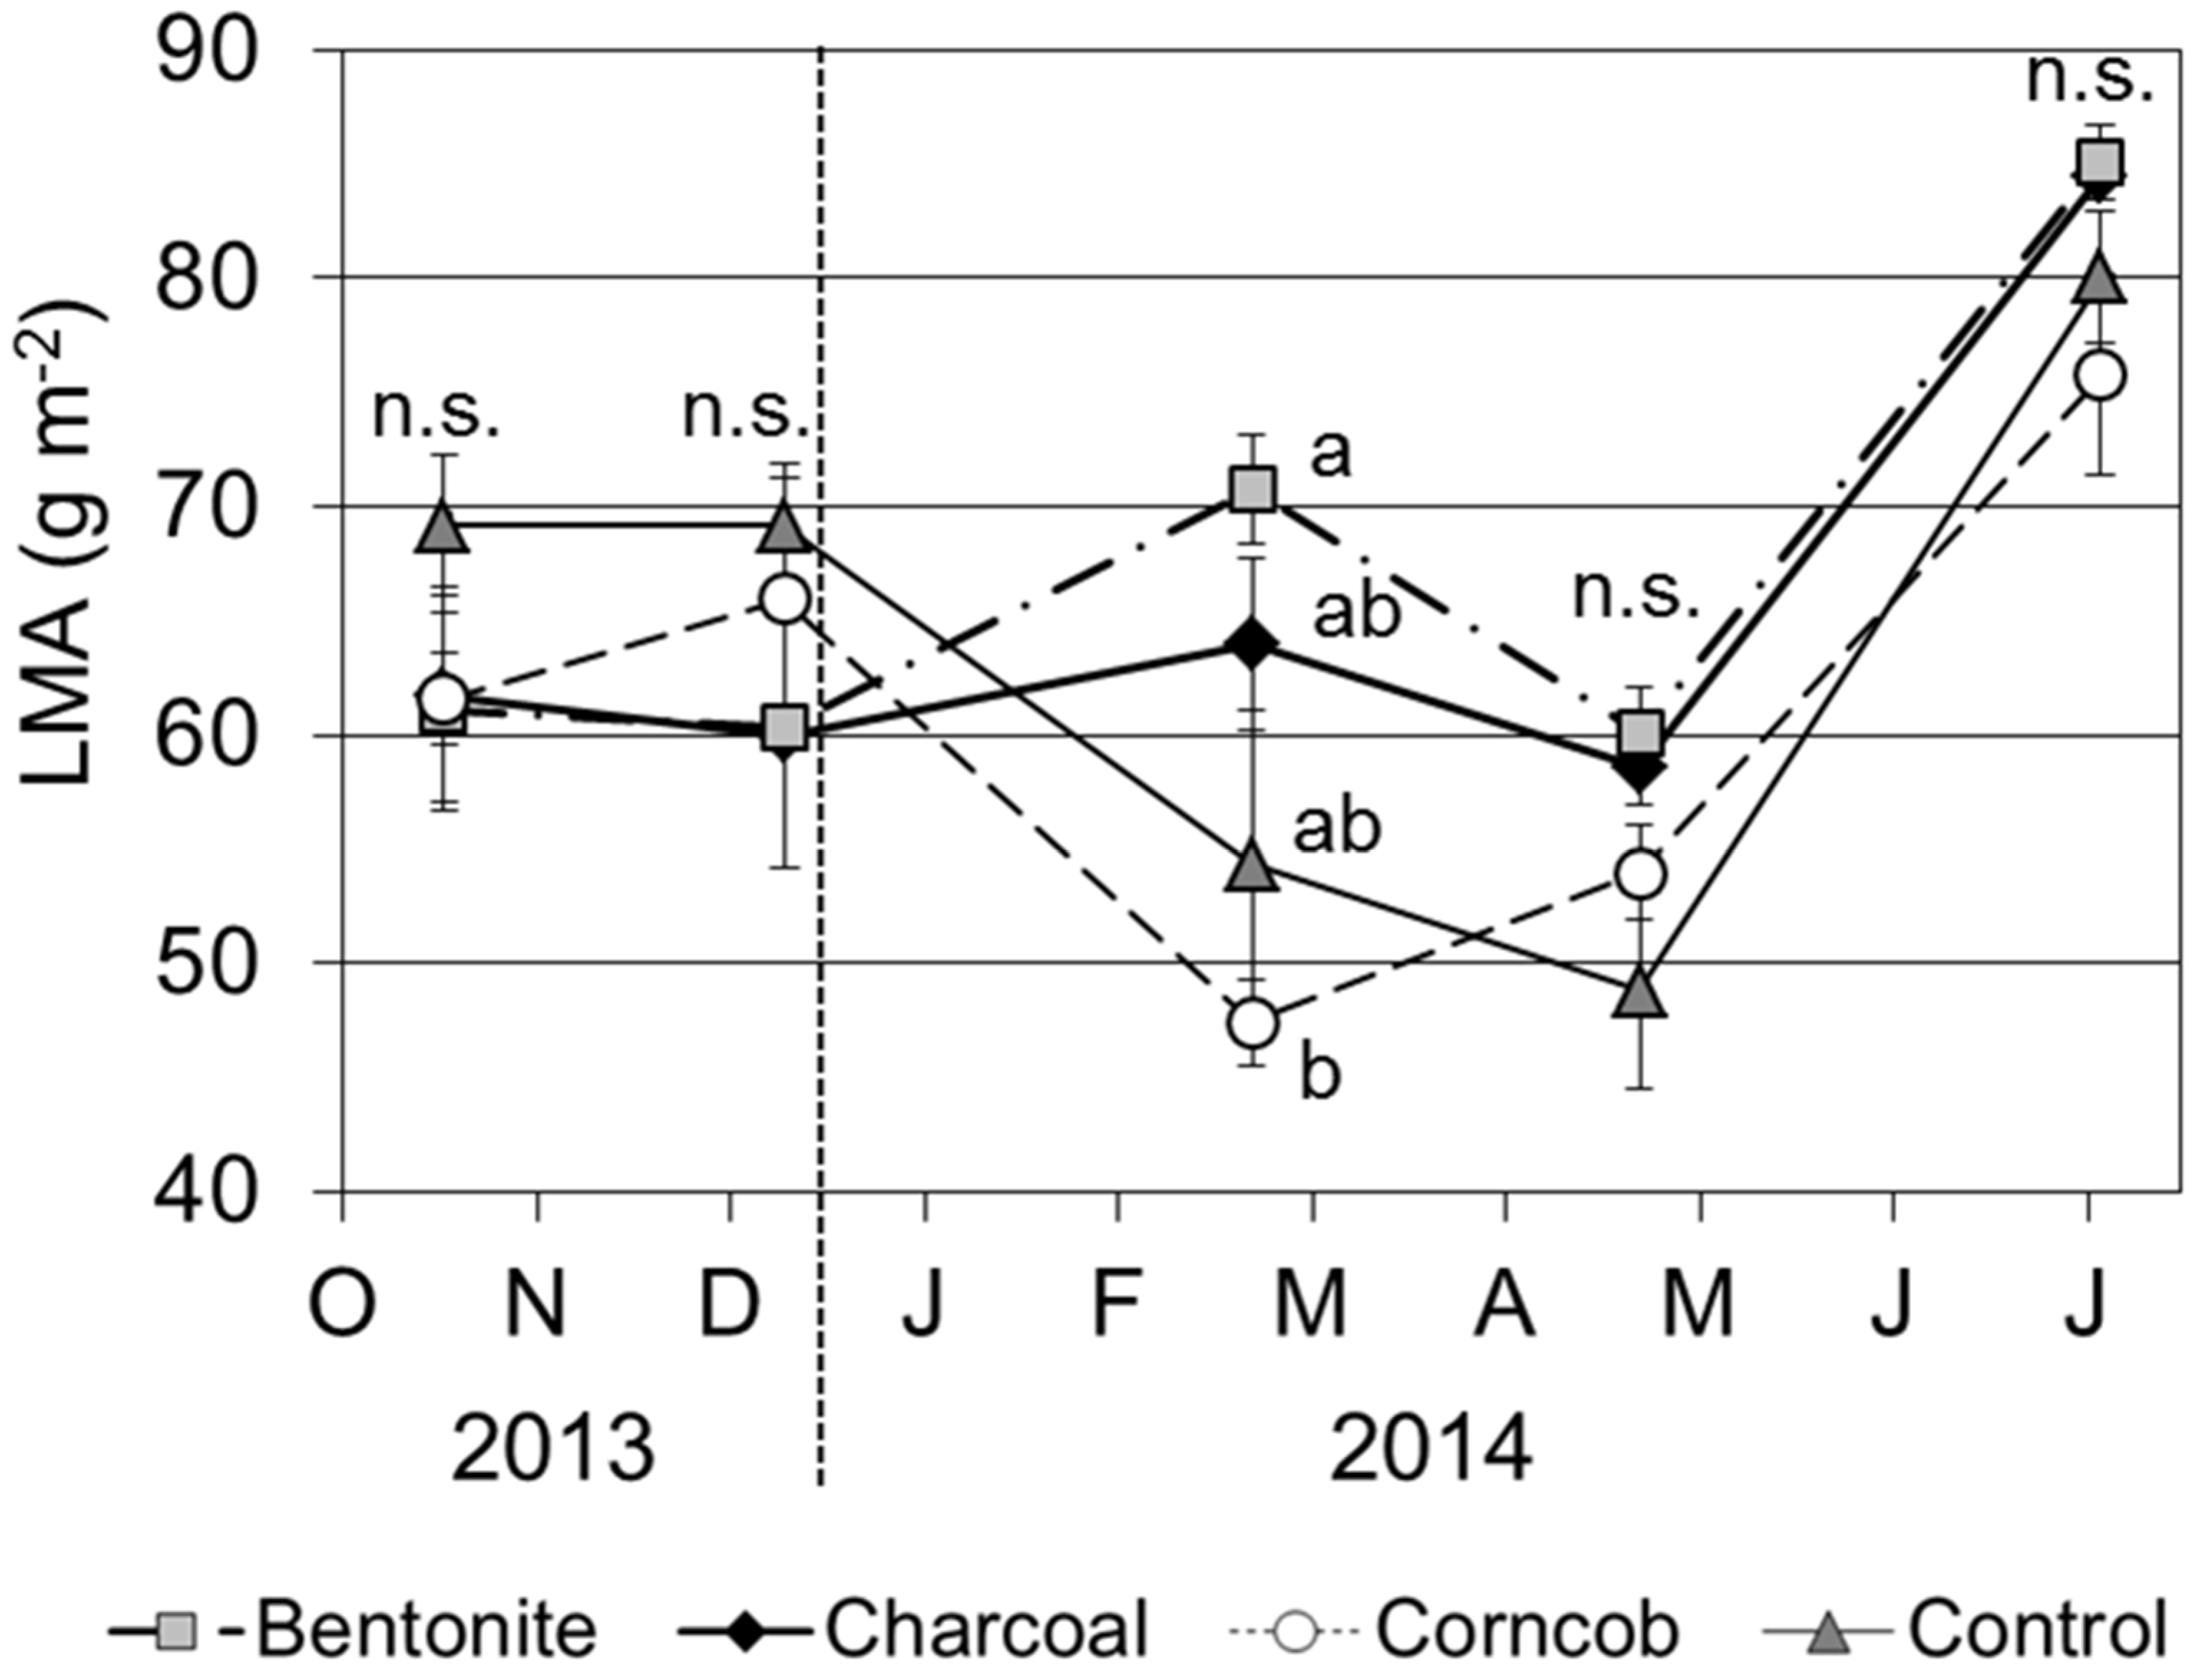
LMA was highest in July 2014 (
Figure 9). In the bentonite and charcoal treatments, LMA was 60 to 70 g·m
−2 until April 2015. In contrast, the corncob and control treatments showed decreased LMA in February 2014. Comparing the four treatments, LMA in February 2014 was significantly lower for the corncob treatment than that for the bentonite treatment (
p < 0.05).
Figure 9.
Leaf mass per area (LMA) for teak seedlings grown in the four treatments (Mean ± SE, n = 4).
Figure 9.
Leaf mass per area (LMA) for teak seedlings grown in the four treatments (Mean ± SE, n = 4).
3.9. Biomass of Teak Seedling
The dry masses of each organ in July 2014 increased for each treatment compared with those values in July 2013 (
Table 2). For the leaf dry mass, there were no significant differences among the four treatments. The dry mass of stems and branches was significantly larger for the charcoal treatment than for the corncob treatment (
p < 0.01). In addition, charcoal treatment resulted in significantly higher root dry mass compared with the other treatments (
p < 0.05). In contrast, root dry mass for the corncob treatment was significantly smaller than the other treatments (
p < 0.001). The root:shoot ratio was significantly lower for the corncob treatment compared with the other treatments (
p < 0.05).
Table 2.
Dry mass of each organ (leaf, stem and branch, and root) and root:shoot ratio for teak seedlings before transplantation (Mean ± SE, n = 10) and the end of the experiment (July 2014) grown with four treatments (Mean ± SE, n = 8). Different letters indicate significant differences among the four treatments calculated by Tukey’s test (p < 0.05).
| | Leaf | Stem and Branch | Root | Root:Shoot Ratio |
|---|
| July 2013 | 0.9 ± 0.1 | | 0.9 ± 0.1 | | 2.5 ± 0.2 | | 1.48 ± 0.14 | |
| July 2014 | | | | | | | | |
| Bentonite | 15.4 ± 0.6 | a | 6.9 ± 0.2 | ab | 24.4 ± 0.9 | b | 1.10 ± 0.06 | a |
| Charcoal | 15.7 ± 0.6 | a | 9.0 ± 0.9 | a | 29.2 ± 1.2 | a | 1.19 ± 0.03 | a |
| Corncob | 17.5 ± 1.5 | a | 6.2 ± 0.3 | b | 12.8 ± 1.3 | c | 0.58 ± 0.10 | b |
| Control | 17.4 ± 1.6 | a | 7.3 ± 0.6 | ab | 21.9 ± 1.1 | b | 0.97 ± 1.14 | a |
3.10. Concentration of Elements in Plant Organs
The concentrations of P in the leaves of teak seedlings were significantly higher for the charcoal and corncob treatments compared with the control treatment (
Table 3,
p < 0.05). In the charcoal treatment, the concentration of K was also significantly higher compared with the control treatment. For other elements in leaves, there were no significant differences among the four treatments (
p < 0.05).
Table 3.
Concentrations of elements (N, P, K, Ca, Mg, Al, and Fe; µmol·g−1 DM) in leaves and roots of teak seedlings grown in four treatments (Mean ± SE, n = 8).
Table 3.
Concentrations of elements (N, P, K, Ca, Mg, Al, and Fe; µmol·g−1 DM) in leaves and roots of teak seedlings grown in four treatments (Mean ± SE, n = 8).
| Elements | Leaf | Root |
|---|
| N | Bentonite | 746 ± 33 | a | 624 ± 23 | a |
| Charcoal | 723 ± 40 | a | 695 ± 38 | a |
| Corncob | 788 ± 42 | a | 633 ± 24 | a |
| Control | 764 ± 25 | a | 729 ± 23 | a |
| P | Bentonite | 272 ± 18 | ab | 170 ± 8 | b |
| Charcoal | 351 ± 22 | a | 209 ± 13 | a |
| Corncob | 324 ± 36 | a | 185 ± 12 | ab |
| Control | 209 ± 15 | b | 179 ± 4 | ab |
| K | Bentonite | 243 ± 19 | ab | 193 ± 10 | bc |
| Charcoal | 265 ± 21 | a | 222 ± 16 | ab |
| Corncob | 235 ± 21 | ab | 266 ± 14 | a |
| Control | 187 ± 16 | b | 154 ± 12 | c |
| Ca | Bentonite | 174 ± 12 | a | 332 ± 20 | a |
| Charcoal | 177 ± 12 | a | 379 ± 48 | a |
| Corncob | 174 ± 19 | a | 355 ± 30 | a |
| Control | 187 ± 11 | a | 372 ± 18 | a |
| Mg | Bentonite | 111 ± 5 | a | 166 ± 8 | ab |
| Charcoal | 123 ± 7 | a | 146 ± 9 | b |
| Corncob | 131 ± 15 | a | 168 ± 13 | ab |
| Control | 152 ± 13 | a | 201 ± 13 | a |
| Al | Bentonite | 2.52 ± 1.97 | a | 25.5 ± 4.2 | a |
| Charcoal | 6.33 ± 2.26 | a | 29.1 ± 4.5 | a |
| Corncob | 3.34 ± 1.45 | a | 2.2 ± 0.9 | b |
| Control | 0.77 ± 0.62 | a | 18.0 ± 3.7 | a |
| Fe | Bentonite | 2.18 ± 0.14 | a | 49.5 ± 4.9 | a |
| Charcoal | 2.60 ± 0.36 | a | 39.2 ± 5.3 | ab |
| Corncob | 2.39 ± 0.16 | a | 21.4 ± 2.7 | b |
| Control | 2.36 ± 0.51 | a | 38.0 ± 6.1 | ab |
In roots, the concentration of K was significantly higher for the charcoal and corncob treatments than the control treatment (p < 0.01). In the control treatment, the concentration of Mg was high, and significantly higher than for the charcoal treatment (p < 0.01). In contrast, the concentration of P in the bentonite treatment was significantly lower than for the charcoal treatment (p < 0.05). In the corncob treatment, the concentrations of Al and Fe were low compared with the other treatments.
4. Discussion
Based on the results of the water content before irrigation, the bentonite and charcoal treatments showed high values (
Figure 3). These materials probably have the ability to increase water holding capacity. In the bentonite treatment, the clay content was increased by 2% compared with the control treatment (
Table 1). Compared with other clay minerals, bentonite has a high liquid limit and high expansibility as a result of water absorbance [
53]. We considered that the slight addition of bentonite clay probably absorbed more water, and as a result the water content in the soil increased. This trend was obvious from May 2014 (
Figure 3), when precipitation was increased (
Figure 1). In the case of charcoal, we could not confirm an obvious change in soil texture (
Table 1). Charcoal contains vast numbers of pores, and water can be stored in these pores [
30,
31,
54]. In the charcoal treatment, pores in charcoal can store water, thereby increasing water content in the soil. In corncob, water content was low in October and November 2013, but at its highest in January 2014 (
Figure 3). This change in water content may be attributed to decomposition of the corncobs. In general, the addition of organic amendments to soil shows an increase of water holding capacity, porosity and surface area [
55]. However, the increase of water holding capacity of the corncob was probably inferior to charcoal and bentonite based on the results of the soil water content (
Figure 3).
Compared with the bentonite and charcoal treatments, trends in
Psat and leaf water potential in the afternoon and predawn were similar (
Figure 6 and
Figure 7). Teak seedlings of these treatments could recover water during the night. Thus, teak seedlings grown in the bentonite and charcoal treatments did not show the symptom of water deficiency. However, teak seedlings in the bentonite treatment did not show large values of tree height, basal diameter, or biomass of plant organs (
Figure 4,
Table 2). Although the teak seedlings did not suffer from drought stress, this was not reflected in obvious growth acceleration.
Meanwhile, the charcoal treatment showed large root biomass in July 2014 (
Table 2). Of the differences between bentonite and charcoal treatments, the pH value and the concentrations of N, Ca, and K were higher for the charcoal treatment than those for the bentonite treatment (
Table 1). However, the concentrations of N, Ca, and K in plant organs did not show significant differences between the bentonite and charcoal treatments (
Figure 8,
Table 3). Thus, soil pH and uptakes of N, Ca, and K are not the main factors that affect the differences of root growth. For other nutrient parameters, the concentration of P in roots was significantly higher in the charcoal treatment than in the bentonite treatment (
Table 3). However, the concentration of P in soils showed no significant difference between the charcoal and bentonite treatments (
Table 1). In the case of teak, uptake of P is related to symbiosis with arbuscular mycorrhizal fungi, and their inoculation accelerates the uptake of P [
56,
57]. The presence of charcoal promotes infection by arbuscular mycorrhizal fungi [
58,
59] and root growth in woody species [
60,
61]. We consider that the presence of charcoal accelerated root growth in teak seedlings. In addition, there is a possibility that teak seedlings in the charcoal treatment may have increased mycorrhizal colonization, and as a result the uptake of P was accelerated.
Compared with bentonite and charcoal, the corncob treatment showed negative effects on the growth of teak. Tree height, basal diameter, and leaf production were suppressed for teak seedlings in the corncob treatment until February 2014 (
Figure 4 and
Figure 5). In addition, root dry mass of the teak seedlings in July 2014 was smaller for the corncob treatment than those of other treatments (
Table 2). One of the causes was considered to be low photosynthetic productivity;
Psat and gs were both low up to April 2014 (
Figure 6). Soil water content in the corncob treatment was lower than in other treatments (
Figure 3), and as a result the stomata of teak leaves were easy to close to prevent water loss by transpiration. The photosynthetic rate was probably suppressed by decreased CO
2 uptake caused by the closed stomata. Moreover, the concentration of chlorophyll in leaves in the corncob treatment was low in February 2014 (
Figure 8). In general, chlorophyll concentration is decreased by strong photoinhibition [
62,
63], and photoinhibition occurs readily in thin leaves [
64]. The thin leaves in the corncob treatment in February 2014 (
Figure 9) probably suffered from photoinhibition due to strong sunshine; as a result, the concentration of chlorophyll decreased.
Growth in the corncob treatment recovered from April 2014 (
Figure 4 and
Figure 5). In seedlings in the corncob treatment at the end of experiment, leaf dry mass was not significantly lower than those of the other treatments (
Table 2). It seems that supply of nutrients was probably affected by the increase in leaf dry mass. Indeed, the concentrations of P in leaves and K in roots were higher than those of the control treatment (
Table 3). Corncob contains little in terms of nutrients [
37], and these nutrients may be available only upon decomposition of the corncob. Moreover, the concentrations of Al and Fe in the roots in the corncob treatment were lower than those of the other treatments (
Table 3). A previous study showed that the addition of corncob had the capacity to suppress the uptake of Al and accelerate the uptake of P [
37]. Recovery of growth in teak seedlings in the corncob treatment may be concerned with an improvement in nutrient uptake due to multiple factors.
Regarding the growth traits of teak seedlings in the control treatment, the predawn leaf water potential of leaves was low (
Figure 7), indicating that teak leaves in the control treatment could not recover water during the night.
Comparing our results with the literature, when the growth of teak seedlings was suppressed drastically, the value of the root:shoot ratio increased over 1.0 [
10,
19,
21,
65]. In the present study, the root:shoot ratios were over 1.0 for the bentonite and charcoal treatments (
Table 2). We considered that teak seedlings in bentonite and charcoal suffered suppressed growth, and one of the causes of this was N deficiency. The
Narea of each treatment decreased from April 2014 (
Figure 8) when leaf production increased (
Figure 5). The concentration of N in leaves at the end of the experiment (average, 755 µmol·g
−1) indicated N deficiency (<857 µmol·g
−1) [
14]. In contrast, the concentration of P in leaves at this time (average, 289 µmol·g
−1) was much higher and did not indicate any deficiency (<32 µmol·g
−1) [
14]. Thus, sandy soil was considered as a rather infertile environment, especially for N. In addition,
Psat, gs, and chlorophyll concentrations were also lower from April 2014 (
Figure 6 and
Figure 8). The photosynthetic rate and chlorophyll concentration show positive correlations with the concentration of N [
19,
43,
44,
45,
66], and these decreases were related to decreased N in leaves. In terms of stomatal conductance, a leaf suffering from N deficiency can readily suffer from a decrease in leaf water potential [
67]. Thus, N deficiency negatively affects physiological parameters in teak seedlings. Meanwhile, the concentration of N in leaves was a high value until February 2014 (
Figure 8). The original soil contained with each seedling had a high concentration of N (
Table 1), and it seems that the teak seedlings could absorb N from the original soil, and its supply was enough until February 2014.
Despite the N deficiency, we confirmed that teak seedlings were able to produce large numbers of leaves from April to July 2014 (
Figure 5). In teak, Ca is also important for leaf production, and Ca deficiency suppresses leaf dry mass [
20,
21]. Our results showed that the concentration of Ca in leaves (average, 178 µmol·g
−1) was higher than that in the deficiency level (<138 µmol·g
−1) [
14]. Teak seedlings potted on sandy soil probably accelerated leaf production through the supply of Ca.
In terms of specific growth traits of teak, leaf longevity was quite short (average, 99 days) and leaf turnover was high. Leaf longevity in tropical deciduous tree is three to 12 months [
68,
69], and the teak seedling is categorized as a species with short leaf longevity. In addition,
Psat and gs in December 2013 were low despite the high
Narea (
Figure 6 and
Figure 8). The date of measurement of
Psat showed that the minimum temperature was 11 °C in the morning. In general, teak shows a range of optimum temperature between 15 and 40 °C [
2]. In the case of the rubber tree, chilling stress was suffered below 10 °C, and
Psat and gs decreased at this temperature [
70]. There is a possibility that the leaves of the teak seedlings in December 2013 were suffering from chilling stress, and as a result,
Psat and gs could not recover in the morning.


 ,
, 

