
Attribution Analyses of Impacts of Environmental Changes on Streamflow and Sediment Load in a Mountainous Basin, Vietnam

 ,
,
Abstract
:1. Introduction
2. Study Area and Data Description
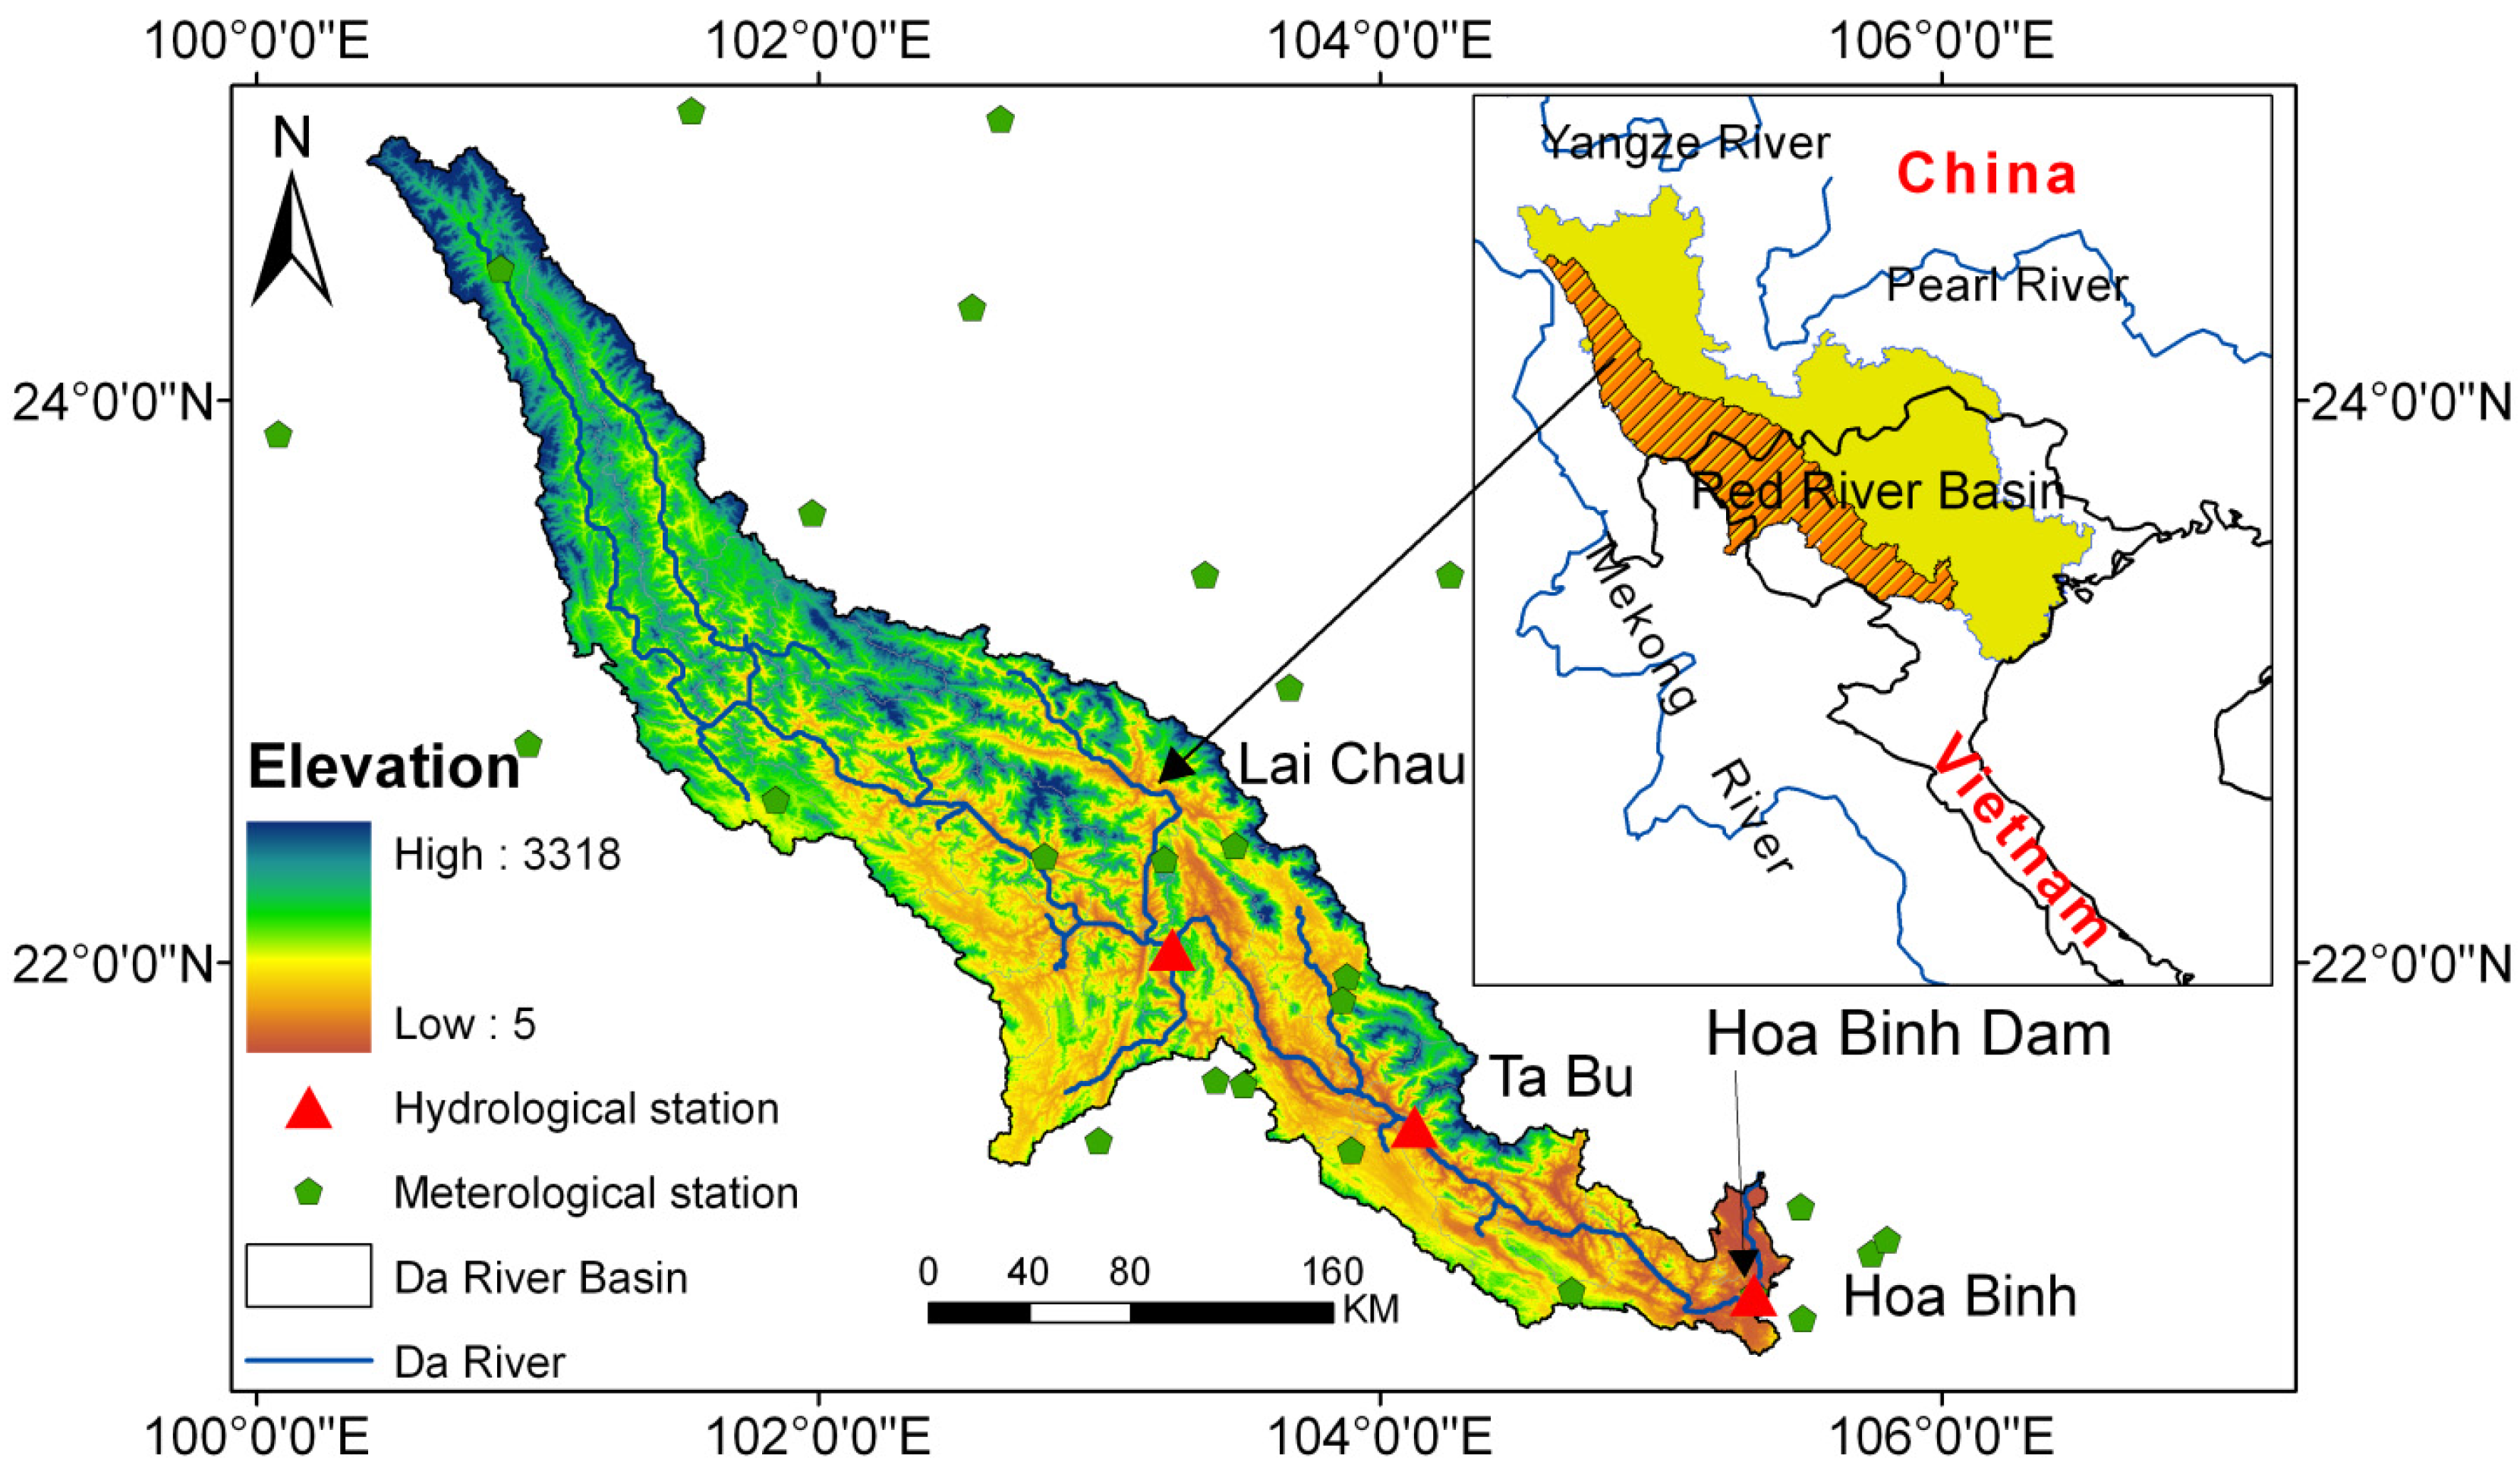
2.1. Study Area

2.2. Dataset
3. Methodology
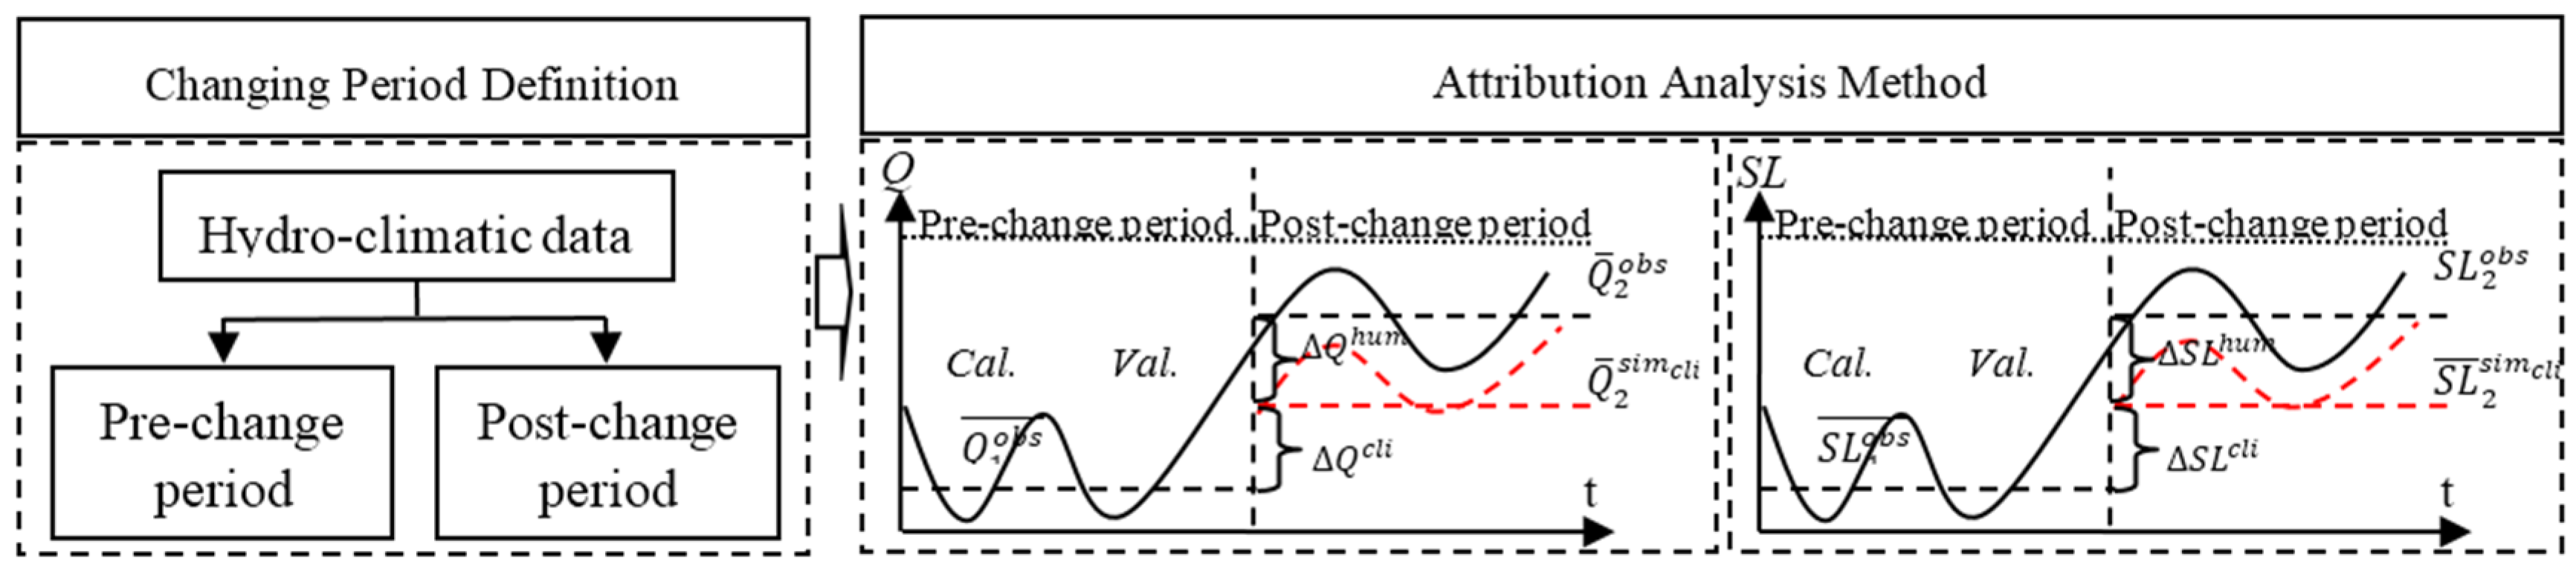
3.1. Determination of Period with Human Distubances
3.2. Analysis Method


| Data | Temporal Scale | Time Span | Spatial Scale | Data Source |
|---|---|---|---|---|
| Sreamflow | Monthly | 1988–2004 | Point | Lai Chau station |
| Sediment flow | Monthly | 1988–2004 | Point | Lai Chau station |
| CO2 | Annual | 1959–2014 | Point | NOAA/ESRL |
| LAI/NDVI | Monthly | 1982–2006 | Grid (8 km) | AVHRR-GIMMS(LAI3g) |
| Precipitation | Daily | 1951–2007 | Grid (0.25°) | APHRODITE‘s Water Resources Project |
| Average Temp | Daily | 1951–2007 | Grid (0.25°) | Same as above |
| Max & Min Temp | Monthly | 1901–2009 | Grid (0.5°) | Climatic Research Unit |
| DEM | Grid (1 km) | GTOPO30 (USGS) | ||
| Soil | 2000 | Grid (1 km) | FAO-UNESCO | |
| Land Cover | 1992 | Grid (1 km) | USGS |
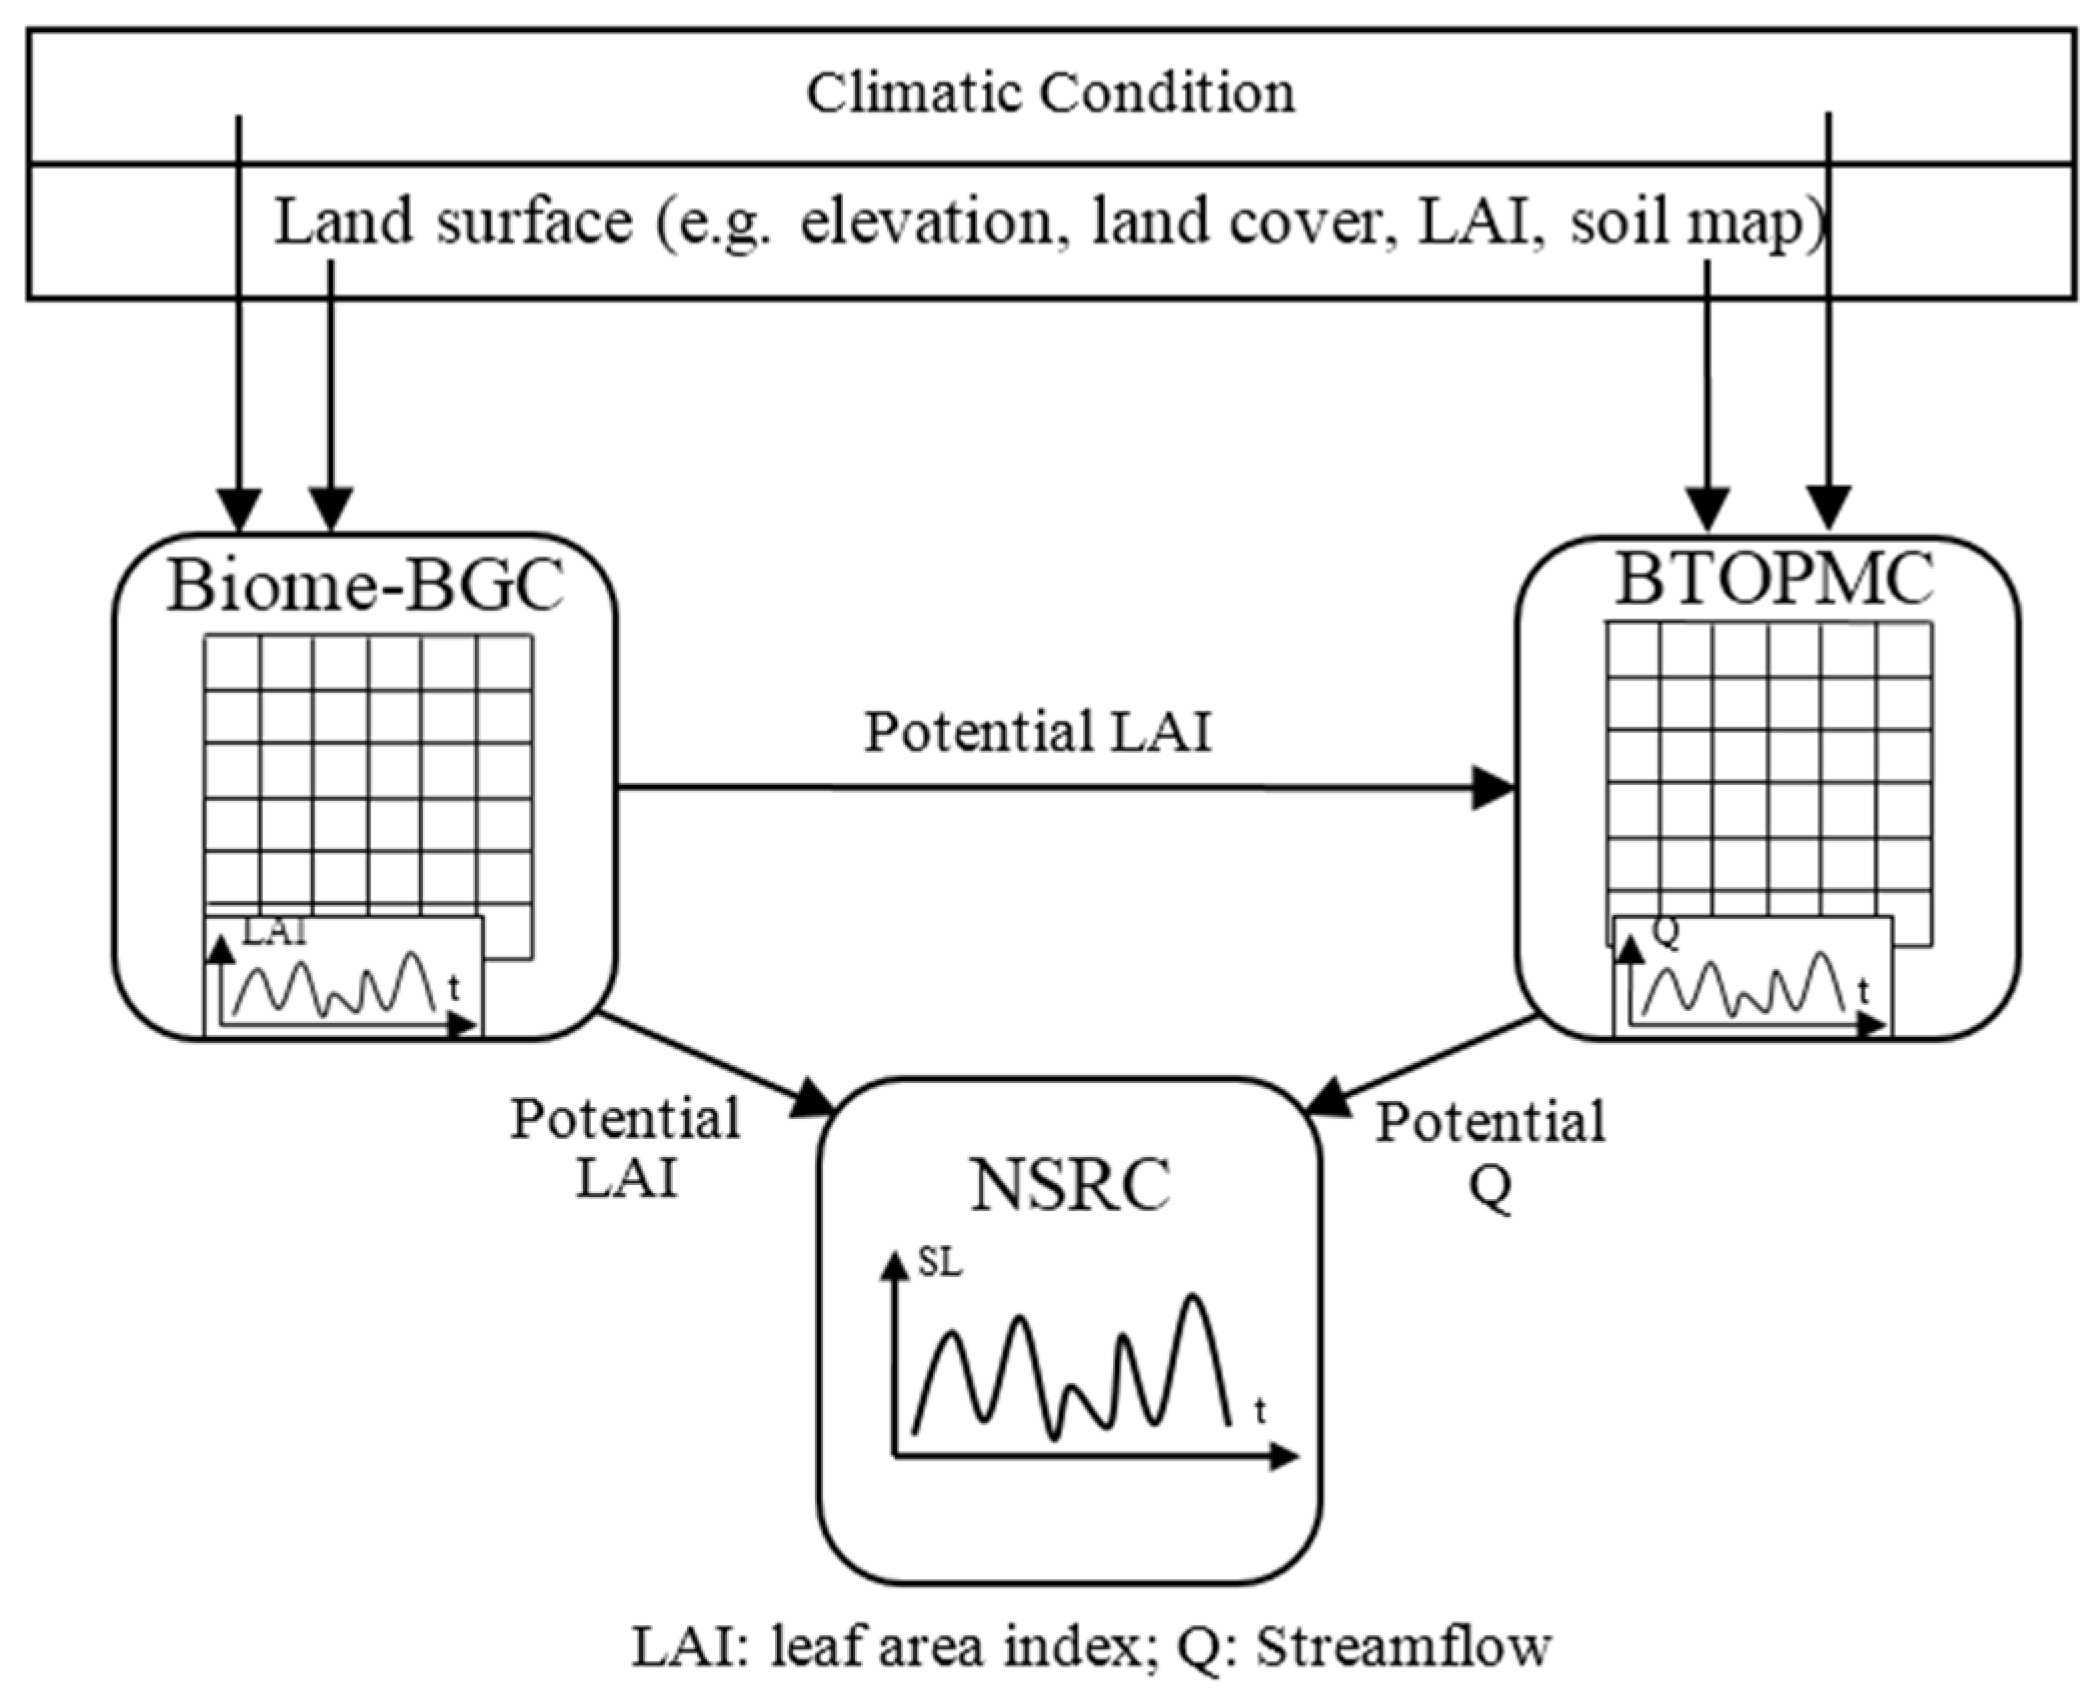
3.2.1. Hydrological Model
3.2.2. Ecological Model
3.2.3. New Sediment Rating Curve
4. Results and Discussion
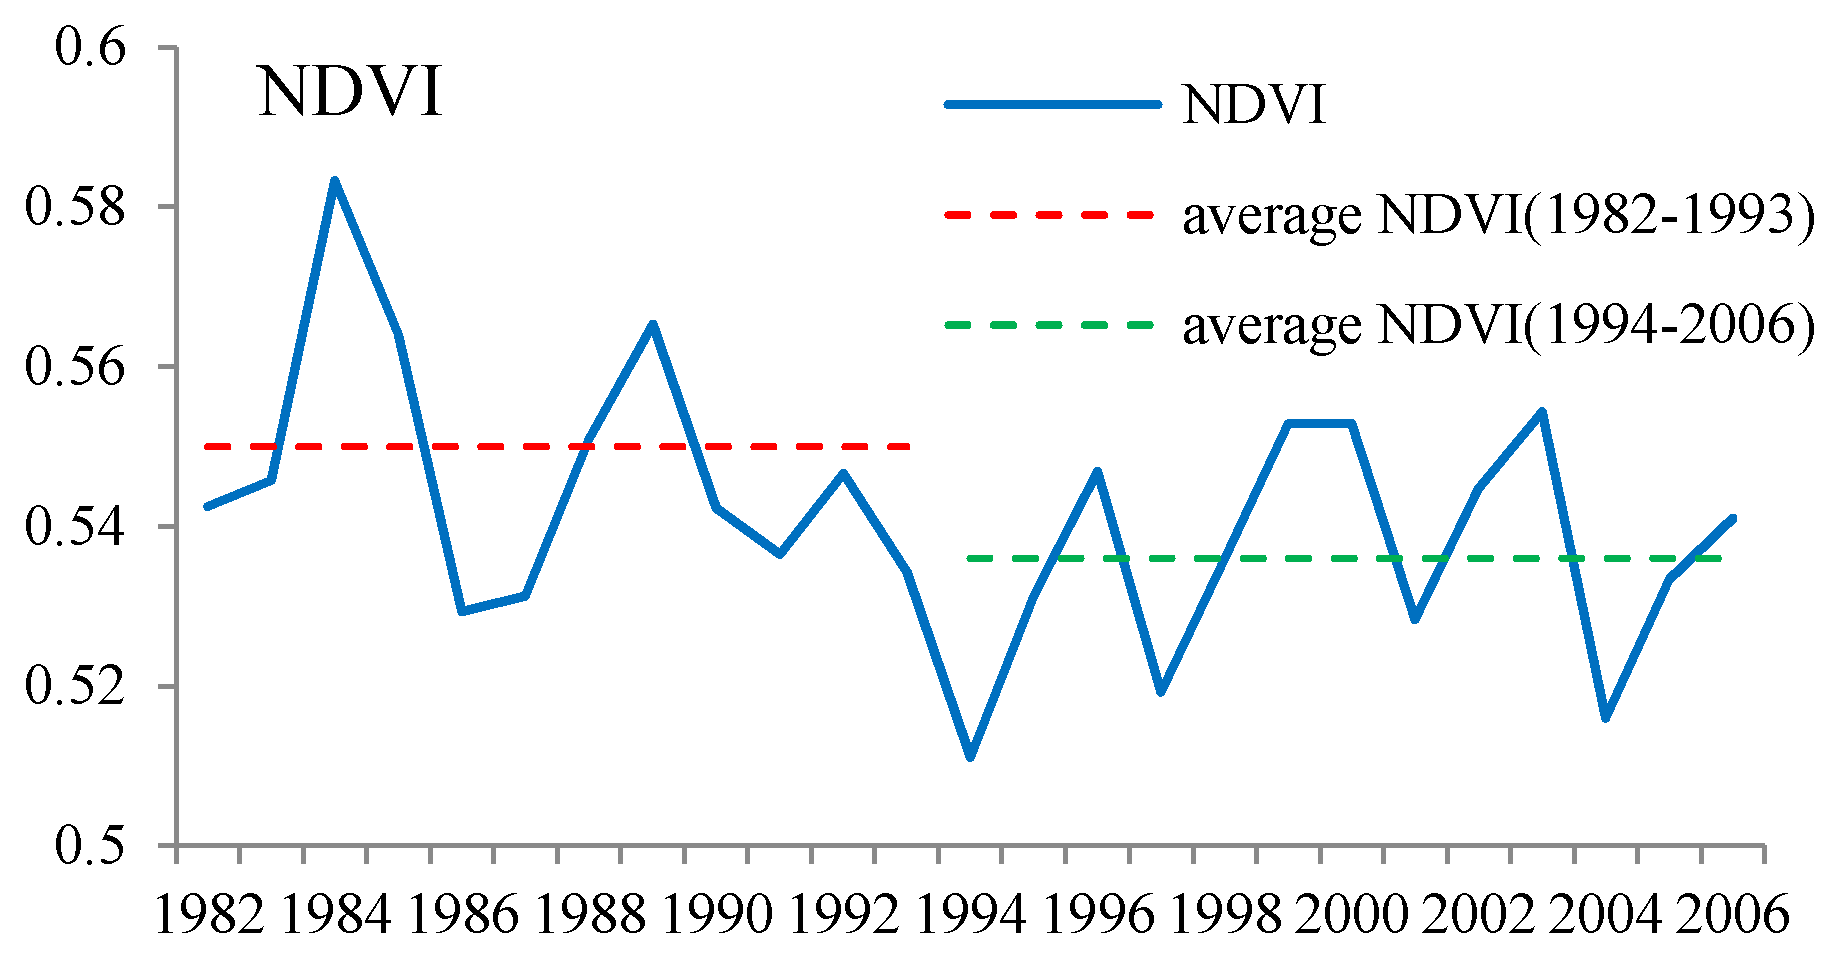
4.1. Determination of Time Period with Human Distubances
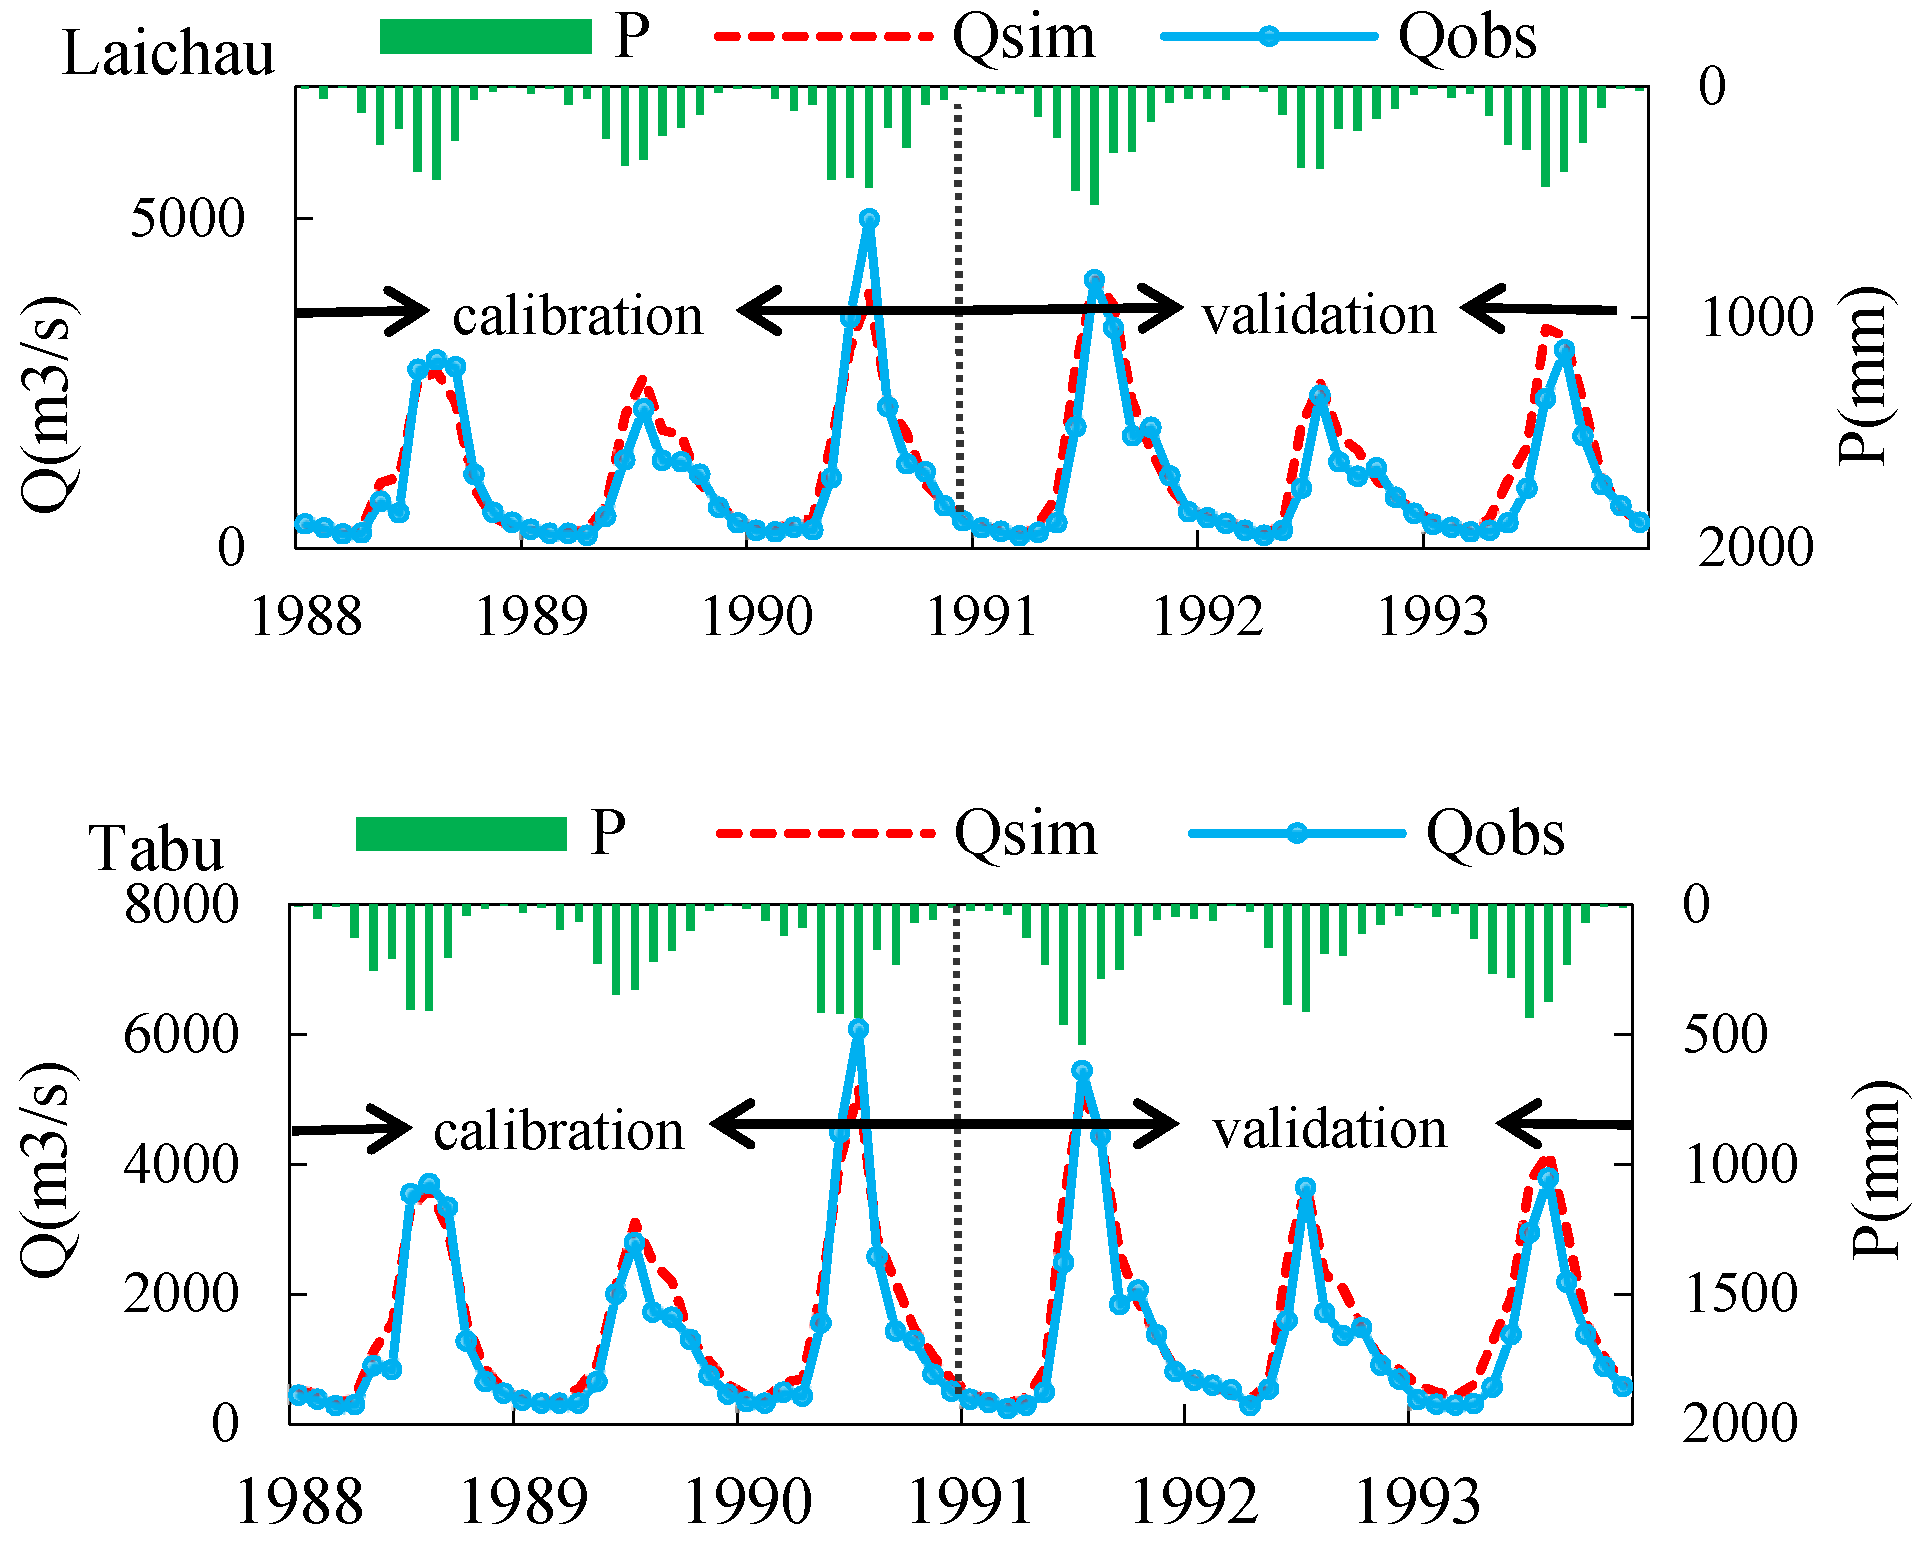
4.2. Hydrological Model and NSRC Model Simulation
| Laichau | Tabu | |||
|---|---|---|---|---|
| Calibration | Validation | Calibration | Validation | |
| R2 | 0.92 | 0.88 | 0.94 | 0.89 |
| NSE | 0.93 | 0.89 | 0.90 | 0.87 |
| MAE(mm) | 3.76 | 4.49 | 2.96 | 3.71 |
| PBIAS (%) | 0.37 | 0.41 | 0.26 | 0.27 |

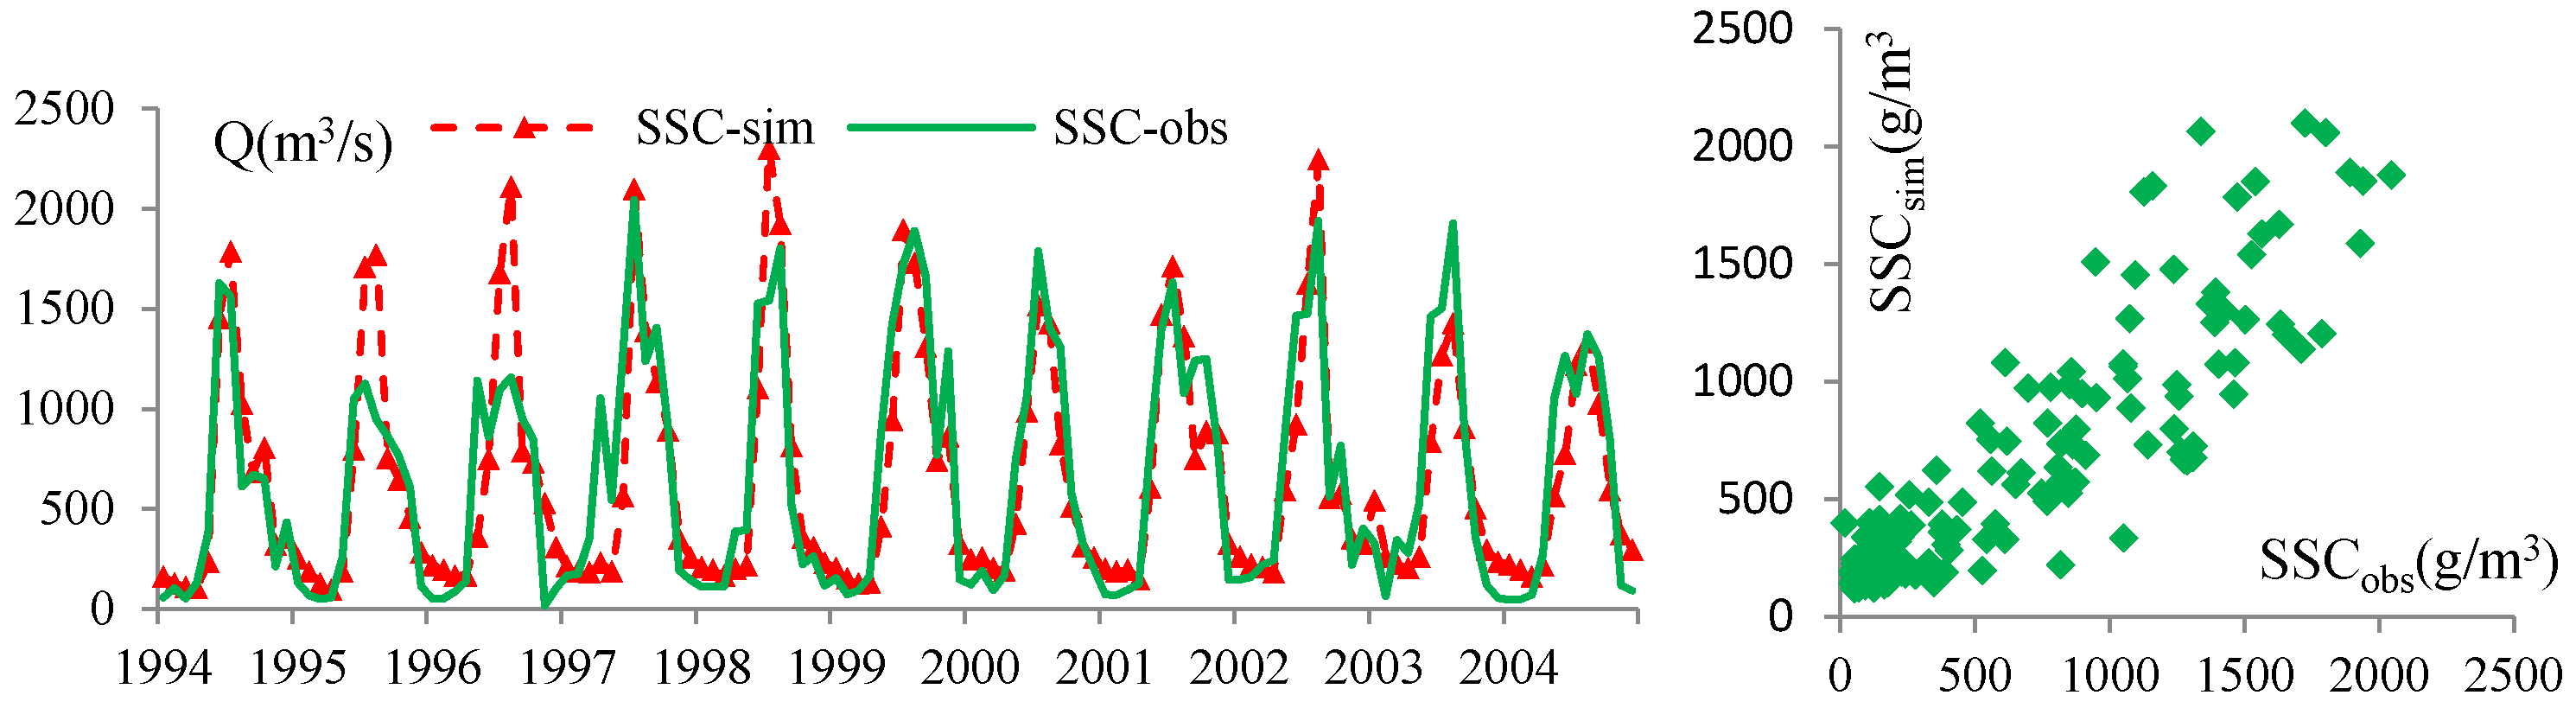
| Catchment | NSE | MAE (g/m3) | PBIAS (%) |
|---|---|---|---|
| Laichau | 0.86 | 3.21 | 0.634 |
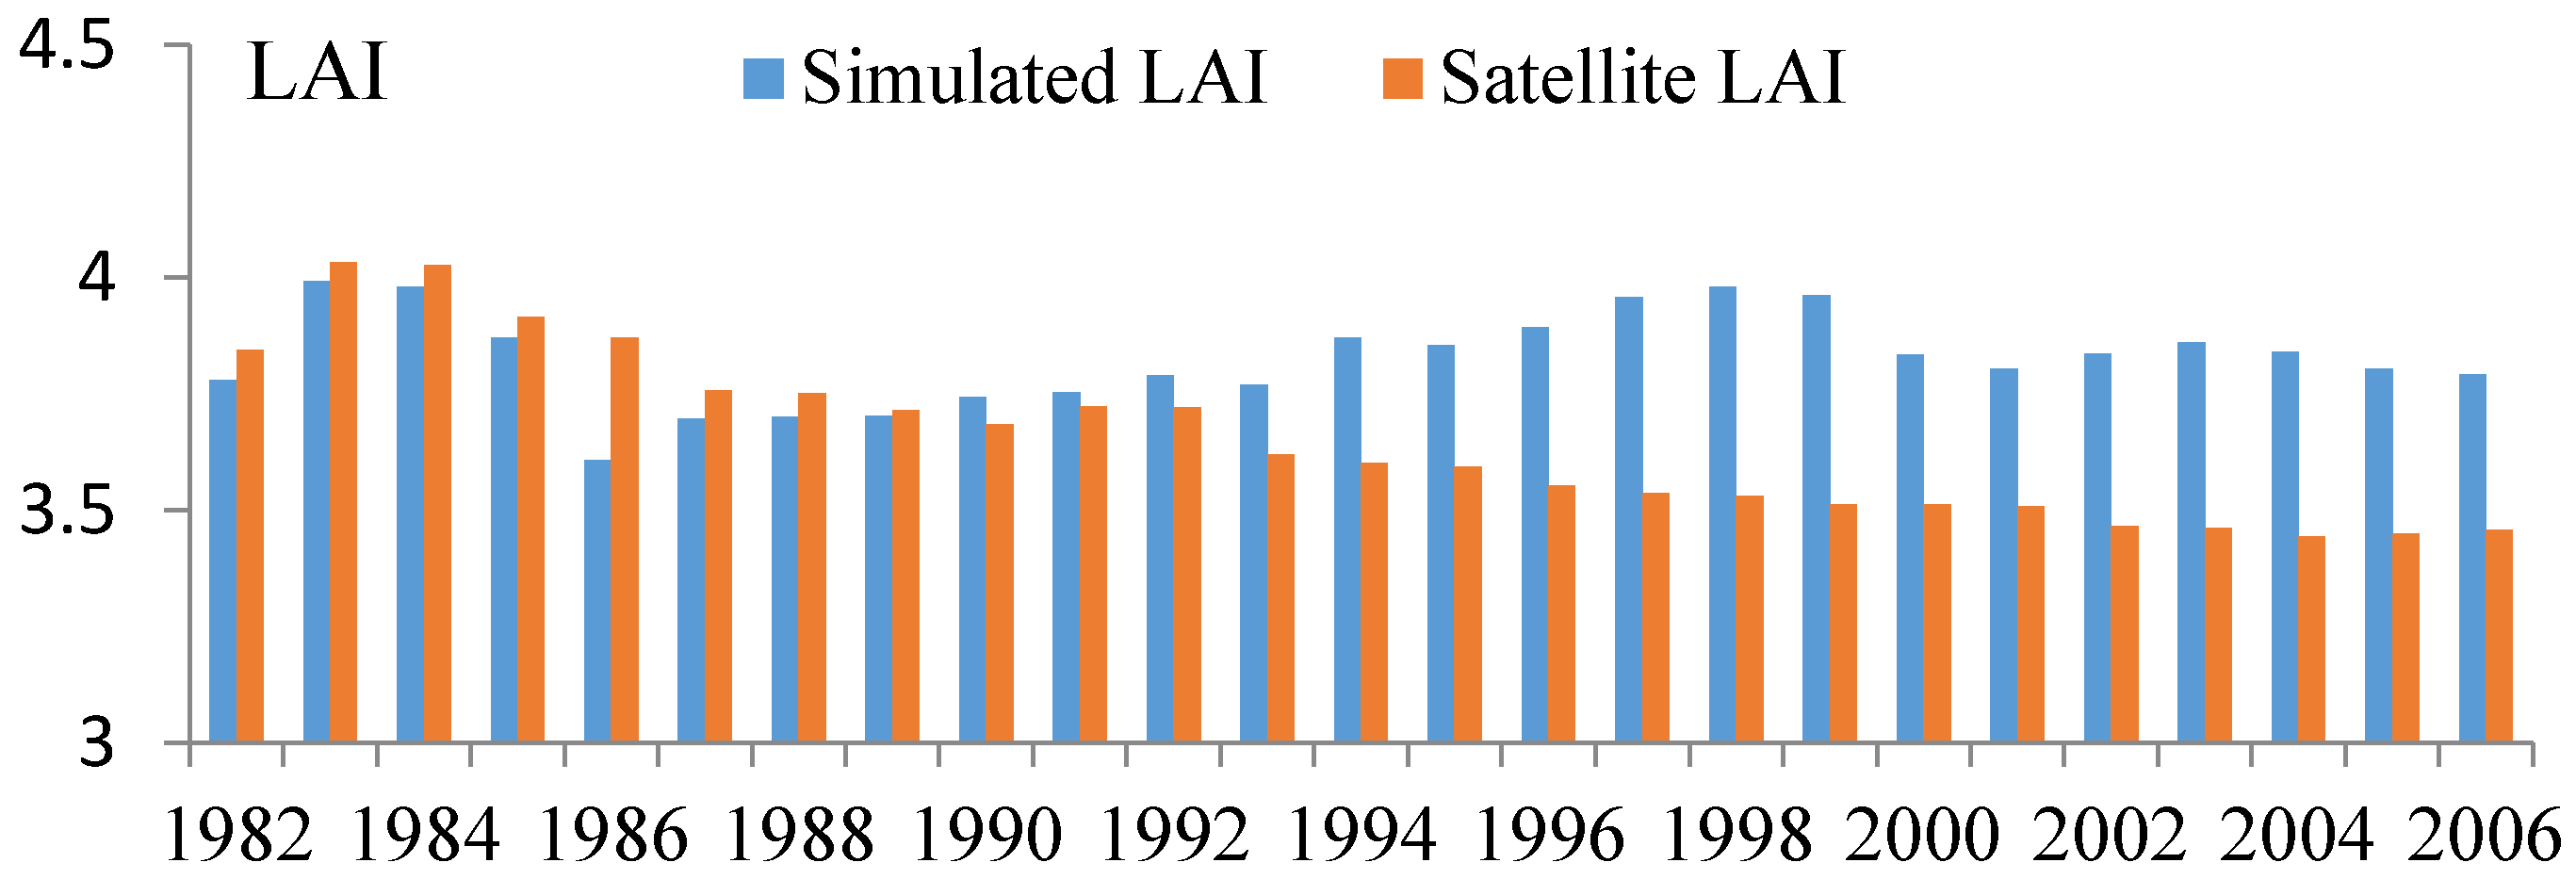
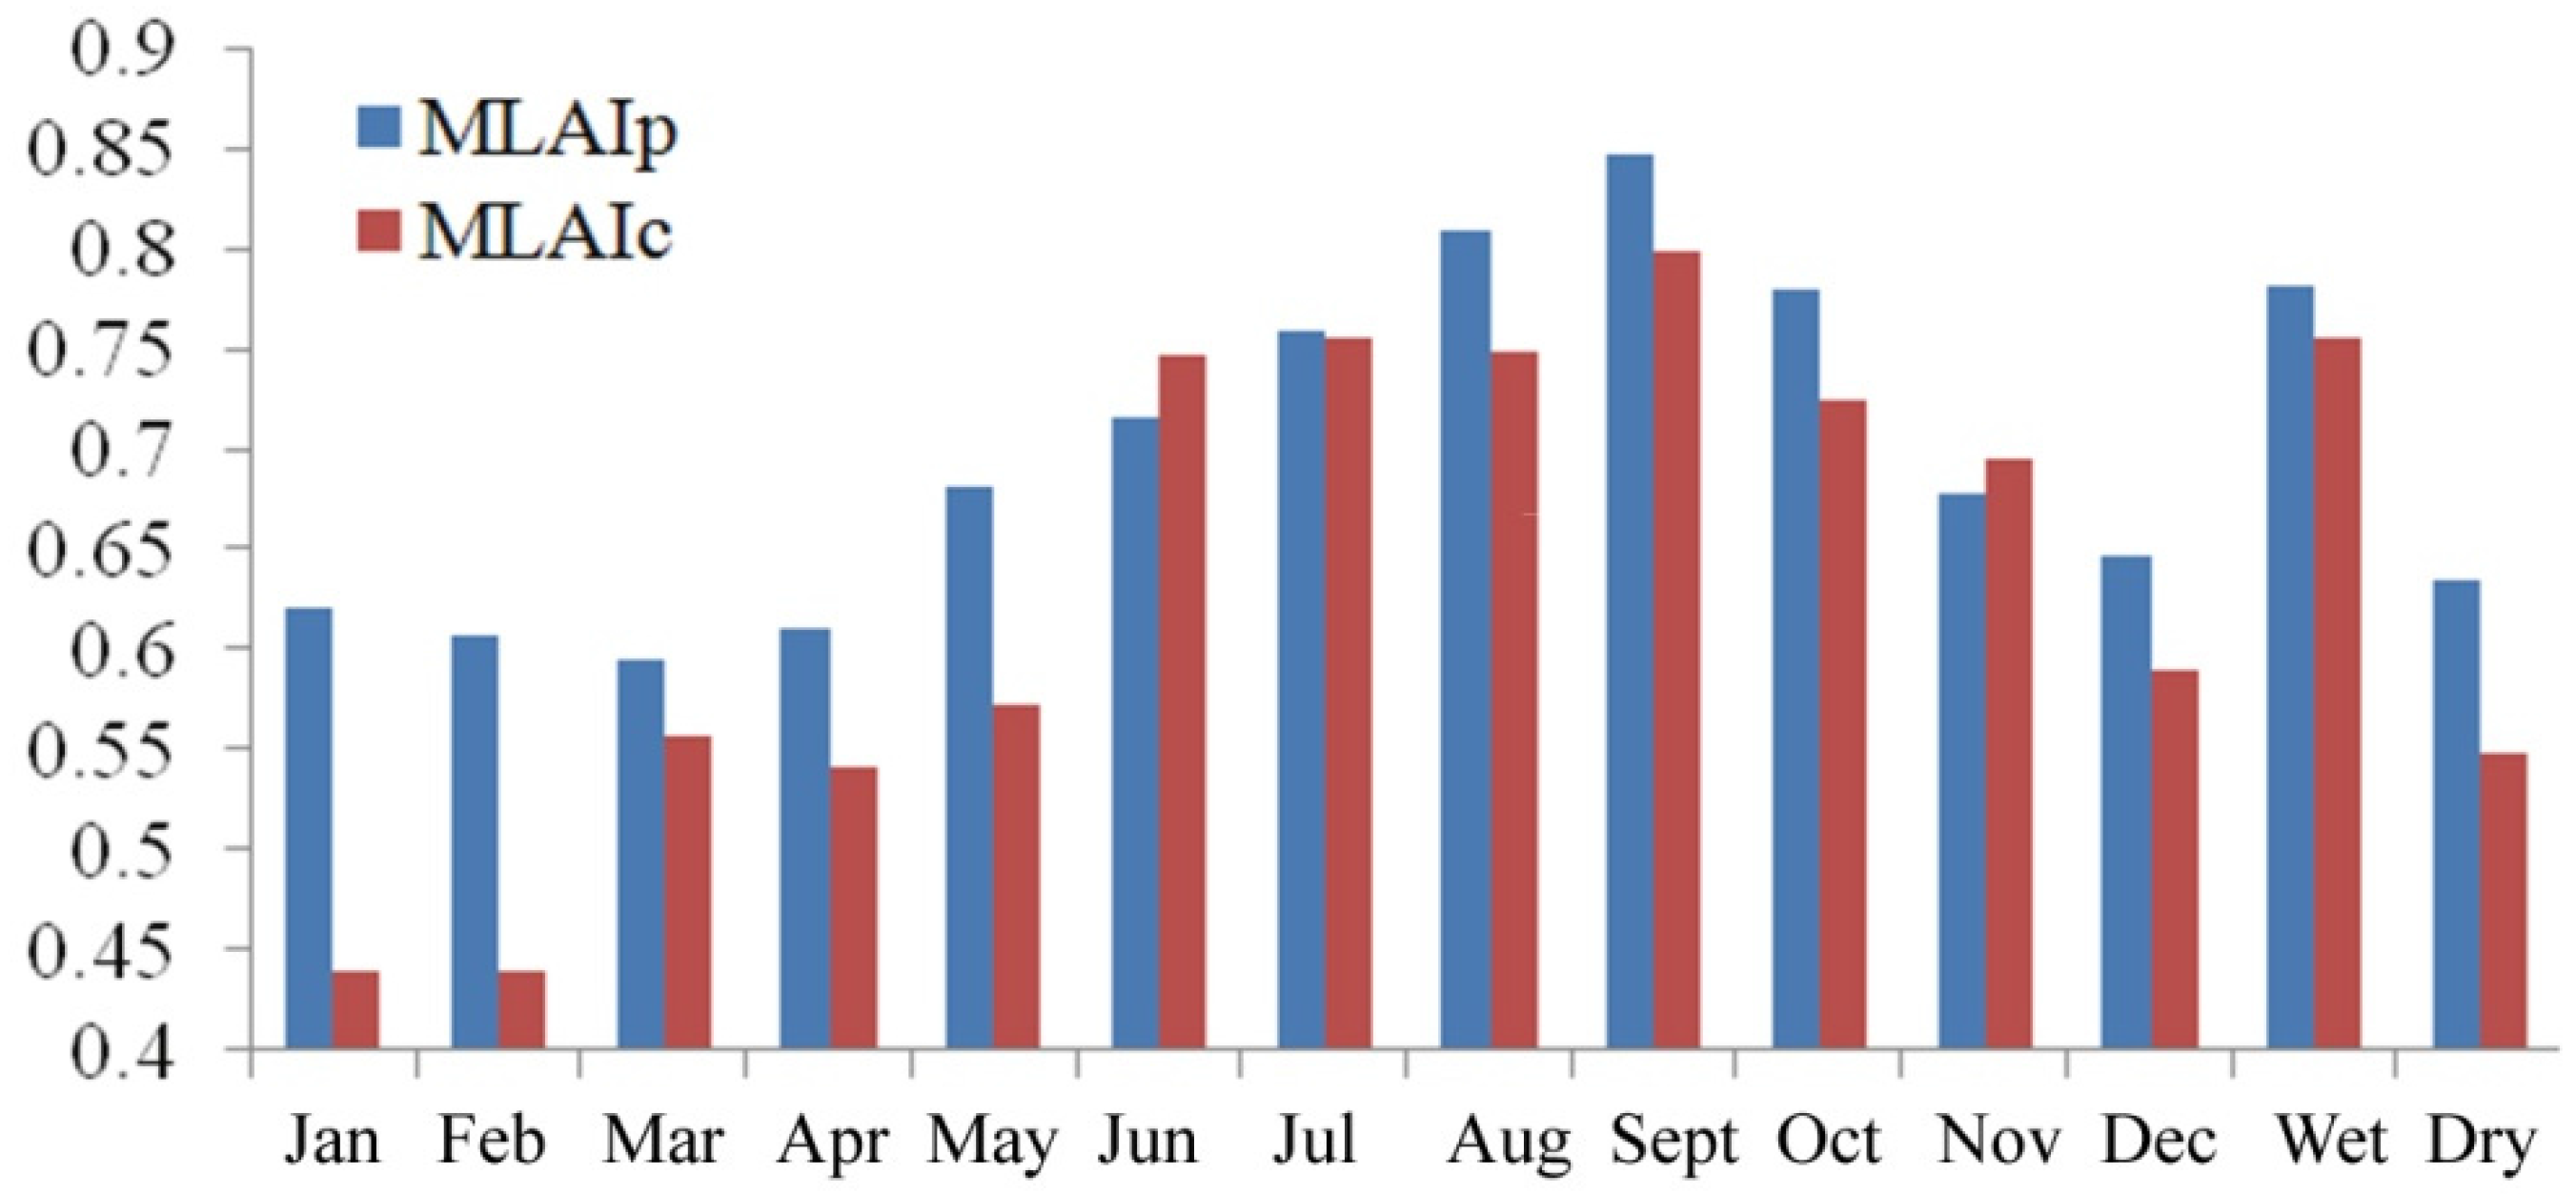
4.3. Modeled Actual and Potential LAI Analysis
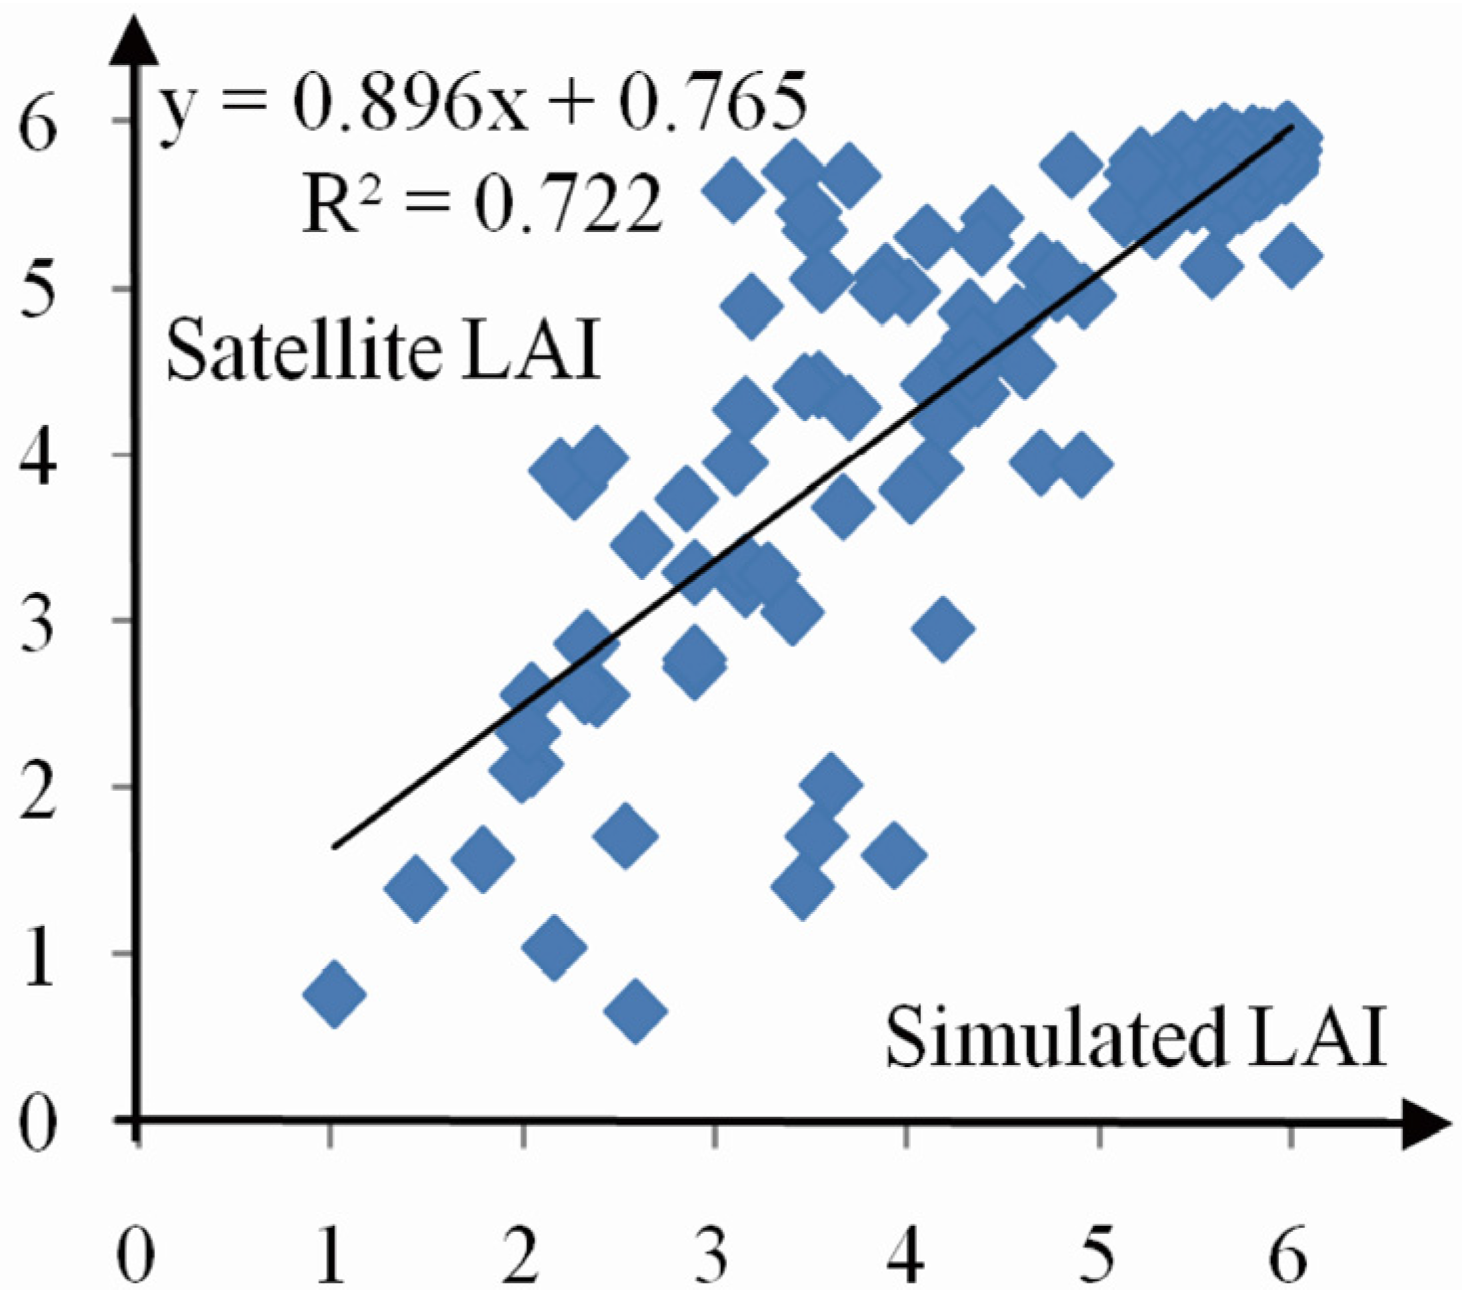


| Wet Season | Dry Season | Annual Average | |
|---|---|---|---|
| MLAIp | 0.783 | 0.635 | 0.696 |
| MLAIc | 0.756 | 0.548 | 0.636 |
| MAE | 0.027 | 0.087 | 0.06 |
| PBIAS(%) | 3.57 | 15.88 | 9.43 |
4.4. Effects of New Reclassified Environmental Changes on Streamflow and Sediment Load
| Station | Time Scale | ΔQt°t | ΔQcli | ΔQhum | Clim | Hum | |||
|---|---|---|---|---|---|---|---|---|---|
| % | % | ||||||||
| LC | wet season | 1726.8 | 1982.9 | 1816.4 | 256.1 | 89.6 | 166.5 | 35.0 | 65.0 |
| dry season | 381.5 | 479.5 | 424.6 | 98.0 | 43.1 | 54.9 | 44.0 | 56.0 | |
| annual | 1054.2 | 1231.1 | 1120.5 | 176.9 | 66.3 | 110.6 | 37.5 | 62.5 | |
| TB | wet season | 2235.2 | 2784.9 | 2405.6 | 549.7 | 170.4 | 379.3 | 31.0 | 69.0 |
| dry season | 493.8 | 690.6 | 574.5 | 196.8 | 80.7 | 116.1 | 41.0 | 59.0 | |
| annual | 1364.6 | 1738.0 | 1490.1 | 373.4 | 125.5 | 247.9 | 33.6 | 66.4 |
| Station | Time Scale | ΔSLt°t | ΔSLcli | ΔSLhum | Clim | Hum | |||
|---|---|---|---|---|---|---|---|---|---|
| % | % | ||||||||
| LC | Wet season | 65.3 | 79.8 | 69.2 | 14.5 | 3.9 | 10.6 | 26.9 | 73.1 |
| Dry season | 4.8 | 5.9 | 5.3 | 1.1 | 0.4 | 0.7 | 40.0 | 60.0 | |
| Annual | 35.1 | 42.9 | 37.4 | 7.8 | 2.3 | 5.5 | 29.5 | 70.5 |
4.5. Discussion
4.5.1. Changes of Land Cover Changes and Their Impacts
| Station | Results Source | Clim | Hum |
|---|---|---|---|
| % | % | ||
| LC(Streamflow) | A | 37.5 | 62.5 |
| B | 46.0 | 54.0 | |
| TB(Streamflow) | A | 33.6 | 66.4 |
| B | 40.0 | 60.0 | |
| LC(Sediment load) | A | 29.5 | 70.5 |
| B | 36.0 | 64.0 |
| Type | Behaviour | Increase of Streamflow and Sediment Load |
|---|---|---|
| Climate change | Increasing rainfall | Positive |
| Climate-Induced land cover change | More frequent forest | Negative |
| Human-induced land cover change | Forest degradation | Positive |
4.5.2. Uncertainties Analysis
5. Conclusions
Acknowledgments
Author Contributions
Conflicts of Interest
References
- Schulze, R.E. Modelling hydrological responses to land use and climate change: A southern African perspective. Ambio 2000, 29, 12–22. [Google Scholar] [CrossRef]
- Sun, S.L.; Chen, H.S.; Ju, W.M.; Hua, W.J.; Yu, M.; Yin, Y.X. On the attribution of changing hydrological cycle in Poyang Lake Basin, China. J. Hydrol. 2014, 514, 214–225. [Google Scholar] [CrossRef]
- Le, T.P.Q.; Garnier, J.; Gilles, B.; Sylvain, T.; van Minh, C. The changing flow regime and sediment load of the Red River, Viet Nam. J. Hydrol. 2007, 334, 199–214. [Google Scholar] [CrossRef]
- Wang, J.; Ishidaira, H. Effects of climate change and human activities on streamflow and sediment flow into the Hoa Binh reservoir. J. Jpn. Soc. Civil Eng. Ser.B1 (Hydraul. Eng.) 2012, 68, I91–I96. [Google Scholar] [CrossRef]
- Wardrop, D.H.; Brooks, R.P. The Occurrence and impact of sedimentation in central Pennsylvania wetlands. Environ. Monit. Assess. 1998, 51, 119–130. [Google Scholar] [CrossRef]
- Garcia-Ruiz, J.M.; Lana-Renault, N. Hydrological and erosive consequences of farmland abandonment in Europe, with special reference to the Mediterranean region—A review. Agric. Ecosyst. Environ. 2011, 140, 317–338. [Google Scholar] [CrossRef]
- José Marques, M.; Bienes, R.; Jiménez, L.; Pérez-Rodríguez, R. Effect of vegetation cover on runoff and soil erosion under light intensity events. Rainfall simulation over USLE. Sci. Total Environ. 2007, 378, 161–165. [Google Scholar] [CrossRef] [PubMed]
- Tang, L.H.; Yang, D.W.; Hu, H.P.; Gao, B. Detecting the effect of land-use change on streamflow, sediment and nutrient losses by distributed hydrological simulation. J. Hydrol. 2011, 409, 172–182. [Google Scholar] [CrossRef]
- Nguyen, N.L.; Vo, D.H. Initiate Results of Research on Impacts of Several Main Vegetative Types on Water Sources and the Principles to Establish Forests for Water Protection; Agricultural Publishing House: Hochiminh, Vietnam, 1997; p. 156. [Google Scholar]
- Brown, A.E.; Zhang, L.; McMahon, T.A.; Western, A.W.; Vertessy, R.A. A review of paired catchment studies for determining changes in water yield resulting from alterations in vegetation. J. Hydrol. 2005, 310, 28–61. [Google Scholar] [CrossRef]
- Zhao, F.F.; Xu, Z.X.; Zhang, L.; Zuo, D.P. Streamflow response to climate variability and human activities in the upper catchment of the Yellow River Basin. Sci. China Ser. E: Technol. Sci. 2009, 52, 3249–3256. [Google Scholar] [CrossRef]
- Stephen, J.W.; Thomas, W.C.; William, F.W.; Kelley, A.C.M. A multiscale analysis of LULC and NDVI variation in Nang Rong district, northeast Thailand. Agric. Ecosyst. Environ. 2001, 85, 47–64. [Google Scholar]
- Tucker, C.J.; Pinzon, J.E.; Brown, M.E.; Slavback, D.; Park, E.W.; Mahoney, R.; Vermote, E.; Saleous, N.E. An extended AVHRR 8-km NDVI dataset compatible with MODIS and SPOT vegetation NDVI data. Int. J. Remote Sens. 2005, 26, 4485–4498. [Google Scholar] [CrossRef]
- MOSTE. Vietnamese General Statistics Officer, Ministry of Science, Technology and Environment of Vietnam, General Statistics Editor; MOSTE: Hanoi, Vietnam, 1997. [Google Scholar]
- Fullen, M.A.; Mitchell, D.J.; Barton, A.P.; Hocking, T.J.; Liu, L.G.; Wu, B.Z.; Zheng, Y.; Xia, Z.Y. Soil erosion and Conservation in the Headwaters of the Yangtze River, Yunnan Province, China. In Headwaters: Water Resources and Soil Conservation, Proceedings of the Headwater '98, the Fourth International Conference on Headwater Control, Merano, Italy, 1998; Haigh, M.J., Krecek, J., Rajwar, S., Kilmartin, M.P., Eds.; pp. 299–306.
- United Nations Environment Programme (UNEP). China Conservation Strategy; UNEP & China Environmental Science Press: Beijing, China, 1990. [Google Scholar]
- Ye, C.Q.; Gan, S.; Wang, W.L.; Deng, Q.Y.; Chen, W.H.; Li, Y.G. Analysis on the runoff distribution and the variability in the downstream of Honghe River. Resour. Environ. 2008, 17, 886–891. [Google Scholar]
- World Bank. Vietnam Water Resources Sector Review. Selected Working Papers of the World Bank, ADB, FAO/UNP and NGO Water Resources Sectoral Group; World Bank: Hanoi, Vietnam, 1996; p. 340. [Google Scholar]
- Forest Science Institute of Vietnam (FSIV). Vietnam Forestry Outlook Study, Asia-Pacific Forestry Sector Outlook Study II. Working Paper Series; Forest Science Institute of Vietnam (FSIV): Hoanoi, Vietnam, 2009. [Google Scholar]
- He, D.M.; Wu, S.H.; Peng, H.; Yang, Z.F.; Ou, X.K.; Cui, B.S. A study of ecosystem changes in Longitudinal Range-Gorge Region and transboundary eco-security in southwest China. Adv. Earth Sci. 2005, 20, 338–344. [Google Scholar]
- Tuan, V.V. Evaluation of the impact of deforestation to inflow regime of the Hoa Binh Reservoir in Vietnam. In Proceedings of the Yokohama Symposium, Hydrology of Warm Humid Regions, Yokohama, Japan, 13–15 July 1993; pp. 135–138.
- Ren, J.; Hen, D.M.; Fu, K.D.; Li, Y.G. Sediment change under climate changes and human activities in the Yuanjiang-Red River Basin. Chin. Sci. Bull. 2007, 52, 164–171. [Google Scholar]
- Dang, T.H.; Coynel, A.; Orange, D.; Blanc, G.; Etcheber, H.; Le, L.A. Long-term monitoring (1960–2008) of the river-sediment transport in the Red River Watershed (Vietnam): Temporal variability and dam-reservoir impact. Sci. Total Environ. 2010, 408, 4654–4664. [Google Scholar] [CrossRef] [PubMed]
- Yatagai, A.; Kamiguchi, K.; Arakawa, O.; Hamada, A.; Yasutomi, N.; Kitoh, A. APHRODITE: Constructing a Long-term Daily Gridded Precipitation Dataset for Asia based on a Dense Network of Rain Gauges. Bull. Am. Meteorol. Soc. 2012, 93, 1401–1415. [Google Scholar] [CrossRef]
- Harris, I.; Jones, P.D.; Osborn, T.J.; Lister, D.H. Updated high-resolution grids of monthly climatic observations—The CRU TS3.10 Dataset. Int. J. Climatol. 2013, 34, 623–642. [Google Scholar] [CrossRef] [Green Version]
- Bliss, N.B.; Olsen, L.M. Development of a 30-arc-second digital elevation model of South America. In Proceedings of the Pecora Thirteen, Human Interactions with the Environment—Perspectives from Space, Sioux Falls, SD, USA, 20–22 August 1996.
- Global 30 Arc-Second Elevation (GTOPO30). Available online: https://lta.cr.usgs.gov/GTOPO30 (accessed on 27 Janunary 2016).
- DIGITAL SOIL MAP OF THE WORLD. Available online: http://www.fao.org/geonetwork/srv/en/metadata.show?id=14116 (accessed on 27 Janunary 2016).
- Zhu, Z.C.; Bi, J.; Pan, Y.Z.; Ganguly, S.; Anav, A.; Xu, L.; Samanta, A.; Piao, S.L.; Nemani, R.R.; Myneni, R.B. Global Data Sets of Vegetation Leaf Area Index (LAI) 3 g and Fraction of Photosynthetically Active Radiation (FPAR) 3 g Derived from Global Inventory Modeling and Mapping Studies (GIMMS) Normalized Difference Vegetation Index (NDVI3g) for the Period 1981 to 2011. Remote Sens. 2013, 5, 927–948. [Google Scholar]
- Pettitt, A. A nonparametric approach to the change-point problem. Appl. Stat. 1979, 28, 126–135. [Google Scholar] [CrossRef]
- Takeuchi, K.; Ao, T.Q.; Ishidaira, H. Introduction of blockwise use of TOPMODEL and Muskingum–Cunge method for the hydro-environmental simulation of a large ungauged catchment. Hydrolog. Sci. J. 1999, 44, 633–646. [Google Scholar] [CrossRef]
- Ishidaira, H.; Takeuchi, K.; Ao, T. Hydrological simulation of large river basins in Southeast Asia. In Proceedings of the Fresh Perspectives on Hydrology and Water Resources in Southeast Asia and the Pacific, ChristChurch, New Zealand, 21–24 November 2000; pp. 53–54.
- Beven, K. Linking parameters across scales-sub grid parameterizations and scale-dependent hydrological models. Hydrol. Process. 1995, 9, 507–525. [Google Scholar] [CrossRef]
- Shrestha, S.; Bastola, S.; Babel, M.S.; Dulal, K.N.; Magome, J.; Hapuarachchi, H.A.P.; Kazama, F.; Ishidaira, H.; Takeuchi, K. The assessment of spatial and temporal transferability of a physically based distributed hydrological model parameters in different physiographic regions of Nepal. J. Hydrol. 2007, 347, 153–172. [Google Scholar] [CrossRef]
- Moriasi, D.N.; Arnold, J.G.; van Liew, M.W.; Bingner, R.L.; Harmel, R.D.; Veith, T.L. Model evaluation guidelines for systematic quantification of accuracy in watershed simulations. Trans. ASABE 2007, 50, 885–900. [Google Scholar] [CrossRef]
- Running, S.W.; Gower, S.T. FOREST-BGC, A general model of forest ecosystem processes for regional applications. Tree Physiol. 1991, 9, 147–160. [Google Scholar] [CrossRef] [PubMed]
- Thornton, P.E.; Hasenauer, H.; White, M.A. Simultaneous estimation of daily solar radiation and humidity from observed temperature and precipitation: An application over complex terrain in Austria. Agric. For. Meteorol. 2000, 104, 255–271. [Google Scholar] [CrossRef]
- Ichii, K.; Hashimoto, H.; Nemani, R.; White, M. Modeling the interannual variability and trends in gross and net primary productivity of tropical forests from 1982 to 1999. Glob. Planet. Chang. 2005, 48, 274–286. [Google Scholar] [CrossRef]
- Asselman, N.E.M. Fitting and interpretation of sediment rating curves. J. Hydrol. 2000, 234, 228–248. [Google Scholar] [CrossRef]
- Howe, A.; Rodriguez, J.; MacFarlane, G. Vegetation Sediment Flow Interactions in Estuarine Wetlands. In Proceedings of the MODSIM 2005 International Congress on Modelling and Simulation Zerger, Modelling and Simulation Society of Australia and New Zealand, Melbourne, Australia, 12–15 December 2005; pp. 332–338.
- Wang, J.; Ishidaira, H.; Sun, W.C.; Ning, S.W. Development and Interpretation of New Sediment Rating Curve Considering the Effect of Vegetation Cover for Asian Basins. Sci. World J. 2013, 2013, 154375. [Google Scholar] [CrossRef] [PubMed]
- Gallimore, R.; Jacob, R.; Kutzbach, J. Coupled atmosphere-ocean-vegetation simulations for modern and mid Holocene climates: Role of extratropical vegetation cover feedbacks. Clim. Dyn. 2005, 25, 755–776. [Google Scholar] [CrossRef]
- Liu, Z.; Notaro, M.; Kutzbach, J.; Liu, N. Assessing global vegetation-climate feedbacks from observations. J. Clim. 2006, 19, 787–814. [Google Scholar] [CrossRef]
- Smith, V.B.; David, C.H.; Cardenas, M.B.; Yang, Z.L. Climate, river network, and vegetation cover relationships across a climate gradient and their potential for predicting effects of decadal-scale climate change. J. Hydrol. 2013, 488, 101–109. [Google Scholar] [CrossRef]
- Tilman, D.; Lehman, C. Human-caused environmental change: Impacts on plant diversity and evolution. Proc. Natl. Acad. Sci. USA 2001, 98, 5433–5440. [Google Scholar] [CrossRef] [PubMed]
- Chaudhry, G.P.; Saroha, B.S.; Yadav, M. Human Induced Land Use/Land Cover Changes in Northern Part of Gurgaon District, Haryana, India: Natural Resources Census Concept. J. Hum. Ecol. 2008, 23, 243–252. [Google Scholar]
- Taub, D. Effects of Rising Atmospheric Concentrations of Carbon Dioxide on Plants. Nat. Educ. Knowl. 2010, 3, 21. [Google Scholar]
- Li, N.; McLaughlin, D.; Kinzelbach, W.; Li, W.; Dong, G. Using an ensemble smoother to evaluate parameter uncertainty of an integrated hydrological model of Yanqi basin. J. Hydrol. 2015, 529, 146–158. Available online: http://dx.doi.org/10.1016/j.jhydrol.2015.07.024. [Google Scholar] [CrossRef]
- Arnold, S.; Attinger, S.; Frank, K.; Hildebrandt, A. Uncertainty in parameterisation and model structure affect simulation results in coupled ecohydrological models. Hydrol. Earth Syst. Sci. 2009, 13, 1789–1807. [Google Scholar]
- Christiaens, K.; Feyen, J. Use of sensitivity and uncertainty measures in distributed hydrological modeling with an application to the MIKE SHE model. Water Resour. Res. 2002, 38. [Google Scholar] [CrossRef]
- Zhao, G.; Tian, P.; Mu, X.; Jiao, J.; Wang, F.; Gao, P. Quantifying the impact of climate variability and human activities on streamflow in the middle reaches of the Yellow River basin, China. J. Hydrol. 2014, 519, 387–398. [Google Scholar] [CrossRef]
© 2016 by the authors; licensee MDPI, Basel, Switzerland. This article is an open access article distributed under the terms and conditions of the Creative Commons by Attribution (CC-BY) license (http://creativecommons.org/licenses/by/4.0/).
Share and Cite
Wang, J.; Hiroshi, I.; Ning, S.; Khujanazarov, T.; Yin, G.; Guo, L. Attribution Analyses of Impacts of Environmental Changes on Streamflow and Sediment Load in a Mountainous Basin, Vietnam. Forests 2016, 7, 30. https://doi.org/10.3390/f7020030
Wang J, Hiroshi I, Ning S, Khujanazarov T, Yin G, Guo L. Attribution Analyses of Impacts of Environmental Changes on Streamflow and Sediment Load in a Mountainous Basin, Vietnam. Forests. 2016; 7(2):30. https://doi.org/10.3390/f7020030
Chicago/Turabian StyleWang, Jie, Ishidaira Hiroshi, Shaowei Ning, Timur Khujanazarov, Guiping Yin, and Lijuan Guo. 2016. "Attribution Analyses of Impacts of Environmental Changes on Streamflow and Sediment Load in a Mountainous Basin, Vietnam" Forests 7, no. 2: 30. https://doi.org/10.3390/f7020030