1. Introduction
Geographic information systems (GIS) are a standard tool for assisting foresters with mapping and spatial analysis aspects of their jobs. The ability to think geographically and spatially is an important skill for foresters. A recent analysis showed that over 70% of entry-level forestry job advertisements indicated that basic knowledge, experience, or proficiency with mapping technology, or the ability to read and follow maps, were basic job requirements [
1]. Given that the need to use and manage spatial information in forest management is paramount, university forestry departments have embraced offering spatial information technology courses to keep pace with the needs of the profession [
2]. Wing and Sessions found that of the ten forestry programs they surveyed, eight required a course in either GIS or remote sensing for completion of an undergraduate degree. It is therefore generally assumed today that bachelor’s degree graduates of university-level forestry programs have completed a course involving the use of GIS, since many employers expect recent graduates to have experience or knowledge of the technology. However, as computer hardware and software change, responsibilities and expectations of professionals using GIS may also change [
3].
Several surveys have been conducted in the last 30 years regarding different aspects of GIS education in forestry and natural resource management [
4,
5,
6,
7]. Basic skill requirements of entry-level foresters with respect to GIS were first suggested over twenty years ago in a report to the Society of American Foresters [
8], yet periodic reassessment is of value to educational programs. The intent and purposes of these reports and surveys are to assess the capabilities of the educational systems and to assess the needs of employers and employees. Similar recent surveys, albeit from other fields, have assessed the uses of GIS by land use planners [
7], fisheries management agency administrators [
9], health service professionals [
10], and primary school teachers [
11]. In general, a lack of training and limited time available during the work day have been noted as reasons for different levels of use of GIS [
10,
12].
Our work represents a second look at the GIS tools and datasets that entry-level employees who graduated with a forestry degree might use in the first few years of their field-based positions. A previous study was conducted in 2007 [
7], which focused on graduates from the University of Georgia with several natural resource management emphases. The current study focuses specifically on forestry graduates from three United States university programs. We therefore designed a survey to help us understand the current level of use of GIS software, processing functions, and datasets. Our objective is to shed light on the GIS methods and processes currently used in entry-level, field-based forestry jobs. This information can help educational programs adapt teaching emphases to meet the needs of natural resource managers.
2. Materials and Methods
An Internet-based survey was developed and offered to 282 recent forestry graduates from Mississippi State University, Oregon State University, and the University of Georgia through an email message. We selected these universities because of our familiarity with the forestry programs and because they were perceived as three of the top twenty programs in North America [
13]. Additionally, each of these university forestry programs requires their students to complete a GIS course for completion of their degrees. Other highly-perceived forestry programs were asked to contribute to the study, but due to a lack of response to queries from the authors, were excluded. Graduates from these three institutions received a bachelor’s degree between 2010 and 2015. We used Survey Monkey to conduct and deliver the survey. Internet-based surveys are a growing practice for academic research purposes [
14]. Surveys of this type and form can be implemented at a cost lower than what may be required by mailed surveys or interviews [
15,
16]. One of the advantages of Internet-based surveys is the ease in which one can modify and update problems with the survey [
16], although no such adjustments were necessary. As with a previous survey of foresters [
17], the demographic characteristics of the population of recent forestry graduates (mainly male, and college educated) [
18] is consistent with characteristics of people more likely to be Internet users [
19]. As was necessary in the survey design, we assured each potential respondent that information provided would be confidential and the potential to one day associate responses with names would not be possible; however, the response rate may have been affected by concerns over anonymity and privacy. In conducting the survey, we also employed a process for ignoring potential multiple responses from the same respondent.
Databases of recent graduates were obtained from the respective programs. The databases included email addresses only and were compiled into a single sampling group. Obtaining email addresses for potential survey participants was a challenge since there is not a consistently updated registry of natural resource professionals; therefore, we relied on databases maintained by departmental administrators or alumni coordinators. These departmental databases may have contained out-of-date information or may not have contained all graduates from their respective programs. In cases where an email address was lacking, general queries of the Internet and specific queries of LinkedIn were performed in an attempt to locate a valid email address. These queries were limited to the people’s names, the university’s names, and the term “forestry”. As a result, our contact list may not be completely comprehensive of the recent graduates of these programs, but instead represents a near-complete sample of a larger population. We sent a request to the people in the compiled database, asking them to participate in the survey. If they chose to participate, they were directed to the online survey, which remained open for one month. Respondents received a second request for participation two weeks after the initial solicitation. A final request for participation was sent two days prior to the close of the survey.
This survey design and questionnaire was similar to a previous survey on the use of GIS in natural resource management [
7]. A first set of questions was designed to acquire background information on each survey participant. Three questions were aimed at determining:
The current primary field of work (fisheries, forestry, hydrology, recreation, soils, wildlife, other)
The length of time each survey participant has been in their current position
The frequency of use of GIS in their current position
A second set of questions was designed to gain an understanding of how GIS is being used in each participant’s normal work activities. In general, these four questions concerned the following:
- 4.
The type of GIS software currently being used
- 5.
The prevalence of use of an extensive set of GIS processes
- 6.
The prevalence of use of several types of GIS datasets
- 7.
The types of products (maps or datasets) that the survey participants create
The content of these questions relate to hard (technical) skills, as opposed to soft (e.g., communication, collaboration) skills that may also be required of professionals using GIS [
3].
One final question was designed to help us understand the type of support that the survey participants rely upon when assistance is needed with GIS. Support services included in the survey consisted of those that may be readily available within a forestry organization, and others that require some additional motivation or proactive effort, such as the use of Internet searches and online discussion groups and forums. Descriptive statistics were employed to illustrate the findings of the study since most of the questions involved selection of items from a list, rather than rankings of items using a Likert scale.
The survey was not designed to focus on perceived educational shortcomings of the universities where respondents were trained. Similarly, the results and discussion that follow were not meant to focus on perceived educational shortcomings of the respondents. The educational preparation of the respondents should be very similar, as each of the three forestry programs requires one course in the theory and use of geographical information systems. Respondents may have acquired additional training in the use of GIS, either through their university training program, through their employer (current or former), or independent of these. How well the respondents may have retained this information is unknown. Out of respect for their privacy, we did not ask respondents to provide a measure of success from training exercises (e.g., course grades). Finally, to maintain the brevity of the survey, we did not develop a separate set of questions to further understand their current level of training in this area. One question we posed in our survey involved the frequency with which GIS was used during their normal work activities, but this may further complicate questions related to preparation since active use of the technology enhances one’s preparation to continue to use the technology. Ultimately our two basic assumptions were (1) that in a given forestry position, a person would need to use GIS in a certain manner to fulfill the needs and obligations of the work required, and (2) that if a person were not using an organization’s information systems in a manner required of the position, a reassignment (or worse) would eventually occur. In sum, the influence of educational programs on the level of use of GIS are not ascertained. Rather, the results and discussion focus on the level of use of GIS in the normal work activities of the foresters surveyed.
3. Results
Excluding undeliverable surveys resulting from obsolete or incorrect email addresses, 30% (
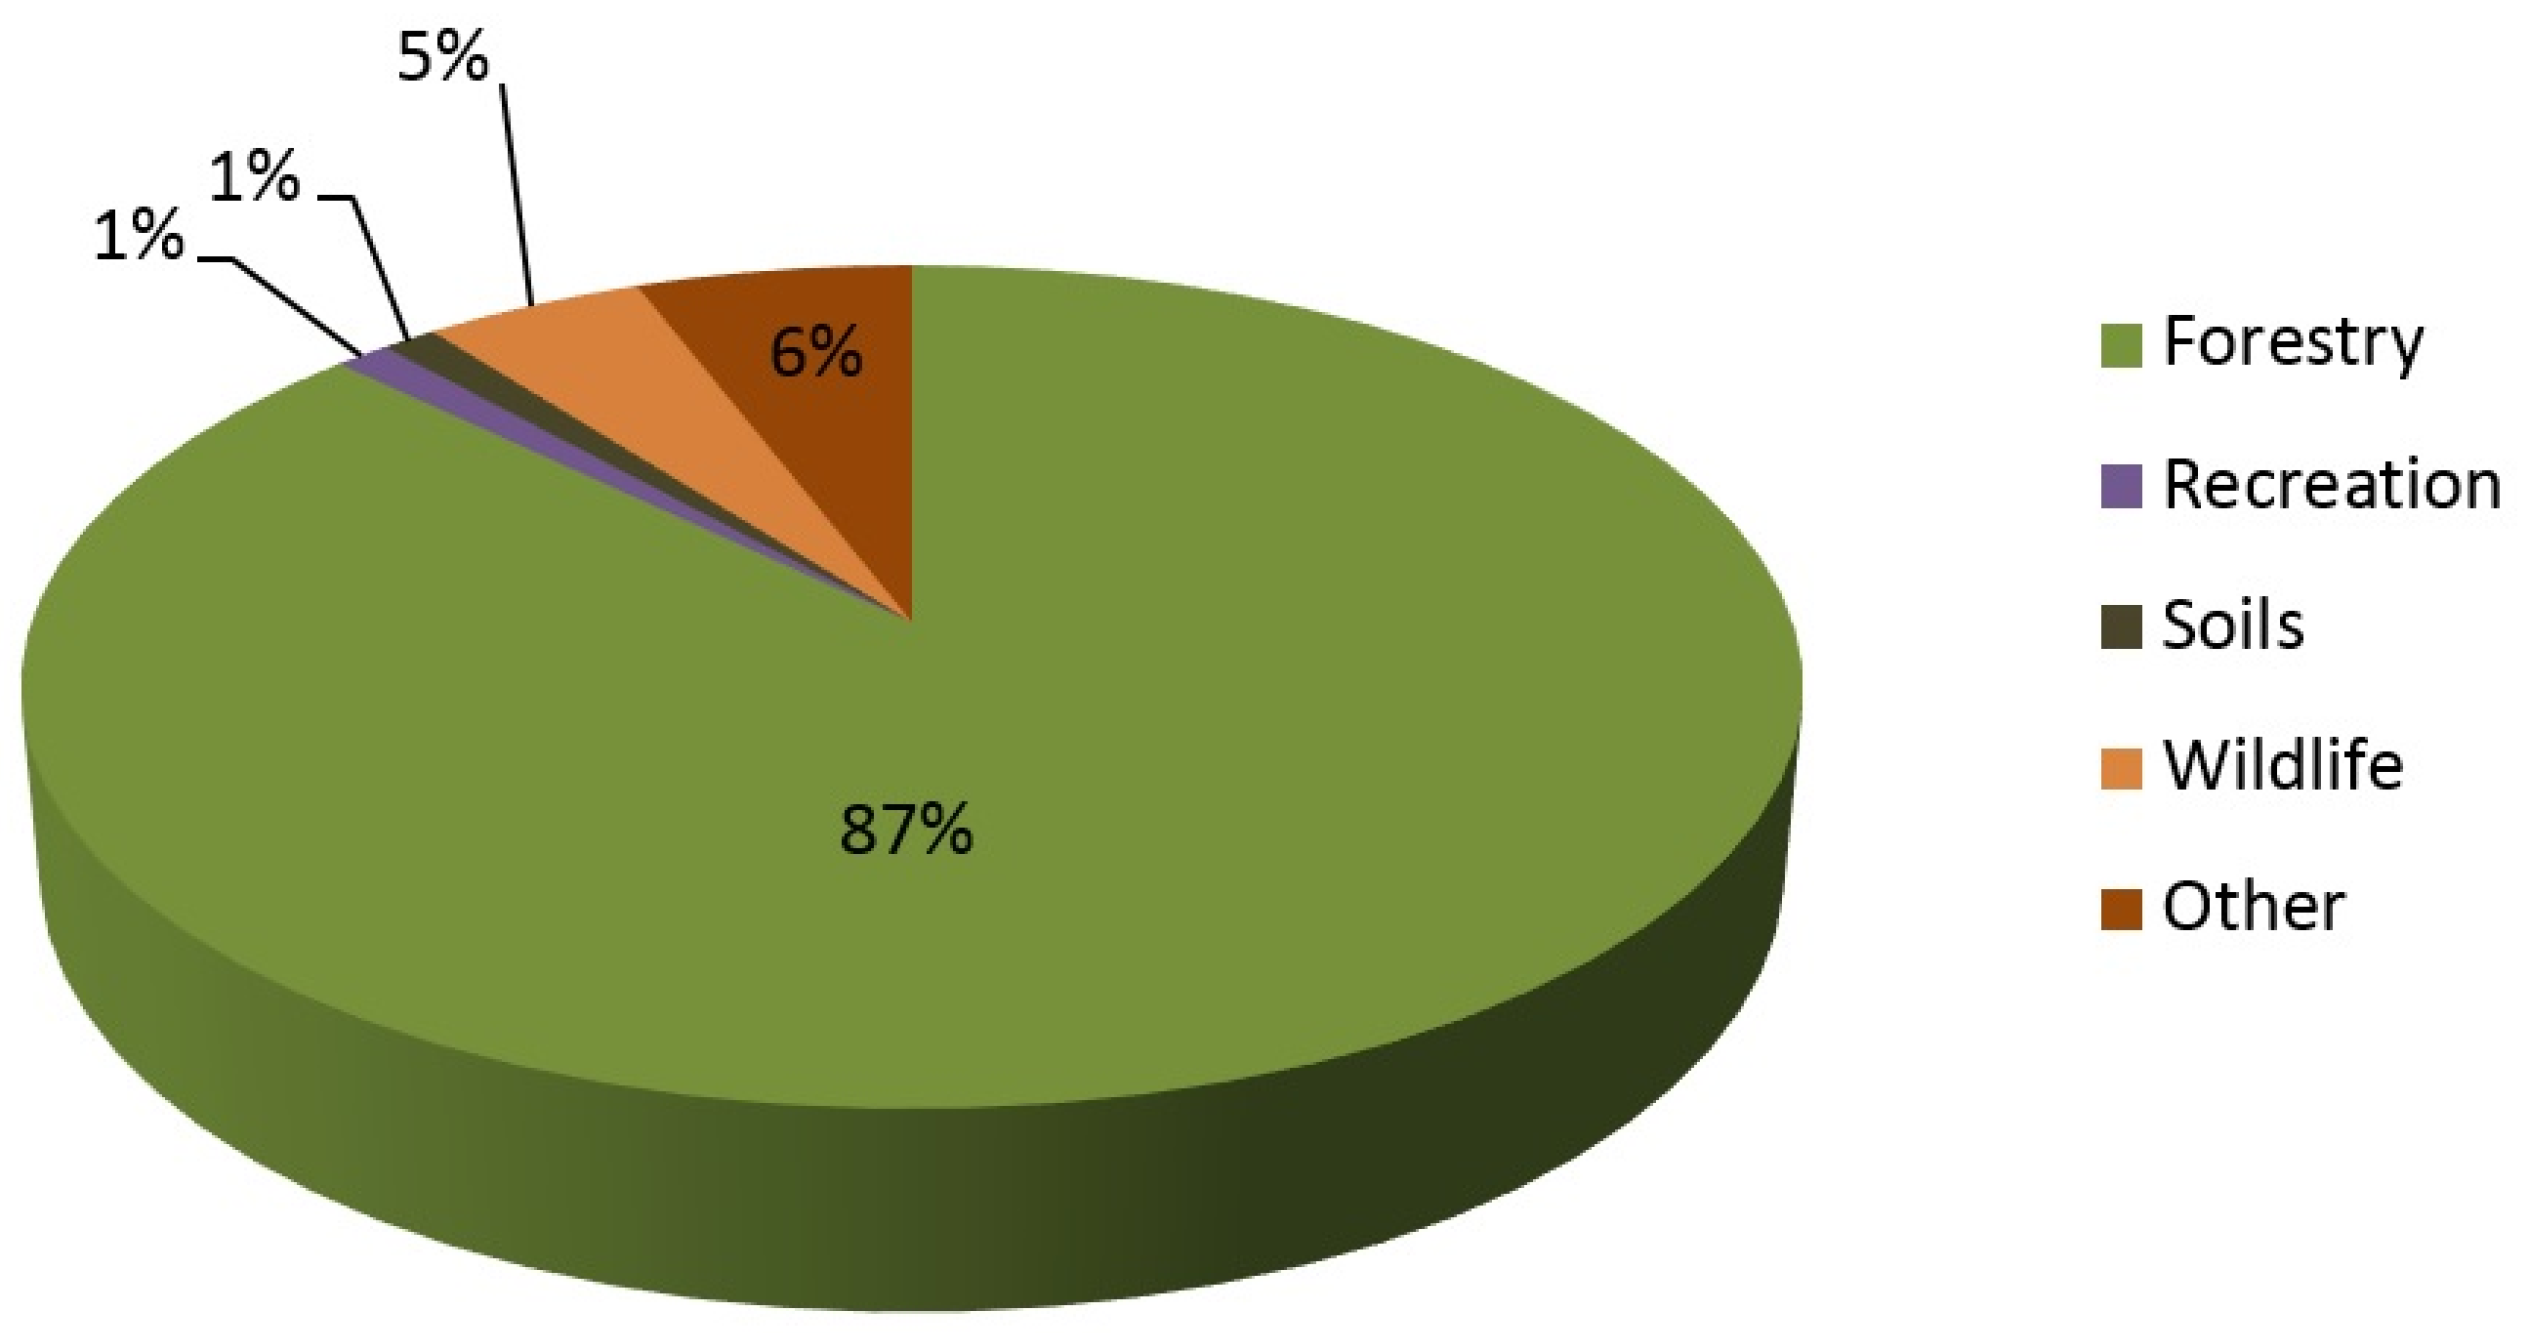
n = 86) of graduates contacted chose to participate in the survey. Survey participants identified themselves as currently employed in various roles in natural resource management (
Figure 1). The majority of respondents, 87%, indicated that they worked primarily in forestry. Other respondents indicated that they worked primarily in wildlife (approximately 5%), recreation (1%), and soils (1%) while approximately 6% indicated that they worked in other associated fields. Eighty-one percent of respondents had completed a Bachelor of Science degree while approximately 19% had completed a Master’s degree (either a Master of Science or Master of Forest Resources). Of those respondents that indicated that they worked in forestry, 25% percent of respondents indicated that they had been in their current position for less than a year, 32% between one and two years, 21% between two and three years, 13% between three and four years, 1% between 4 and 5 years, and 6% between 5 years or more.
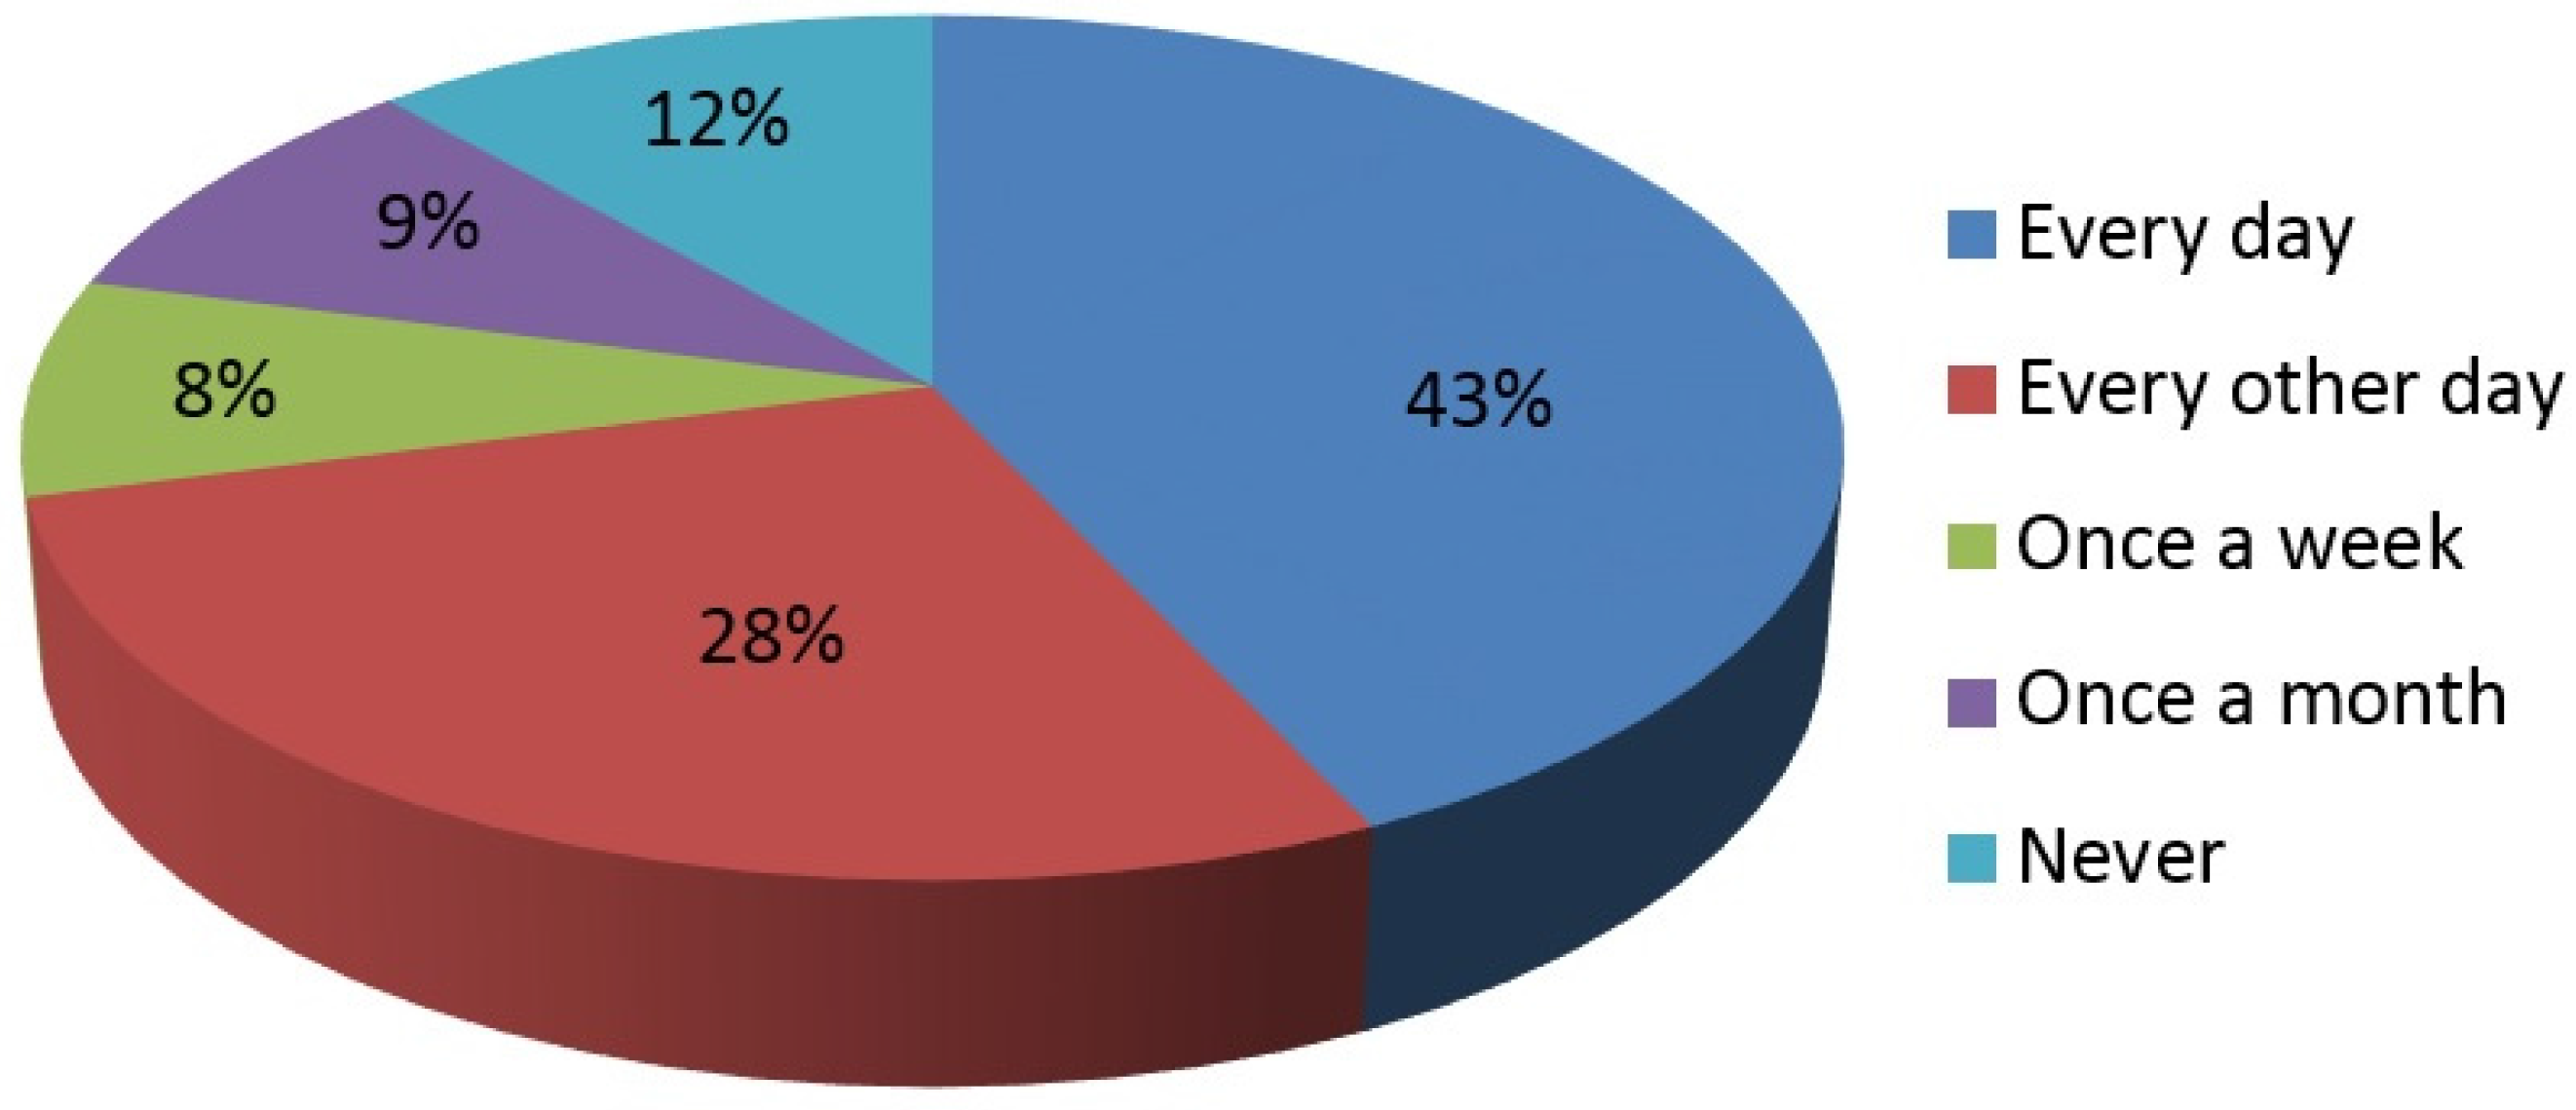
A survey [
7] from a decade ago indicated that approximately 43% of recent graduates who were working in natural resource fields used GIS either every other day or once a week. In the current survey, 71% of respondents noted that they use GIS every day or every other day (
Figure 2). Specifically, 43% of all respondents indicated that they used GIS applications every day, 28% used GIS applications every other day, yet 9% indicated that they only used GIS applications once a month. These compare with 21%, 22%, and 15%, respectively from the previous survey. However, in the current survey 12% of respondents indicated that they never used GIS in their current position. This compares to 20% in the previous survey. Of those respondents that indicated that they had been in their positions for four or more years (
n = 9), 6% of respondents used GIS either every day or every other day. None of these respondents indicated that they never used GIS. For respondents that had been in their position for four years or less (
n = 77), approximately 65% used GIS every day or every other day. Approximately 15% of these respondents never used GIS.
Of the entire set of respondents, Esri’s ArcGIS software was the most commonly utilized GIS software package (81%) followed by Google Earth (75%) (
Table 1). About 84% and 75% of those respondents working specifically in the forestry field used ArcGIS and Google Earth, respectively. However, other GIS software programs are being used to support natural resource work endeavors, including 12% of all respondents who noted that they used GIS software applications developed by their employer. While respondents were offered other software packages to choose from (i.e., Grass, fGIS, Erdas Imagine, MapInfo, Manifold, etc.), only approximately 9% of all respondents indicated that they currently used any from this set. When given the opportunity for further comment, other open-source GIS products, such as QGIS, were not mentioned even though we are aware there is growing support around the use of some of these.
There were no geospatial processes overwhelmingly identified as
very frequently used by survey respondents. However, when
sometimes,
often,
very frequently levels of use are all considered the general concepts of editing, querying, buffering, clipping, erasing, and splitting processes are most often employed within GIS (
Table 2). By summing the
sometimes,
often, and
very frequent responses, 87% of all respondents noted manually editing tabular attributes was the most frequently employed process. Along these same lines, more than 70% of all respondents indicated they performed manual edits of spatial positions, attribute queries, and feature erasing processes. Similarly, more than 60% of all respondents performed spatial queries, buffering and clipping operations, and polygon combining and splitting functions. Any of the overlaying functions such as identity, intersect, and unioning of spatial datasets, along with joining and linking tabular data with spatial data, were rarely or never performed by respondents. Processing DEMs (digital elevation models), which includes the development of contour intervals, shaded relief maps, viewshed maps, slope and aspect maps, and other similar products, were overwhelmingly rarely conducted by all survey respondents. Specifically, three-dimensional fly-throughs using a DEM, in combination with other datasets, were never performed by 92% of all survey participants.
The vector point datasets mostly commonly used by all survey respondents were timber cruising plots (
Table 3). Other point datasets regularly used include culvert and other water diversion features, and points that identify water sources such as springs. Additionally, 50% of respondents used political point feature datasets regularly. Fire ignition points, fire towers, mines, and water towers were some of the least-used point datasets, as noted by respondents. The most frequently used vector line datasets used were, not surprisingly, roads (63%) and streams (58%) (
Table 4). A large proportion of the respondents indicated low use of recreation trails datasets. Of the vector polygon GIS datasets, ownership boundaries were the most frequently used (
Table 5). Over 70% of the respondents at least sometimes used the following polygon datasets: compartments boundaries, lakes, land classifications, and vegetation polygons such as management units and stands. Less frequently used were recreation opportunity spectrum boundaries, congressional boundaries, wilderness areas, and conservation districts.
Digital aerial photographs and satellite images were the most commonly used raster datasets. Over 83% of all respondents indicated that they used these datasets
sometimes,
often, or
very frequently (
Table 6). About 65% of all respondents used digital topographic maps with regularity. Additionally, about 60% of all respondents indicated that they used digital elevation models with regularity. Fifty-eight percent of all respondents indicated that they
never or
rarely used LiDAR datasets, which suggests an increase in use when compared to 80% of respondents in the previous survey who indicated they never used LiDAR.
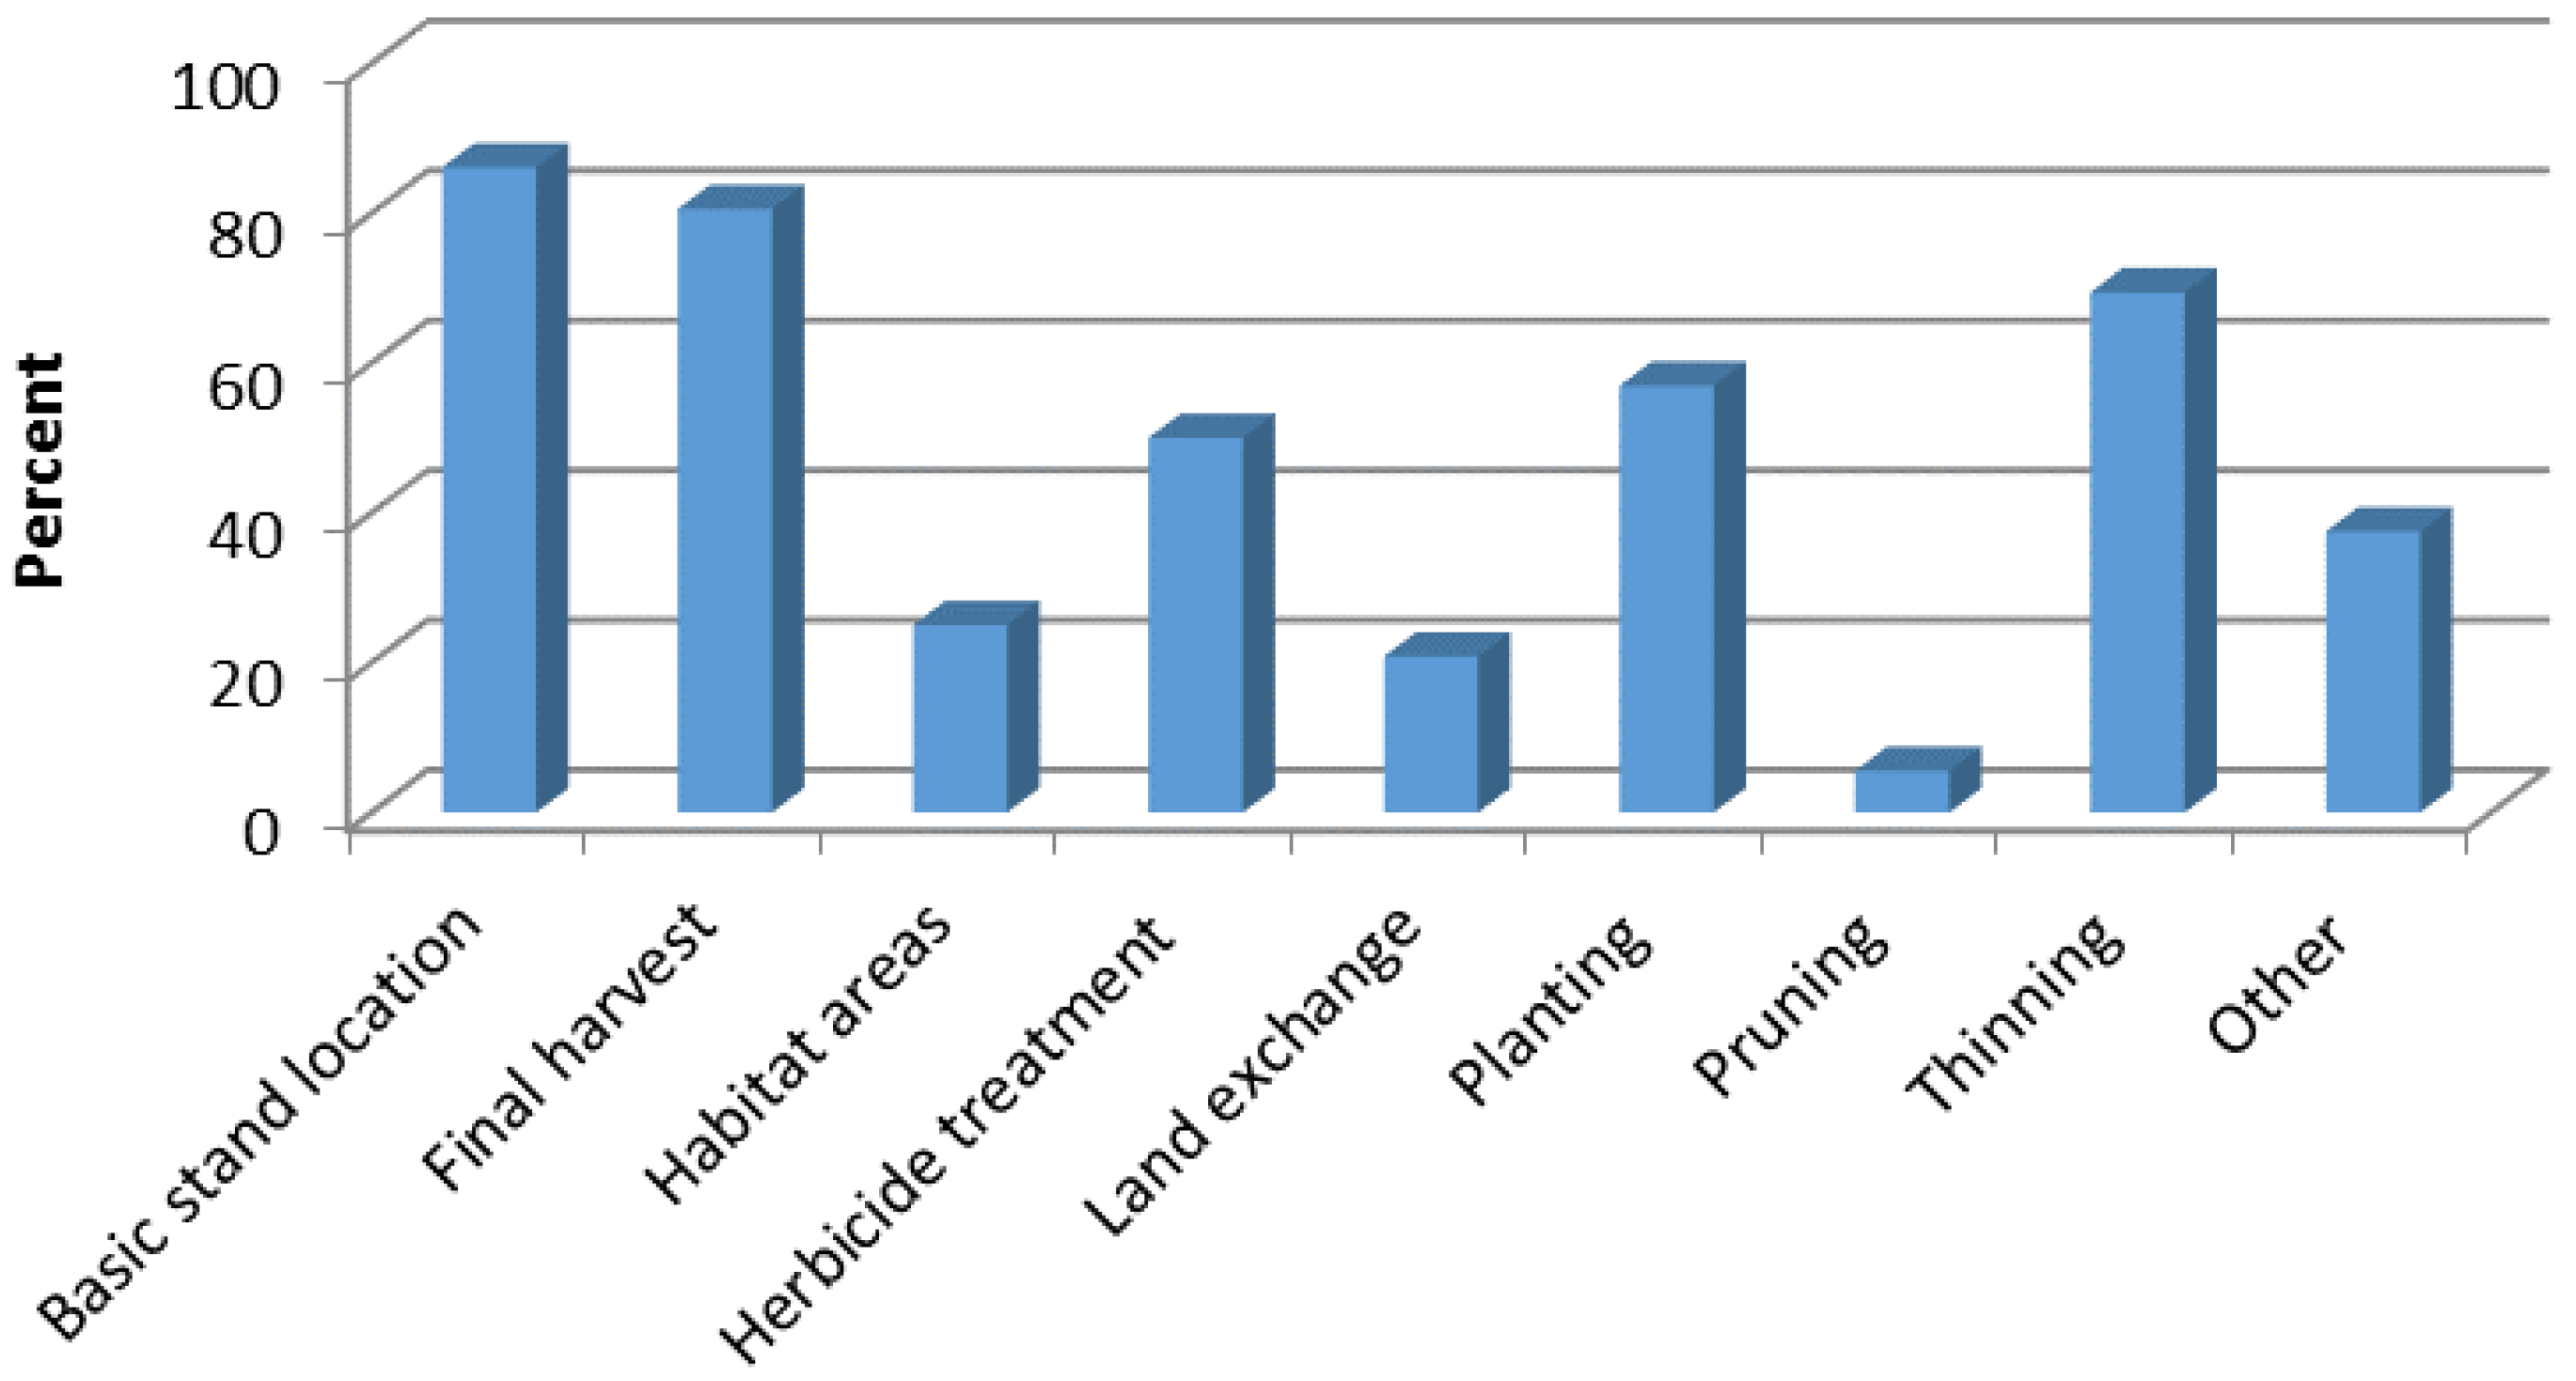
Basic stand location and final harvest maps were identified as the most commonly created maps or datasets by all survey respondents (
Figure 3). Other commonly created maps or datasets were associated with planting, thinning, and herbicide treatment purposes, all useful for on-the-ground management of forests. Thirty-eight percent of all respondents indicated that they developed other datasets or maps than the examples provided in the survey. Examples of these included maps supporting timber cruises, stand exams, other types of timber sales, prescribed burns, and concerns over wetlands and other water bodies.
When asked to provide information on the extent to which recent graduates used various forms of technical support, 72% relied on their organization’s GIS manager
sometimes,
often, or
very frequently to answer GIS-related questions or to help address analytical issues (
Table 7). Forty-eight percent
sometimes,
often, or
very frequently used the available software “help” topics for troubleshooting problems. Along these lines, 45%
sometimes,
often, or
very frequently used books or manuals. Approximately 34% of the respondents
never used online discussion groups to aid in their GIS work, and 19%
never used online technical support. Companies that develop GIS software may have extensive online help topics as well as discussion groups that cover every topic from software updates to specific processing errors as well as tutorials for basic GIS processing. Recent graduates may not have been exposed to these forums, may be unaware that they exist, or may be unaware of the degree to which they can effectively troubleshoot problems or answer questions. One theme that arose when respondents were provided with an opportunity to offer suggestions on other forms of support in GIS was the potential use of YouTube videos for providing instruction.
Survey respondents were also offered an opportunity to comment in general on their GIS work following graduation from their university. A few of the responses included: (a) that only the foresters in the organization used GIS; (b) that GIS work is outsourced by their organization; and (c) that having GIS skills is the key to success in the organization. One respondent suggested that current students should take as many GIS courses as possible, and gain exposure to different GIS software packages while in school. From a different perspective, one respondent noted that they currently work on a timber marking crew and had little opportunity to use GIS in their organization.
4. Discussion
The ease of use of Internet-based surveys was noted earlier as an advantage for collecting sample information concerning a population. However, one of the disadvantages of Internet-based surveys is the time and energy required to compile a valid list of email addresses. In our case, tracking the movement of recent graduates through their early career was uneven between the three universities, and in one case required extensive additional effort to compile the email list for the sample frame. In the other cases, it was apparent that the email lists may not have been current or may have contained typographical errors due to the number of returned (address unknown) email messages. The response rate was therefore also of concern due to these issues. Further, there may potentially be uneven Internet access among the sample respondents with valid email addresses [
20]. We assumed equal access, as today most forestry professionals regularly use the Internet; however, some of the email addresses were associated with employers of the sample respondents while others seemed to be personal email addresses. Therefore, access to personal email and the online survey from respondent’s homes may have limited their engagement in the process, perhaps due to technical problems. Coverage error could also occur if the sample frame is not representative of the larger population (all recent forestry graduates in the United States). Our selection of recent graduates from three universities hopefully reduced the impact of this, since from personal knowledge it appeared that the graduates were working in locations spread across the country. However, coverage of foresters from the northeastern United States and the Lake States may be a limitation of the study. When obtaining contact information from each university we agreed that the survey results would not be used to directly compare programs in an effort to not lose interest from one or more participating schools. In fact, a few other schools were asked to participate and declined perhaps for this reason or that they did not want to provide their student’s contact information. When the survey was conducted, it was offered to the entire sample set at once. In other words, all email addresses were combined into one survey offering. This further limited the analysis we were able to perform, including stratifying the survey results by each universities’ respondents. Measurement error can also occur due to poor wording of the questions or technical problems within the survey [
21], and we attempted to minimize this through internal testing of the survey questions and close association of questions to a prior survey [
7]. There is a possibility that measurement error could be associated with motivational or comprehension issues of respondents with regard to the survey topic [
21]. In this survey, we did not employ any type of incentive system to encourage participation in the survey; we hoped that recent graduates would choose to participate voluntarily. This could have also contributed to the low response rate.
Although a low response rate might be seen to limit the value of a survey, it does not necessarily imply that the results are less accurate than cases where higher response rates are achieved [
22]. Further, while the sampling error around descriptive statistics may decrease when sample sizes increase, higher levels of accuracy among responses are not always assured. Bias with the responses could increase when the values and characteristics between respondents and non-respondents differ [
23]. To address non-response bias, in a manner inspired by others [
24,
25], we explored whether the content of the first 25% of responses received contained more (or less) complete data than the content of the last 25% of responses received. Further, we compared the results of one of the main questions (How often do you use a GIS application in your current position?) between the first and last 25% of respondents to gauge whether there might be differences in the extent to which GIS is used. We found that the amount of the survey completed by the first and last 25% of the respondents was the same (81%), and that a similar portion of the first and last 25% of the respondents used GIS at least once per week (67% and 76%, respectively). This analysis indicated that responses from early and late responders may not have been very different. We assumed by extension that non-response bias was either minimal or not evident; therefore, we felt comfortable moving forward with the analysis.
Based on the results of this survey, one educational strategy for university forestry programs may be to spend a significant amount of time on the GIS processes that the recent graduates indicated are most often used. While editing spatial features, editing tabular data, and manipulating polygons are basic dataset manipulation processes, they could be given more emphasis in university-level GIS courses if not already stressed. The drawback is that this strategy would effectively reduce the amount of time spent on learning processes that would stretch the imagination and increase the capabilities of students. Such concepts could include linking datasets together, using DEMs to create other GIS datasets, performing three-dimensional analyses, and exploring new datasets like LiDAR, all of which are valuable to certain management efforts, but less-widely used by recent graduates working in natural resource positions. Another strategy could be to increase the credit load of GIS-related courses in natural resource management, which would add emphasis to certain areas without reducing coverage of others. However, given pressures on credit hour requirements in natural resource majors, this strategy may be difficult or impossible to implement unless courses are offered as electives.
The role of a university education in geospatial technology comes to the forefront in the discussion. The needs of recent graduates seem to mainly lean towards the technical side of GIS: editing and manipulating spatial data. While these skills are likely provided in university courses, these skills can also be obtained through technical schools, independent work, or professional development programs. Continuing education courses focusing on GIS skills and mapping technologies should play an important role in keeping forestry professionals up-to-date on processing techniques, emerging online mapping tools, and the newest versions of GIS software packages (ArcGIS, for example). However, if the role of a university is to expand the knowledge and experience of students by exposing them to advanced techniques in spatial analysis (or other academic areas), the lectures and exercises related to advanced techniques need to be provided as well. In these cases, a trade-off must be made and the result will likely be to concentrate less on the basic technical aspects.
While it is enlightening to understand the types of data and GIS processes used by recent graduates, one limitation of the survey may be that the information collected focused only on how they choose to use GIS, and not on how they need to use GIS. In addition, the questions we posed limited our ability to determine whether recent graduates are using GIS efficiently or where they are ignoring problems that they felt were too difficult to accomplish. Although we have no information to confirm, it is possible that certain tasks performed frequently may be the result of recent graduates not being aware of more efficient data management and processing methods. An example of this may be where a user of GIS spends a considerable amount of time manually editing spatial features to edge-match other nearby features when a clipping or erasing process could suffice. Or, where manually editing attributes is employed when joining and calculating processes could reduce the amount of time and lessen the potential error. This may suggest that in addition to allocating time toward the GIS processes that are most often used by recent graduates, an educational strategy might be to apply some time toward the introduction of alternative approaches within GIS that enable one to arrive at the same solution from different processing directions.
One area of study that may be overlooked by educational organizations is the vast array and diversity of technical support. Many organizations offer books and manuals to assist with the learning process and the trouble-shooting process, and these may often be viewed as reference material for foresters. However, our results suggest that other forms of support are relatively unknown to our recent graduates. For example, online discussion groups and online support are two areas that are generally available free of charge, and could become a great asset to a person’s GIS knowledge development. These forms of support (and others, such as YouTube videos) could be introduced in university-level classes (if not already), along with a brief introduction to software help topics, and these may improve students’ confidence and professionalism.
Finally, two areas of further consideration may influence how GIS is used among forestry professionals. Foresters who seek GIS certification may be knowledgeable of, and more inclined to utilize, the vast set of geospatial tools available. GIS certification is not often pursued by foresters or forestry students, but is often available through university certification programs and professional associations. Additionally, the impact of personal networking on the knowledge of, and use of GIS could influence a person’s motivation to examine the vast set of geospatial tools available. Unfortunately, we did not consider these potential effects when developing our survey. Despite the limitations of our sample, we feel that the methodology and results presented here provide the framework for assessing GIS usage by entry-level foresters.


