
Benthic Collector and Grazer Communities Are Threatened by Hemlock Woolly Adelgid-Induced Eastern Hemlock Loss

Abstract
:1. Introduction
2. Results
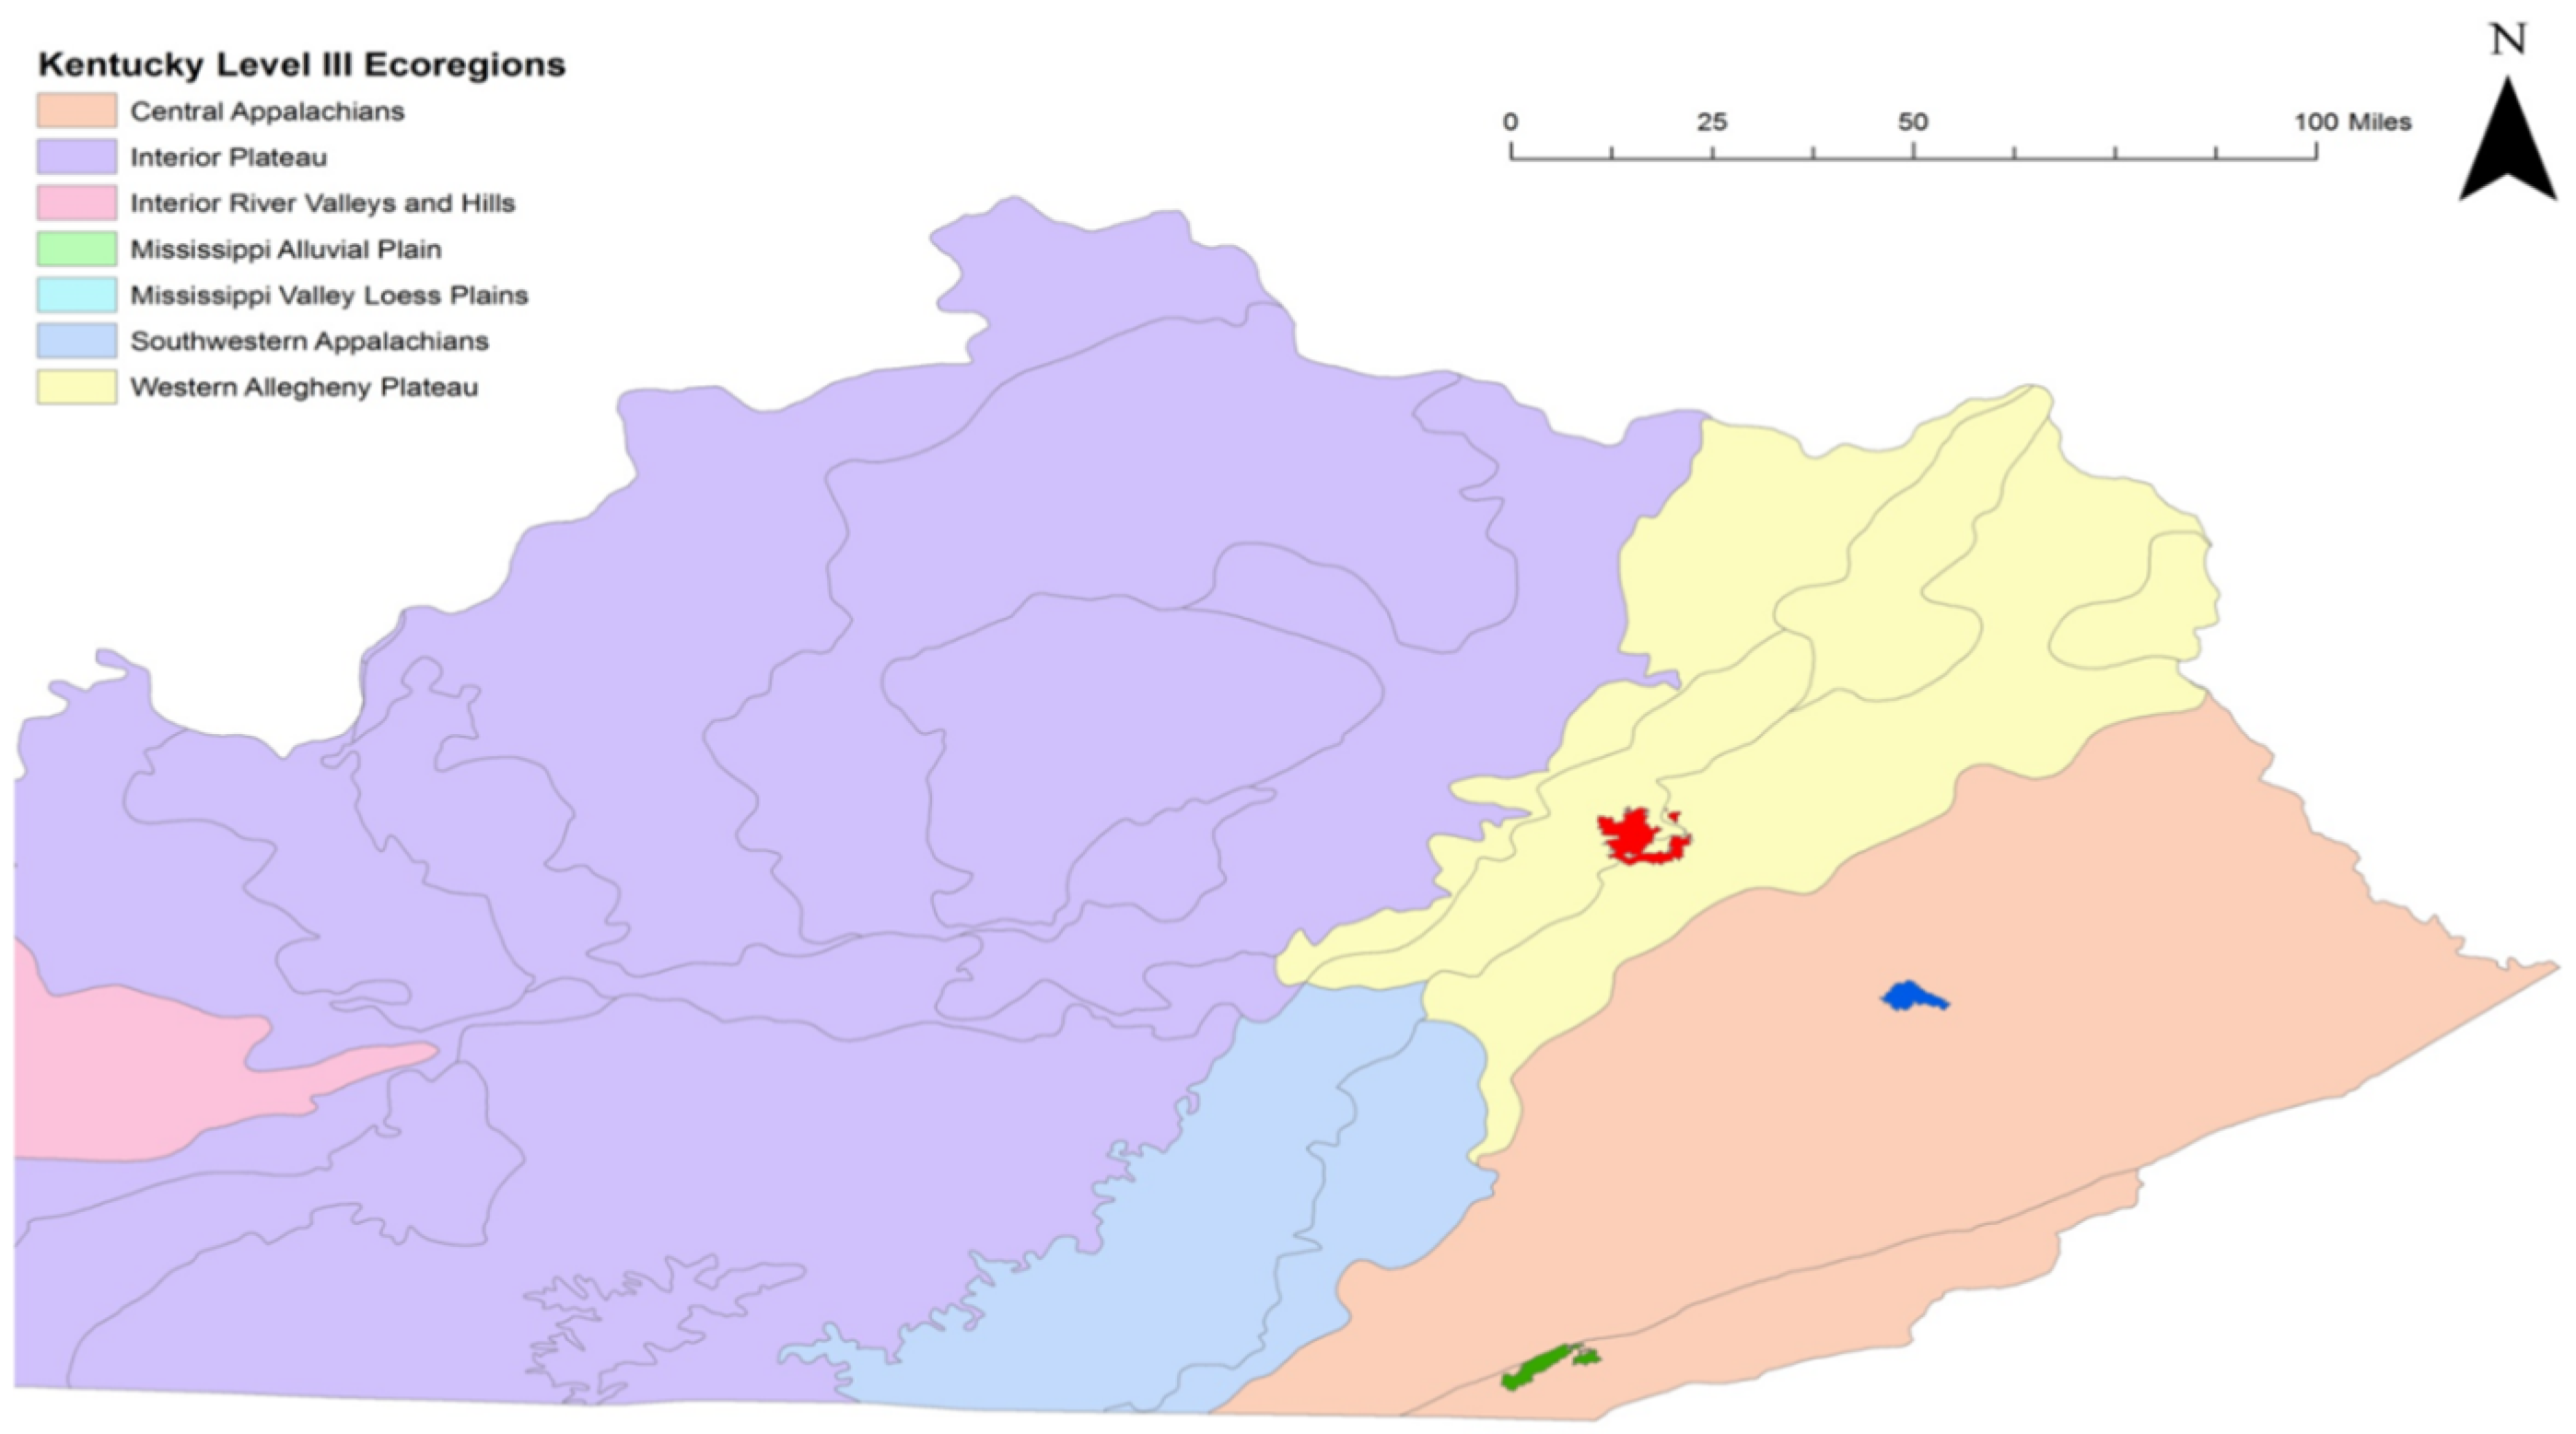
2.1. Study Sites
 ), Robinson Forest (
  ), and Kentucky Ridge State Forest (
  ).
), Robinson Forest ( ), and Kentucky Ridge State Forest ( ).
).
), Robinson Forest ( ), and Kentucky Ridge State Forest ( ).
2.2. Benthic Invertebrate Collectors and Grazers

| Functional Group | Family | Kick Net | Surber | Hester-Dendy | Total | |||
|---|---|---|---|---|---|---|---|---|
| Deciduous | Hemlock | Deciduous | Hemlock | Deciduous | Hemlock | |||
| Collector-Filterers | Hydropsychidae | 612 | 735 | 252 | 266 | 36 | 33 | 1934 |
| Simuliidae | 65 | 139 | 74 | 68 | 14 | 23 | 383 | |
| Polycentropodidae | 74 | 107 | 63 | 53 | 9 | 24 | 330 | |
| Philopotamidae | 44 | 36 | 8 | 10 | 1 | 4 | 103 | |
| Isonychiidae | 1 | 1 | 0 | 0 | 1 | 0 | 3 | |
| Leptoceridae | 0 | 3 | 0 | 0 | 0 | 0 | 3 | |
| Brachycentridae | 2 | 1 | 0 | 0 | 0 | 0 | 3 | |
| Total | 798 | 1022 | 397 | 397 | 64 | 84 | 2759 | |
| Collector-Gatherers | Chironomidae | 300 | 447 | 111 | 91 | 90 | 78 | 1117 |
| Ephemerellidae | 241 | 174 | 324 | 93 | 49 | 68 | 949 | |
| Leptophlebiidae | 159 | 219 | 58 | 51 | 20 | 18 | 525 | |
| Baetidae | 124 | 102 | 32 | 11 | 19 | 11 | 299 | |
| Ameletidae | 62 | 49 | 51 | 59 | 7 | 2 | 230 | |
| Siphlonuridae | 68 | 58 | 31 | 19 | 18 | 11 | 205 | |
| Ephemeridae | 34 | 21 | 14 | 7 | 1 | 0 | 77 | |
| Psychomyiidae | 3 | 49 | 0 | 0 | 6 | 11 | 69 | |
| Dixidae | 12 | 15 | 4 | 2 | 11 | 7 | 51 | |
| Caenidae | 6 | 2 | 1 | 0 | 0 | 0 | 9 | |
| Limnephilidae | 0 | 0 | 4 | 5 | 0 | 0 | 9 | |
| Rhyacophilidae | 0 | 0 | 1 | 2 | 0 | 0 | 3 | |
| Hydrophilidae | 0 | 1 | 0 | 0 | 0 | 1 | 2 | |
| Total | 1054 | 1182 | 634 | 340 | 232 | 213 | 3655 | |
| Grazers | Heptageniidae | 608 | 594 | 690 | 316 | 44 | 43 | 2295 |
| Elmidae | 139 | 121 | 57 | 41 | 4 | 4 | 366 | |
| Uenoidae | 36 | 43 | 26 | 43 | 1 | 3 | 152 | |
| Psephenidae | 58 | 36 | 24 | 15 | 0 | 1 | 134 | |
| Dryopidae | 12 | 41 | 6 | 16 | 3 | 13 | 91 | |
| Glossosomatidae | 11 | 13 | 13 | 6 | 0 | 2 | 45 | |
| Goeridae | 7 | 8 | 8 | 7 | 0 | 0 | 30 | |
| Odontoceridae | 0 | 0 | 0 | 0 | 0 | 4 | 4 | |
| Helicopsychidae | 0 | 1 | 0 | 0 | 0 | 0 | 1 | |
| Total | 871 | 857 | 824 | 444 | 52 | 70 | 3118 | |
| Vegetation | Location | Season | ||||||
|---|---|---|---|---|---|---|---|---|
| Deciduous | Hemlock | Kentucky Ridge | Robinson Forest | Red River Gorge | Fall | Spring | Summer | |
| a. Kick net | ||||||||
| Chironomidae | 1.0 (0.2) b | 1.5 (0.3) a | 0.4 (0.1) b | 1.8 (0.4) a | 1.6 (0.3) a | 1.1 (0.4) b | 2.3 (0.4) a | 0.4 (0.1) b |
| Ephemerellidae | 0.8 (0.2) a | 0.6 (0.1) a | 0.2 (0.1) a | 0.6 (0.1) a | 1.3 (0.3) a | 0.3 (0.1) b | 1.6 (0.3) a | 0.1 (0.0) b |
| Leptophlebiidae | 0.6 (0.1) b | 0.8 (0.1) a | 0.4 (0.1) a | 0.6 (0.1) a | 0.9 (0.1) a | 1.0 (0.2) a | 0.8 (0.1) a | 0.2 (0.0) b |
| Siphlonuridae | 0.2 (0.1) a | 0.2 (0.1) a | 0.3 (0.1) a | 0.3 (0.1) a | 0.1 (0.0) a | 0.0 (0.0) b | 0.5 (0.1) a | 0.0 (0.0) b |
| Ameletidae | 0.2 (0.1) a | 0.2 (0.1) a | 0.2 (0.1) a | 0.4 (0.1) a | 0.1 (0.0) a | 0.0 (0.0) a | 0.5 (0.1) a | 0.0 (0.0) a |
| Ephemeridae | 0.1 (0.0) a | 0.1 (0.0) a | 0.0 (0.0) b | 0.0 (0.0) b | 0.2 (0.1) a | 0.2 (0.1) a | 0.1 (0.0) a | 0.0 (0.0) a |
| Psychomyiidae | 0.0 (0.0) a | 0.2 (0.1) a | 0.0 (0.0) a | 0.0 (0.0) a | 0.2 (0.1) a | 0.2 (0.2) a | 0.1 (0.0) a | 0.0 (0.0) a |
| Heptageniidae | 2.1 (0.4) a | 2.0 (0.3) b | 1.4 (0.2) b | 0.8 (0.2) b | 3.7 (0.6) a | 1.0 (0.1) b | 4.4 (0.6) a | 0.4 (0.1) b |
| Elmidae | 0.5 (0.1) a | 0.4 (0.1) b | 0.1 (0.0) b | 0.1 (0.0) b | 1.0 (0.1) a | 0.5 (0.1) ab | 0.6 (0.1) a | 0.3 (0.1) b |
| Psephenidae | 0.2 (0.0) a | 0.1 (0.0) a | 0.2 (0.0) b | 0.0 (0.0) c | 0.3 (0.1) a | 0.2 (0.0) a | 0.2 (0.0) a | 0.1 (0.0) a |
| Uenoidae | 0.1 (0.0) a | 0.1 (0.1) a | 0.1 (0.1) a | 0.0 (0.0) a | 0.2 (0.1) a | 0.0 (0.0) b | 0.4 (0.1) a | 0.0 (0.0) b |
| Dryopidae | 0.0 (0.0) a | 0.1 (0.0) a | 0.0 (0.0) b | 0.0 (0.0) b | 0.2 (0.1) a | 0.1 (0.0) a | 0.0 (0.0) b | 0.1 (0.1) a |
| Hydropsychidae | 2.1 (0.3) a | 2.5 (0.3) a | 1.9 (0.3) b | 0.3 (0.1) c | 4.4 (0.5) a | 3.4 (0.6) a | 1.8 (0.3) b | 2.0 (0.3) b |
| Simuliidae | 0.2 (0.0) a | 0.5 (0.1) a | 0.2 (0.1) a | 0.3 (0.1) a | 0.5 (0.2) a | 0.0 (0.0) b | 0.9 (0.2) a | 0.0 (0.0) b |
| Polycentropodidae | 0.3 (0.1) a | 0.4 (0.1) a | 0.2 (0.0) b | 0.1 (0.0) b | 0.6 (0.1) a | 0.3 (0.1) a | 0.5 (0.1) a | 0.1 (0.0) b |
| Philopotamidae | 0.2 (0.1) a | 0.1 (0.0) a | 0.1 (0.0) a | 0.2 (0.1) a | 0.1 (0.1) a | 0.2 (0.1) a | 0.2 (0.1) a | 0.0 (0.0) a |
| Simpson | 0.5 (0.0) a | 0.5 (0.0) a | 0.5 (0.0) a | 0.3 (0.0) b | 0.6 (0.0) a | 0.5 (0.0) a | 0.6 (0.0) a | 0.3 (0.0) b |
| Shannon | 0.7 (0.0) b | 0.8 (0.0) a | 0.7 (0.0) b | 0.5 (0.0) c | 1.0 (0.0) a | 0.8 (0.0) b | 1.0 (0.0) a | 0.5 (0.0) c |
| Evenness | 0.6 (0.0) a | 0.6 (0.0) a | 0.6 (0.0) a | 0.4 (0.0) b | 0.7 (0.0) a | 0.6 (0.0) a | 0.7 (0.0) a | 0.4 (0.0) b |
| Filterer | 2.8 (0.3) a | 3.5 (0.4) a | 2.4 (0.3) b | 0.8 (0.1) c | 5.6 (0.6) a | 3.9 (0.6) a | 3.4 (0.4) a | 2.2 (0.3) a |
| Gatherer | 3.7 (0.5) a | 4.1 (0.5) a | 1.9 (0.2) b | 4.2 (0.7) ab | 5.2 (0.6) a | 3.1 (0.5) b | 7.1 (0.7) a | 1.0 (0.1) c |
| Collector | 6.4 (0.6) a | 7.6 (0.8) a | 4.4 (0.4) b | 5.1 (0.8) b | 10.8 (1.0) a | 7.0 (1.0) b | 10.4 (1.0) a | 3.2 (0.4) b |
| Grazer | 3.0 (0.4) a | 2.9 (0.4) b | 1.8 (0.2) b | 1.0 (0.2) c | 5.6 (0.7) a | 1.9 (0.2) b | 5.6 (0.7) a | 1.0 (0.1) b |
| Total | 9.5 (0.9) a | 10.5 (1.0) a | 6.2 (0.5) b | 6.1 (0.9) b | 16.5 (1.6) a | 9.0 (1.1) b | 16.0 (1.5) a | 4.2 (0.5) b |
| b. Surber | ||||||||
| Ephemerellidae | 2.3 (0.6) a | 0.7 (0.1) a | 0.2 (0.1) b | 1.3 (0.3) ab | 2.7 (0.7) a | 0.1 (0.0) b | 3.7 (0.7) a | 0.1 (0.0) b |
| Chironomidae | 0.8 (0.2) a | 0.6 (0.1) a | 0.1 (0.1) a | 1.7 (0.3) a | 0.3 (0.1) a | 0.0 (0.0) b | 1.7 (0.3) a | 0.1 (0.0) b |
| Ameletidae | 0.4 (0.1) a | 0.4 (0.1) a | 0.1 (0.1) a | 0.9 (0.2) a | 0.2 (0.1) a | 0.0 (0.0) a | 1.0 (0.2) a | 0.0 (0.0) a |
| Leptophlebiidae | 0.4 (0.1) a | 0.4 (0.1) a | 0.1 (0.0) b | 0.4 (0.1) a | 0.6 (0.2) a | 0.5 (0.2) a | 0.4 (0.1) a | 0.3 (0.1) a |
| Siphlonuridae | 0.2 (0.1) a | 0.1 (0.1) a | 0.1 (0.1) a | 0.3 (0.1) a | 0.1 (0.1) a | 0.1 (0.0) a | 0.4 (0.1) a | 0.0 (0.0) a |
| Baetidae | 0.2 (0.1) a | 0.1 (0.0) a | 0.0 (0.0) a | 0.1 (0.0) a | 0.3 (0.1) a | 0.0 (0.0) b | 0.3 (0.1) a | 0.0 (0.0) b |
| Hydropsychidae | 1.8 (0.3) a | 1.9 (0.3) a | 1.9 (0.4) b | 0.2 (0.1) c | 3.2 (0.4) a | 2.3 (0.5) a | 2.4 (0.4) a | 0.9 (0.2) a |
| Simuliidae | 0.5 (0.1) a | 0.5 (0.3) a | 0.2 (0.1) a | 0.4 (0.1) a | 0.8 (0.4) a | 0.0 (0.0) b | 1.2 (0.4) a | 0.1 (0.0) b |
| Polycentropodidae | 0.4 (0.1) a | 0.4 (0.1) a | 0.2 (0.1) b | 0.1 (0.0) b | 0.8 (0.2) a | 0.4 (0.1) a | 0.7 (0.2) a | 0.0 (0.0) a |
| Heptageniidae | 4.9 (1.3) a | 2.2 (0.5) a | 1.3 (0.2) a | 1.5 (0.5) a | 7.1 (1.7) a | 0.7 (0.2) b | 8.7 (1.7) a | 0.2 (0.0) b |
| Elmidae | 0.4 (0.1) a | 0.3 (0.1) a | 0.1 (0.0) a | 0.3 (0.1) a | 0.6 (0.1) a | 0.2 (0.1) a | 0.4 (0.1) a | 0.4 (0.1) a |
| Simpson | 0.4 (0.0) a | 0.5 (0.0) a | 0.4 (0.0) b | 0.5 (0.0) b | 0.6 (0.0) a | 0.4 (0.0) b | 0.7 (0.0) a | 0.3 (0.0) b |
| Shannon | 0.6 (0.0) a | 0.7 (0.1) a | 0.5 (0.1) b | 0.7 (0.1) b | 0.9 (0.1) a | 0.6 (0.1) b | 1.1 (0.1) a | 0.4 (0.0) b |
| Evenness | 0.5 (0.0) a | 0.6 (0.0) a | 0.5 (0.0) b | 0.5 (0.0) b | 0.6 (0.0) a | 0.5 (0.1) b | 0.7 (0.0) a | 0.4 (0.0) b |
| Filterer | 2.8 (0.4) a | 2.8 (0.5) a | 2.3 (0.5) b | 0.8 (0.2) c | 4.9 (0.7) a | 2.8 (0.5) b | 4.5 (0.7) a | 1.1 (0.2) b |
| Gatherer | 4.5 (0.8) a | 2.4 (0.3) a | 0.8 (0.2) b | 4.8 (0.7) a | 4.4 (0.9) a | 1.0 (0.2) b | 7.6 (1.0) a | 0.8 (0.2) b |
| Collector | 7.3 (1.1) a | 5.2 (0.7) a | 3.1 (0.5) b | 5.7 (0.8) b | 9.2 (1.4) a | 3.8 (0.6) b | 12.0 (1.4) a | 1.9 (0.3) c |
| Grazer | 5.8 (1.4) a | 3.1 (0.5) b | 1.5 (0.2) b | 1.9 (0.5) b | 8.9 (1.8) a | 1.5 (0.2) b | 9.9 (1.8) a | 0.9 (0.2) b |
| Total | 13.2 (2.3) a | 8.4 (1.1) a | 4.6 (0.7) b | 7.6 (1.0) b | 18.2 (3.1) a | 5.3 (0.8) b | 21.9 (3.0) a | 2.8 (0.3) b |
| c. Hester-Dendy | ||||||||
| Chironomidae | 0.5 (0.1) a | 0.4 (0.1) a | 0.2 (0.1) b | 0.8 (0.2) a | 0.5 (0.1) ab | 0.2 (0.1) b | 0.2 (0.2) a | 0.2 (0.1) b |
| Ephemerellidae | 0.3 (0.1) a | 0.4 (0.1) a | 0.2 (0.1) a | 0.4 (0.1) a | 0.4 (0.1) a | 0.6 (0.2) a | 0.1 (0.1) a | 0.1 (0.0) a |
| Hydropsychidae | 0.2 (0.0) a | 0.2 (0.1) a | 0.2 (0.1) ab | 0.1 (0.0) b | 0.3 (0.1) a | 0.1 (0.1) b | 0.1 (0.1) a | 0.1 (0.0) b |
| Heptageniidae | 0.2 (0.0) a | 0.2 (0.0) b | 0.2 (0.1) b | 0.1 (0.0) c | 0.4 (0.1) a | 0.3 (0.1) a | 0.1 (0.1) a | 0.1 (0.0) b |
| Simpson | 0.2 (0.0) a | 0.2 (0.0) a | 0.2 (0.0) a | 0.1 (0.0) a | 0.2 (0.0) a | 0.2 (0.0) a | 0.1 (0.0) a | 0.1 (0.0) b |
| Shannon | 0.2 (0.0) a | 0.2 (0.0) a | 0.2 (0.0) b | 0.2 (0.0) b | 0.3 (0.0) a | 0.3 (0.0) | 0.1 (0.0) | 0.1 (0.0) |
| Evenness | 0.2 (0.0) a | 0.2 (0.0) a | 0.2 (0.0) ab | 0.2 (0.0) b | 0.3 (0.0) a | 0.3 (0.1) a | 0.1 (0.0) a | 0.1 (0.0) b |
| Filterer | 0.3 (0.1) a | 0.5 (0.1) a | 0.2 (0.1) b | 0.2 (0.1) b | 0.8 (0.2) a | 0.5 (0.2) a | 0.1 (0.2) a | 0.1 (0.0) b |
| Gatherer | 1.3 (0.2) a | 1.2 (0.2) a | 0.7 (0.1) b | 1.5 (0.3) a | 1.5 (0.3) a | 1.4 (0.2) a | 0.6 (0.3) a | 0.6 (0.1) b |
| Collector | 1.6 (0.2) a | 1.7 (0.3) a | 0.9 (0.1) b | 1.7 (0.3) ab | 2.3 (0.4) a | 1.8 (0.3) a | 0.7 (0.4) a | 0.7 (0.1) b |
| Grazer | 0.3 (0.1) a | 0.4 (0.1) a | 0.3 (0.1) b | 0.1 (0.0) c | 0.6 (0.1) a | 0.4 (0.1) a | 0.3 (0.1) a | 0.3 (0.1) a |
| Total | 1.9 (0.3) a | 2.0 (0.3) a | 1.2 (0.2) b | 1.9 (0.3) b | 2.9 (0.4) a | 2.3 (0.3) a | 1.0 (0.4) a | 1.0 (0.1) b |

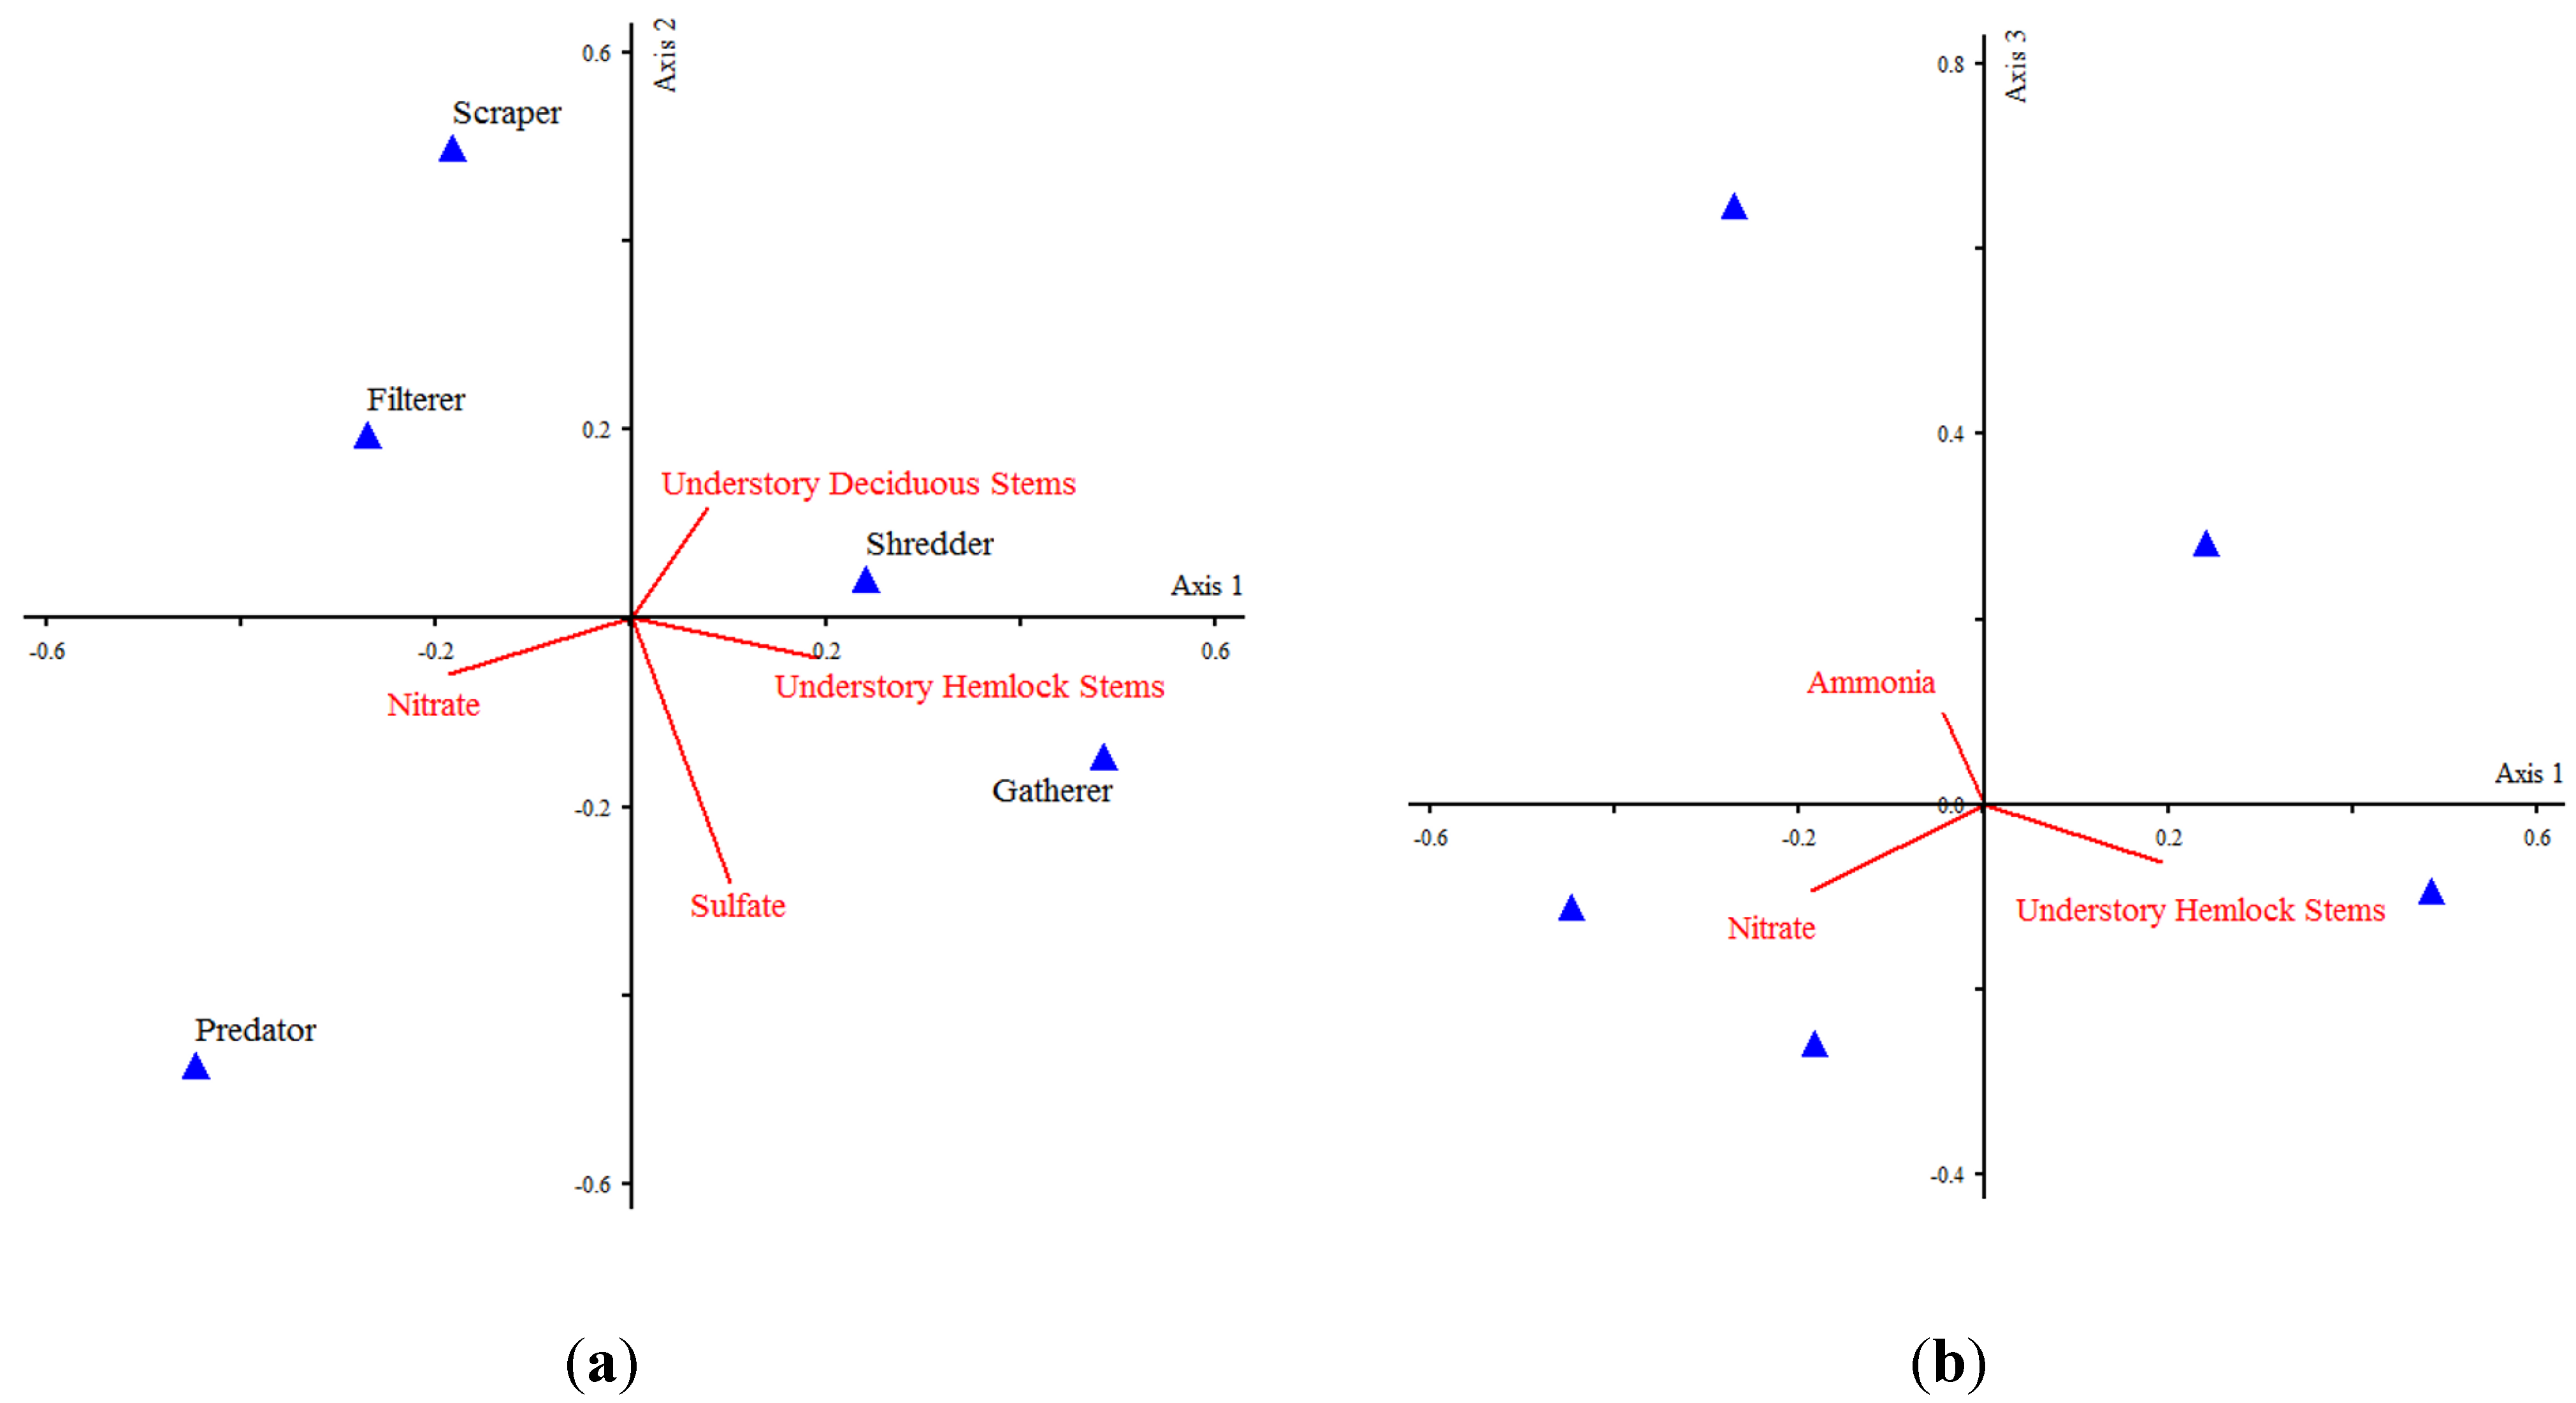
2.3. Multivariate Ordination
| Ordination Axis | |||
|---|---|---|---|
| 1 | 2 | 3 | |
| Monte Carlo Test—Taxa-Environment Correlations | p = 0.04 | p = 0.02 | p = 0.02 |
| Eigenvalues | 0.018 | 0.014 | 0.006 |
| Pearson species-environment correlations | 0.392 | 0.318 | 0.305 |
| Cumulative percentage of variance of species data | 4.6 | 8.2 | 9.8 |
| Intraset correlation for environmental variables | |||
| Understory eastern hemlock stems | 0.522 | −0.122 | −0.22 |
| Understory deciduous stems | 0.212 | 0.336 | −0.233 |
| Overstory eastern hemlock stems | 0.005 | −0.079 | 0.257 |
| Overstory deciduous stems | 0.058 | −0.241 | 0.035 |
| Sulfate | 0.276 | −0.812 | −0.192 |
| Nitrate | −0.513 | −0.174 | −0.334 |
| Ammonia | −0.123 | −0.067 | 0.351 |
| Total Phosphorus | −0.023 | −0.026 | −0.292 |
| Total Carbon | −0.214 | 0.113 | 0.142 |
| Dissolved Organic Carbon | −0.068 | 0.197 | 0.121 |
| pH | 0.136 | −0.072 | 0.222 |
| Dissolved Oxygen | 0.224 | −0.086 | 0.141 |
| Conductivity | 0.147 | −0.299 | 0.152 |
| Functional feeding group weights | |||
| Shredder | 0.241 | 0.04 | 0.283 |
| Scraper | −0.185 | 0.499 | −0.258 |
| Collector-Gatherer | 0.484 | −0.147 | −0.092 |
| Collector-Filterer | −0.272 | 0.194 | 0.648 |
| Predator | −0.447 | −0.475 | −0.11 |

3. Discussion
4. Materials and Methods
4.1. Study Sites
4.2. Benthic Invertebrate Collectors and Grazers
4.3. Multivariate Ordination
5. Conclusions
Supplementary Files
Supplementary File 1Acknowledgments
Author Contributions
Conflicts of Interest
References
- Snyder, C.D.; Young, J.A.; Lemarié, D.P.; Smith, D.R. Influence of eastern hemlock (Tsuga canadensis) forests on aquatic invertebrate assemblages in headwater streams. Can. J. Fish. Aquat. Sci. 2002, 59, 262–275. [Google Scholar] [CrossRef]
- Vandermast, D.B.; van Lear, D.H. Riparian vegetation in the southern Appalachian mountains (USA) following chestnut blight. For. Ecol. Manag. 2002, 155, 97–106. [Google Scholar] [CrossRef]
- Ross, R.M.; Bennett, R.M.; Snyder, C.D.; Young, J.A.; Smith, D.R.; Lemarie, D.P. Influence of eastern hemlock (Tsuga canadensis L.) on fish community structure and function in headwater streams of the Delaware River basin. Ecol. Freshw. Fish 2003, 12, 60–65. [Google Scholar] [CrossRef]
- Dayton, P.K. Toward an understanding of community resilience and the potential effects of enrichment to the benthos at McMurdo Sound, Antarctica. In Proceedings of the Colloquium on Conservation Problems in Antarctica, Blacksburg, VA, USA, 10–12 September 1971; Parker, B.C., Ed.; Allen Press: Lawrence, KS, USA, 1972; pp. 81–95. [Google Scholar]
- Ellison, A.M.; Bank, M.S.; Clinton, B.D.; Colburn, E.A.; Elliott, K.; Ford, C.R.; Foster, D.R.; Kloeppel, B.D.; Knoepp, J.D.; Lovett, G.M.; et al. Loss of foundation species: Consequences for the structure and dynamics of forested ecosystems. Front. Ecol. Environ. 2005, 3, 479–486. [Google Scholar] [CrossRef]
- Yorks, T.E.; Jenkins, J.C.; Leopold, D.J.; Raynal, D.J.; Orwig, D.A. Influences of eastern hemlock mortality on nutrient cycling. In Proceedings of the Symposium on Sustainable Management of Hemlock Ecosystems in Eastern North America, Durham, NH, USA, 22–24 June 1999; McManus, K., Shields, K., Souto, D., Eds.; Northeastern Research Station: Newtown Square, PA, USA, 2000; pp. 126–133. [Google Scholar]
- Welsh, H.H.; Droege, S. A case for using plethodontid salamanders for monitoring biodiversity and ecosystem integrity of North American forests. Conserv. Biol. 2001, 15, 558–569. [Google Scholar] [CrossRef]
- Ford, C.R.; Vose, J.M. Tsuga canadensis (L.) Carr. mortality will impact hydrologic processes in southern Appalachian forest ecosystems. Ecol. Appl. 2007, 17, 1156–1167. [Google Scholar] [CrossRef] [PubMed]
- Nuckolls, A.E.; Wurzburger, N.; Ford, C.R.; Hendrick, R.L.; Vose, J.M.; Kloeppel, B.D. Hemlock declines rapidly with hemlock woolly adelgid infestation: Impacts on the carbon cycle of Southern Appalachian forests. Ecosystems 2008, 12, 179–190. [Google Scholar] [CrossRef]
- Rankin, W.; Tramer, E.J. The gap dynamics of canopy trees of a Tsuga canadensis forest community. Northeast. Nat. 2002, 9, 391–406. [Google Scholar] [CrossRef]
- Finzi, A.; Breemen, N.V. Canopy tree-soil interactions within temperate forests: Species effects on soil carbon and nitrogen. Ecol. Appl. 1998, 8, 440–446. [Google Scholar]
- Jenkins, J.C.; Aber, J.D.; Canham, C.D. Hemlock woolly adelgid impacts on community structure and N cycling rates in eastern hemlock forests. Can. J. For. Res. 1999, 29, 630–645. [Google Scholar] [CrossRef]
- Yorks, T.E.; Leopold, D.J.; Raynal, D.J. Effects of Tsuga canadensis mortality on soil water chemistry and understory vegetation: Possible consequences of an invasive insect herbivore. Can. J. For. Res. 2003, 33, 1525–1537. [Google Scholar] [CrossRef]
- Pitt, D.B.; Batzer, D.P. Potential impacts on stream macroinvertebrates of an influx of woody debris from eastern hemlock demise. For. Sci. 2015, 61. [Google Scholar] [CrossRef]
- Willacker, J.J.; Sobczak, W.V.; Colburn, E.A. Stream macroinvertebrate communities in paired hemlock and deciduous watersheds. Northeast. Nat. 2009, 16, 101–112. [Google Scholar] [CrossRef]
- Adkins, J.K.; Rieske, L.K. A terrestrial invader threatens a benthic community: Hemlock woolly adelgid-induced loss of eastern hemlock alters invertebrate shredders in headwater streams. Biol. Invasions 2015, 17, 1163–1179. [Google Scholar] [CrossRef]
- Webster, J.R.; Morkeski, K.; Wojculewski, C.A.; Niederlehner, B.V.; Benfield, E.F.; Elliott, K.J. Effects of hemlock mortality on streams in the southern Appalachian mountains. Am. Midl. Nat. 2012, 168, 112–131. [Google Scholar] [CrossRef]
- Northington, R.M.; Webster, J.R.; Benfield, E.F.; Cheever, B.M.; Niederlehner, B.R. Ecosystem function in Appalachian headwater streams during an active invasion by the hemlock woolly adelgid. PLoS ONE 2013. [Google Scholar] [CrossRef] [PubMed]
- McClure, M.S. Density-dependent feedback and population cycles in Adelges tsugae (Homoptera: Adelgidae) on Tsuga canadensis. Environ. Entomol. 1991, 20, 258–264. [Google Scholar] [CrossRef]
- Rohr, J.R.; Mahan, C.G.; Kim, K.C. Response of arthropod biodiversity to foundation species declines: The case of the eastern hemlock. For. Ecol. Manag. 2009, 258, 1503–1510. [Google Scholar] [CrossRef]
- Spaulding, H.L.; Rieske, L.K. The aftermath of an invasion: Structure and composition of Central Appalachian hemlock forests following establishment of the hemlock woolly adelgid, Adelges tsugae. Biol. Invasions 2010, 12, 3135–3143. [Google Scholar] [CrossRef]
- Ford, C.R.; Elliott, K.J.; Clinton, B.D.; Kloeppel, B.D.; Vose, J.M. Forest dynamics following eastern hemlock mortality in the southern Appalachians. Oikos 2012, 121, 523–536. [Google Scholar] [CrossRef]
- Orwig, D.A.; Foster, D.R. Forest response to the introduced hemlock woolly adelgid in southern New England, USA. J. Torrey Bot. Soc. 1998, 125, 60–73. [Google Scholar] [CrossRef]
- Wallace, A.J.B.; Eggert, S.L.; Meyer, J.L.; Webster, J.R.; Wallace, J.B. Multiple trophic levels of a forest stream linked to terrestrial litter inputs. Science 1997, 277, 102–104. [Google Scholar] [CrossRef]
- Gregory, S.V.; Swanson, F.J.; McKee, W.A.; Cummins, K.W. An ecosystem perspective of riparian zones. Bioscience 1991, 41, 540–551. [Google Scholar] [CrossRef]
- Naiman, R.J.; Décamps, H. The ecology of interfaces: Riparian zones. Annu. Rev. Ecol. Syst. 1997, 28, 621–658. [Google Scholar] [CrossRef]
- Wipfli, M.S.; Gregovich, D.P. Export of invertebrates and detritus from fishless headwater streams in southeastern Alaska: Implications for downstream salmonid production. Freshw. Biol. 2002, 47, 957–969. [Google Scholar] [CrossRef]
- Jackson, J.K.; Fisher, S.G. Secondary production, emergence, and export of aquatic insects of a Sonoran Desert stream. Ecology 1986, 67, 629–638. [Google Scholar] [CrossRef]
- Fukui, D.; Murakami, M.; Nakano, S.; Aoi, T. Effect of emergent aquatic insects on bat foraging in a riparian forest. J. Anim. Ecol. 2006, 75, 1252–1258. [Google Scholar] [CrossRef] [PubMed]
- Moldenke, A.R.; ver Linden, C. Effects of clearcutting and riparian buffers on the yield of adult aquatic macroinvertebrates from headwater streams. For. Sci. 2007, 53, 308–319. [Google Scholar]
- Vannote, R.L.; Minshall, G.W.; Cummins, K.W.; Sedell, J.R.; Cushing, C.E. The river continuum concept. Can. J. Fish. Aquat. Sci. 1980, 37, 130–137. [Google Scholar] [CrossRef]
- Knight, A.W.; Bottorff, R.L. The importance of riparian vegetation to stream ecosystems. In California Riparian Systems, Ecology, Conservation, and Productive Management; Warner, R.E., Hendrix, K.M., Eds.; University of California Press: Berkeley, CA, USA, 1984; pp. 160–167. [Google Scholar]
- Gomi, T.; Sidle, R.C.; Richardson, J.S. Understanding processes and downstream linkages of headwater systems. Bioscience 2002, 52, 905–916. [Google Scholar] [CrossRef]
- Cummins, K.W.; Wilzbach, M.A.; Gates, D.M.; Perry, J.B.; Taliaferro, W.B. Shredders and riparian vegetation. Bioscience 1989, 39, 24–30. [Google Scholar] [CrossRef]
- Rowell, T.J.; Sobczak, W.V. Will stream periphyton respond to increases in light following forecasted regional hemlock mortality? J. Freshw. Ecol. 2008, 23, 33–40. [Google Scholar] [CrossRef]
- Gregory, S.V. Plant-herbivore interactions in stream systems. In Stream Ecology: Application and Testing of General Ecological Theory; Barnes, J.R., Ed.; Plenum: New York, NY, USA, 1983; pp. 157–190. [Google Scholar]
- Huryn, A.D.; Wallace, J.B. Life history and production of stream insects. Annu. Rev. Entomol. 2000, 45, 83–110. [Google Scholar] [CrossRef] [PubMed]
- McCune, B.; Grace, J.B. Analysis of Ecological Communities; MJM Software Design: Gleneden Beach, OR, USA, 2002. [Google Scholar]
- Mallis, R.E.; Rieske, L.K. Web orientation and prey resources for web-building spiders in eastern hemlock. Environ. Entomol. 2010, 39, 1466–1472. [Google Scholar] [CrossRef] [PubMed]
- Mallis, R.E.; Rieske, L.K. Arboreal spiders in eastern hemlock. Environ. Entomol. 2010, 40, 1378–1387. [Google Scholar] [CrossRef] [PubMed]
- Adkins, J.K.; Rieske, L.K. Loss of a foundation forest species due to an exotic invader impacts terrestrial arthropod communities. For. Ecol. Manag. 2013, 295, 126–135. [Google Scholar] [CrossRef]
- Adkins, J.K. Impact of the Invasive Hemlock Woolly Adelgid on Headwater Stream Aquatic and Ground-Dwelling Invertebrate Communities. Ph.D. Thesis, University of Kentucky, Lexington, KY, USA, 2012; p. 150. [Google Scholar]
- Roberts, S.W.; Tankersley, R.; Orvis, K.H. Assessing the potential impacts to riparian ecosystems resulting from hemlock mortality in Great Smoky Mountains National Park. Environ. Manag. 2009, 44, 335–345. [Google Scholar] [CrossRef] [PubMed]
- Pond, G.J. Patterns of Ephemeroptera taxa loss in Appalachian headwater streams (Kentucky, USA). Hydrobiologia 2010, 641, 185–201. [Google Scholar] [CrossRef]
- Hilsenhoff, W.L. Rapid field assessment of organic pollution with a family-level biotic index. J. N. Am. Benthol. Soc. 1988, 7, 65–68. [Google Scholar] [CrossRef]
- Webster, J.R.; Benfield, E.F. Vascular plant breakdown in freshwater ecosystems. Annu. Rev. Ecol. Syst. 1986, 17, 567–594. [Google Scholar] [CrossRef]
- Cummins, K.W. Structure and function of stream ecosystems. Bioscience 1974, 24, 631–641. [Google Scholar] [CrossRef]
- Cummins, K.W. From headwater streams to rivers. Am. Biol. Teach. 1977, 39, 305–312. [Google Scholar] [CrossRef]
- Short, R.A.; Maslin, P.E. Processing of leaf litter by a stream detritivore: Effect on nutrient availability to collectors. Ecology 1977, 58, 935–938. [Google Scholar] [CrossRef]
- Wallace, J.B.; Webster, J.R. The role of macroinvertebrates in stream ecosystem function. Annu. Rev. Entomol. 1996, 41, 115–139. [Google Scholar] [CrossRef] [PubMed]
- Cummins, K.W.; Petersen, R.C.; Howard, F.O.; Wuycheck, J.C.; Holt, V.I. The utilization of leaf litter by stream detritivores. Ecology 1973, 54, 336–345. [Google Scholar] [CrossRef]
- Heard, S.B. Processing chain ecology: Resource condition and interspecific interactions. J. Anim. Ecol. 1994, 63, 451–464. [Google Scholar] [CrossRef]
- Heard, S.B.; Buchanan, C.K. Grazer-collector facilitation hypothesis supported by laboratory but not field experiments. Can. J. Fish. Aquat. Sci. 2004, 61, 887–897. [Google Scholar] [CrossRef]
- Baxter, C.V.; Fausch, K.D.; Saunders, W.C. Tangled webs: Reciprocal flows of invertebrate prey link streams and riparian zones. Freshw. Biol. 2005, 50, 201–220. [Google Scholar] [CrossRef]
- Lowe, W.H.; Likens, G.E. Moving headwater streams to the head of the class. Bioscience 2005, 55, 196–197. [Google Scholar] [CrossRef]
- MacDonald, L.H.; Coe, D. Influence of headwater streams on downstream reaches in forested areas. For. Sci. 2007, 53, 148–168. [Google Scholar]
- Meyer, J.L.; Strayer, D.L.; Wallace, J.B.; Eggert, S.L.; Helfman, G.S.; Leonard, N.E. The contribution of headwater streams to biodiversity in river networks. J. Am. Water Resour. Assoc. 2007, 43, 86–103. [Google Scholar] [CrossRef]
- Ter Braak, C.J.F.; Verdonschot, P.F.M. Canonical correspondence analysis and related multivariate methods in aquatic ecology. Aquat. Sci. 1995, 57, 255–289. [Google Scholar] [CrossRef]
- McDowell, R.C. The Geology of Kentucky—A Text to Accompany the Geologic Map of Kentucky; US Geological Survey Professional Paper 1151-H; Department of the Interior, U.S.G.P.O.: Washington, DC, USA, 1986.
- Woods, A.J.; Omernik, J.M.; Martin, W.H.; Pond, G.J.; Andrews, W.M.; Call, S.M.; Comstock, J.A.; Taylor, D.D. Ecoregions of Kentucky (Color Poster with Map, Descriptive Text, Summary Tables, and Photographs); US Geological Survey (Map Scale 1:1,000,000): Reston, VA, USA, 2002.
- Davis, D.H. The Geography of the Mountains of Eastern Kentucky: A Reconnaissance Study of the Distribution and Activities of Man in that Part of the Cumberland Plateau, Embraced by the Commonwealth; Series 6; Kentucky Geological Survey: Lexington, KY, USA, 1924. [Google Scholar]
- Braun, E.L. Deciduous Forests of Eastern North America; Hafner: New York, NY, USA, 1950. [Google Scholar]
- Godman, R.; Lancaster, K. Eastern Hemlock. In Silvics of North America, Volume 1, Conifers; Burns, R.M., Honkala, B.H., Eds.; USDA Forest Service: Washington, DC, USA, 1990. [Google Scholar]
- Wethington, K.; Derting, T.; Kind, T.; Whiteman, H.; Cole, M.; Drew, M. The Kentucky GAP Analysis Project; Final Report; Kentucky Department of Fish and Wildlife Resources: Frankfort, KY, USA, 2003. [Google Scholar]
- ESRI. ArcMap, ESRI: Redlands, CA, USA, 2008.
- Coleman, T.W.; Clarke, S.R.; Meeker, J.R.; Rieske, L.K. Forest composition following overstory mortality from southern pine beetle and associated treatments. Can. J. For. Res. 2008, 38, 1406–1418. [Google Scholar] [CrossRef]
- United States Department of Agriculture. Natural Resource Information Service (NRIS): Field Sampled Vegetation (FSVeg) Common Stand Exam, Version 1.5.1; USDA Forest Service Natural Resource Conservation Service: Washington, DC, USA, 2003.
- SAS Institute. SAS 9.3 User’s Guide: Statistics, Version 9.3, SAS Institute: Cary, NC, USA, 2011.
- Merritt, R.W.; Cummins, K.W. An Introduction to the Aquatic Insects of North America, 3rd ed.; Kendall/Hunt Publ. Co.: Dubuque, IA, USA, 1995. [Google Scholar]
- Palmer, M.W. Putting things in even better order: The advantages of canonical correspondence analysis. Ecology 1993, 74, 2215–2230. [Google Scholar] [CrossRef]
- Ter Braak, C.J.F. Canonical correspondence analysis: A new eigenvector technique for multivariate direct gradient analysis. Ecology 1986, 67, 1167–1179. [Google Scholar] [CrossRef]
- Elliott, K.J.; Vose, J.M.; Swank, W.T.; Bolstad, P.V. Long-term patterns in vegetation-site relationships in a southern Appalachian forest. J. Torrey Bot. Soc. 1999, 126, 320–334. [Google Scholar] [CrossRef]
- Gabriel, K.R. Biplot display of multivariate matrices for inspection of data and diagnosis. In Interpreting Multivariate Data; Barnet, V., Ed.; Wiley-Blackwell: New York, NY, USA, 1981; pp. 571–572. [Google Scholar]
© 2015 by the authors; licensee MDPI, Basel, Switzerland. This article is an open access article distributed under the terms and conditions of the Creative Commons Attribution license (http://creativecommons.org/licenses/by/4.0/).
Share and Cite
Adkins, J.K.; Rieske, L.K. Benthic Collector and Grazer Communities Are Threatened by Hemlock Woolly Adelgid-Induced Eastern Hemlock Loss. Forests 2015, 6, 2719-2738. https://doi.org/10.3390/f6082719
Adkins JK, Rieske LK. Benthic Collector and Grazer Communities Are Threatened by Hemlock Woolly Adelgid-Induced Eastern Hemlock Loss. Forests. 2015; 6(8):2719-2738. https://doi.org/10.3390/f6082719
Chicago/Turabian StyleAdkins, Joshua K., and Lynne K. Rieske. 2015. "Benthic Collector and Grazer Communities Are Threatened by Hemlock Woolly Adelgid-Induced Eastern Hemlock Loss" Forests 6, no. 8: 2719-2738. https://doi.org/10.3390/f6082719