
Assessing the Effect of Leaf Litter Diversity on the Decomposition and Associated Diversity of Fungal Assemblages

Abstract
:1. Introduction
2. Materials and Methods
2.1. Study Site
2.2. Experimental Design

| Species | C | N | C/N | Lignin | Lignin/N | P | K |
|---|---|---|---|---|---|---|---|
| aspen | 509.3 ± 11.3c | 8.5 ± 0.2a | 60.0 ± 2.1c | 252.1 ± 0.3c | 29.7 ± 0.2c | 1.2 ± 0.0b | 3.5 ± 0.1b |
| birch | 527.4 ± 9.1b | 7.5 ± 0.3b | 70.1 ± 2.6b | 263.6 ± 0.3b | 35.1 ± 0.3b | 1.2 ± 0.0a | 2.4 ± 0.1c |
| oak | 551.7 ± 10.5a | 6.9 ± 0.2c | 80.3 ± 2.2a | 290.0 ± 0.3a | 42.2 ± 0.3a | 0.9 ± 0.0c | 5.5 ± 0.1a |
2.3. DNA Extraction
2.4. PCR-DGGE
2.5. Calculations
2.6. Statistical Analysis
3. Results
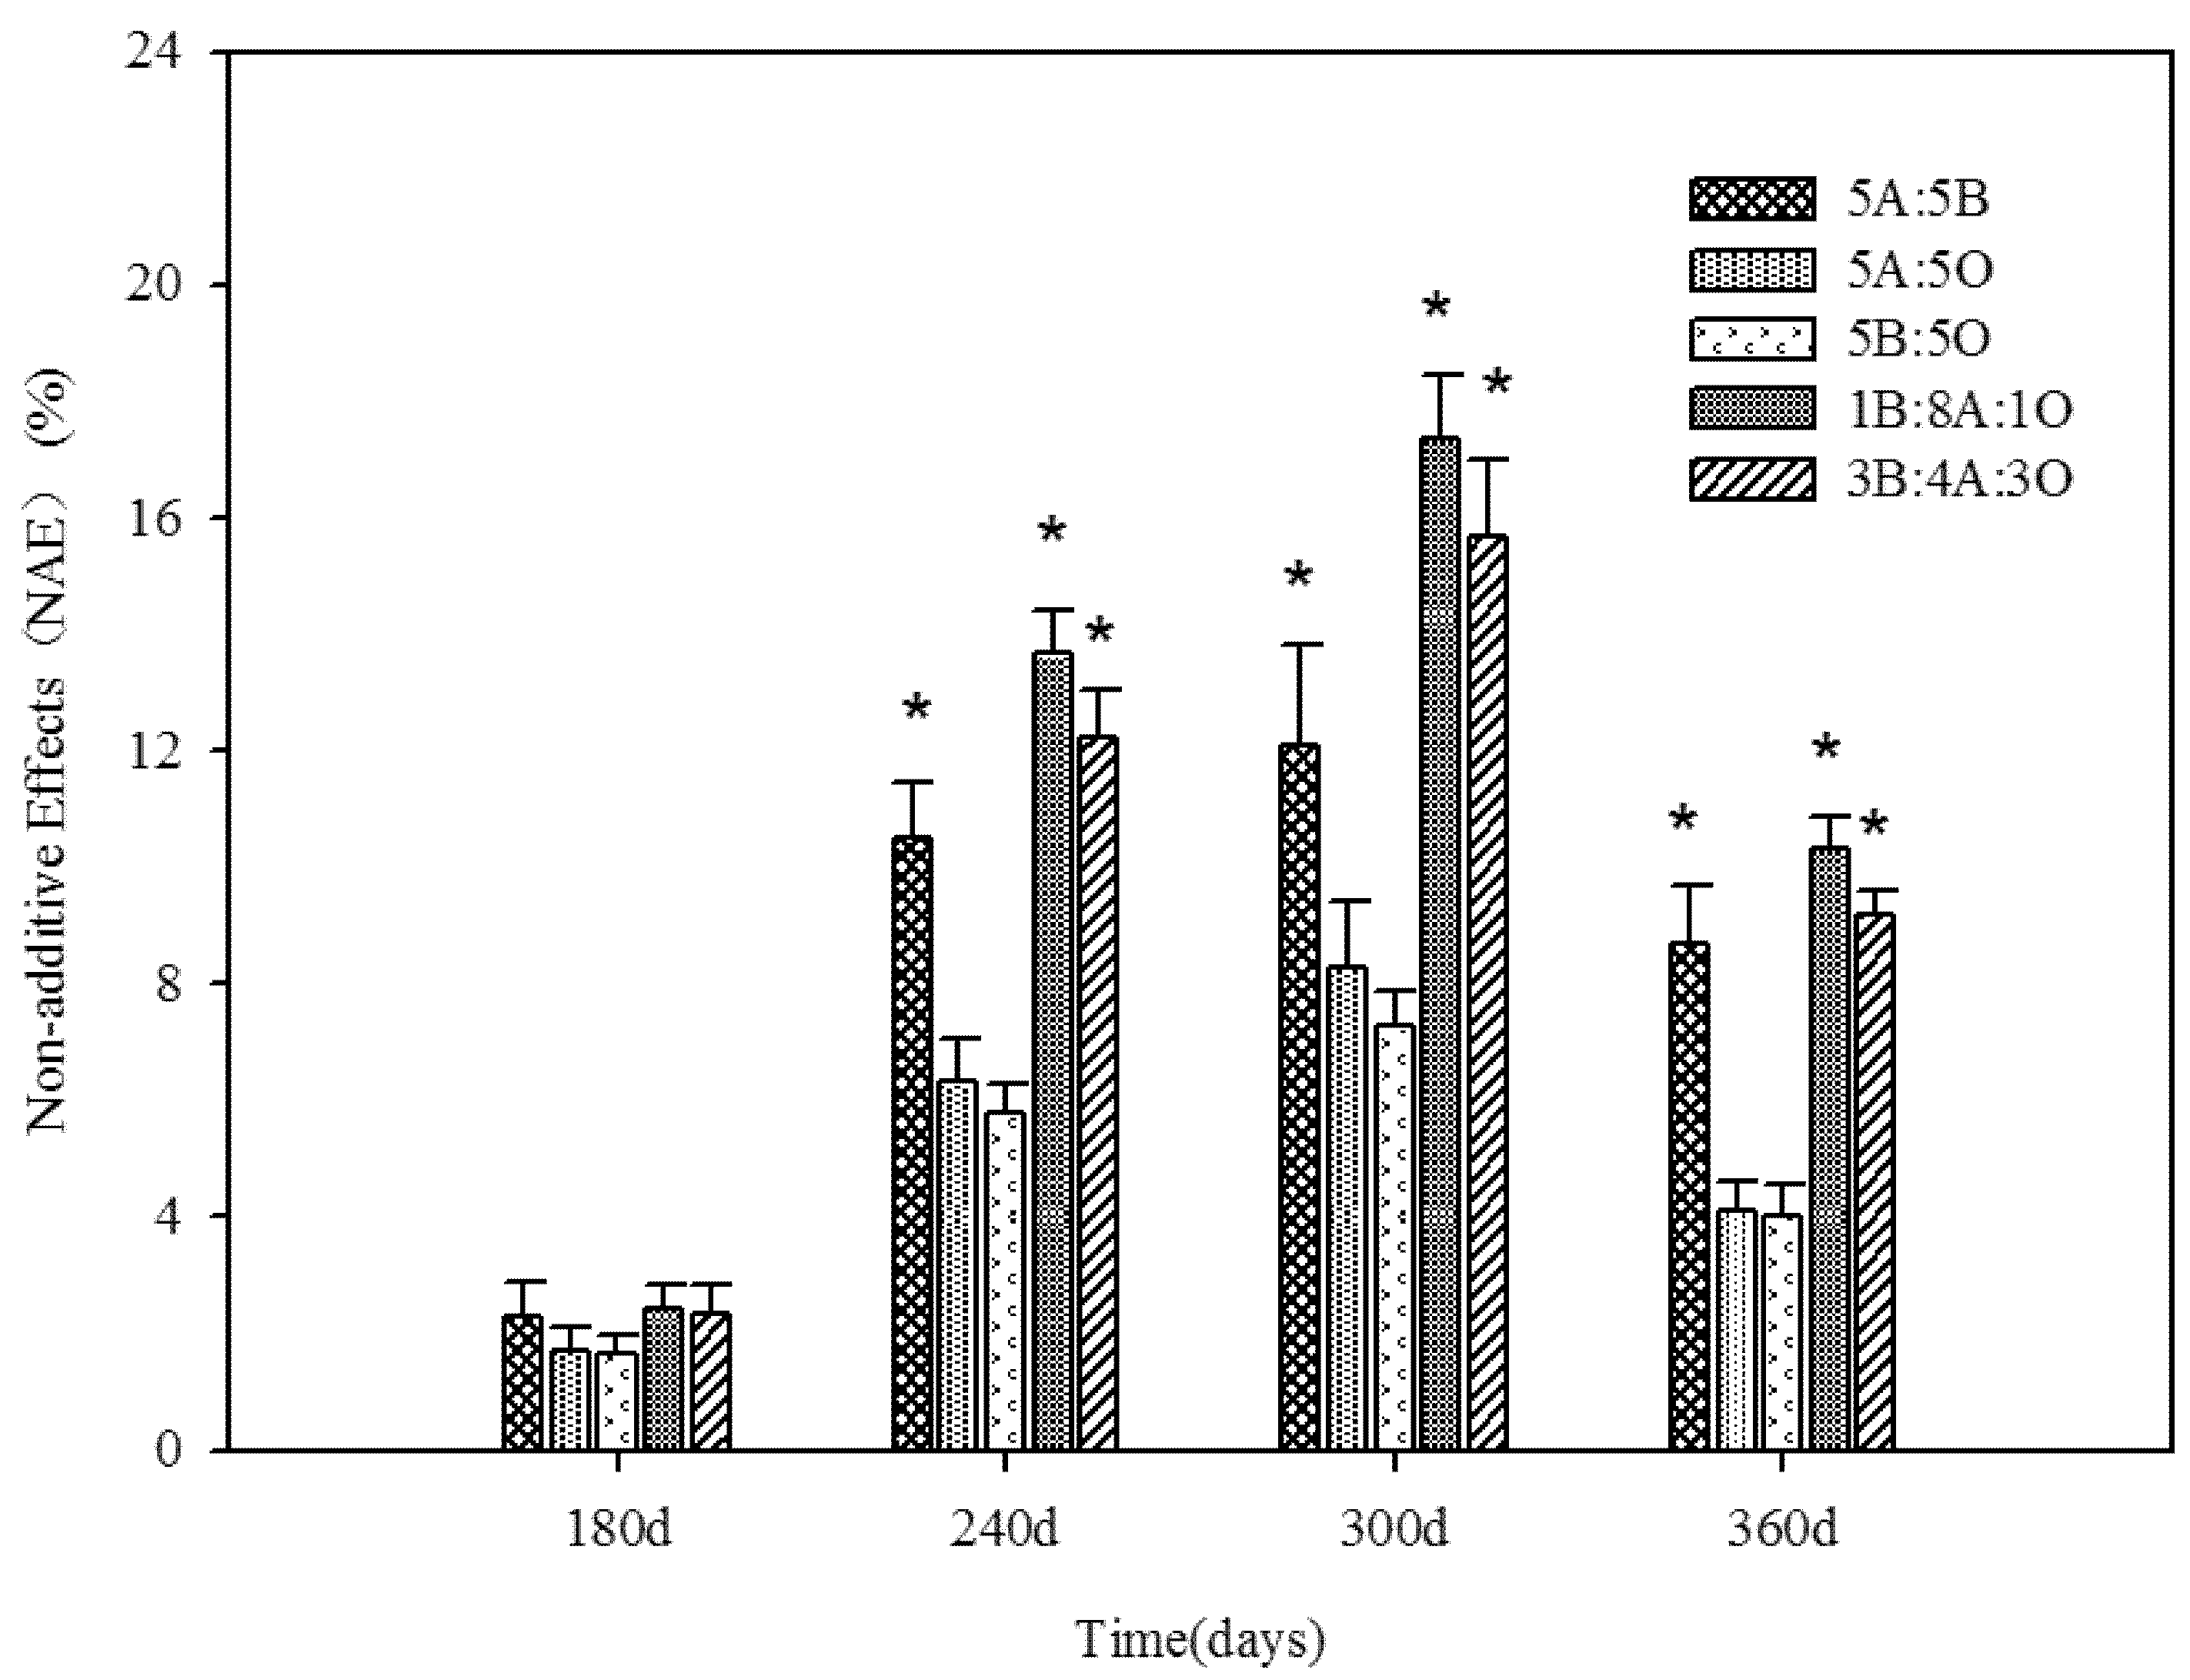
3.1. Mass Loss
| Mass Loss (%) | ||||||
|---|---|---|---|---|---|---|
| Individual litter | Litter mixtures | |||||
| Aspen | Birch | Oak | Observed | Predicted | Difference | |
| 10A | 46.6 ± 1.5d | 46.6 ± 1.5dC | ||||
| 10B | 43.6 ± 1.9d | 43.6 ± 1.9dD | ||||
| 10C | 28.0 ± 2.0b | 28.0 ± 2.0bF | ||||
| 5A:5B | 55.8 ± 1.8b | 52.9 ± 1.1b | 54.4 ± 1.5A | 45.1 | 9.3b | |
| 5A:5O | 49.7 ± 1.6c | 30.5 ± 1.9b | 40.2 ± 1.8E | 37.3 | 2.89c | |
| 5B:5O | 48.5 ± 1.2c | 30.5 ± 1.4b | 39.5 ± 1.3E | 35.8 | 3.7c | |
| 1B:8A:1O | 56.9 ± 1.3b | 56.2 ± 1.2a | 33.6 ± 1.2a | 54.5 ± 1.3A | 44.4 | 10.1a |
| 3B:4A:3O | 58.1 ± 1.3a | 55.0 ± 1.3a | 32.4 ± 1.3a | 49.5 ± 1.3B | 40.1 | 9.4b |
| Litter Fraction | Parameter a | Coefficient k | R2 | T50% | T95% |
|---|---|---|---|---|---|
| 10A | 102.7 ± 0.3b | 0.6 ± 0.0c | 0.98 | 1.1 ± 0.1d | 4.6 ± 0.2d |
| 10B | 99.9 ± 0.3d | 0.5 ± 0.0d | 0.97 | 1.3 ± 0.1c | 5.5 ± 0.3c |
| 10O | 104.2 ± 0.3a | 0.4 ± 0.0f | 0.98 | 1.8 ± 0.1a | 7.8 ± 0.3a |
| 5A:5B | 98.3 ± 0.3e | 0.7 ± 0.0b | 0.96 | 1.0 ± 0.1d | 4.4 ± 0.2d |
| 5A:5O | 98.9 ± 0.3e | 0.5 ± 0.0d | 0.97 | 1.3 ± 0.1c | 5.6 ± 0.2c |
| 5B:5O | 101.7 ± 0.3c | 0.5 ± 0.0e | 0.99 | 1.4 ± 0.1b | 6.2 ± 0.2b |
| 1B:8A:1O | 98.4 ± 0.3e | 0.7 ± 0.0a | 0.98 | 0.9 ± 0.1d | 4.1 ± 0.3d |
| 3B:4A:3O | 98.4 ± 0.3e | 0.7 ± 0.0c | 0.97 | 1.1 ± 0.1d | 4.6 ± 0.3d |

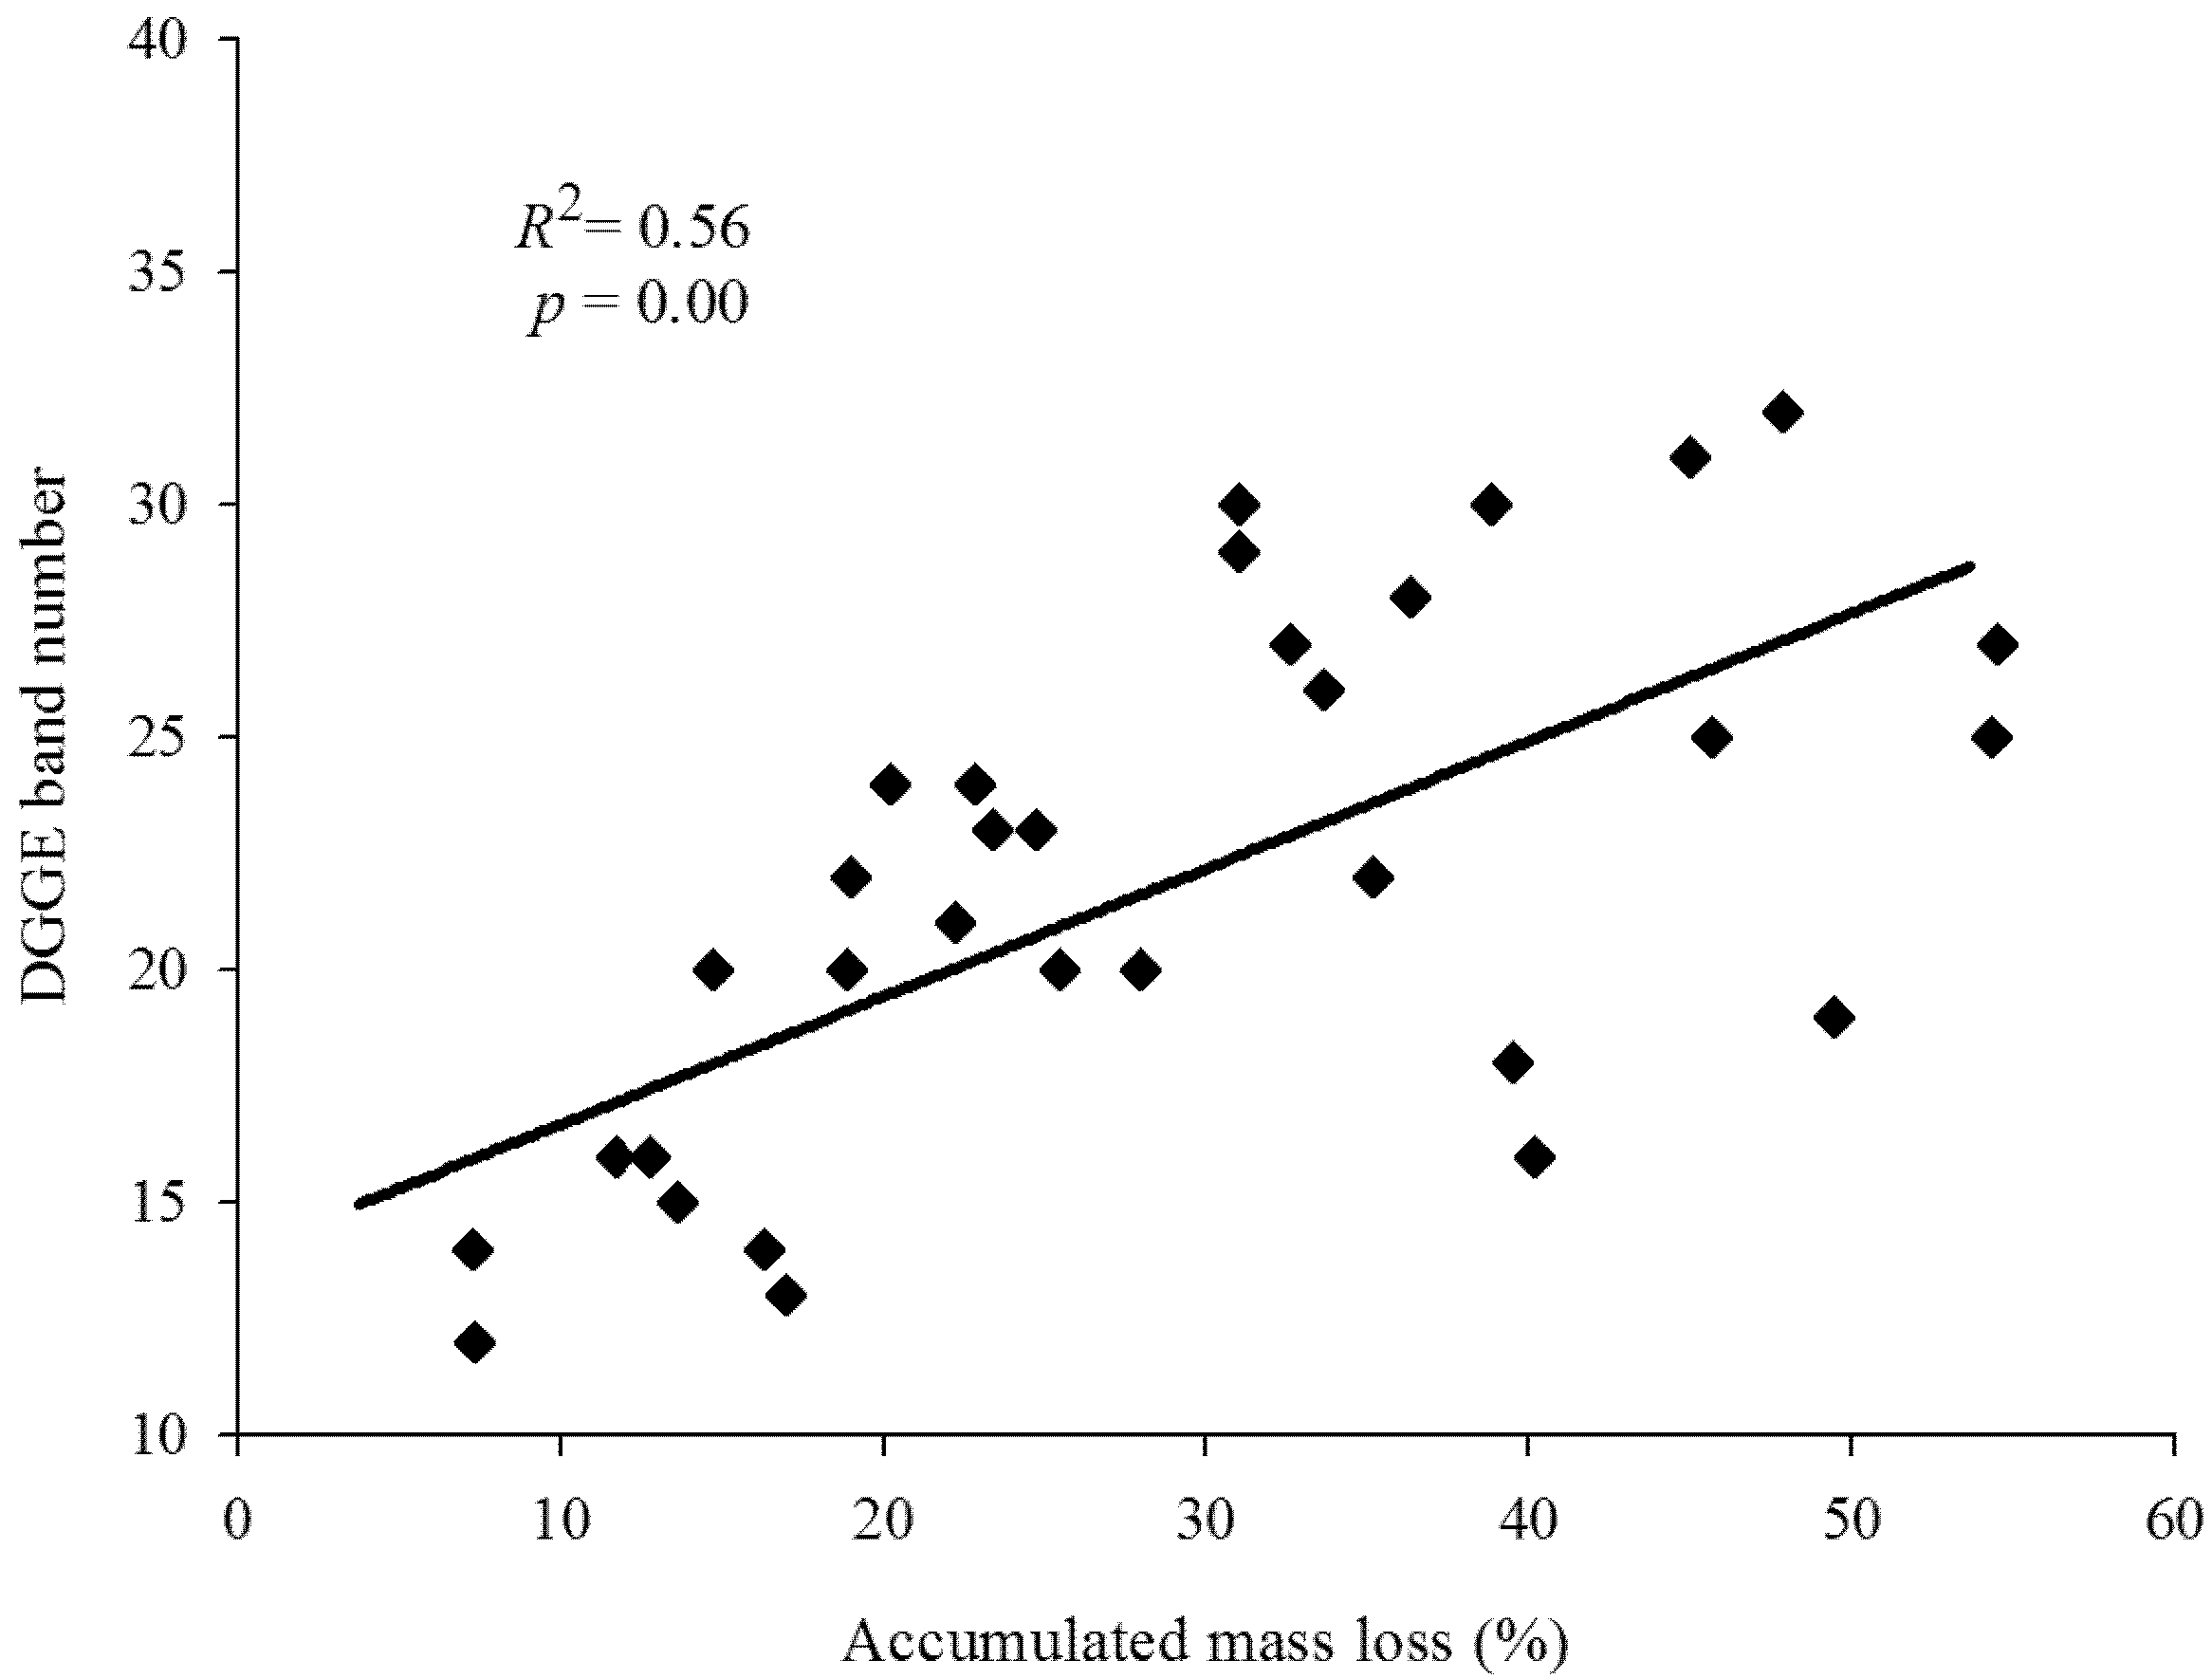
3.2. Fungal Community Based on PCR-DGGE
| Treatments | Sampling Time (day) | ||||
| 180 | 240 | 300 | 360 | ||
| 10A | H | 2.5 | 3.0 | 3.5 | 2.6 |
| S | 13 | 20 | 31 | 16 | |
| M | 18.3 | 26.7 | 38.9 | 46.6 | |
| 10B | H | 2.5 | 3.1 | 3.3 | 2.5 |
| S | 14 | 23 | 29 | 14 | |
| M | 16.5 | 25.5 | 38.4 | 45.6 | |
| 10O | H | 2.5 | 2.9 | 3.1 | 3.0 |
| S | 12 | 20 | 24 | 20 | |
| M | 7.3 | 14.7 | 22.9 | 28.0 | |
| 5A:5B | H | 3.0 | 3.3 | 3.2 | 3.2 |
| S | 20 | 29 | 23 | 25 | |
| M | 21.6 | 40.8 | 45.3 | 54.4 | |
| 5A:5O | H | 2.7 | 3.2 | 3.0 | 2.7 |
| S | 15 | 23 | 20 | 16 | |
| M | 18.2 | 26.4 | 40.0 | 48.3 | |
| 5B:5O | H | 2.7 | 3.0 | 3.2 | 2.9 |
| S | 16 | 21 | 25 | 18 | |
| M | 13.9 | 22.0 | 32.5 | 39.5 | |
| 1B:8A:1O | H | 3.2 | 3.2 | 3.4 | 3.1 |
| S | 24 | 24 | 32 | 24 | |
| M | 23.6 | 42.5 | 47.6 | 54.5 | |
| 3B:4A:3O | H | 3.0 | 3.4 | 3.4 | 2.9 |
| S | 22 | 31 | 30 | 19 | |
| M | 20.4 | 39.5 | 43.5 | 52.6 | |
4. Discussion
5. Conclusions
Acknowledgments
Author Contributions
Conflicts of Interest
References
- Fuqiang, S.; Xiaoxu, F.; Ruiqing, S. Review of mixed forest litter decomposition researches. Acta Ecol. Sin. 2010, 30, 221–225. [Google Scholar]
- Aerts, R. Climate, leaf litter chemistry and leaf litter decomposition in terrestrial ecosystem; a triangular relationship. Oikos 1997, 79, 439–449. [Google Scholar] [CrossRef]
- Cornwell, W.K.; Cornelissen, J.H.C.; Amatangelo, K.; Dorrepaal, E.; Eviner, V.T.; Godoy, O.; Hobbie, S.E.; Hoorens, B.; Kurokaw, H.; Perez Harguindeguy, H.; et al. Plant species traits are the predominant control on litter decomposition rates within biomes worldwide. Ecol. Lett. 2008, 11, 1065–1071. [Google Scholar] [CrossRef] [PubMed]
- Aponte, C.; Garcia, L.V.; Maranon, T. Tree Species Effect on Litter Decomposition and Nutrient Release in Mediterranean Oak Forests Changes over Time. Ecosystems 2012, 15, 1204–1218. [Google Scholar] [CrossRef] [Green Version]
- Cleveland, C.C.; Reed, S.C.; Keller, A.B.; Nemergut, D.R.; O’Neill, S.P.; Ostertag, R.; Vitousek, P.M. Litter quality versus soil microbial community controls over decomposition: A quantitative analysis. Oecologia 2014, 174, 283–294. [Google Scholar] [CrossRef] [PubMed]
- Taylor, B.R.; Parkinson, D.; Parsons, W.F.J. Nitrogen and lignin content as predictors of litter decay rates: A microcosm test. Ecology 1989, 70, 97–104. [Google Scholar] [CrossRef]
- Polyakova, O.; Billor, N. Impact of deciduous tree species on litterfall quality, decomposition rates and nutrient circulation in pine stands. For. Ecol. Manag. 2007, 253, 11–18. [Google Scholar] [CrossRef]
- Hobbie, S.E.; Reich, P.B.; Oleksyn, J.; Ogdahl, M.; Zytkowiak, R.; Hale, C.; Karolewski, P. Tree species effects on decomposition and forest floor dynamics in a common garden. Ecology 2006, 87, 2288–2297. [Google Scholar] [CrossRef]
- Berg, B.; Steffen, K.; McClaugherty, C. Litter decomposition rate is dependent on litter Mn concentrations. Biogeochemistry 2007, 82, 29–39. [Google Scholar] [CrossRef]
- Dorrepaal, E.; Cornelissen, J.H.C.; Aerts, R.; Wallén, B.; van Logtestijn, R.S.P. Are growth forms consistent predictors of leaf litter quality and decomposability across peatlands along a latitudinal gradient? J. Ecol. 2005, 93, 817–828. [Google Scholar] [CrossRef]
- De Marco, A.; Meola, A.; Maisto, G.; Giordano, M.; De Santo, A.V. Non-additive effects of litter mixtures on decomposition of leaf litters in a Mediterranean maquis. Plant Soil 2011, 344, 305–317. [Google Scholar] [CrossRef]
- Gartner, T.B.; Cardon, Z.G. Decomposition dynamics in mixed-species leaf litter a review. Oikos 2004, 104, 230–246. [Google Scholar] [CrossRef]
- Ostrofsky, M.L. A comment on the use of exponential decay models to test non-additive processing hypotheses in multispecies mixtures of litter. J. N. Am. Benthol. Soc. 2007, 26, 23–27. [Google Scholar] [CrossRef]
- McTiernan, K.B.; Ineson, P.; Coward, P.A. Respiration and nutrient release from tree leaf litter mixtures. Oikos 1997, 78, 527–538. [Google Scholar] [CrossRef]
- Hättenschwiler, S.; Vitousek, P.M. The role of polyphenols in terrestrial ecosystem nutrient cycling. Trends Ecol. Evol. 2000, 15, 238–243. [Google Scholar] [CrossRef]
- Handa, T.; Aerts, R.; Berendse, F.; Berg, M.P.; Bruger, A.; Butenschoen, O.; Chauvet, E.; Gessner, M.O.O.; Jabiol, J.; Makkonen, M.; Mckie, B.G.; Malmqrist, B.; Peeters, E.T.H.M.; Scheu, S.; Schmd, B.; Ruijven, J.; Vos, V.C.A.; Hättenschwiler, S. Consequences of biodiversity loss for litter decomposition across biomes. Nature 2014, 509, 218–221. [Google Scholar] [PubMed]
- Fuzhong, W.; Changhui, P.; Wanqin, Y.; Jian, Z.; Yu, H.; Tao, M. Admixture of alder (Alnus formosana) litter can improve the decomposition of eucalyptus (Eucalyptus grandis) litter. Soil Biol. Biochem. 2014, 73, 115–121. [Google Scholar]
- Rasche, F.; Cadisch, G. The molecular microbial perspective of organic matter turnover and nutrient cycling in tropical agroecosystems—What do we know? Biol. Fertil. Soils 2013, 49, 251–262. [Google Scholar] [CrossRef]
- Berg, B.; Laskowski, R.; Caswell, H. Litter decomposition: A guide to carbon and nutrient turnover. Adv. Ecol. Res. 2006, 38, 20–182. [Google Scholar]
- Moller, J.; Miller, M.; Kjoller, A. Fungal-bacterial interaction on beech leaves: Influence on decomposition and dissolved organic carbon quality. Soil Biol. Biochem. 1999, 31, 367–374. [Google Scholar] [CrossRef]
- Xiaoxu, F.; Fuqiang, S. Dynamics of fungal diversity in different phases of Pinus litter degradation revealed through denaturing gradient gel electrophoresis (DGGE) coupled with morphological examination. Afr. J. Microbiol. Res. 2011, 5, 5674–5681. [Google Scholar]
- Orwin, K.H.; Wardle, D.A.; Greenfield, L.G. Ecological consequences of carbon substrate identity and diversity in a laboratory study. Ecology 2006, 87, 580–593. [Google Scholar] [CrossRef] [PubMed]
- Aly, A.H.; Debbab, A.; Kjer, J.; Proksch, P. Fungal endophytes from higher plants: A prolific source of phytochemicals and other bioactive natural products. Fungal Divers. 2010, 41, 1–16. [Google Scholar] [CrossRef]
- Xu, J.; Ebada, S.S.; Proksch, P. Pestalotiopsis a highly creative genus: Chemistry and bioactivity of secondary metabolites. Fungal Divers. 2010, 44, 15–31. [Google Scholar] [CrossRef]
- Giordano, L.; Gonthier, P.; Varese, G.C.; Miserere, L.; Nicolotti, G. Mycobiota inhabiting sapwood of healthy and declining Scots pine (Pinus sylvestris L.) trees in the Alps. Fungal Divers. 2009, 38, 69–83. [Google Scholar]
- Hossain, M.Z.; Sugiyama, S. Influences of plant litter diversity on decomposition, nutrient mineralization and soil microbial community structure. Jpn. Soc. Grassl. Sci. 2010, 57, 72–80. [Google Scholar] [CrossRef]
- Anzhou, M.; Xuliang, Z.; Junmei, W.; Mengmeng, C.; Di, L.; Chunzhao, L.; Guoqiang, Z. Ascomycota Members Dominate Fungal Communities during Straw Residue Decomposition in Arable Soil. PLoS ONE 2013, 8, e66146. [Google Scholar]
- Ming, N.; Han, M.; Ke, L.; Jiarong, W.; Zhexue, Q.; Changming, F.; Jiakuan, C.; Bo, L. Comparison of bacterial and fungal communities between natural and planted pine forests in subtropical China. Current Microbiology 2012, 64, 34–42. [Google Scholar]
- Dongdong, W.; Tingting, L.; Shiqiang, W. Time and litter species composition affect litter-mixing effects on decomposition rates. Plant Soil 2013, 371, 355–366. [Google Scholar]
- Daijiang, L.; Shaolin, P.; Baoming, C. The effects of leaf litter evenness on decomposition depend on which plant functional group is dominant. Plant Soil 2013, 365, 255–266. [Google Scholar]
- Jinlong, Z.; Fengfeng, K.; Luoxin, W.; Xiaowen, Y.; Weihong, Z.; Xiaoshuai, S.; Yanlei, Z.; Feng, C.; Yu, S.; Tengfei, H.; et al. Patterns of Biomass and Carbon Distribution across a Chronosequence of Chinese Pine (Pinus tabulaeformis) Forests. PLoS ONE 2014, 9, e94966. [Google Scholar]
- World Soil Resources Report No. 103. In World Reference Base for Soil Resources; FAO, ISRIC, ISSS: Rome, Italy, 2006.
- Forestry Standards “Observation Methodology for Long-Term Forest Ecosystem Research” of People’s Republic of China (LY/T 1952-2011); FERN: Beijing, China, 2011.
- Karberg, N.J.; Scott, N.A.; Giardina, C.P. Methods for estimating litter decomposition. In Field Measurements for Forest Carbon Monitoring; Hoover, C.M., Ed.; Springer: New York, NY, USA, 2008; pp. 103–110. [Google Scholar]
- Griffiths, R.I.; Whiteley, A.S.; O’Donnell, A.G.; Bailey, M.J. Rapid method for coextraction of DNA and RNA from natural environments for analysis of ribosomal DNA- and rRNA-Based microbial community composition. Appl. Environ. Microbiol. 2000, 66, 5488–5491. [Google Scholar] [CrossRef] [PubMed]
- White, T.J.; Bruns, T.; Lee, S.; Taylor, J. Amplification and direct sequencing of fungal ribosomal RNA genes for phylogenetics. In PCR Protocols-A Guide to Methods and Applications; Michael, A.I., David, H.G., John, J.S., Thomas, J.W., Eds.; Academic Press: San Diego, CA, USA, 1990; pp. 315–322. [Google Scholar]
- Muyzer, G.; Smalla, K. Application of denaturing gradient gel electrophoresis (DGGE) and temperature gradient gel electrophoresis (TGGE) in microbial ecology. Antonie Leeuwenhoek 1998, 73, 127–141. [Google Scholar] [CrossRef] [PubMed]
- Radojkovic, D.; Kusic, J. Silver staining of denaturing gradient gel electro-phoresis gels. Clin. Chem. 2000, 46, 883–884. [Google Scholar] [PubMed]
- Bell, T.; Ager, D.; Song, J.I.; Newman, J.A.; Thompson, I.P.; Lilley, A.K.; van der Gast, C.J. Larger islands house more bacterial taxa. Science 2005, 308, 1884. [Google Scholar] [CrossRef] [PubMed]
- Reche, I.; Pulido-Villena, E.; Morales-Baquero, R.; Casamayor, E.O. Does ecosystem size determine aquatic bacterial richness? Ecology 2005, 86, 1715–1722. [Google Scholar] [CrossRef]
- Trevors, J.T.; Kevan, P.G.; Tam, L. Microbial diversity across a Canadian sub-Arctic, isostatically rebounding, soil transect. Polar Sci. 2010, 4, 81–91. [Google Scholar] [CrossRef]
- Olson, J.S. Energy storage and balance of producers and decomposers in ecological systems. Ecology 1963, 44, 322–331. [Google Scholar] [CrossRef]
- Baerlocher, F. Leaf mass loss estimated by litter bag technique. In Methods to Study Litter Decomposition—A Practical Guide; Graca, M.A.S., Barlocher, F., Gessner, M.O., Eds.; Springer-Verlag New York: Dordrecht, Netherlands, 2007; pp. 37–42. [Google Scholar]
- Hoorens, B.; Stroetenga, M.; Aerts, R. Litter mixture interactions at the level of plant functional types are additive. Ecosystems 2010, 13, 90–98. [Google Scholar] [CrossRef]
- Wardle, D.A.; Bonner, K.I.; Nicholson, K.S. Biodiversity and plant litter: Experimental evidence which does not support the view that enhanced species richness improves ecosystem function. Oikos 1997, 79, 247–258. [Google Scholar] [CrossRef]
- Chapman, S.K.; Koch, G.W. What type of diversity yields synergy during mixed litter decomposition in a natural forest ecosystem. Plant Soil 2007, 299, 153–162. [Google Scholar] [CrossRef]
- Schimel, J.P.; Hättenschwiler, S. Nitrogen transfer between decomposing leaves of different N status. Soil Biol. Biochem. 2007, 39, 1428–1436. [Google Scholar] [CrossRef]
- Gessner, M.O.; Swan, C.M.; Dang, C.K.; Mckie, B.G.; Bardgett, R.D.; Wall, D.H.; Hättenschwiler, S. Diversity meets decomposition. Trends Ecol. Evol. 2010, 25, 372–380. [Google Scholar] [CrossRef] [PubMed]
- Swan, C.M.; Palmer, M.A. Preferential feeding by an aquatic consumer mediates non-additive decomposition of species leaf litter. Oecologia 2006, 149, 107–114. [Google Scholar] [CrossRef] [PubMed]
- Qingkui, W.; Silong, W.; Yu, H. Leaf litter decomposition in the pure and mixed plantations of Cunninghamia lanceolata and Michelia macclurei in subtropical China. Biol. Fertil. Soil 2009, 45, 371–377. [Google Scholar]
- Kalbitz, K.; Solinger, S.; Park, J.H.; Michalzik, B.; Matzner, E. Controls on the dynamics of dissolved organic matter in soils: A review. Soil Sci. 2000, 165, 277–304. [Google Scholar] [CrossRef]
- Neff, J.C.; Asner, G.P. Dissolved Organic Carbon in Terrestrial Ecosystems: Synthesis and a Model. Ecosystems 2001, 4, 29–48. [Google Scholar] [CrossRef]
- Marlin, P.S.; Arredondo-Moreno, J.T.; Elisabeth, H.S. Early stage of single and mixed leaf-litter decomposition in semiarid forest pine-oak: The role of rainfall and microsite. Biogeochemistry 2012, 108, 245–258. [Google Scholar]
- Hoorens, B.; Coomes, D.; Aerts, R. Neighbour identity hardly affects litter-mixture effects on decomposition rates of New Zealand forest species. Oecologia 2009, 162, 479–489. [Google Scholar] [CrossRef] [PubMed]
- Pauly, M.; Keegstra, K. Cell-wall carbohydrates and their modification as a resource for biofuels. Plant J. 2008, 54, 559–568. [Google Scholar] [CrossRef] [PubMed]
- Wardle, D.A.; Yeates, G.W.; Barker, G.M.; Bonner, K.I. The influence of plant litter diversity on decomposer abundance and diversity. Soil Biol. Biochem. 2006, 38, 1052–1062. [Google Scholar] [CrossRef]
- Hector, A.; Beale, A.J.; Minns, A.; Otway, S.J.; Lawton, J.H. Consequences of the reduction of plant diversity for litter decomposition: Effects through litter quality and microenvironment. Oikos 2000, 90, 357–371. [Google Scholar] [CrossRef]
- Lecerf, A.; Marie, G.; Kominoski, J.S.; LeRoy, C.J.; Bernadet, C.; Swan, C.M. Incubation time, functional litter diversity, and habitat characteristics predict litter-mixing effects on decomposition. Ecology 2011, 92, 160–169. [Google Scholar] [CrossRef] [PubMed]
© 2015 by the authors; licensee MDPI, Basel, Switzerland. This article is an open access article distributed under the terms and conditions of the Creative Commons Attribution license (http://creativecommons.org/licenses/by/4.0/).
Share and Cite
Gao, J.; Kang, F.; Li, T.; Song, X.; Zhao, W.; Yu, X.; Han, H. Assessing the Effect of Leaf Litter Diversity on the Decomposition and Associated Diversity of Fungal Assemblages. Forests 2015, 6, 2371-2386. https://doi.org/10.3390/f6072371
Gao J, Kang F, Li T, Song X, Zhao W, Yu X, Han H. Assessing the Effect of Leaf Litter Diversity on the Decomposition and Associated Diversity of Fungal Assemblages. Forests. 2015; 6(7):2371-2386. https://doi.org/10.3390/f6072371
Chicago/Turabian StyleGao, Jing, Fengfeng Kang, Tianyu Li, Xiaoshuai Song, Weihong Zhao, Xiaowen Yu, and Hairong Han. 2015. "Assessing the Effect of Leaf Litter Diversity on the Decomposition and Associated Diversity of Fungal Assemblages" Forests 6, no. 7: 2371-2386. https://doi.org/10.3390/f6072371