
Modelling Facilitates Silvicultural Decision-Making for Improving the Mitigating Effect of Beech (Fagus Sylvatica L.) Dominated Alpine Forest against Rockfall


Abstract
:
1. Introduction
2. Materials and Methods
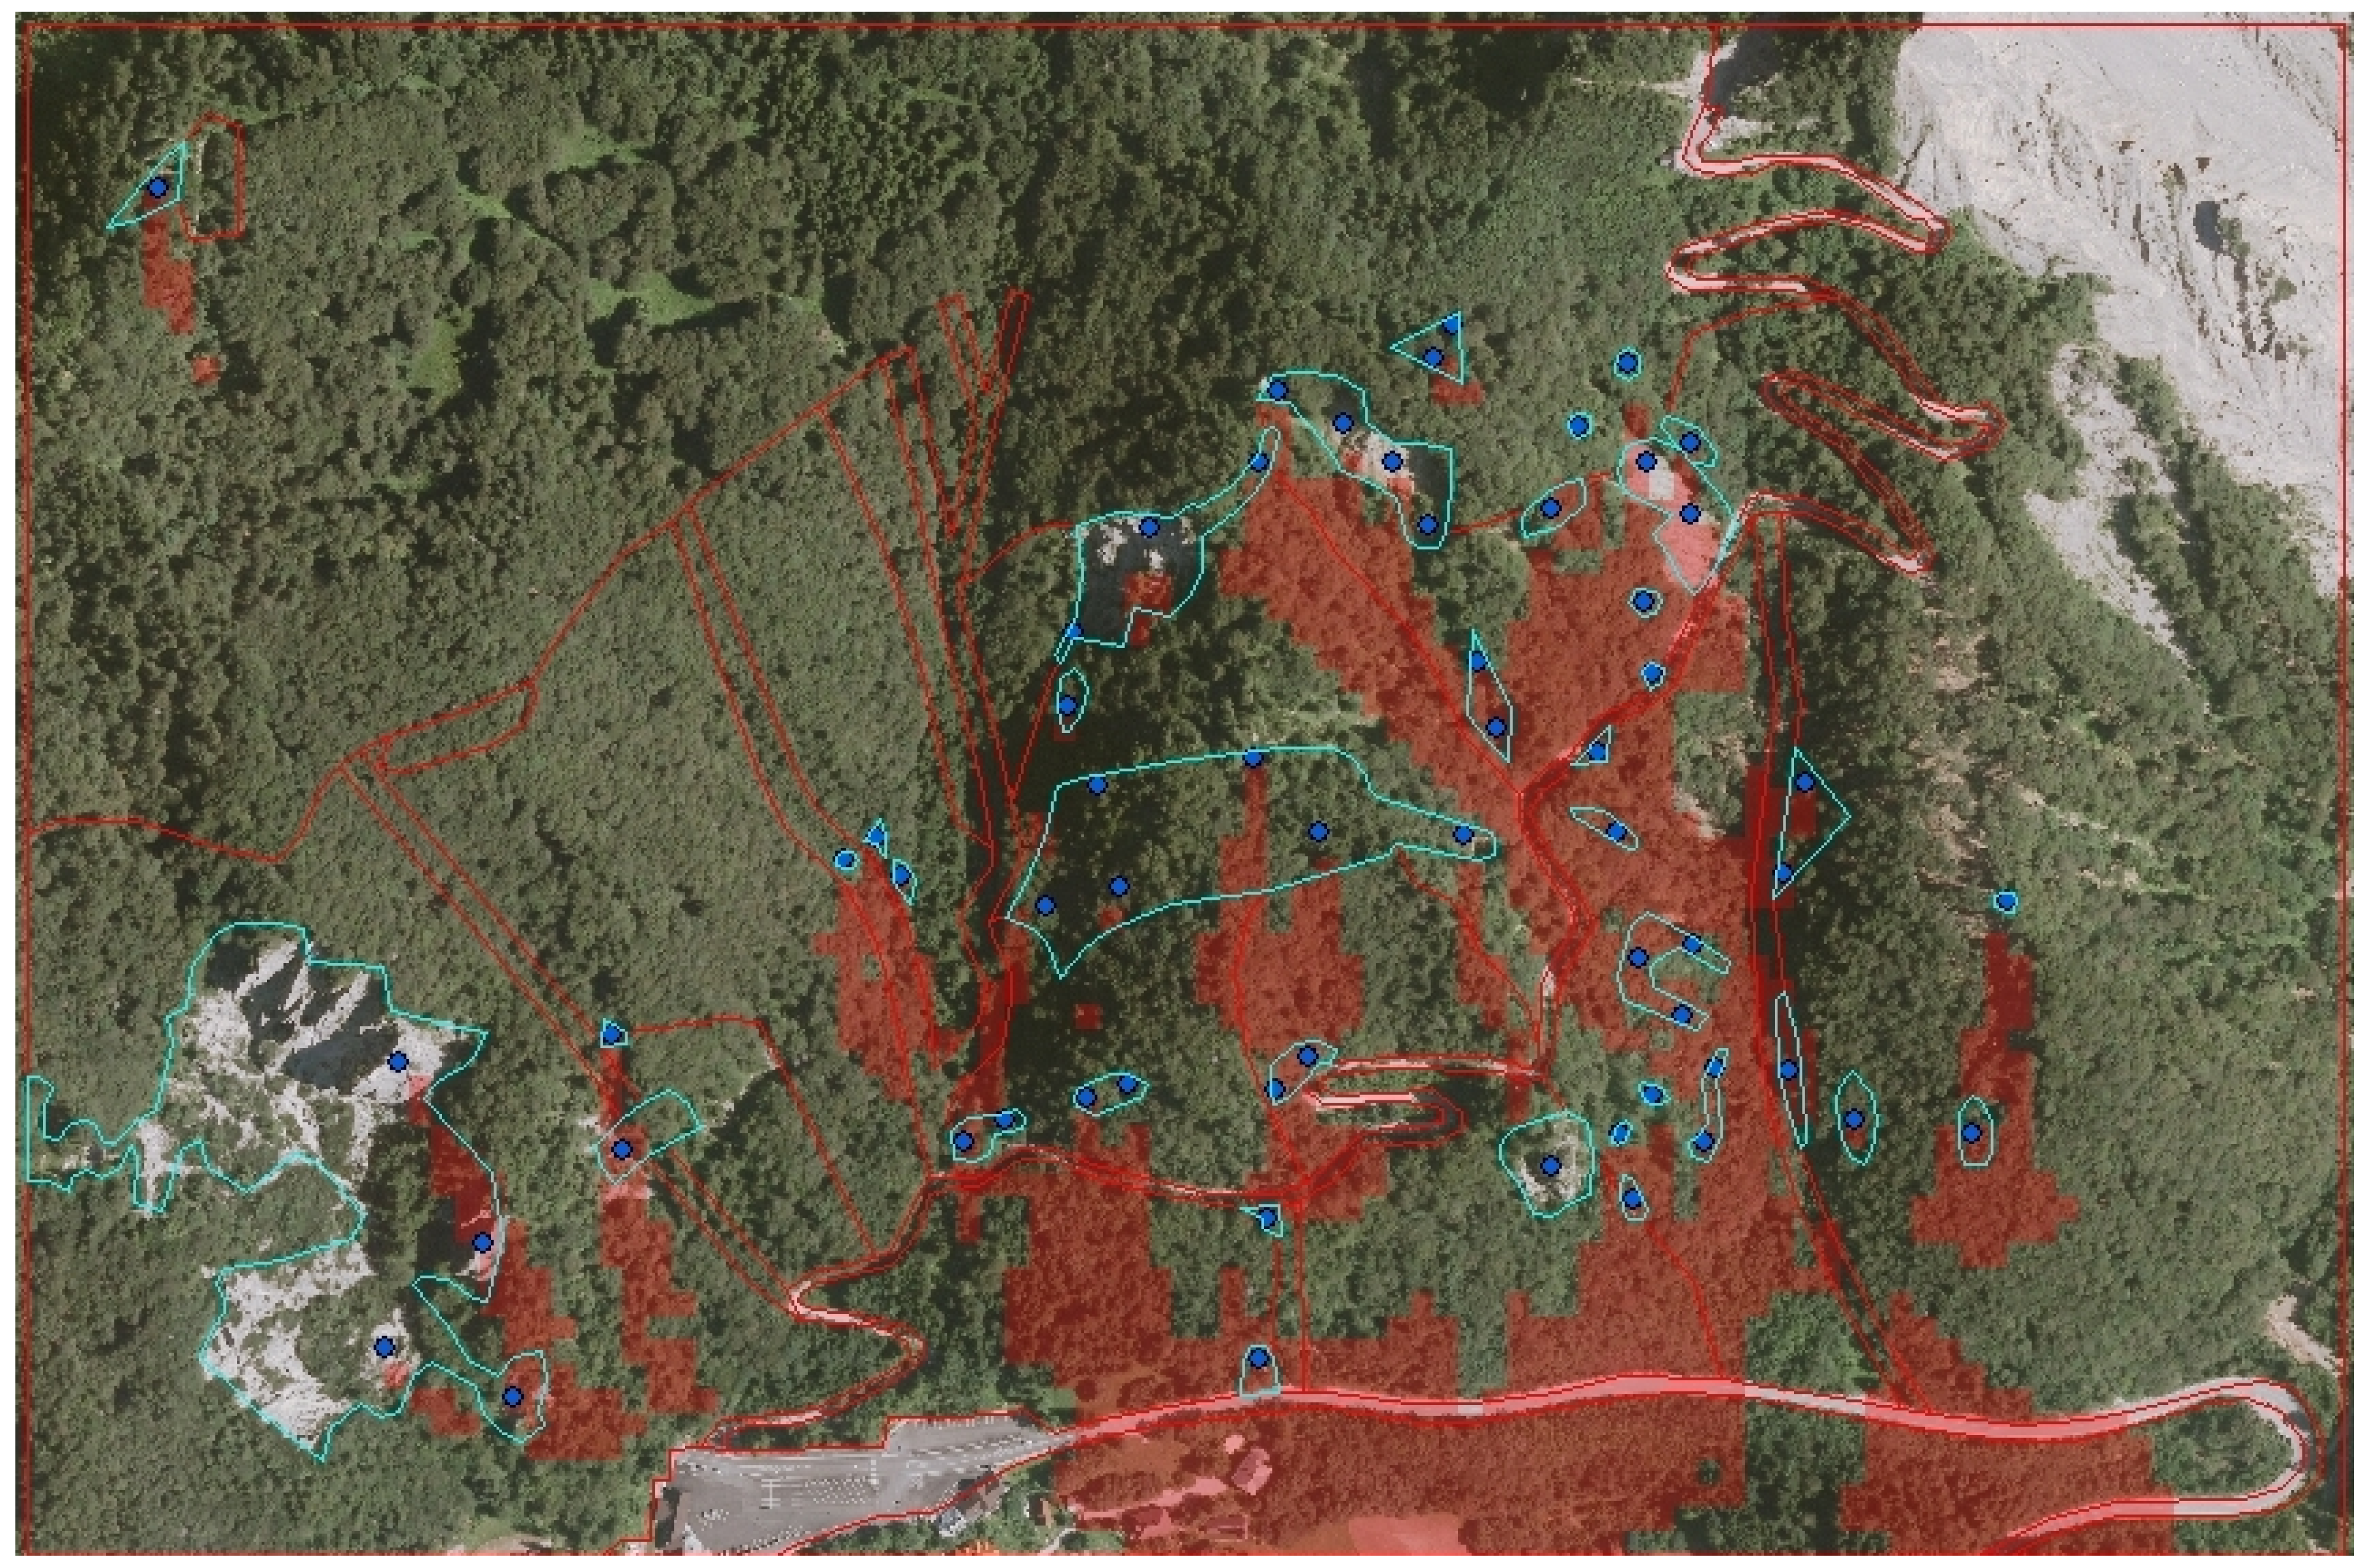
2.1. Stand and Site Characteristics
2.2. Recordings
2.3. Expert Assessment of Forest Protection Functions and Target Forest Profiles
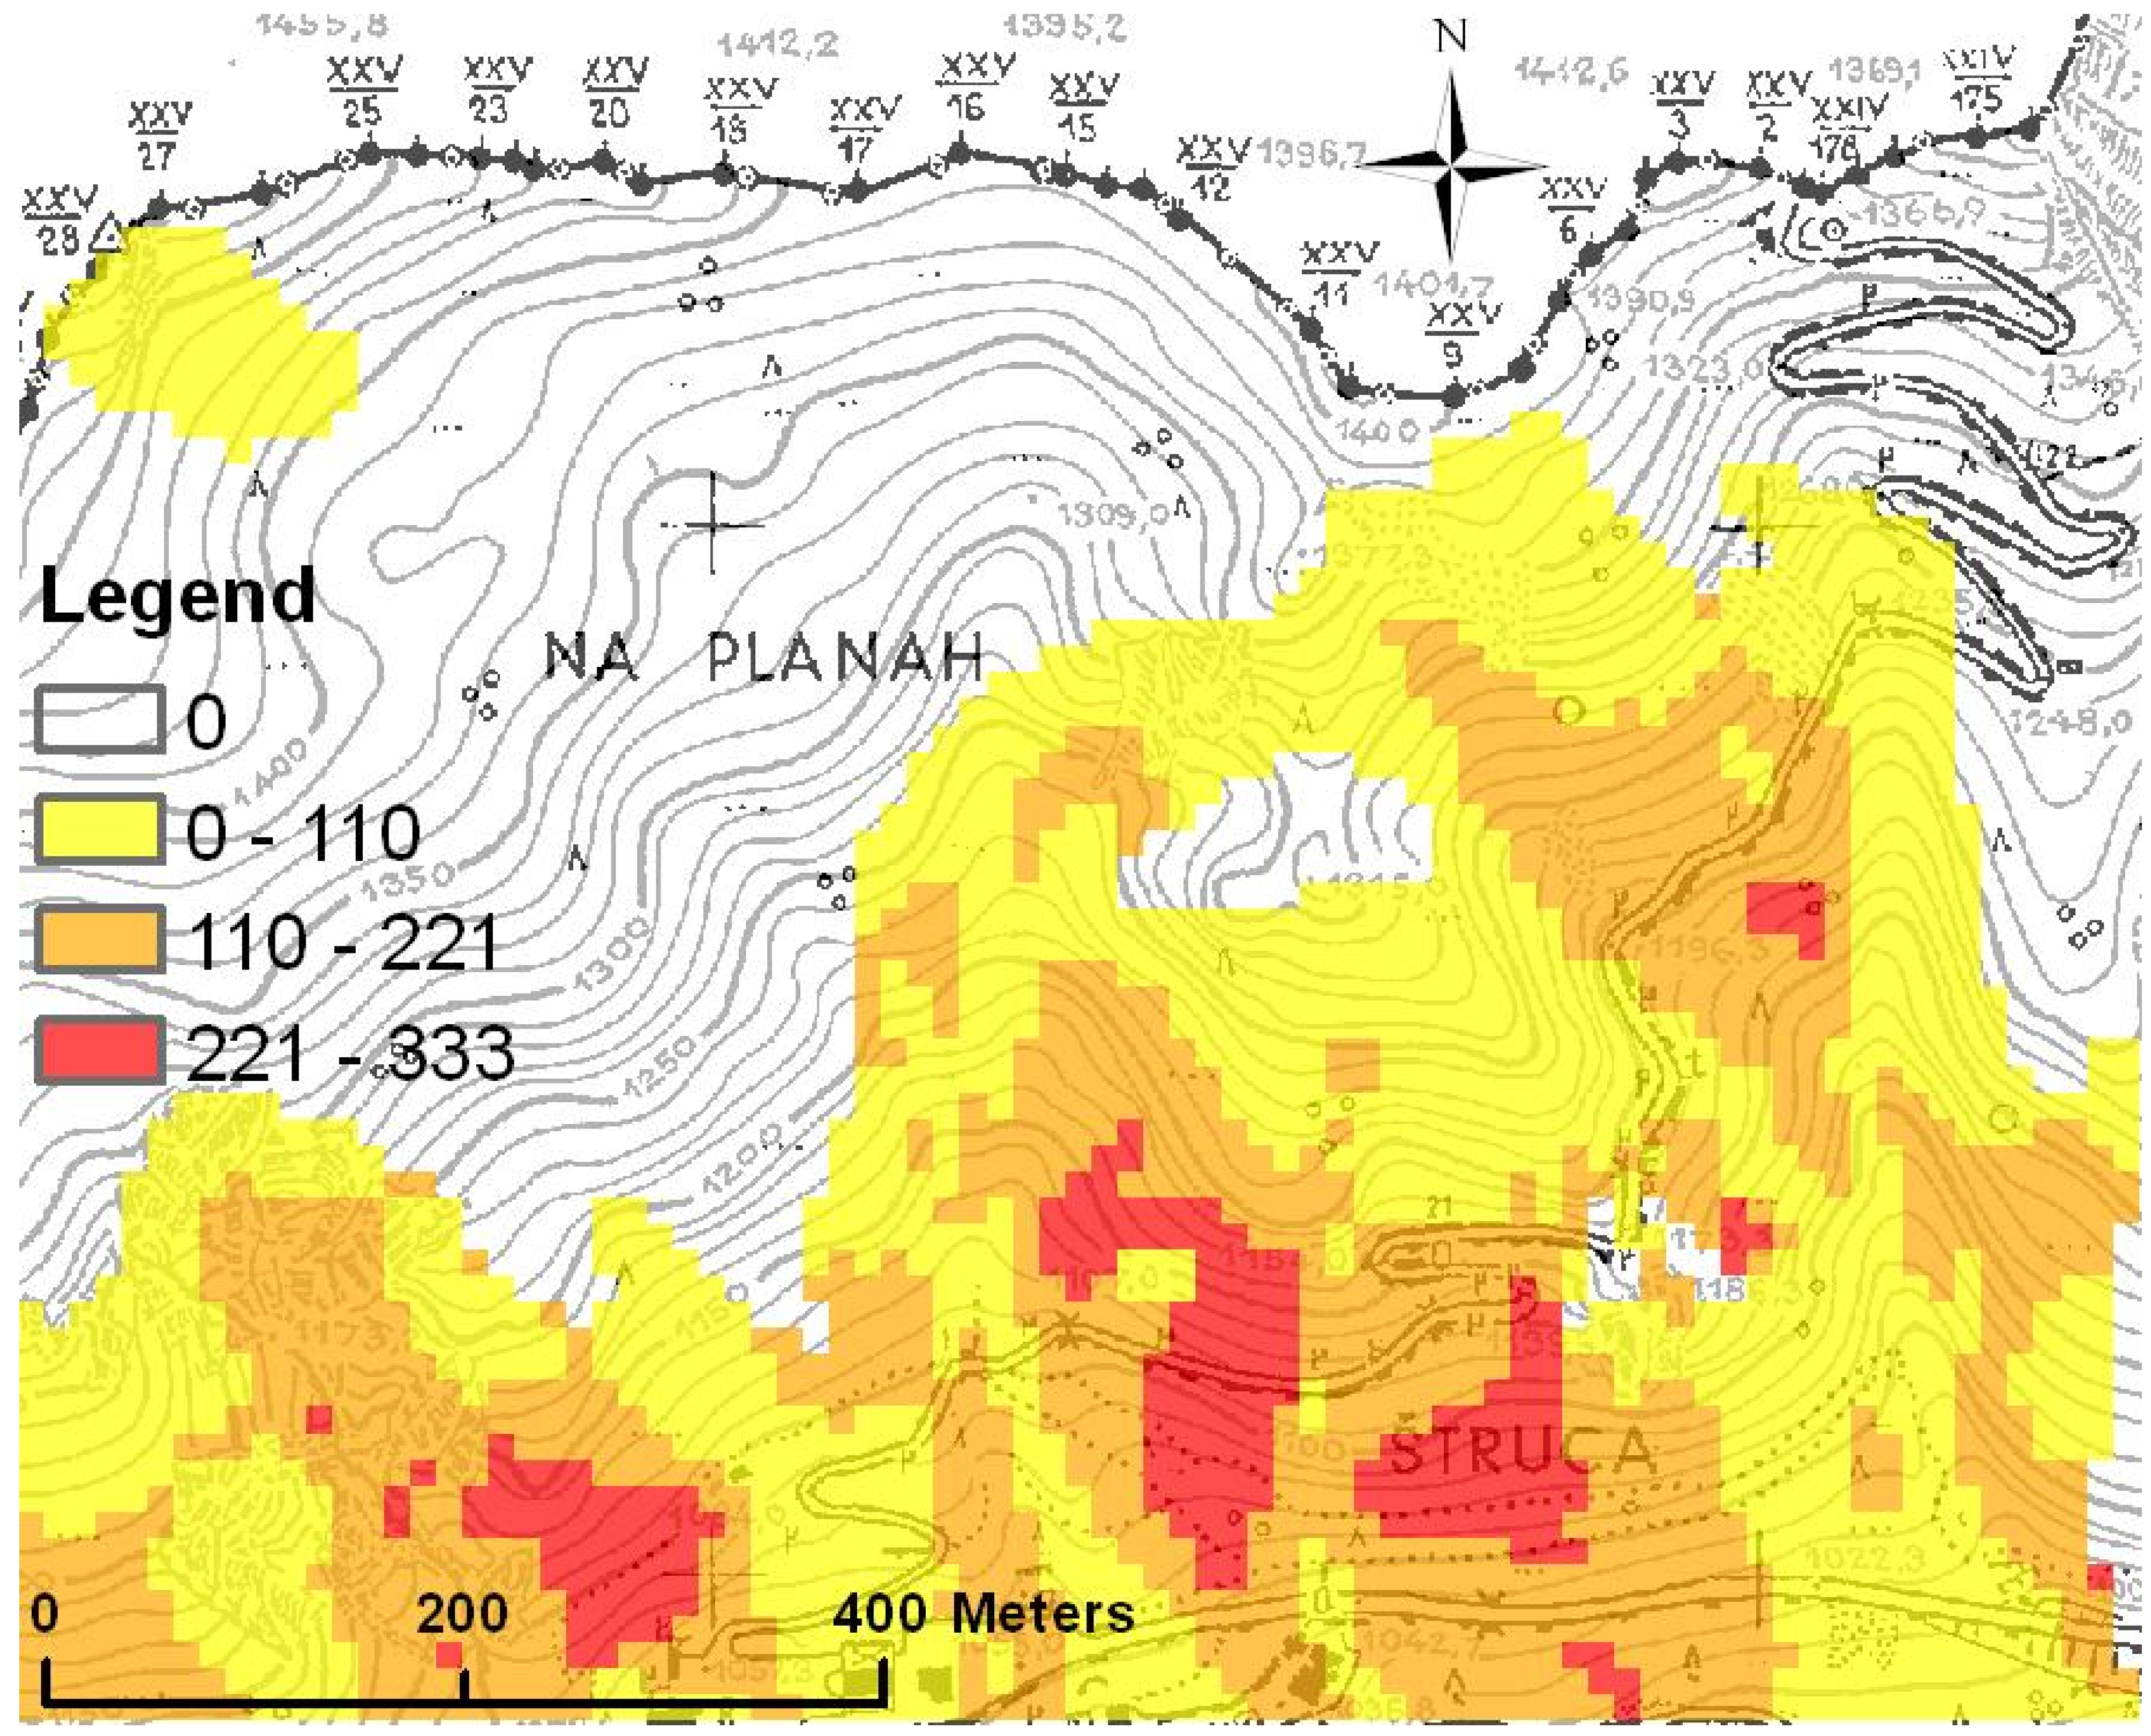
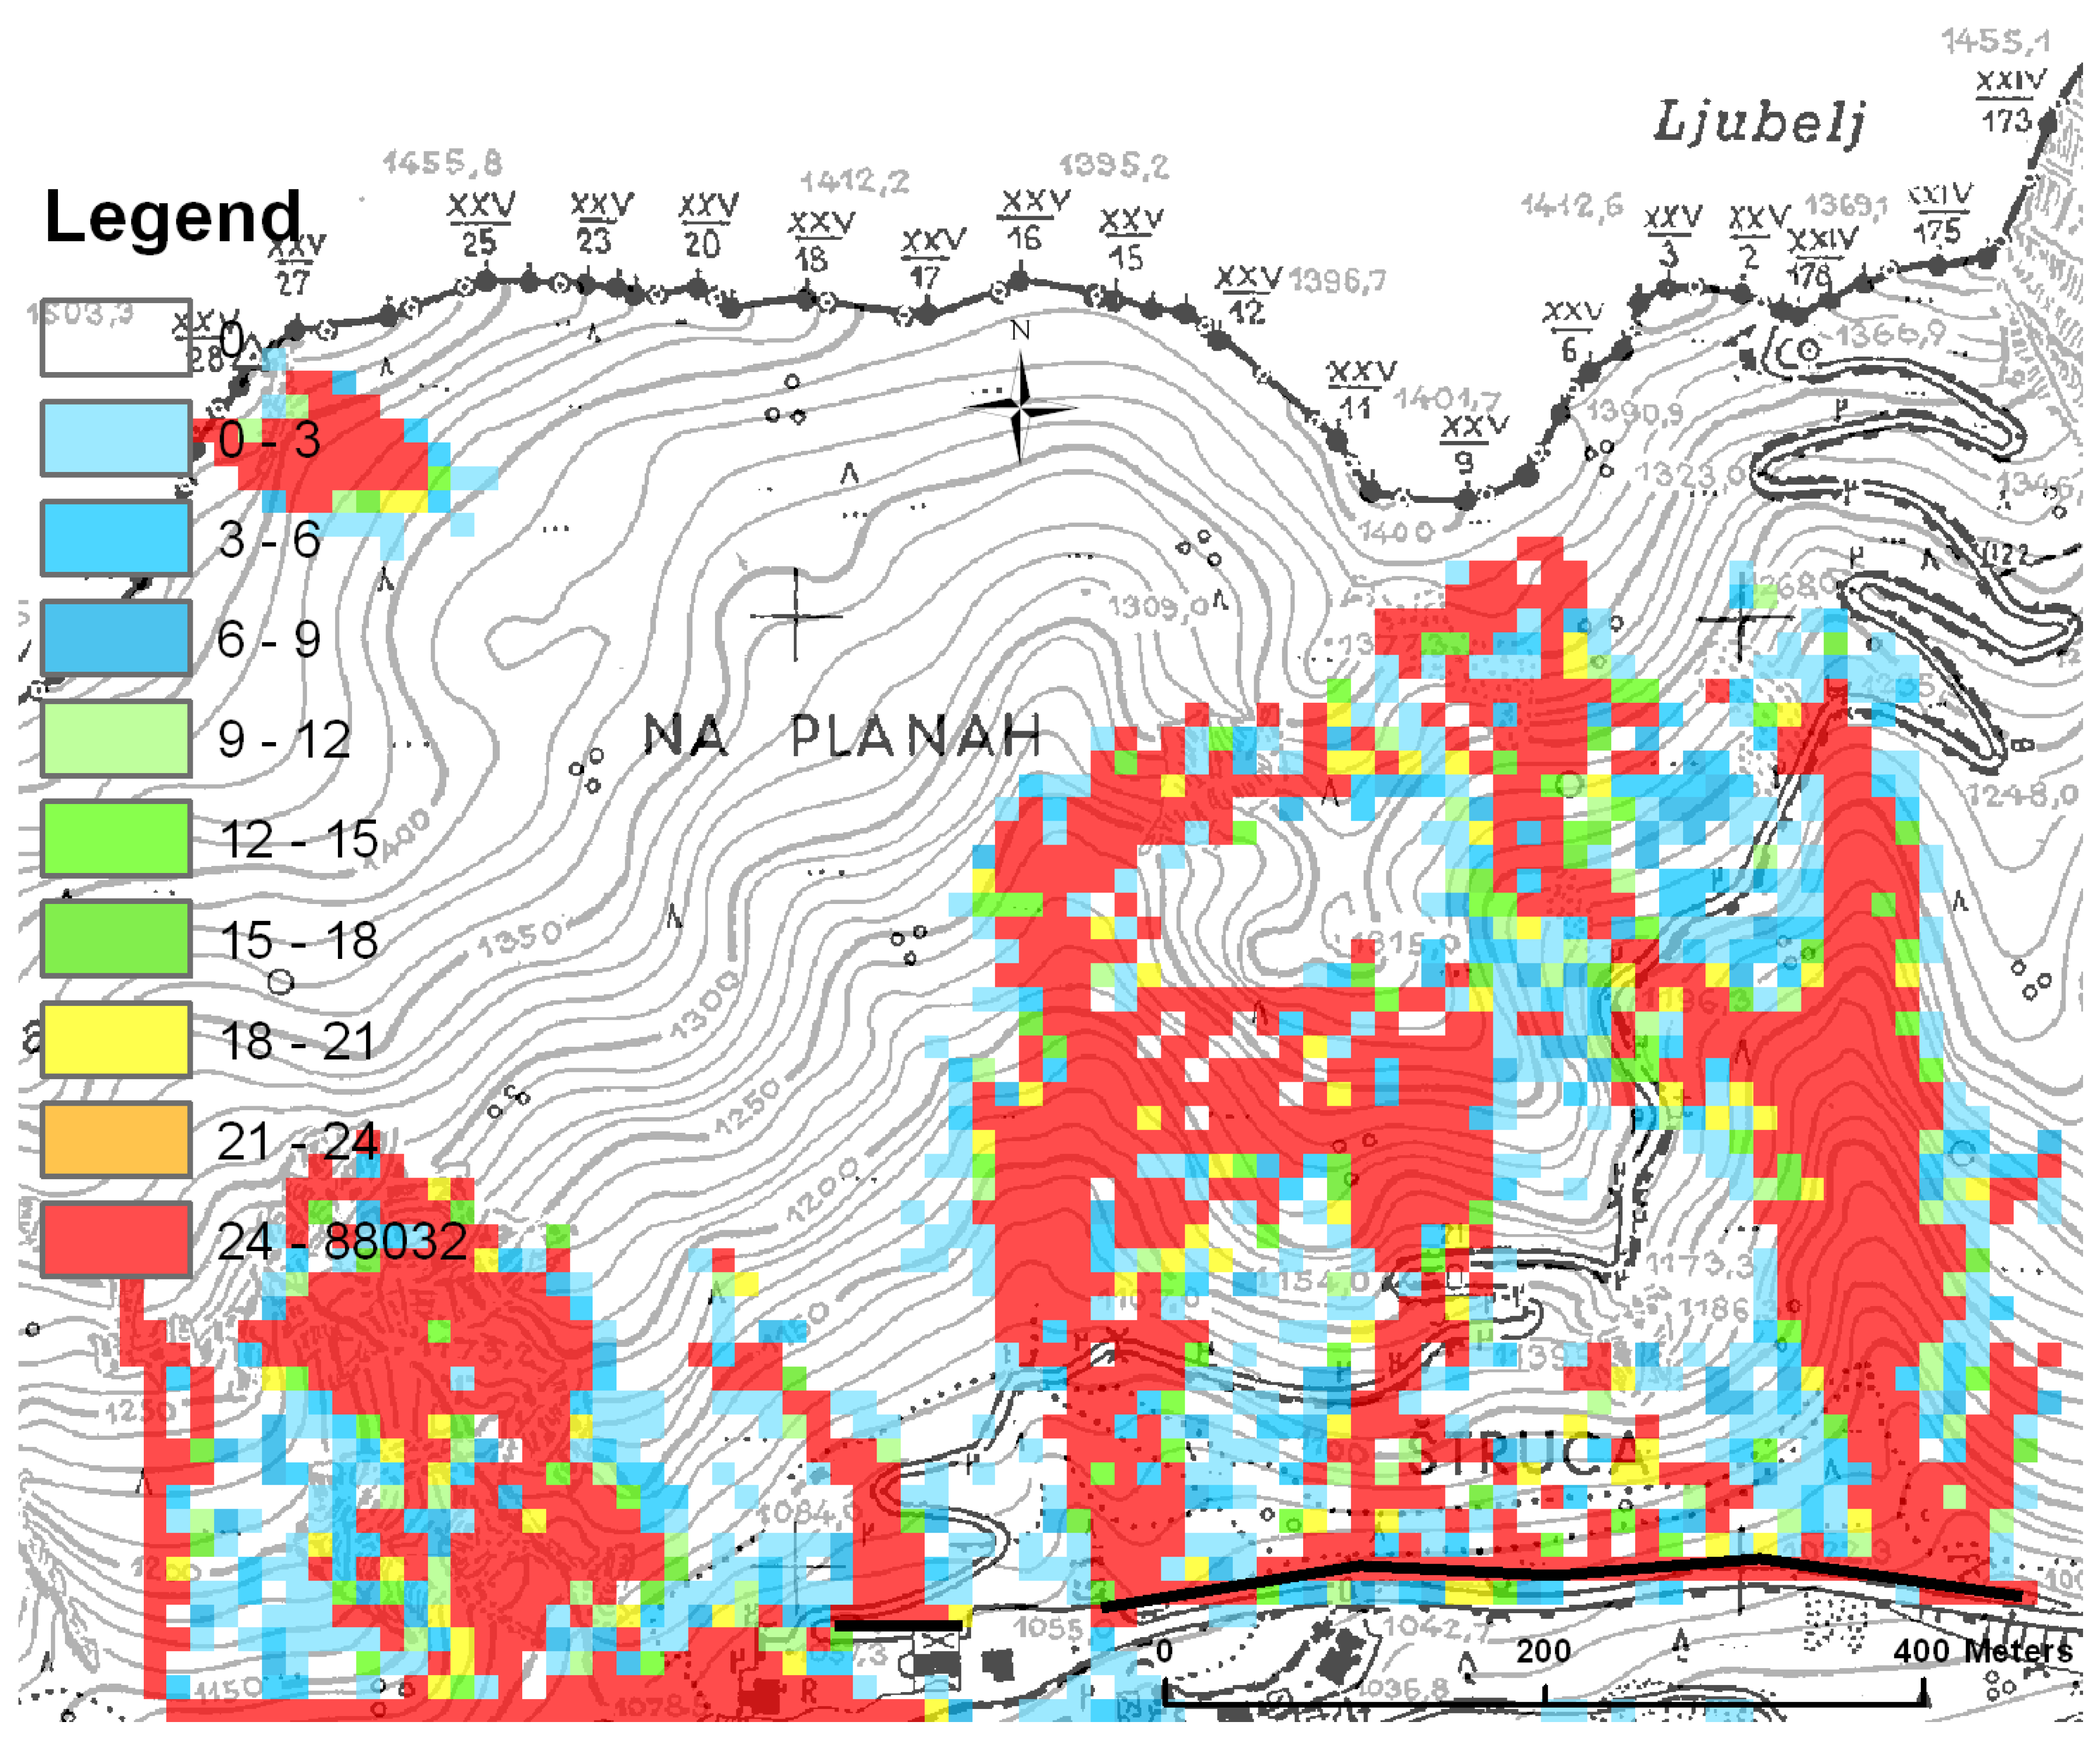
2.4. Modelling Rockfall Susceptibility
3. Results
3.1. Expert Assessment of Present and Future Forest Protective Function against Rockfall

| Attribute | Minimum requirements for the target profile | Existing forest |
|---|---|---|
| Stand mixture | 60%–100% deciduous trees (50%–100% Fagus sylvatica, 0%–30% Picea abies) | 76% deciduous trees (35% Fagus sylvatica, 22% Picea abies) |
| Vertical structure | Enough trees with growth potential in at least two DBH classes per hectare | yes |
| Horizontal structure | 300 trees per hectare with DBH over 24 cm | 327 trees |
| Stability | Half of all trees should have a symmetric crown, vertical trunk and good anchoring | yes |
| Regeneration conditions | Competitive herbs cover less than 1/3 of the entire area | 30% |
| Regeneration: 10–40 cm high | 10 beech seedlings per acre (one every 3 meters) | 24 beech seedlings |
| Regeneration: 40 cm high to 12 cm in DBH | Two regeneration cones per hectare of 0.02–0.05 ha in size (one cone every 75 meters or at least 4% cover of regeneration) | yes |
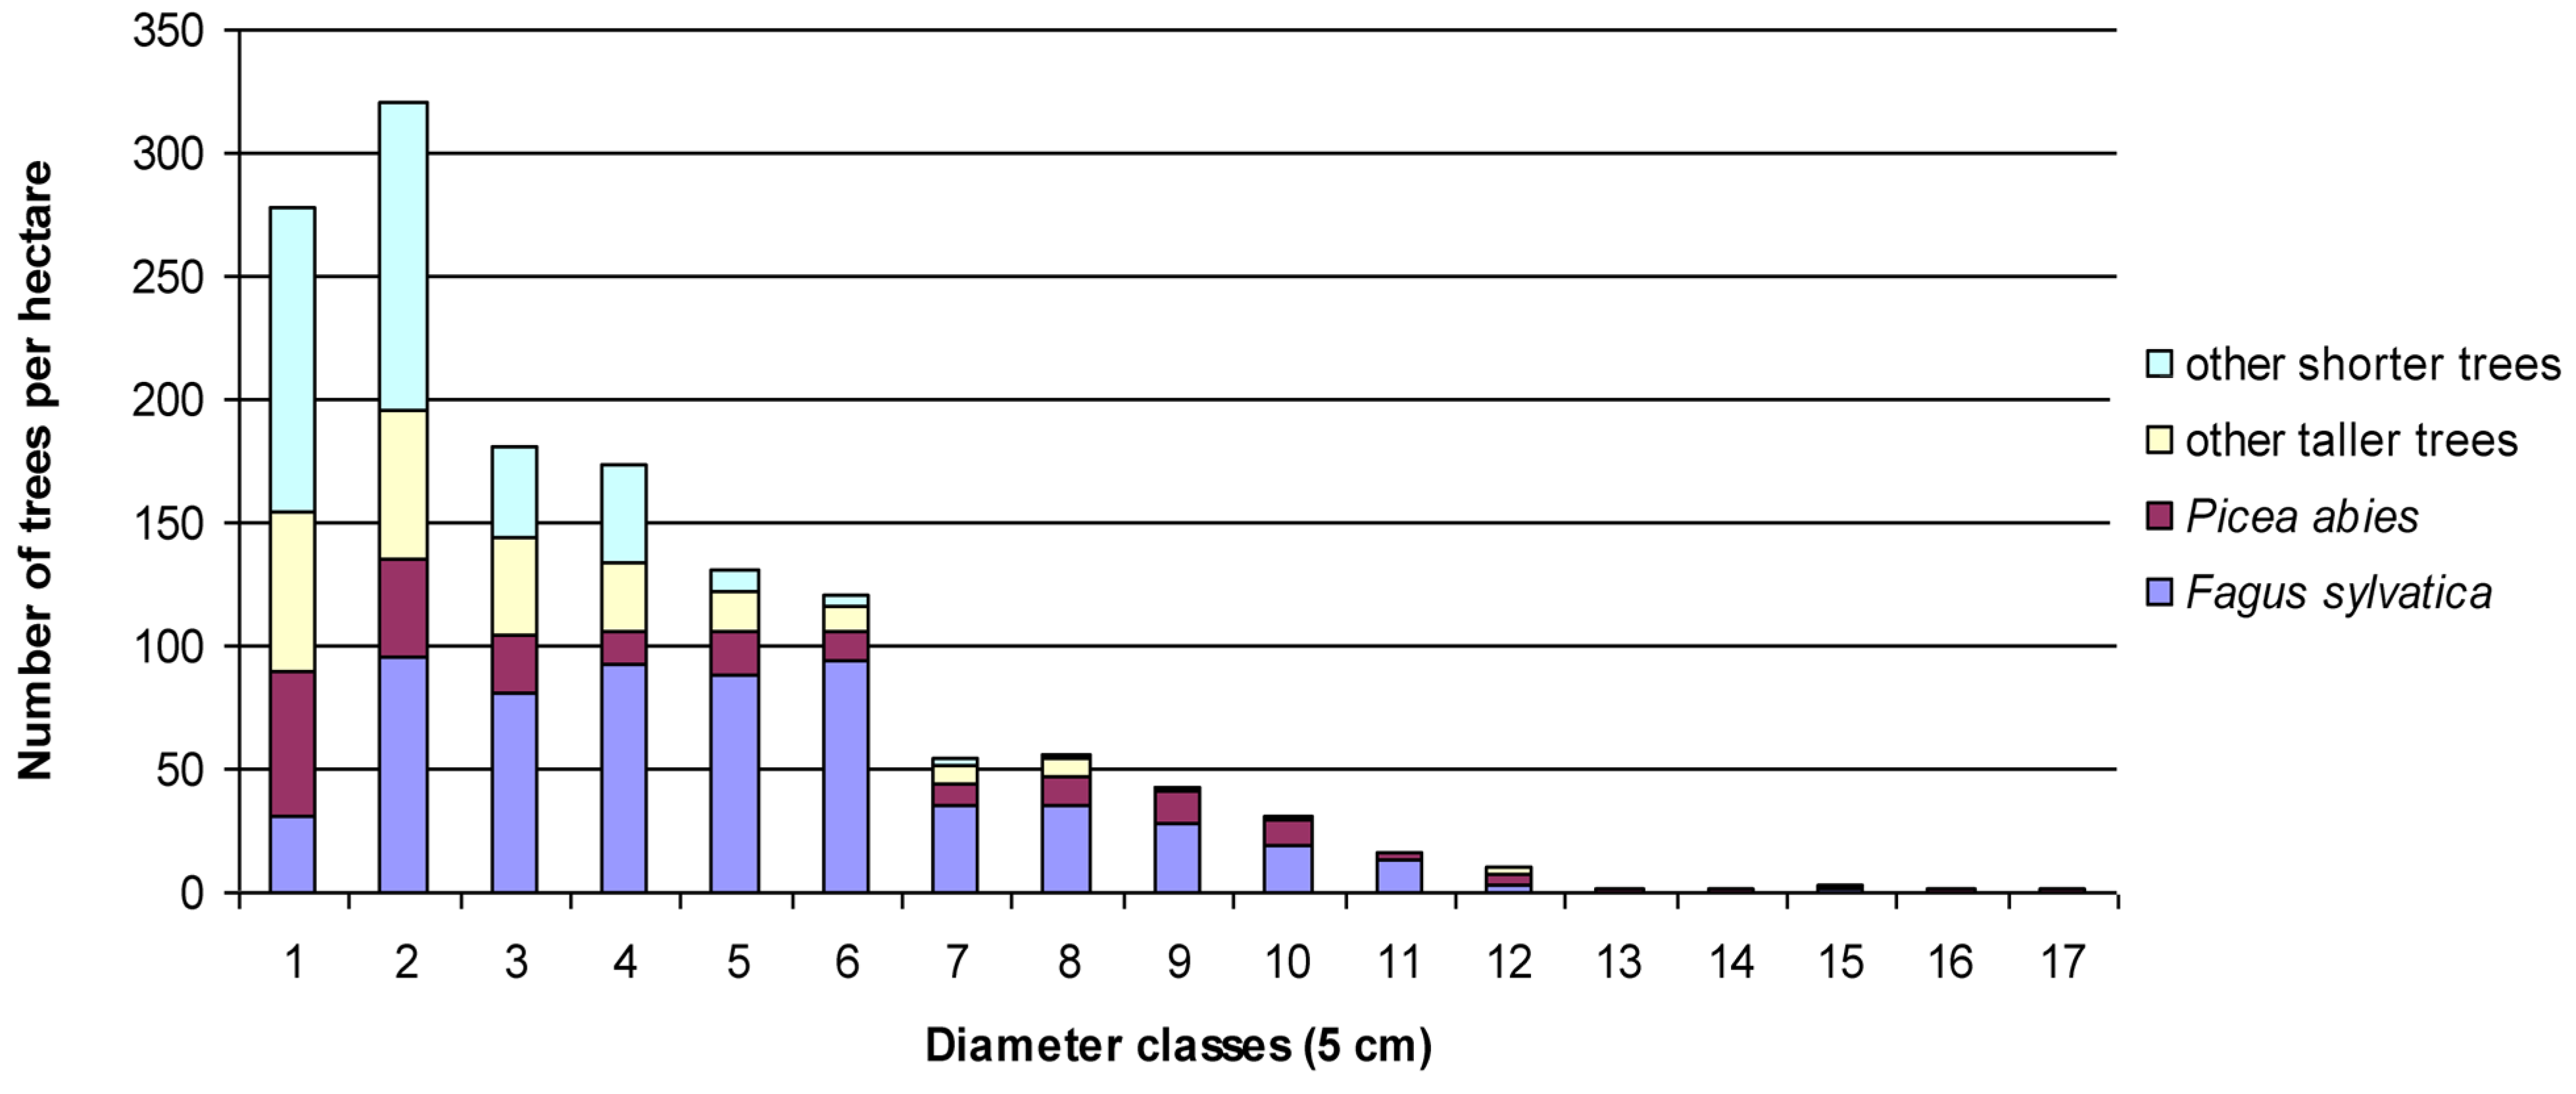
| Size class (height in cm) | |||
|---|---|---|---|
| Species | 0–20 | 21–50 | 51–130 |
| Fagus sylvatica | 1587 | 847 | 0 |
| Picea abies | 212 | 106 | 423 |
| Abies alba | 5291 | 0 | 0 |
| Acer pseudoplatanus | 24,021 | 635 | 423 |
| Sum | 31,111 | 1588 | 846 |
| Target | 17,000–35,000 | 2600–18,000 | 600–6000 |
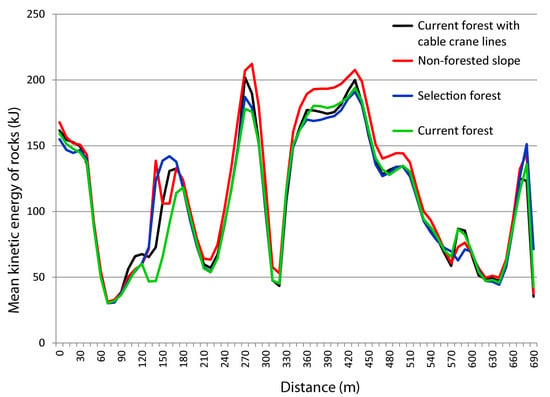
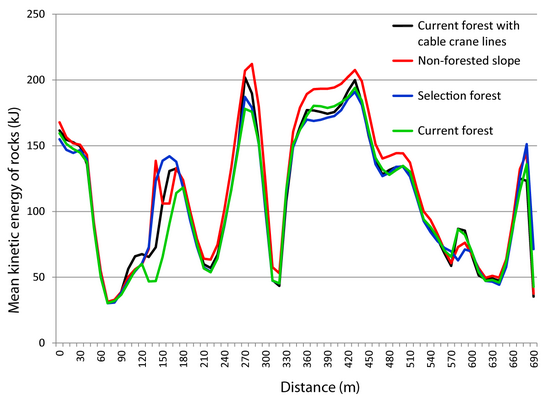
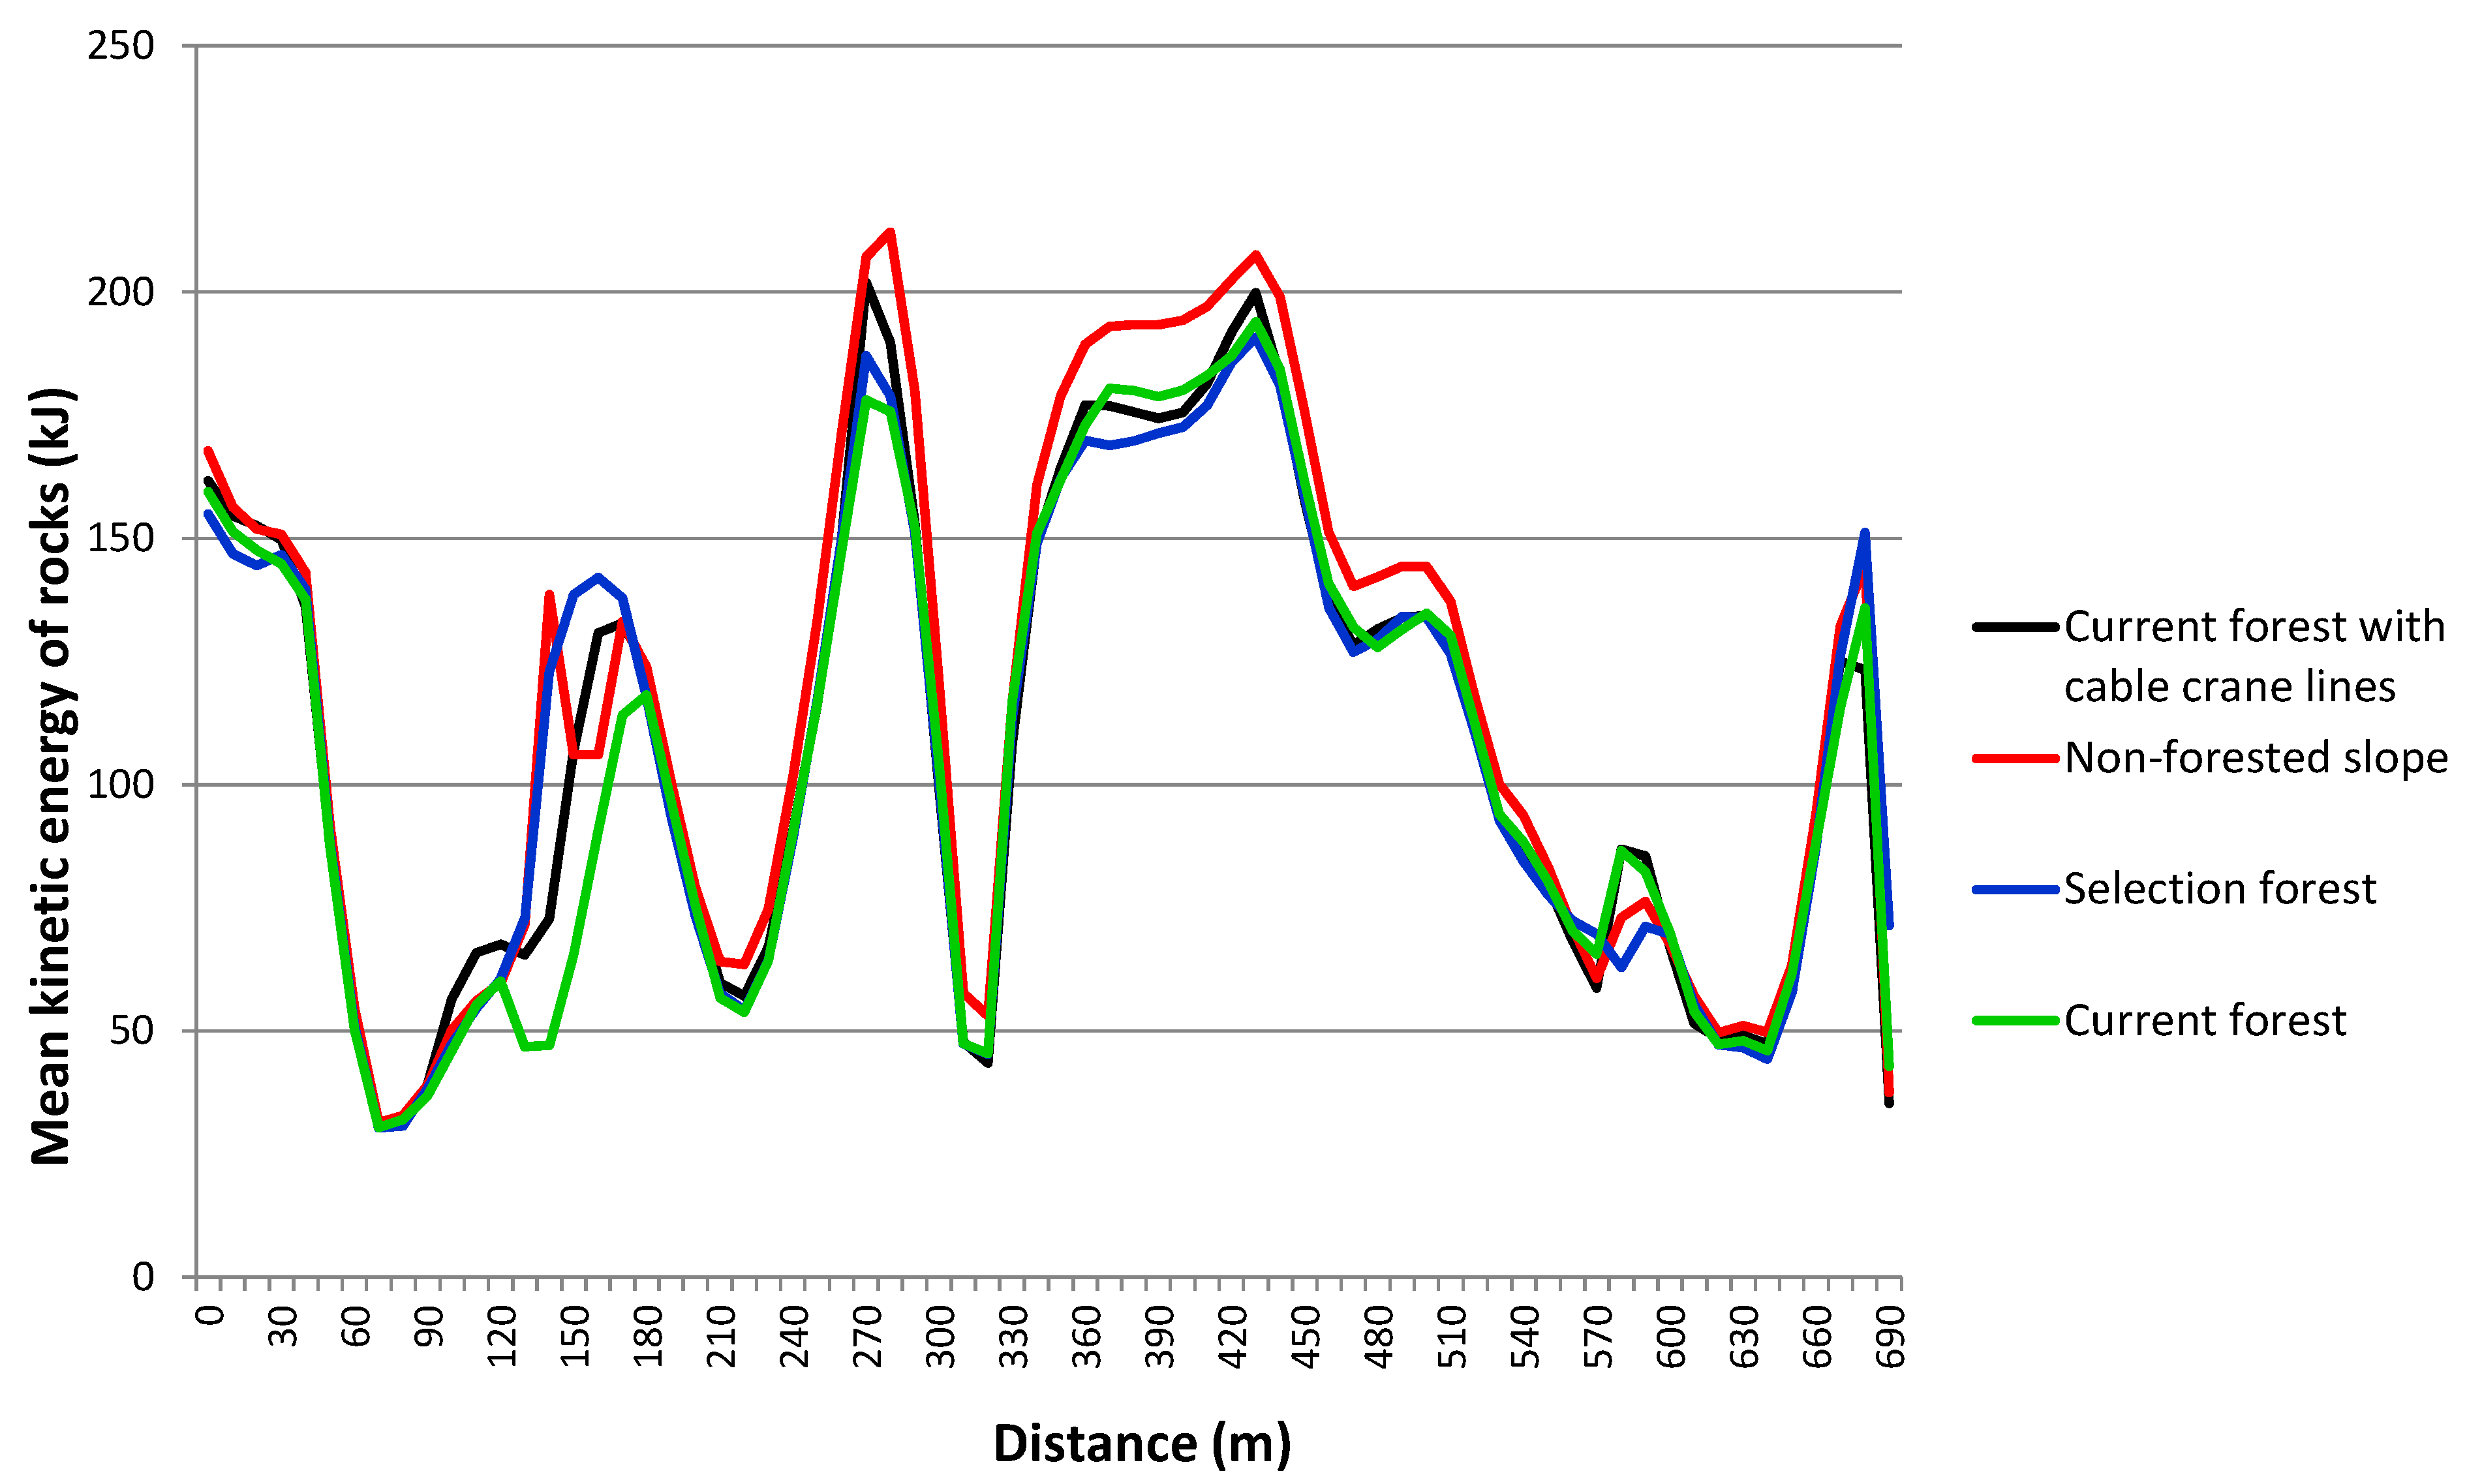
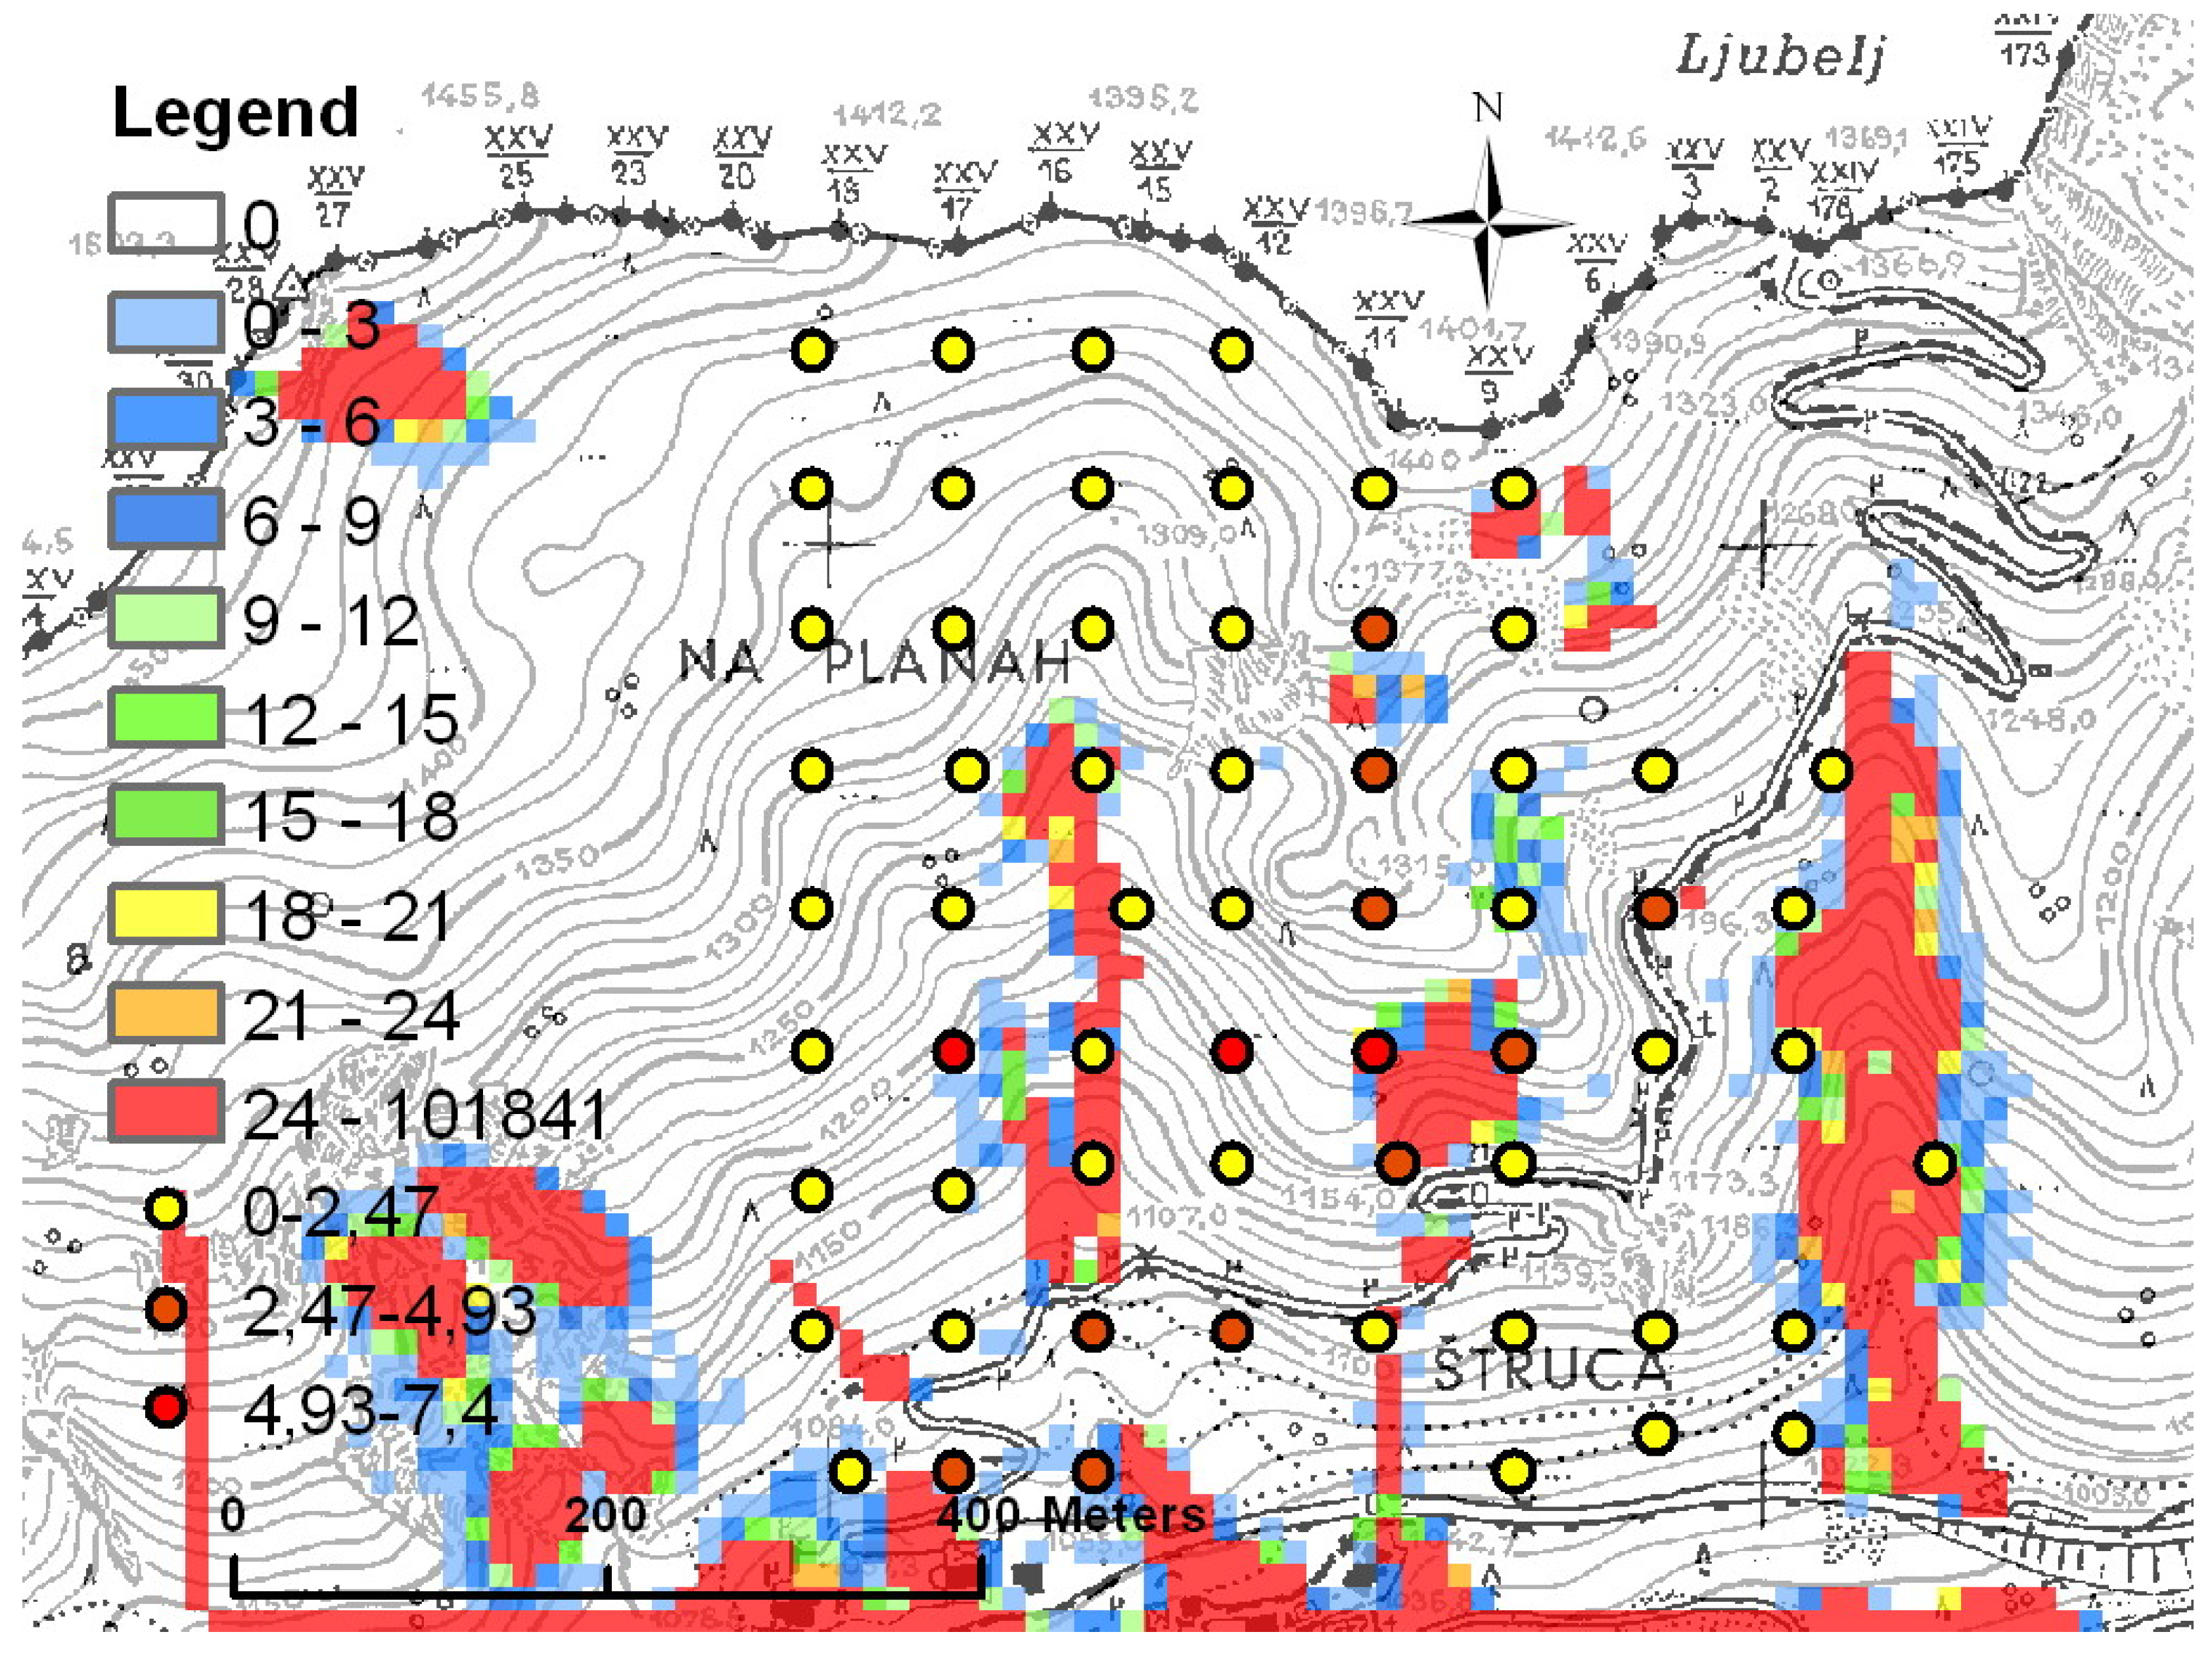
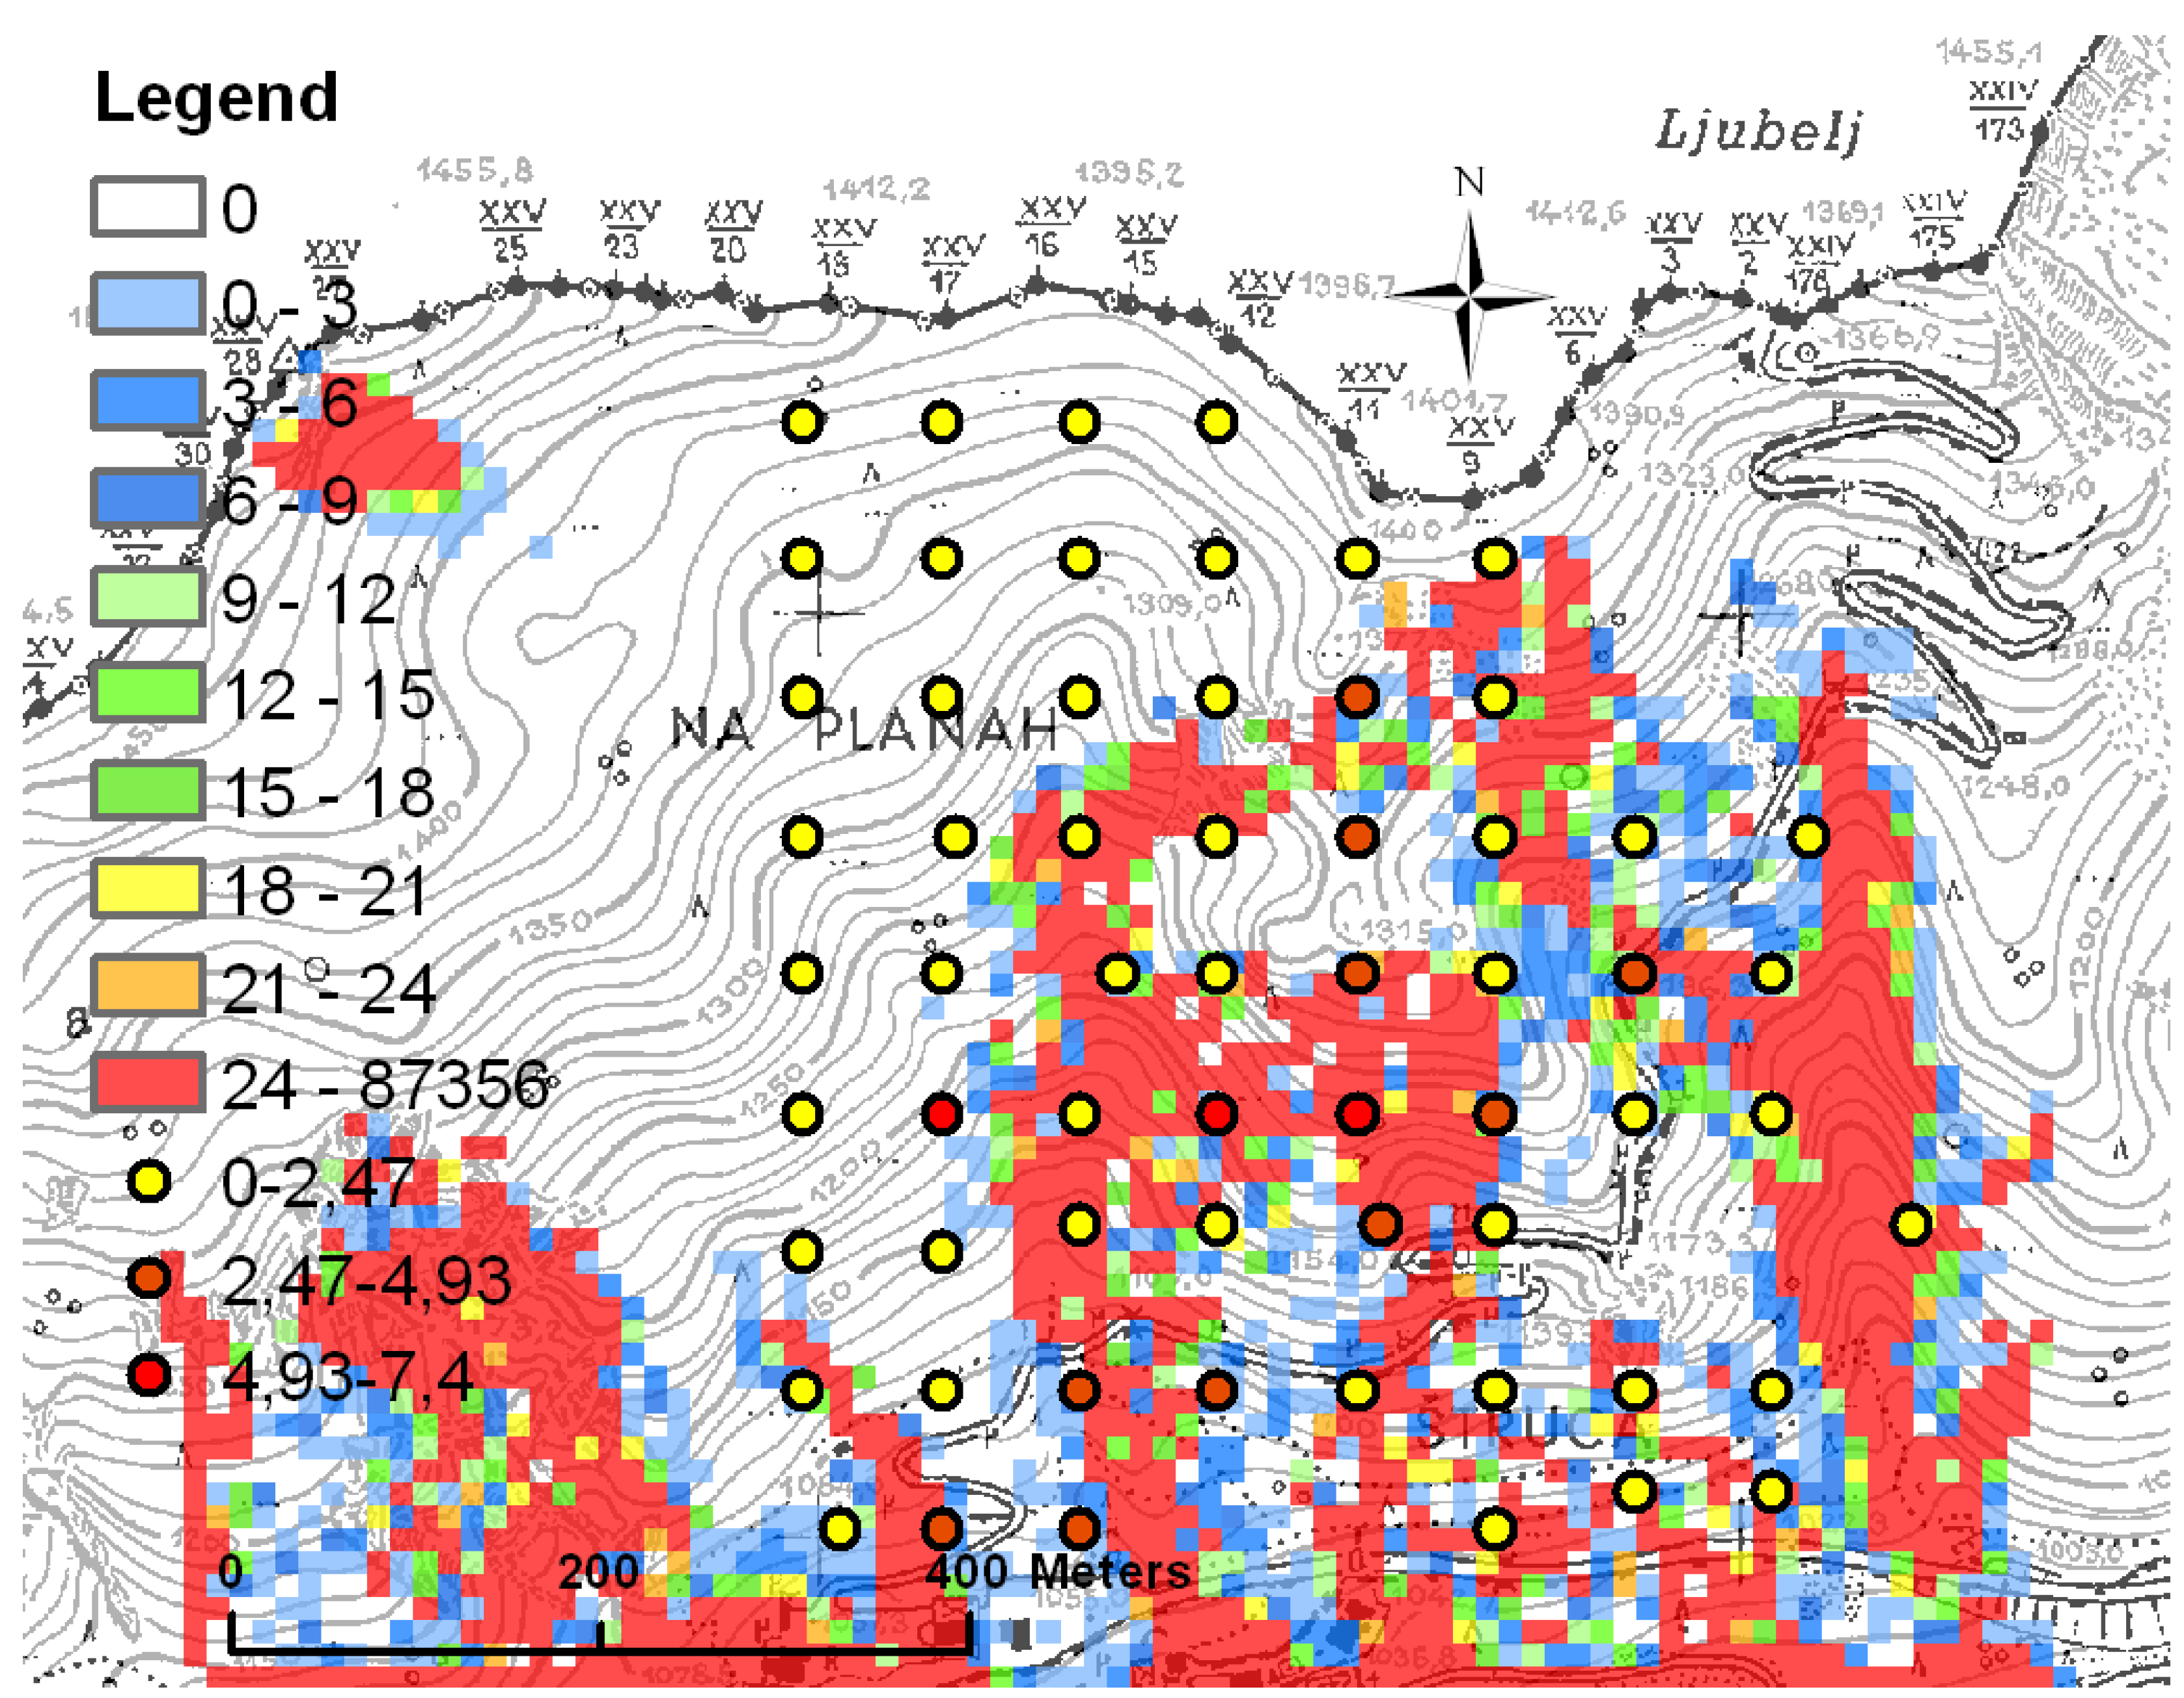
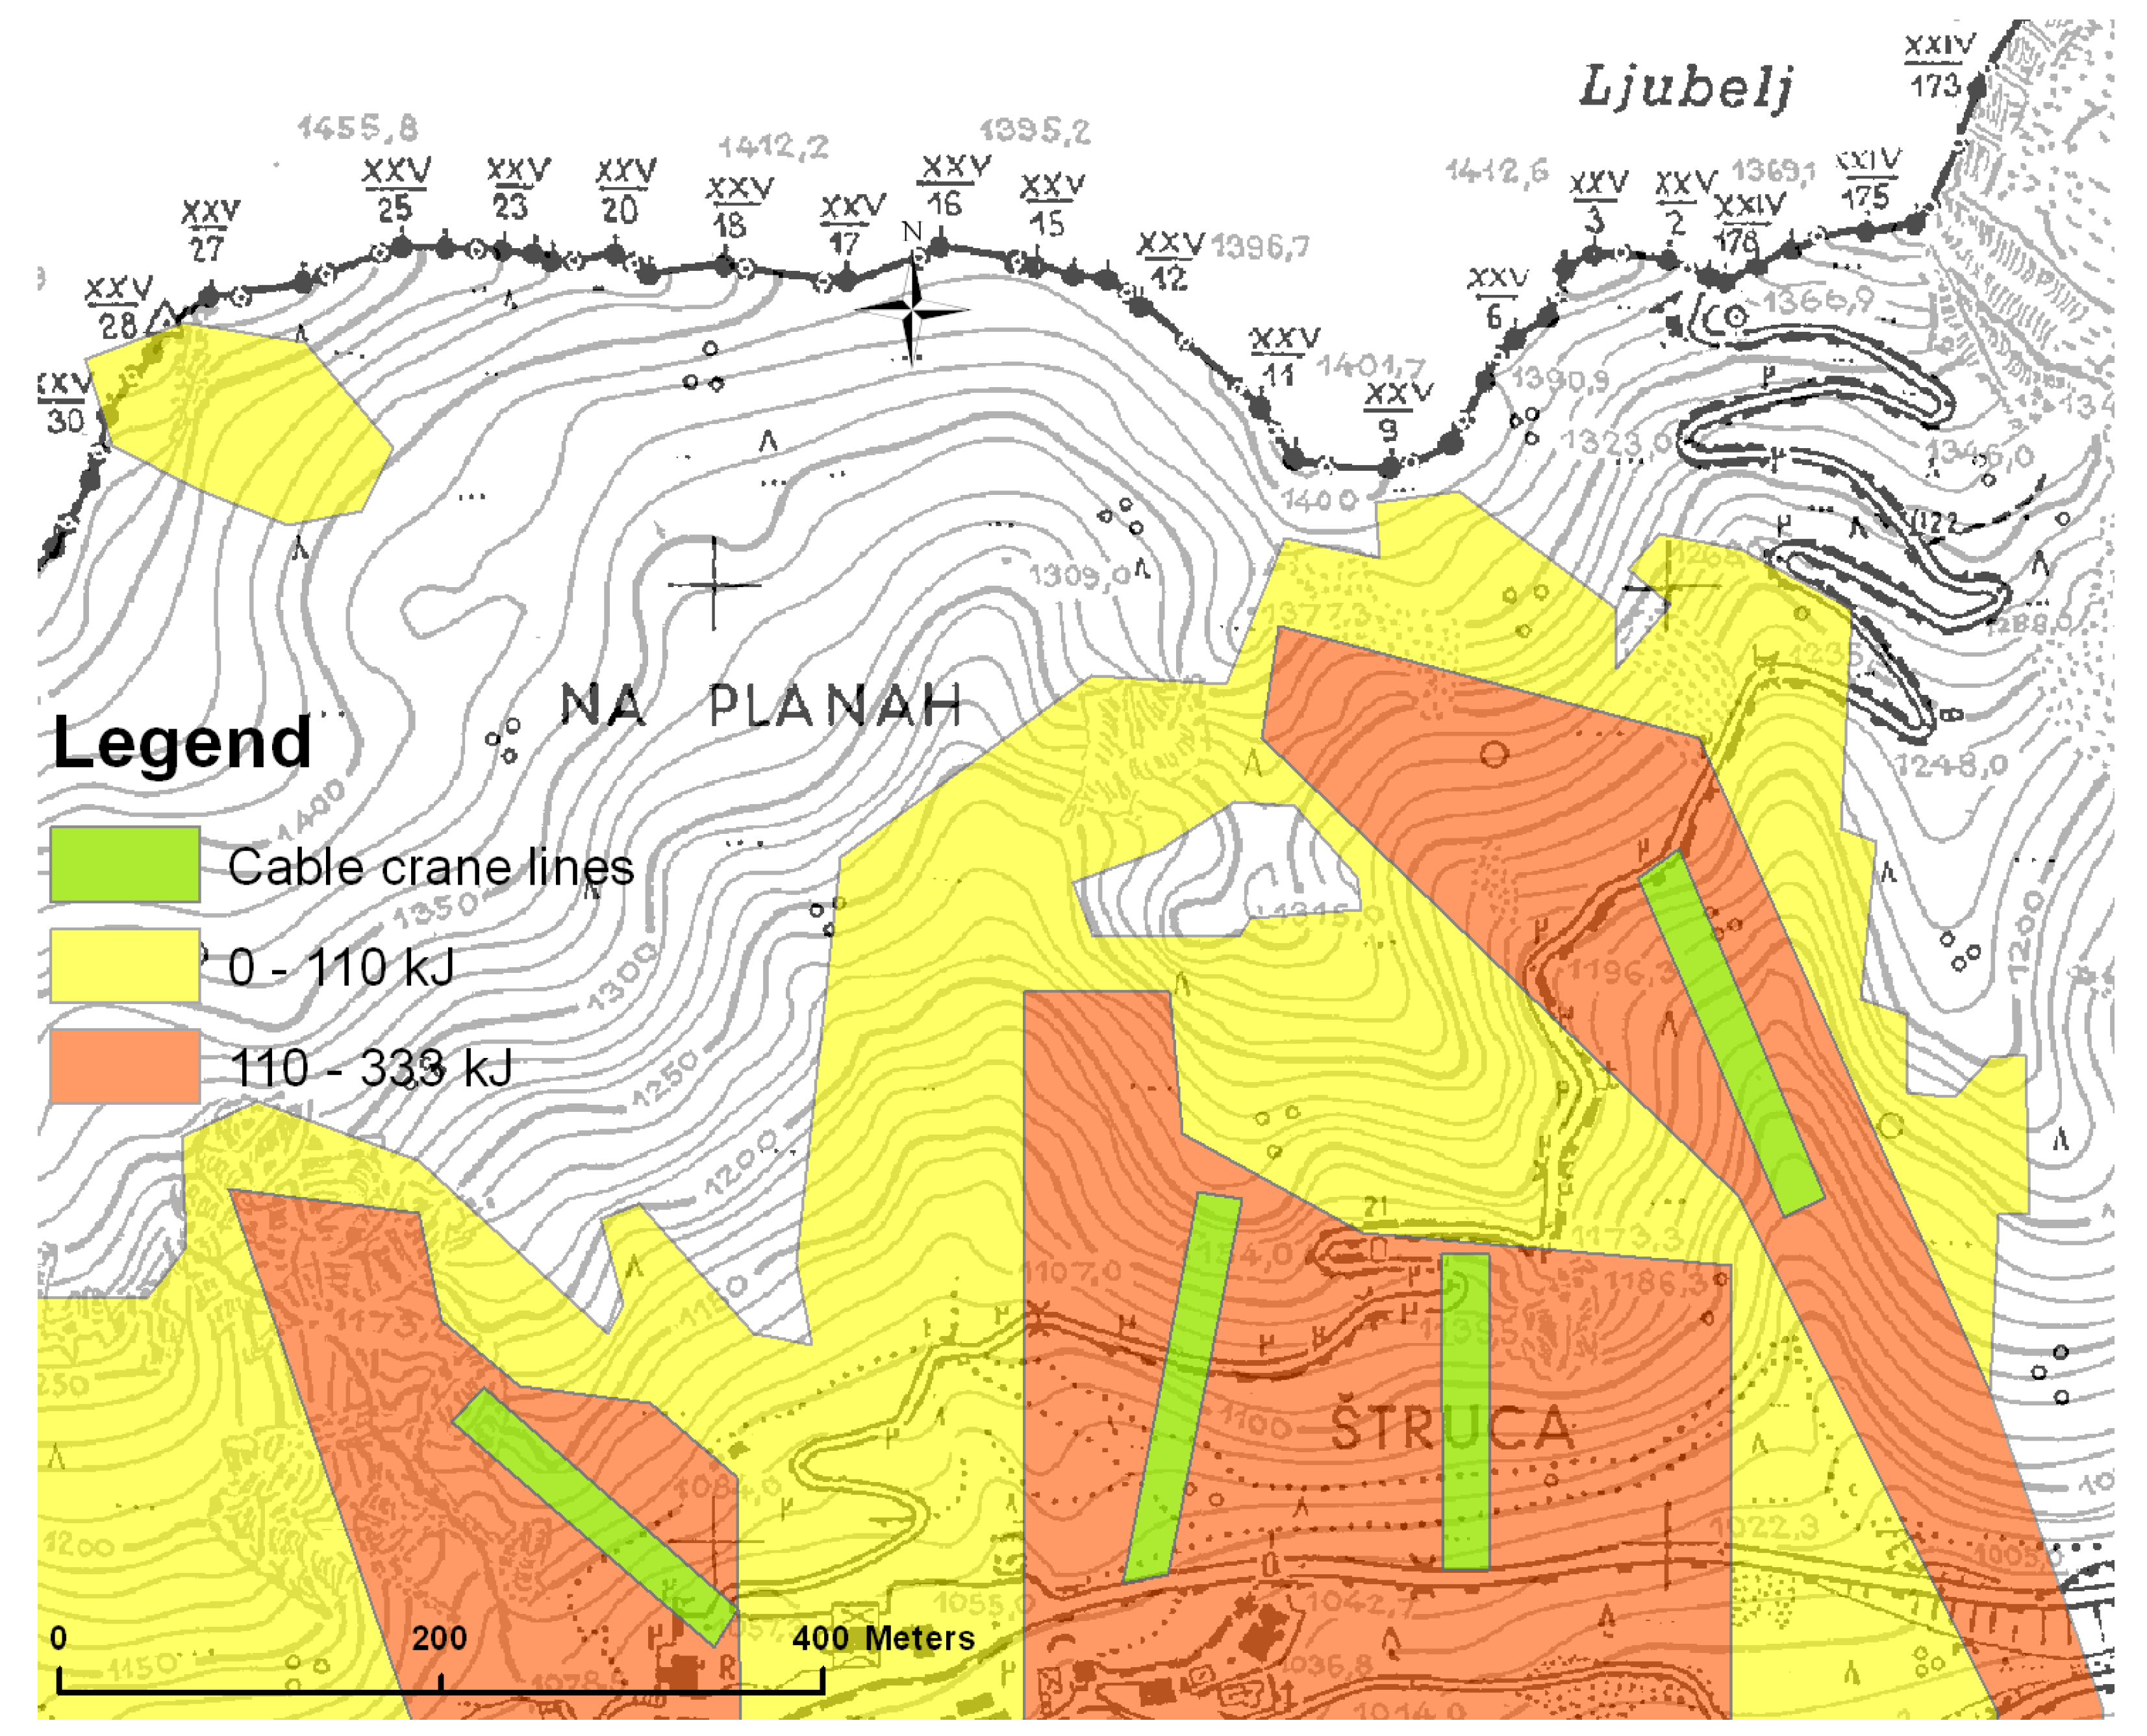
3.2. Modelling Forest Protective Functions against Rockfall and Assessment of Silvicultural Scenarios


| Scenario | Mean kinetic energy of rocks on the road (kilojoule (kJ)) | Average number of deposited rocks on the road | Percent of rocks which reached the road |
|---|---|---|---|
| Non-forested slope | 116.7 | 17,091 | 9.5 |
| Current forest | 106.3 | 13,073 | 7.3 |
| Forest with cable crane lines | 109.3 | 13,332 | 7.4 |
| Selection forest | 109.0 | 12,524 | 7.0 |
4. Discussion
4.1. Existing and Future Forest Protection against Rockfall
4.2. Expert Assessment vs. Modelling
5. Conclusions
Acknowledgments
Author Contributions
Conflicts of Interest
Appendix

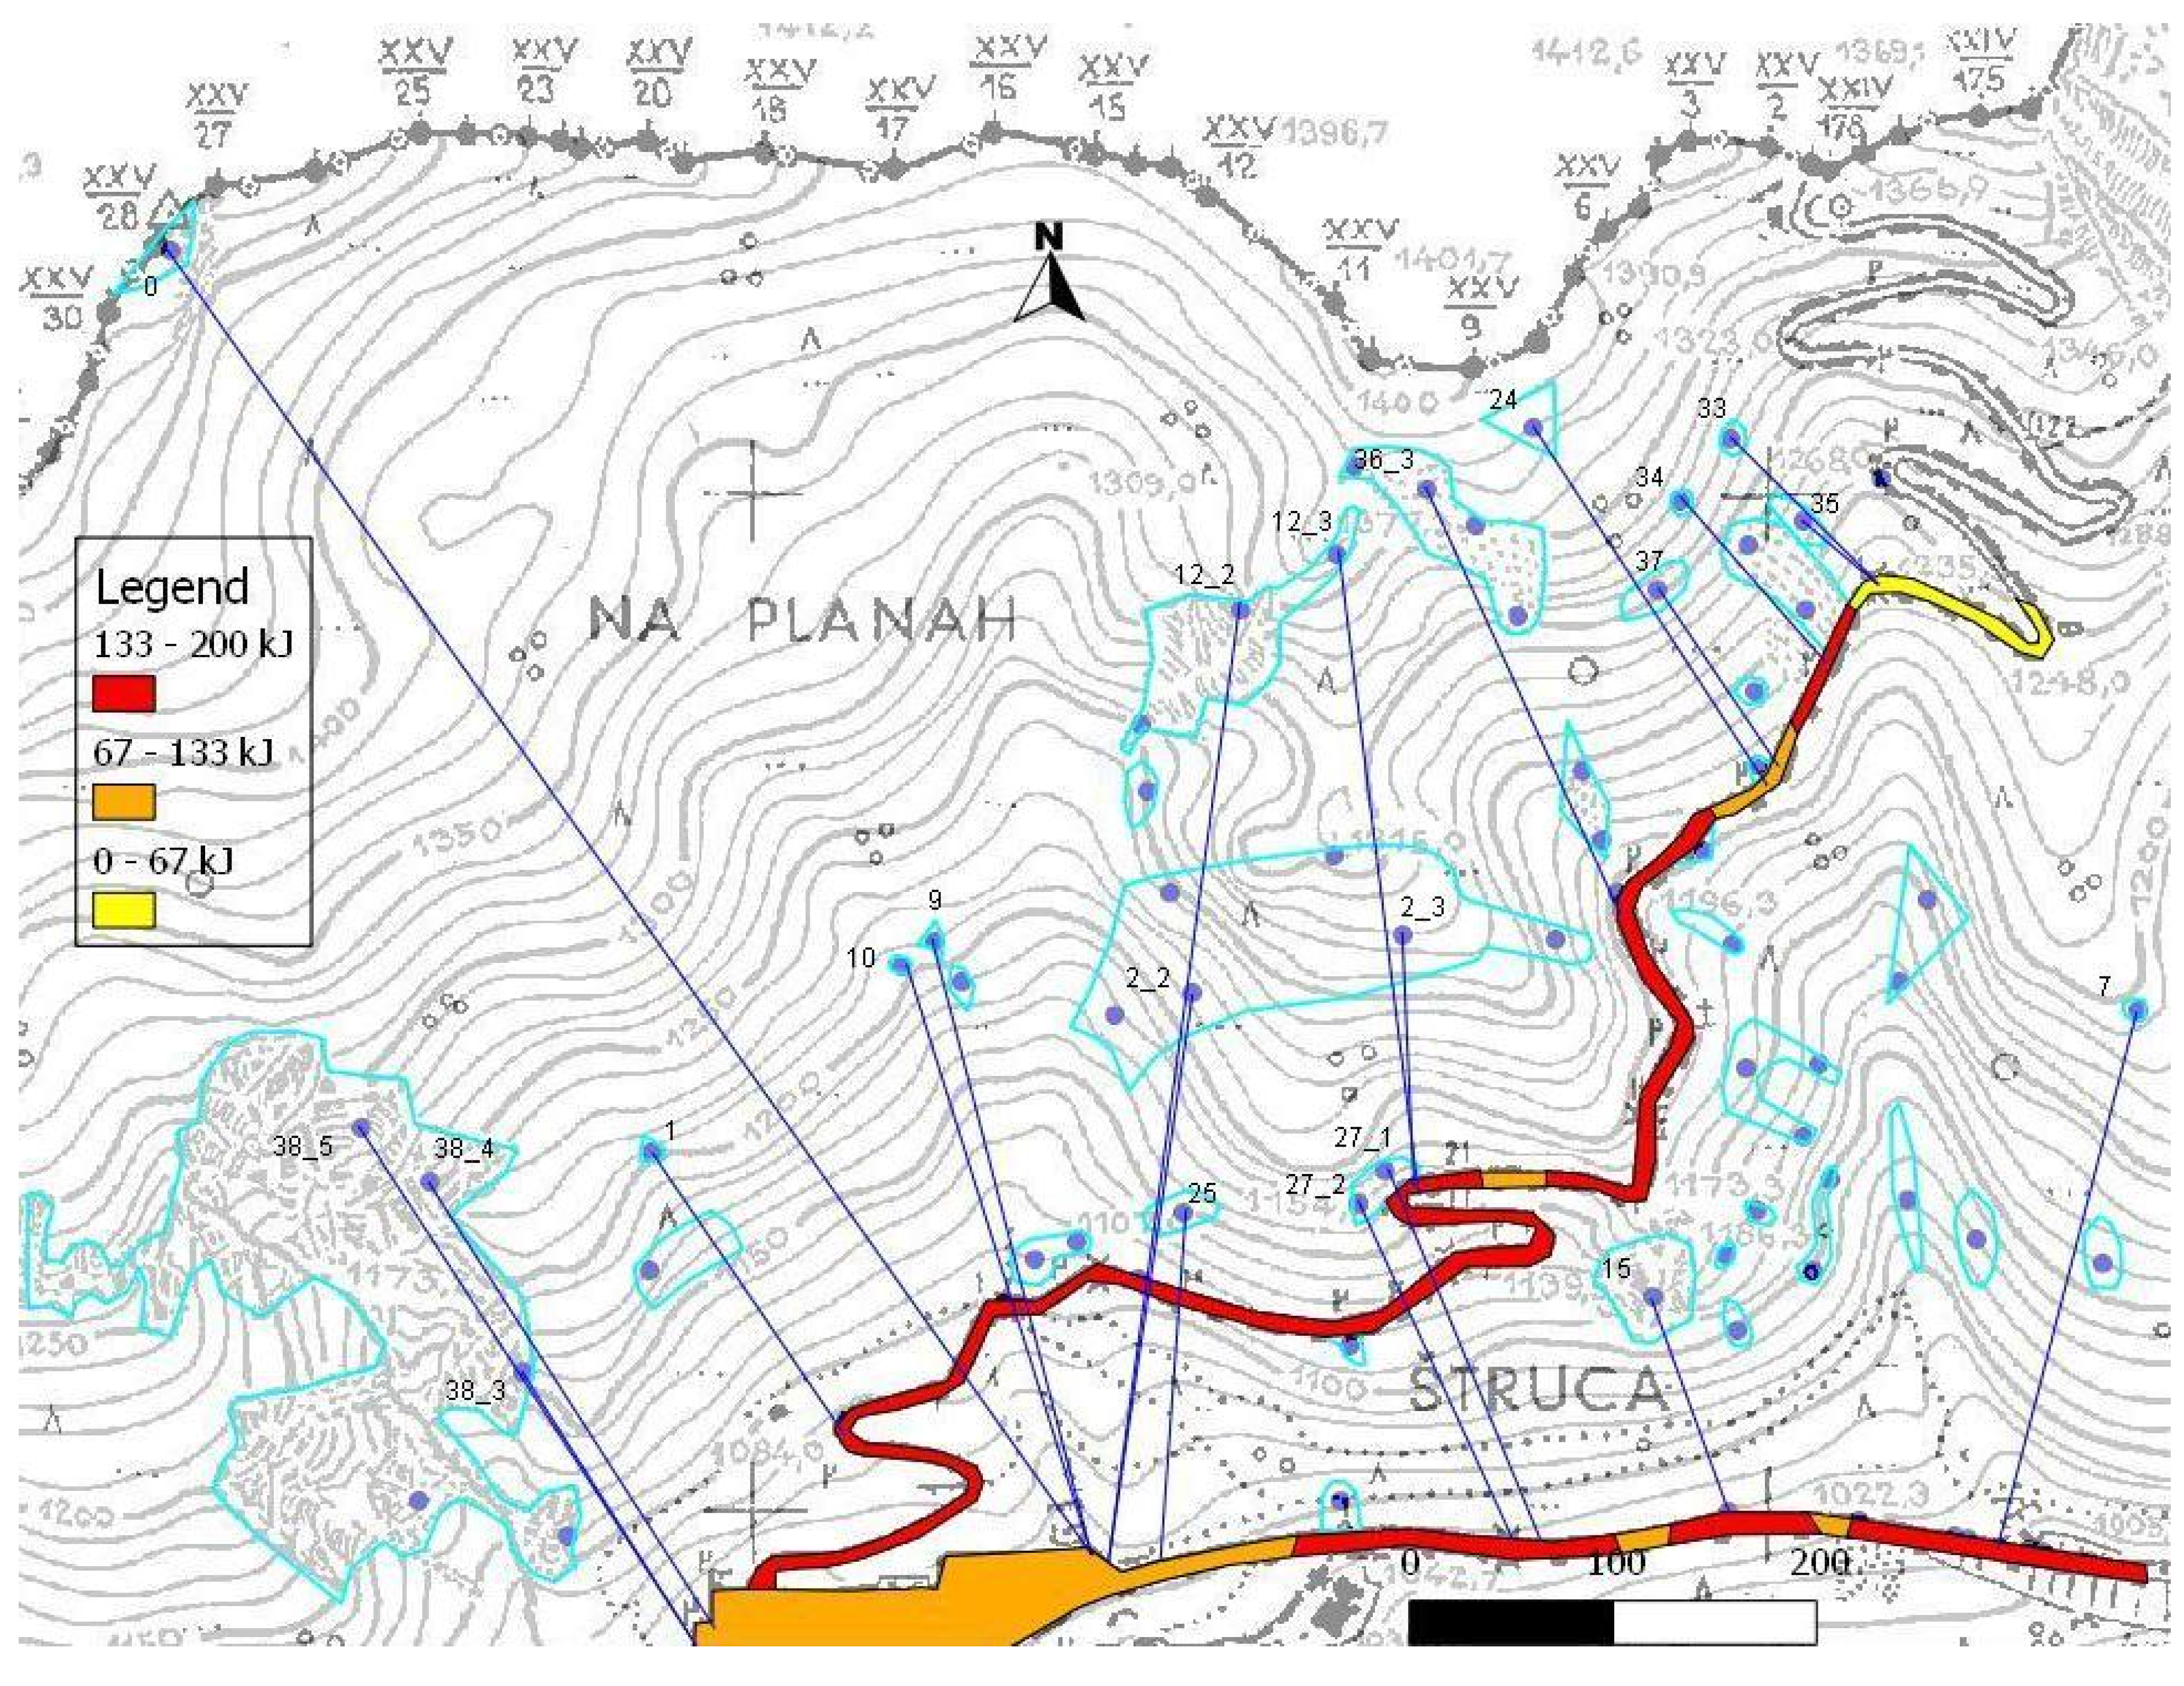
| Source | Maximum kinetic energy of the rock (kJ) |
|---|---|
| 0 | 100 |
| 1 | 155 |
| 2_2 | 50 |
| 2_3 | 150 |
| 7 | 150 |
| 9 | 100 |
| 10 | 100 |
| 12_2 | 100 |
| 12_3 | 100 |
| 15 | 200 |
| 24 | 100 |
| 25 | 100 |
| 27_1 | 150 |
| 27_2 | 150 |
| 33 | 50 |
| 34 | 177 |
| 35 | 47 |
| 36_3 | 144 |
| 37 | 99 |
| 38_3 | 100 |
| 38_4 | 100 |
| 38_5 | 100 |


References
- Motta, R.; Haudemand, J.C. Protective forests and silvicultural stability an example of planning in the Aosta valley. Mt. Res. Dev. 2000, 20, 74–81. [Google Scholar] [CrossRef]
- Mayer, H.; Ott, E. Gebirgswaldbau, Schutzwaldpflege. Ein Waldbaulicher Beitrag zur Landschaftsökologie und Zum Umweltschutz; Gustav Fischer Verlag: Stuttgart, Germany, 1991; p. 587. [Google Scholar]
- Brang, P. Resistance and elasticity: Promising concepts for the management of protection forests in the European Alps. For. Ecol. Manag. 2001, 145, 107–119. [Google Scholar] [CrossRef]
- Krauchi, N.; Brang, P.; Schonenberger, W. Forests of mountainous regions: Gaps in knowledge and research needs. For. Ecol. Manag. 2000, 132, 73–82. [Google Scholar] [CrossRef]
- Weiss, G. Evaluation of policy instruments for protective forest management in Austria. For. Policy Econ. 2000, 1, 243–255. [Google Scholar] [CrossRef]
- Brang, P.; Schönenberger, W.; Frehner, M.; Schwitter, R.; Thormann, J.J.; Wasser, B. Management of protection forests in the European Alps: An overview. For. Snow Landsc. Res. 2006, 80, 23–44. [Google Scholar]
- Gauquelin, X.; Courbaud, B. Guide des Sylvicultures de Montagne Pour les Alpes du Nord Françaises; Cemagref, ONF: Grenoble, France, 2006. [Google Scholar]
- Stokes, A.; Salin, F.; Kokutse, A.D.; Berthier, S.; Jeannin, H.; Mochan, S.; Dorren, L.; Kokutse, N.; Abd Ghani, M.; Fourcaud, T. Mechanical resistance of different tree species to rockfall in the French Alps. Plant Soil 2005, 278, 107–117. [Google Scholar] [CrossRef]
- Jancke, O.; Dorren, L.K.; Berger, F.; Fuhr, M.; Köhl, M. Implications of coppice stand characteristics on the rockfall protection function. For. Ecol. Manag. 2009, 259, 124–131. [Google Scholar] [CrossRef]
- Fidej, G.; Mikoš, M.; Rugani, T.; Jež, J.; Kumelj, Š.; Diaci, J. Assessment of the protective function of forests against debris flows in a gorge of the Slovenian Alps. iForest Biogeosci. For. 2015, 8, 73–81. [Google Scholar] [CrossRef]
- Wehrli, A.; Brang, P.; Maier, B.; Duc, P.; Binder, F.; Lingua, E.; Ziegner, K.; Kleemayr, K.; Dorren, L. Management of protection forests in the Alps—An overview. Schweiz. Z. Forstwes. 2007, 158, 142–156. [Google Scholar] [CrossRef]
- Zagas, T.D.; Raptis, D.I.; Zagas, D.T. Identifying and mapping the protective forests of southeast Mt. Olympus as a tool for sustainable ecological and silvicultural planning, in a multi-purpose forest management framework. Ecol. Eng. 2011, 37, 286–293. [Google Scholar] [CrossRef]
- Parise, M. Landslide hazard zonation of slopes susceptible to rock falls and topples. Nat. Hazards Earth Syst. Sci. 2002, 2, 37–49. [Google Scholar] [CrossRef]
- Guzzetti, F.; Reichenbach, P.; Ghigi, S. Rockfall hazard and risk assessment along a transportation corridor in the Nera valley, central Italy. Environ. Manag. 2004, 34, 191–208. [Google Scholar] [CrossRef]
- Dorren, L.K. A review of rockfall mechanics and modelling approaches. Prog. Phys. Geogr. 2003, 27, 69–87. [Google Scholar] [CrossRef]
- Dorren, L.; Berger, F.; Jonsson, M.; Krautblatter, M.; Mölk, M.; Stoffel, M.; Wehrli, A. State of the art in rockfall—Forest interactions. Schweiz. Z. Forstwes. 2007, 158, 128–141. [Google Scholar] [CrossRef]
- Guzzetti, F.; Crosta, G.; Detti, R.; Agliardi, F. Stone: A computer program for the three-dimensional simulation of rock-falls. Comput. Geosci. 2002, 28, 1079–1093. [Google Scholar] [CrossRef]
- Stoffel, M.; Wehrli, A.; Kuhne, R.; Dorren, L.K.A.; Perret, S.; Kienholz, H. Assessing the protective effect of mountain forests against rockfall using a 3D simulation model. For. Ecol. Manag. 2006, 225, 113–122. [Google Scholar] [CrossRef]
- Berger, F.; Dorren, L.K. Principles of the tool rockfor.Net for quantifying the rockfall hazard below a protection forest. Schweiz. Z. Forstwes. 2007, 158, 157–165. [Google Scholar] [CrossRef]
- Dorren, L.K.A.; Berger, F.; Imeson, A.C.; Maier, B.; Rey, F. Integrity, stability and management of protection forests in the European Alps. For. Ecol. Manag. 2004, 195, 165–176. [Google Scholar] [CrossRef]
- Frehner, M.; Wasser, B.; Schwitter, R. Nachhaltigkeit und Erfolgskontrolle im Schutzwald; Bundesamt für Umwelt BAFU: Bern, Switzerland, 2005. [Google Scholar]
- Parise, M. Rock failures in karst. In Proceedings of the 10th International Symposium on Landslides, Xi’an, China, 15 June 2008; Chen, Z., Zhang, J.M., Eds.; CRC Press: Boca Raton, FL, USA; pp. 275–280.
- Gutiérrez, F.; Parise, M.; de Waele, J.; Jourde, H. A review on natural and human-induced geohazards and impacts in karst. Earth-Sci. Rev. 2014, 138, 61–88. [Google Scholar] [CrossRef]
- Dolenec, T.; Lojen, S.; Buser, S.; Dolenec, M. Stable isotope event markers near the permo-triassic boundary in the Karavanke Mountains (Slovenia). Geol. Croat. 1999, 52, 77–81. [Google Scholar]
- Janowiak, M.K.; Nagel, L.M.; Webster, C.R. Spatial scale and stand structure in northern hardwood forests: Implications for quantifying diameter distributions. For. Sci. 2008, 54, 497–506. [Google Scholar]
- Bachofen, H. Sustainable recruitment in uneven aged stands. Schweiz. Z. Forstwes. 2009, 160, 2–10. [Google Scholar] [CrossRef]
- Schütz, J.P. Der Plenterwald und weitere Formen strukturierter und gemischter Wälder; Parey: Berlin, Germany, 2001; p. 207. [Google Scholar]
- EcorisQ. Available online: http://www.ecorisq.org/rockfor-net-en (accessed on 10 April 2015).
- Dorren, L.K. Rockyfor3d (v 5.2) Revealed. Transparent Description of the Complete 3D Rockfall Model. Available online: http://www.ecorisq.org/docs/Rockyfor3D_v5_2_EN.pdf (accessed on 10 April 2015).
- Motta, R. Impact of wild ungulates on forest regeneration and tree composition of mountain forests in the western Italian Alps. For. Ecol. Manag. 1996, 88, 93–98. [Google Scholar] [CrossRef]
- Ammer, C. Impact of ungulates on structure and dynamics of natural regeneration of mixed mountain forests in the Bavarian Alps. For. Ecol. Manag. 1996, 88, 43–53. [Google Scholar] [CrossRef]
- Dorren, L.K.A.; Maier, B.; Putters, U.S.; Seijmonsbergen, A.C. Combining field and modelling techniques to assess rockfall dynamics on a protection forest hillslope in the European Alps. Geomorphology 2004, 57, 151–167. [Google Scholar] [CrossRef]
- Bigot, C.; Dorren, L.A.; Berger, F. Quantifying the protective function of a forest against rockfall for past, present and future scenarios using two modelling approaches. Nat. Hazards 2009, 49, 99–111. [Google Scholar] [CrossRef]
- Mason, W. Implementing continuous cover forestry in planted forests: Experience with sitka spruce (Picea sitchensis) in the British Isles. Forests 2015, 6, 879–902. [Google Scholar] [CrossRef]
- Wehrli, A.; Dorren, L.K.; Berger, F.; Zingg, A.; Schönenberger, W.; Brang, P. Modelling long-term effects of forest dynamics on the protective effect against rockfall. For. Snow Landsc. Res. 2006, 80, 57–76. [Google Scholar]
© 2015 by the authors; licensee MDPI, Basel, Switzerland. This article is an open access article distributed under the terms and conditions of the Creative Commons Attribution license (http://creativecommons.org/licenses/by/4.0/).
Share and Cite
Kajdiž, P.; Diaci, J.; Rebernik, J. Modelling Facilitates Silvicultural Decision-Making for Improving the Mitigating Effect of Beech (Fagus Sylvatica L.) Dominated Alpine Forest against Rockfall. Forests 2015, 6, 2178-2198. https://doi.org/10.3390/f6062178
Kajdiž P, Diaci J, Rebernik J. Modelling Facilitates Silvicultural Decision-Making for Improving the Mitigating Effect of Beech (Fagus Sylvatica L.) Dominated Alpine Forest against Rockfall. Forests. 2015; 6(6):2178-2198. https://doi.org/10.3390/f6062178
Chicago/Turabian StyleKajdiž, Petra, Jurij Diaci, and Jernej Rebernik. 2015. "Modelling Facilitates Silvicultural Decision-Making for Improving the Mitigating Effect of Beech (Fagus Sylvatica L.) Dominated Alpine Forest against Rockfall" Forests 6, no. 6: 2178-2198. https://doi.org/10.3390/f6062178