Article

Nitrogen Transfer to Forage Crops from a Caragana Shelterbelt

1
Western Applied Research Corporation (WARC), P.O. Box 89 Scott, SK S0K 4A0, Canada
2
World Agroforestry Centre, ICRAF-Tanzania Programme, Dar-es-Salaam, Tanzania
3
Agroforestry Development Centre, Agriculture and Agri-Food Canada (retired), P.O. Box 940, Indian Head, SK S0G 2K0, Canada
4
Department of Soil Science, University of Saskatchewan, 51 Campus Drive, Saskatoon, SK S7N 5A8, Canada
*
Author to whom correspondence should be addressed.
Forests 2015, 6(6), 1922-1932; https://doi.org/10.3390/f6061922
Submission received: 7 April 2015 / Revised: 13 May 2015 / Accepted: 20 May 2015 / Published: 29 May 2015
(This article belongs to the Special Issue Nitrogen and Phosphorus Nutrition of Trees and Forests)

Abstract

:
Caragana shelterbelts are a common feature of farms in the Northern Great Plains of North America. We investigated if nitrogen (N) from this leguminous shrub contributed to the N nutrition of triticale and oat forage crops growing adjacent to the shelterbelt row. Nitrogen transfer was measured using 15N isotope dilution at distances of 2 m, 4 m, 6 m, 15 m and 20 m from the shelterbelt. At 2 m caragana negatively impacted the growth of triticale and oat. At 4 m from the shelterbelt productivity was maximum for both forage crops and corresponded to the highest amount of N originating from caragana. The amount of N transferred from caragana decreased linearly with distance away from the shelterbelt, but even at 20 m from the shelterbelt row measureable amounts of N originating from caragana were detectable in the forage biomass. At 4 m from the shelterbelt approximately 40% of the N in both oat and triticale was from caragana, and at 20 m from the shelterbelt approximately 20% of the N in oat and 8% of the N in triticale was from caragana.

1. Introduction

Field shelterbelts are a common feature on farms in the Northern Great Plains of North America. The first shelterbelts in Canada were planted in 1903 as windbreaks to protect soils, crops and farmyards [1]. In the USA, as part of the 1935 Soil Conservation Act, trees were planted in large numbers as a means of soil erosion control in response to the devastating drought, windstorms and resulting soil erosion that occurred during the Great Depression [2]. Shelterbelts consist of a variety of coniferous and deciduous trees, with specific species adapted to the variety of soils and environments encountered across the region. Planting of shelterbelts had a number of positive impacts including protecting soil from wind erosion [3,4], positively influencing field hydrology through trapping snow [5] and protecting crops from wind damage [3], among other beneficial impacts [6]. Shelterbelts do not only serve as physical barriers to soil and snow movement; they are living barriers that separate cropped fields and as such interact with the adjacent field crops in either a competitive or complementary fashion [7]. Trees compete with adjacent field crops for above-ground and below-ground resources. In the semi-arid climates of the Northern Great Plains, soil moisture is frequently the limiting resource [7,8]. Furthermore, crop yields near shelterbelts can be reduced due to allelopathy by the tree roots [9], nutrient leaching during snowmelt [10], shading [11] and changes to microclimate [12]. Nonetheless, field shelterbelts that typically occupy 5% to 6% of the cropland can produce economic returns to producers based entirely on the increased yields in sheltered areas [13]. In temperate climates, yield increments for a number of field crops affected by shelterbelts ranged from 6% to 44% [6].
Caragana (Caragana arborescens Lam.) is a common shrub found in shelterbelts all across the Canadian prairies. The species is one of the hardiest, small deciduous shrubs planted on the northern Great Plains [12]. It readily adapts to sandy, alkaline soils in open (unshaded) environments [14]. Because it is a legume, caragana has the capacity to form root nodules and fix atmospheric nitrogen (N) [14,15] and enhance N availability [16,17]. Biological N2 fixation accounted for up to 80% of N in caragana leaves in a soil-less system [15] and up to 65% in field soil [17,18]. An intercropping study conducted in Saskatchewan, Canada provides indirect evidence for transfer of N from caragana to willow (Salix miyabeana). Caragana enhanced the growth of willow at two sites, but was outcompeted by willow at a third site [17]. At the first two sites, willow growth increased as a function of the proportion of caragana in the mixed stand suggesting that increased N availability was driving the relationship. Nitrogen transfer was not measured directly.
The objective of this study was to quantify the transfer of N from a caragana shelterbelt to adjacent triticale (X Triticosecale Wittmack) and oat (Avena sativa L.) crops grown for forage in successive years. The influence of distance from the shelterbelt was investigated to determine the extent of the influence of the shelterbelt on N nutrition and forage quality of the adjacent field crops.

2. Experimental Section

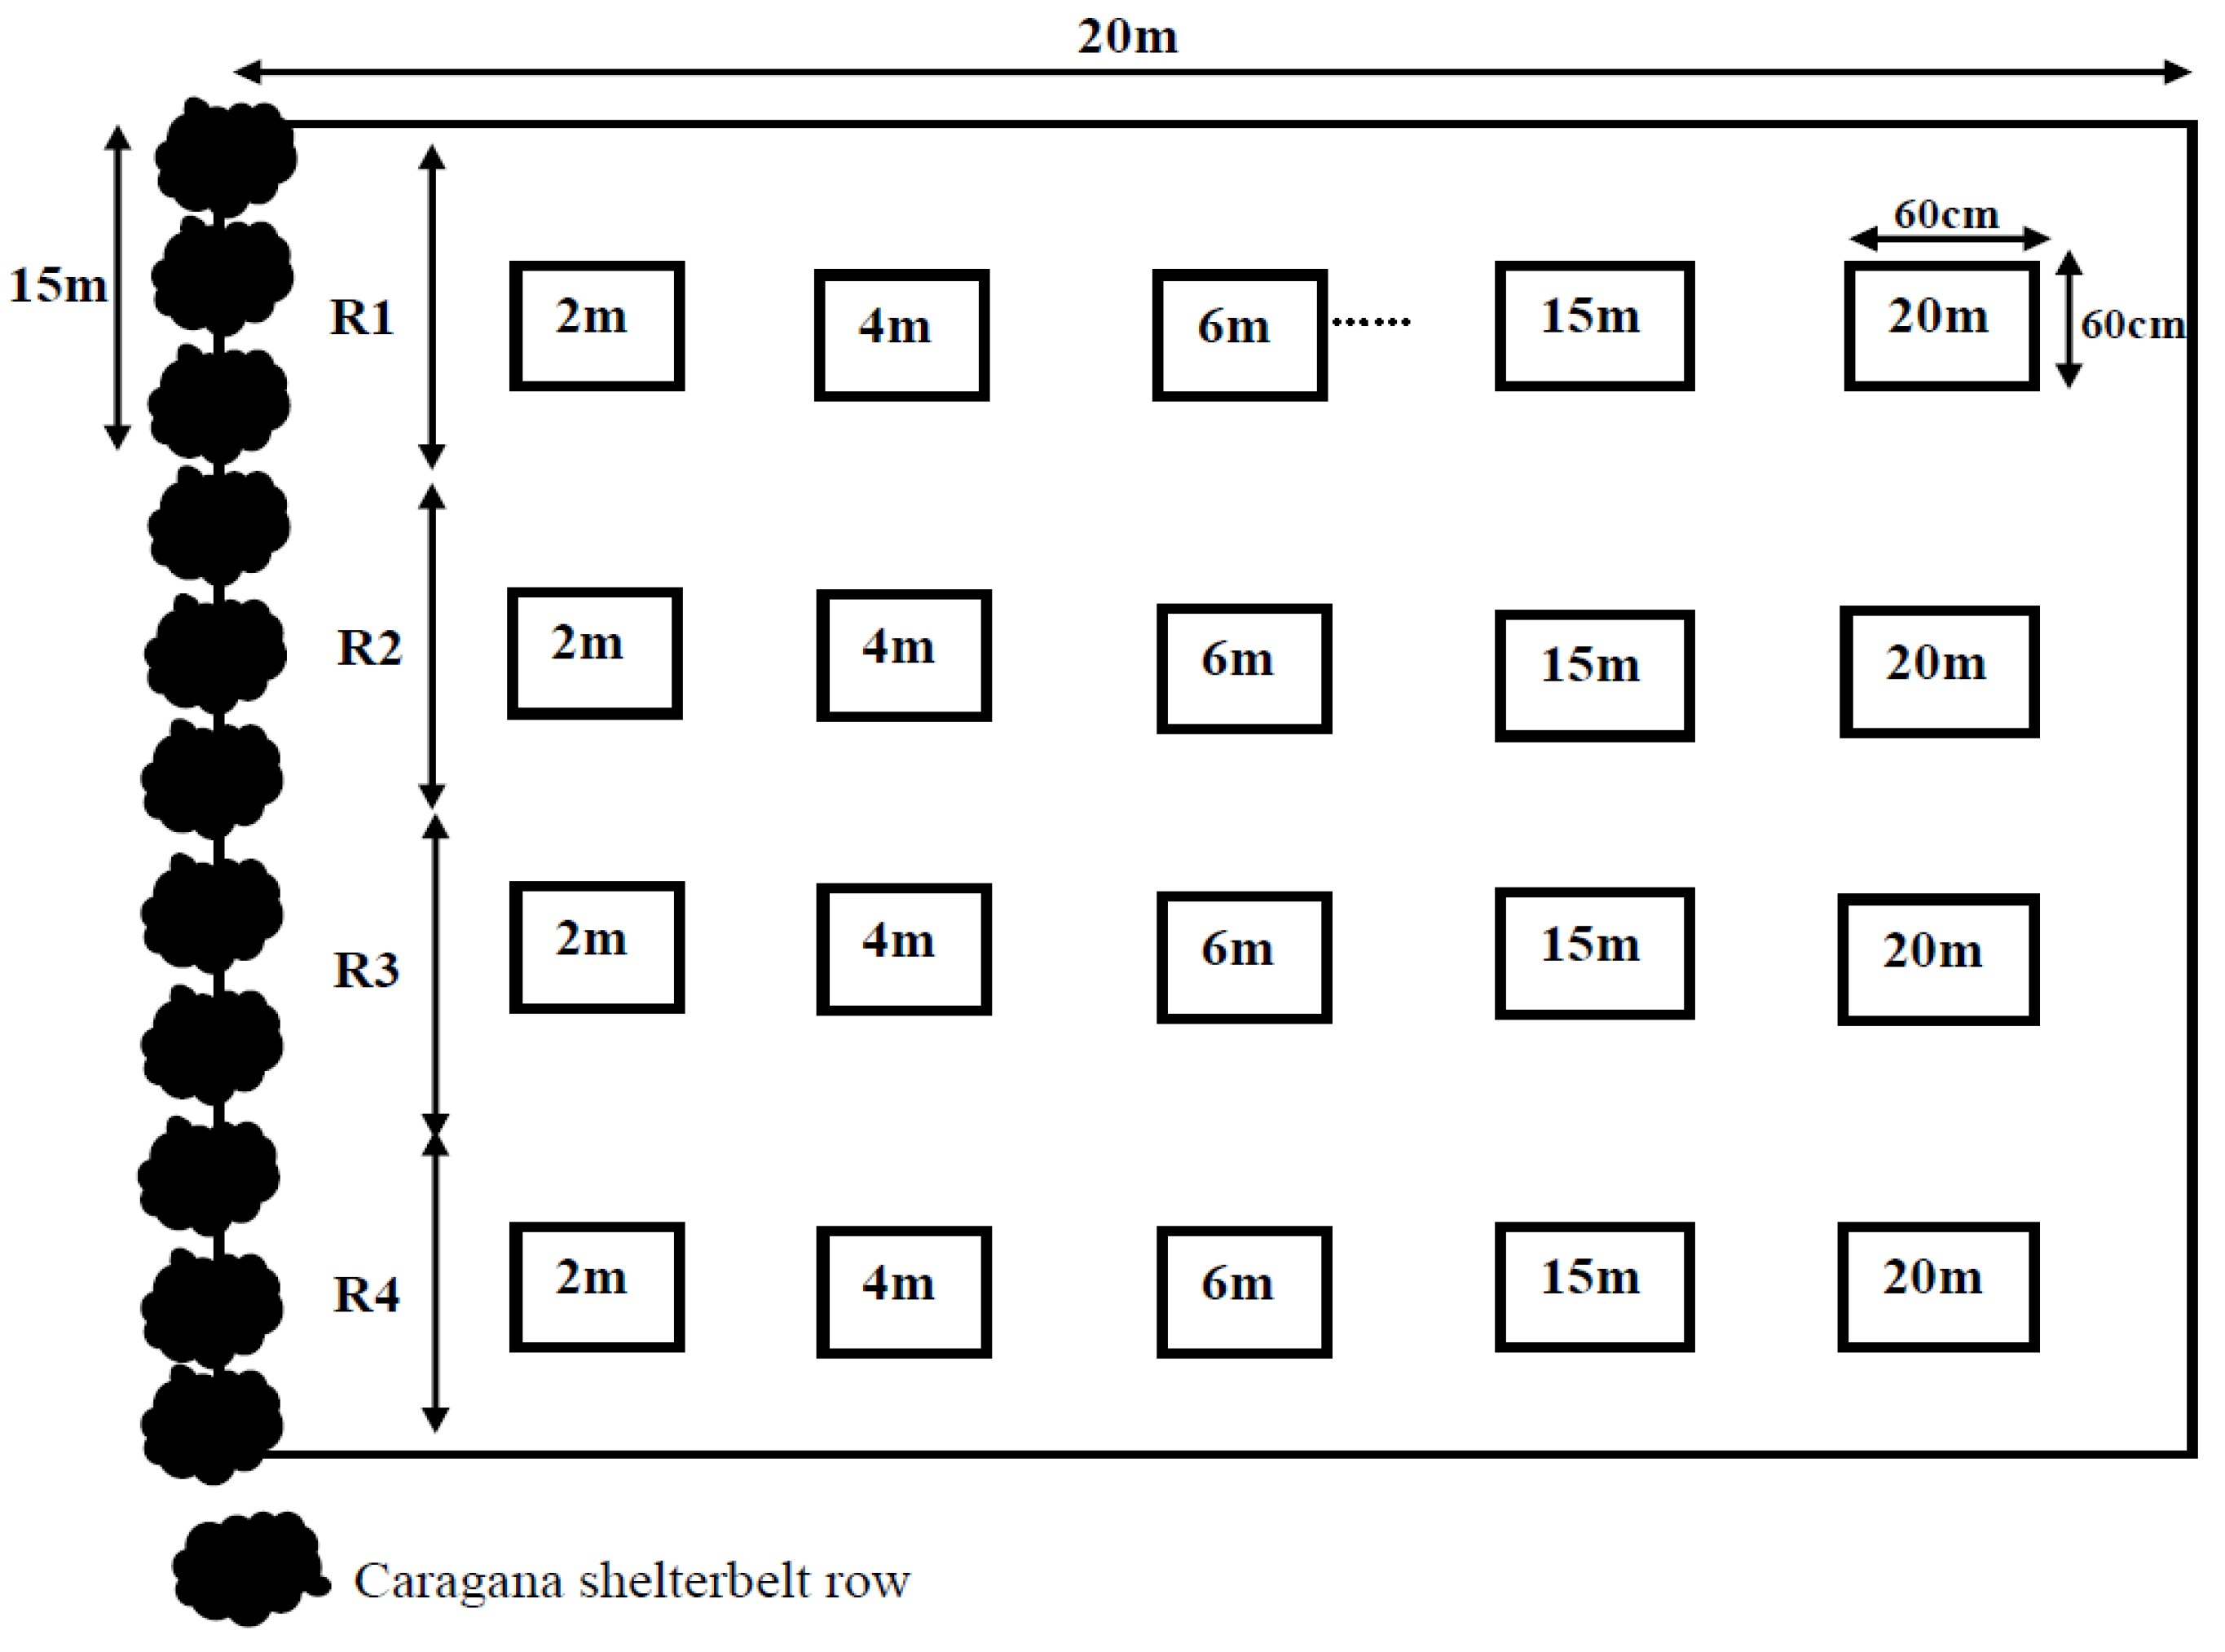
2.1. Experimental Setup

The experiment was established adjacent to an existing caragana shelterbelt at the Agroforestry Development Centre, Indian Head, SK, Canada (50°33′ N 103°39′ W) (Figure 1). The shelterbelt was planted on the nursery site in 1933 in a north-south orientation. Caragana was approximately 5 m tall at the time of the experiment. The shelterbelt is a single row shelterbelt, characteristic of most Canadian shelterbelt plantings [6]. The soil on site is an Orthic Oxbow with a loamy, morainal and hummocky landform, with a slope of 2% to 5% [19]. Because the site was originally a nursery site, historically the shelterbelt received periodic irrigation, fertilization and herbicide and pesticide applications uncharacteristic of shelterbelts on farmland. However, no applications of fertilizers, herbicides nor pesticides have been made for the last twenty-five years.
The shelterbelt is adjacent to an annually cropped field located on the eastern side of the shelterbelt. In the spring of 2011, prior to establishing the experiment, soils were sampled from the site in 15 cm increments to a 45 cm depth. Four soil cores were extracted at five distances from the shelterbelt row, at 2 m, 4 m, 6 m, 15 m and 20 m for physiochemical characterization (Table 1). All analyses were performed using standard protocols [20]. Electrical conductivity (EC) and pH were measured on 1:2 soil: water extracts. In 2011 the field was planted by staff at the Agroforestry Development Centre with spring triticale (X Triticosecale Wittmack cv. AC Ultima) at a seeding rate of 90 kg ha−1 and in 2012 the field was planted with Pinnacle oat (Avena sativa L.) at a seeding rate of 90 kg ha−1. Total precipitation during the 2011 growing season (May to September) was 290 mm and average temperature was 15.3 °C. In the 2012 growing season (May to September) the total precipitation was 285 mm and temperature 15.1 °C. The long-term (1971 to 2000) averages for the area were 255 mm precipitation and temperature of 15.9 °C.
Table 1. Physiochemical properties of Orthic Oxbow soil at distances perpendicular to a caragana shelterbelt.
Distance (m)pHEC (mS cm–1)PNO3NH4+SOCK+Mg2+Ca2+
mg kg−1g kg−1cmol (+) kg−1
0–15 cm
28.04 0.2622.048.273.725.667.550.701.869.83
48.050.1726.212.403.095.157.050.621.669.29
68.060.1921.341.522.854.477.000.521.989.50
158.010.2227.232.233.367.657.200.632.217.75
207.930.2631.942.993.779.007.450.652.447.27
15–30 cm
28.210.206.401.504.274.184.500.362.289.07
48.310.166.311.023.744.255.100342.069.32
68.370.1511.481.253.854.294.950.332.118.86
158.170.209.501.173.326.555.900.342.357.79
208.260.238.510.873.0711.165.150.292.918.21
30–45 cm
26.400.135.360.223.333.372.450.232.586.13
48.490.189.770.293.944.183.000.313.108.34
68.450.206.090.673.664.113.550.242.708.27
158.440.215.640.493.307.803.450.232.757.90
208.560.295.160.464.25nd 3.800.253.347.79
Mean values (n = 4); nd = no data.
In each of the two years of the study four 15 m × 20 m plots were established perpendicular to the shelterbelt on the eastern side of the shelterbelt (Figure 1). Within each plot, 0.6 m × 0.6 m subplots were established at distances 2 m, 4 m, 6 m, 15 m and 20 m from the centre of the shelterbelt. Above-ground biomass from the triticale and oat sub-plots was hand-harvested approximately 5 cm above the soil surface using scissors, 9 and 10 weeks after planting, respectively. The time of sampling corresponded to the mid to late milk stage of development (BBCH = 76) for each crop, after maximum N uptake occurred. In cereal crops maximum N uptake typically occurs around 60 to 65 days after emergence [21]. Four additional reference samples were collected from outside the main plots approximately 50 m from the shelterbelt. Plants from these reference plots were assumed to be far enough from the caragana so as not to be influenced by the caragana and not to have accessed N fixed by the caragana. Leaves from caragana were collected from four randomly selected locations within the canopy of the shelterbelt in the experimental plot. Delta 15N values from the reference crops and the caragana were used in calculating N transfer from the caragana to the adjacent crops (Equation 1). Plant samples were oven-dried at 60 °C to stable weight and ground using a Wiley mill (Thomas Scientific, Swedesboro, NJ, USA), and re-ground to fine powder using a ball grinder (8000D Mixer/Mill, SPEX Sample Prep® LLC., Metuchen, NJ, USA). Subsamples (ca. 1 mg) were weighed using a micro-balance (Sartorius Microbalance, CPA2P, Bradford, MA, USA) and encapsulated in 8 mm × 5 mm tin capsules for analysis of N concentration and δ15N on a Costech ECS4010 elemental analyzer (Costech Analytical Technologies Inc., Valencia, CA, USA) coupled to a Delta V Advantage mass spectrometer (Thermo Scientific, Bremen, Germany) at the University of Saskatchewan (Saskatoon, SK, Canada). The δ15N of the samples was used to calculate the percentage of N derived from the atmosphere (% Ndfa) that was transferred from the caragana to the triticale and oats (% Ntransfer) [21]:
% N t r a n s f e r =   ( δ 15 N c r o p δ 15 N t r e e / c r o p δ 15 N c r o p δ 15 N t r e e ) × 100 %
Where δ15Ncrop is the value for the reference triticale or oat not influenced by the caragana and accessing only soil available N; δ15Ntree/crop is triticale or oat influenced by the caragana and assumed to access N from soil available N and caragana fixed N; and δ15Ntree is the value for the caragana. Amount of N transferred from caragana to triticale or oat was calculated as the product of %Ntransfer and amount of N in the crop.
Statistical analyses were performed on %Ntransfer and amount of N transferred using SAS version 9.2 [22]. Simple linear regression was performed on %Ntransfer, the amount of N transferred, total N in the shoots of the forage crops and shoot biomass, as a function of distance from the shelterbelt using PROC REG procedure in SAS. Regression analysis was performed with data from the 2 m distance included and excluded. Only regressions where the 2 m distance measurements were excluded were significant (P < 0.05) and are reported.
Figure 1. Diagram (not drawn to scale) of experimental plot layout showing replicates and sampling subplots at 2 m, 4 m, 6 m, 15 m and 20 m from the caragana shelterbelt (60 cm × 60 cm) within each 15 m swath.
Forests 06 01922 g001

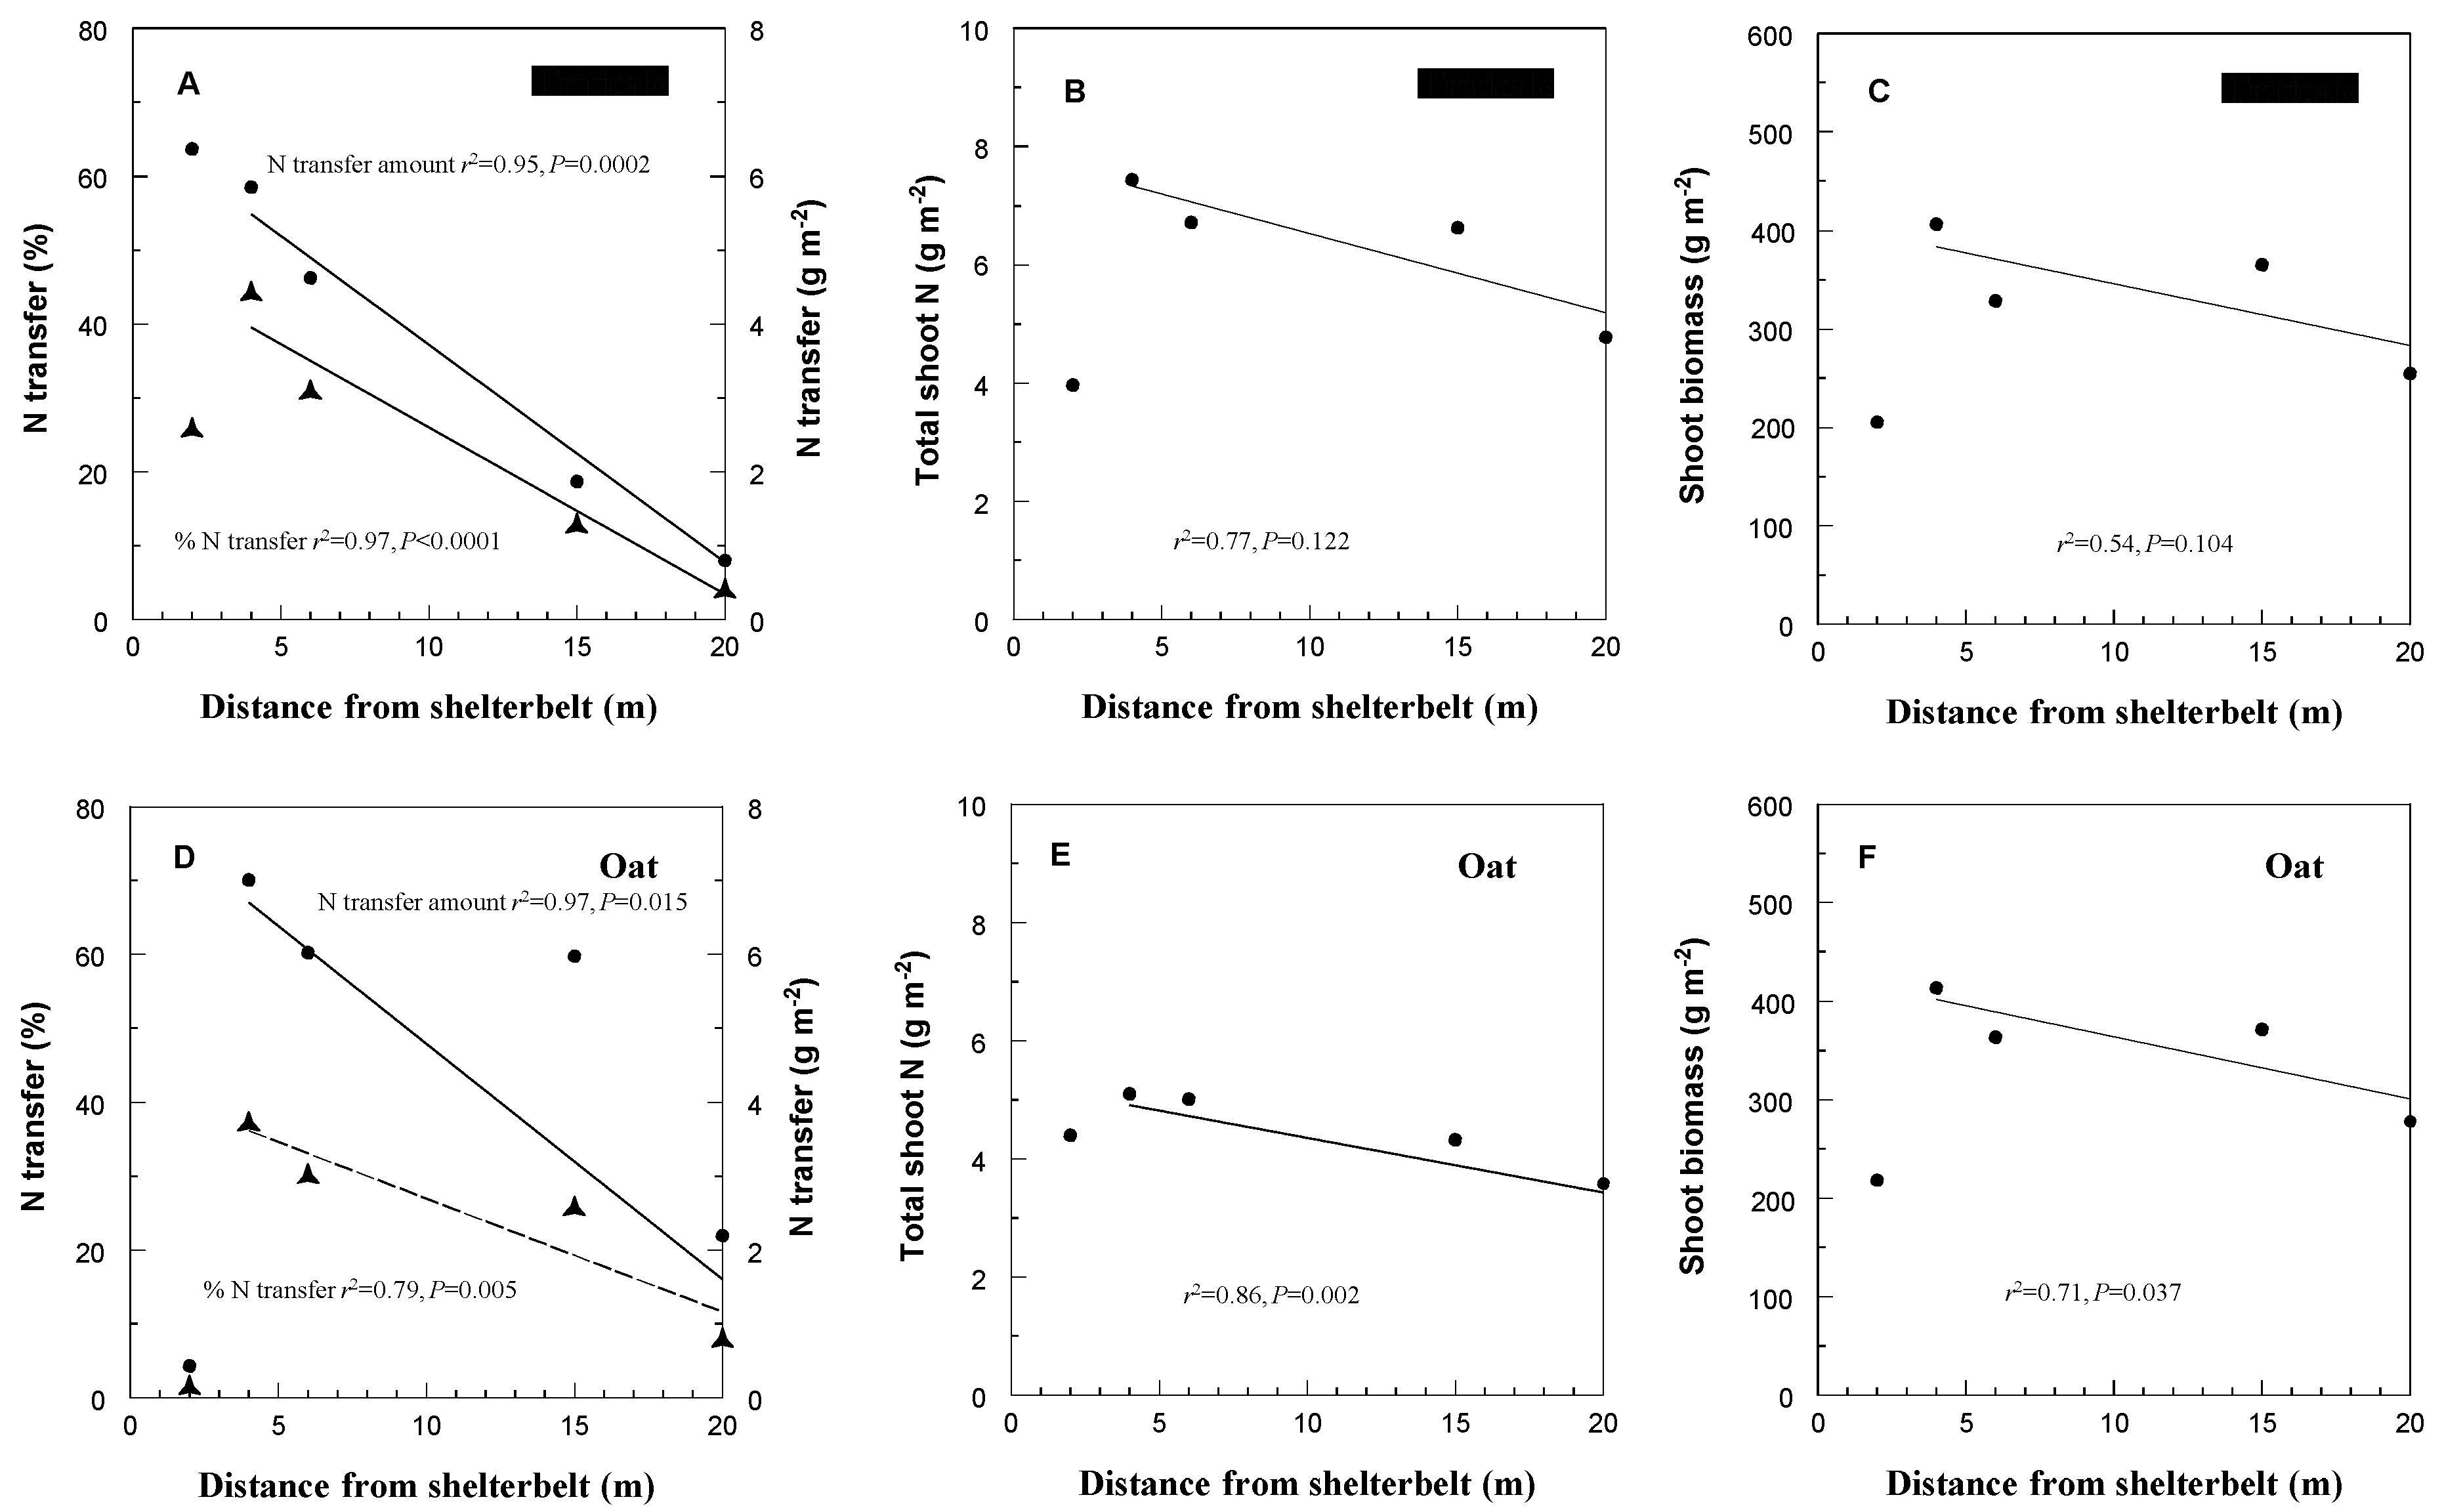
3. Results and Discussion

Substantial N transfer from caragana to triticale and oat occurred in the two years of the study (Figure 2A and Figure 2D). Except at the 2 m distance, both percentage of N and the amount of N (g N m−2) originating from caragana in the triticale and oat biomass decreased linearly with increasing distance from the shelterbelt (Figure 2A and Figure 2D). Both triticale and oat productivity were severely limited 2 m from the shelterbelt with both crops producing about 50% of the biomass produced 4 m from the shelterbelt (Figure 2C and Figure 2F). Productivity of both crops was maximum at 4 m (Figure 2C and Figure 2F) corresponding to the same distance at which the maximum amount of N was transferred (Figure 2A and Figure 2D). The amount of N transferred to triticale at 2 m was about 58% of the transfer at 4 m and for oat only about 3.5% of the transfer at 4 m.
Low yields near shelterbelts have long been reported e.g., [11,23]. At the 2 m distance from the shelterbelt competition for water, light and/or nutrients between the caragana and the crop plants were probably responsible for the low yields of the crops. In temperate climates, competition for water is generally more limiting than competition for light [8] and has been reported to decrease yields of crops near tree rows [7]. Some early research focused on estimating the zone of influence of shelterbelts in terms of the negative impact on yield. Read [23] estimated yield reductions occurred to 1 h, where h is the height of the shelterbelt. Stoeckeler [11] suggested a range of 0.5 h to 1.5 h and Lyles et al. [24] reported reduced yields at a distance of 2 h. In our study the negative influence on forage yield of the approximately 5 m-tall shelterbelt was narrow at less than 4 m from the shelterbelt for both crops (i.e., <1 h). Considering that caragana has a very vigorous and aggressive growth habit and can be invasive in some conditions [14,25] this narrow zone of negative influence was somewhat surprising.
The benefits from the N2-fixing capabilities of the plant might balance the negative impacts from the invasive nature of the shrub. Indeed the vigorous root growth of caragana might be responsible for the significant N transfer observed up to about 15 m in both crops. Considering tree root density decreases with increasing distance from the shelterbelt row, this approximately 15 to 20 m zone of influence in this study is assumed to be indicative of the zone where direct transfer of N takes place through root to root contact or mycorrhizal associations, probably augmented by indirect transfer through mineralization of below-ground roots and sloughed cells, nodules, and other organic compounds excreted from roots, and possibly leaf litter fall.
Studies using 15N labeling have demonstrated net N transfer from legume tree saplings to grass grown together in containers [26] and have provided evidence of N transfer via mycorrhiza between N2-fixing and non-fixing tree species [27,28,29]. Natural abundance methodologies have provided similar estimates of N transfer between trees [30,31,32]. The natural abundance method has an advantage over 15N labeling studies in that N is not added to the soil or plant, enabling N transfer to be estimated without disturbing the system. However the method relies on very small differences in natural abundance values between the legume and non-legume plants and in the soil inorganic N pool. Any soil processes like nitrification, denitrification and ammonium volatilization that discriminate against 15N can bias the estimates by altering the δ15N signature of the inorganic N pool accessed by the plants. Furthermore, isotope ratio mass spectrometry (IRMS) analyses require a very small amount of an organic sample (typically 1 mg–10 mg) representative of the entire sample. It is essential that the organic material sampled is finely ground and homogeneously mixed. Because of the small size of the subsample for IRMS even small deviations in weighing samples can have a relatively large effect, particularly on the percent N values. Nonetheless natural abundance studies have been used successfully to estimate N transfer [30,31,32]. In our study, differences in δ15N between the caragana and triticale and oat are sufficiently large and consistent to provide a confident estimate of N transfer (Table 2).
Table 2. Delta 15N values of leaves (caragana) or shoots (triticale and oats) where triticale and oats are grown adjacent to a mature caragana shelterbelt row (distance 0) and sampled at perpendicular distances away from the shelterbelt.
CaraganaTriticaleOats
Distance (m)δ15N (per mil)Std Devδ15N (per mil)Std Devδ15N (per mil)Std Dev
04.550.44----
2--7.030.658.1751.20
4--7.380.445.8450.75
6--8.220.786.2680.18
15--8.991.916.2850.19
20--10.831.197.9351.18
P-value0.0028 0.0047
The negative impact of the shelterbelt on forage crop yield 2 m from the shelterbelt was also observed for the amount of N transferred (Figure 2A and Figure 2D). Despite lower yields and lower amounts of N transferred at 2 m compared to 4 m, in triticale approximately 60% of the N in the shoots was transferred from caragana at 2 m, whereas in oat only about 5% of N in the shoots was transferred from caragana. It is clear that the two forage crops interacted differently in the immediate vicinity of the shelterbelt trees. The concentration of N in the oat shoot biomass was higher at 2 m (2.3 ± 0.23 mg N g−1) compared to the further distances (1.5 ± 0.13 mg g−1 averaged over the 4 to 20 m distance) indicating a concentration of N because of low dry matter production but similarly indicating that amounts of N present were sufficient to support the biomass produced at this distance. In contrast, in triticale N concentration was constant across the sampling transect (2.0 ± 0.13 mg N g−1). Initial soil sampling in 2011 indicated that amounts of nitrate in the top 15 cm were higher 2 m from the shelterbelt than elsewhere in the field (Table 1). Soils were not sampled in 2012, but it appears that the levels of available N near the shelterbelt were sustained at high enough levels to fully supply the N requirement of oat at this distance. Amounts of soil N are typically higher near the tree line than in cropped areas in agroforestry systems [33,34,35].
Even though oat did not appear to rely on direct transfer from caragana through root to root contact or mycorrhizal connections, the lack of any apparent N transfer from caragana to the oat crop at the 2 m distance was unexpected. Oats at the 2 m distance should still be accessing N mineralized from caragana litter fall. In addition to the 15N signature of organic matter inputs, changes in 15N natural abundance of the available soil N can also occur through soil processes like nitrification, denitrification and NH3 volatilization. Discrimination against 15N occurs in all processes causing a decrease in δ15N associated with nitrification or an increase in δ15N associated with volatilization and denitrification [36]. Soil conditions near the shelterbelts should be conducive for denitrification in that snow melt in this snow accumulation zone could potentially provide the necessary anaerobic conditions, and mineralization of leaf litter the necessary nitrate and soil organic carbon substrates (Table 1). The high δ15N signature of the oat growing at the 2 m distance could be a result of a high δ15N signature in the soil N because of denitrification and/or volatilization. Alternatively, snowmelt and or/rainfall may have leached nitrate out of the rooting zone of the oat crop [10].
Despite N transfer to oat being negligible close to the caragana shelterbelt, the positive impact of the caragana on N transfer was sustained over larger distances for oat than triticale (Figure 2D and Figure 2A). Whereas the amount of N transferred to triticale at 20 m was only 9% of N transferred at 4 m, the amount transferred to oat at 20 m was 22% of that transferred at 4 m. At 20 m approximately 20% of the N in oat was from caragana, whereas in triticale, N from caragana constituted only about 8% of the shoot N. The total amount of N in the shoot tissue of triticale (i.e., transferred N + soil derived N) was about 1.3 times the amount in oat indicating a stronger sink for N (Figure 2B and Figure 2E). It appears that the stronger demand for N probably led to the supply of available N being used up faster in triticale than oat.
There are few studies in the literature examining the distance to which N transfer occurs particularly in mature shelterbelts. Daudin and Sierra [37] measured transfer between Gliricidia sepium and Dichanhium aristatum (Poir) in a 16-year old tropical agroforestry system over a 5 m distance. They measured a very similar pattern of decreasing N transfer to the grass with distance away from the tree row, and a decreasing trend in total N uptake from the soil. In general % N derived from the tree was relatively stable at around 50% over 3 m to 4 m, with percentages decreasing slightly at 5 m [37].
Isaac et al. [38] reported that N2-fixation in Acacia senegal decreased with the age of the tree. In contrast, caragana appears to sustain relatively high N2-fixation in mature trees at levels that sustain significant transfer to the adjacent crop.
Figure 2. Nitrogen transfer characteristics and above-ground productivity in triticale (AC) and oat (DF) as a function of perpendicular distance away from a caragana shelterbelt. (A,D) are percentage of N in the forage crops transferred (dots) from caragana and amount of N transferred (triangles); (B,E) are total N in the above-ground biomass and (C,F) are above-ground biomass.
Forests 06 01922 g002

4. Conclusions

Significant amounts of N were transferred from a mature caragana shelterbelt to adjacent oat and triticale forage crops. Close to the shelterbelt (<4 m) caragana negatively impacted the productivity of the adjacent forage crop. However at 4 m from the shelterbelt row, forage biomass and N content were at their maximum. Using the 15N dilution protocol significant amounts of N originating from the caragana were detected in the shoot biomass of triticale and oat. Nitrogen transferred from caragana represented approximately 40% of the total N in the shoot of both triticale and oat 4 m from the shelterbelt. Both the percentage of N transferred and the amount of N transferred decreased linearly with distance away from the shelterbelt. Measureable amounts of N originating from caragana were detectable in the triticale and oat biomass 20 m from the shelterbelt row.

Acknowledgments

Funding from Agriculture and Agri-Food Canada (ADC) under the Research Affiliate Program (RAP) and University of Saskatchewan is appreciated. Authors also acknowledge the support from staff and the administration of the Agroforestry Development Centre, Indian Head, SK, Canada, during fieldwork. Our thanks to the Stable Isotope Laboratory, University of Saskatchewan for the 15N analysis.

Author Contributions

This manuscript reports on the results of one chapter of Gazali Issah’s MSc research supervised by Anthony A. Kimaro and Knight. J. Kort (retired) was the scientist at the AAFC-Agroforestry Development Centre. All authors provided input into the design and implementation of the experiment. The manuscript was written by Gazali Issah and J. Diane Knight and edited by the other authors. All authors contributed significantly to the research.

Conflicts of Interest

The authors declare no conflicts of interest.

References

  1. One Hundred Years of Prairie Forestry. Available online: http://www.ourspace.uregina.ca/handle/10294/129 (accessed on 25 March 2015).
  2. Arha, K.; Josling, T.; Sumner, D.A.; Thompson, B.H. National Forum on U.S. Agricultural Policy and the 2007 Farm Bill: Conserving the Ecological Integrity and Economic Resilience of American Working Lands. Woods Institute for the Environment, Stanford University: California, CA, USA, 2007; pp. 1–257. Available online: http://media.law.stanford.edu/publications/archive/pdf/farmbill_book. pdf (accessed on 23 March 2015).
  3. Public Fundraising Regulatory Association. A Study of Tree Planting on the Canadian Prairies; Government of Canada-PFRA: Regina, SK, Canada, 1976; pp. 1–184.
  4. Sutton, V. An Evaluation of Landowner’s Attitudes toward Field Shelterbelts in Manitoba: A Case Study in the Lyleton Area. Master’s Thesis, University of Manitoba, Winnipeg, Manitoba, Canada, 1983. [Google Scholar]
  5. Scholten, H. Snow distribution on crop fields. Agric. Ecosyst. Environ. 1988, 22–23, 363–380. [Google Scholar] [CrossRef]
  6. Kort, J. Benefits of windbreaks to field and forage crops. Agric. Ecosyst. Environ. 1988, 22–23, 165–190. [Google Scholar] [CrossRef]
  7. Jose, S.; Gillespie, A.R.; Seifert, J.R.; Biehle, D.J. Defining competition vectors in a temperate alley cropping system in the Midwestern USA: 2. Competition for water. Agroforest. Syst. 2000, 48, 41–59. [Google Scholar] [CrossRef]
  8. Gillespie, A.R.; Jose, S.; Mengel, D.B.; Hoover, W.L.; Pope, P.E.; Seifert, J.R. Defining competition vectors in a temperate alley cropping system in the Midwestern USA: 1. Production physiology. Agroforest. Syst. 2000, 48, 25–40. [Google Scholar] [CrossRef]
  9. Zolotukhin, A.I. Allelopathic effect of shrubs used in steppe afforestation. Ekologiya 1980, 11, 13–17. [Google Scholar]
  10. George, E.J. Effect of Tree Windbreaks and Slat Barriers on Wind Velocity and Crop Yields; USDA Agricultural Research Service: Washington, DC, USA, 1971; p. 23.
  11. Stoeckeler, J.H. The design of shelterbelts in relation to crop yield improvement. World Crop. 1965, 17, 3–8. [Google Scholar]
  12. George, E.J. Tree and shrub species for the northern Great Plains. Cir. USDA. 1953, 912, 46. [Google Scholar]
  13. Brandle, J.R.; Johnson, B.B.; Dearmont, D.D. Windbreak economics: The case of winter wheat production in Eastern Nebraska. J. Soil Water Conserv. 1984, 39, 339–343. [Google Scholar]
  14. Dietz, D.R.; Slabaugh, P.E.; Bonner, F.T. Caragana arborescens Lam.: Siberian peashrub. In The Woody Plant Seed Manual; Franklin, T., Karrfalt, R.P., Eds.; Department of Agriculture, Forest Service: Washington, DC, USA, 2008; Volume 727, pp. 321–323. [Google Scholar]
  15. Moukoumi, J.; Hynes, R.K.; Dumonceaux, T.J.; Town, J.; Bélanger, N. Characterization and genus identification of rhizobial symbionts from Caragana arborescens in western Canada. Can. J. Micro. 2013, 59, 399–406. [Google Scholar] [CrossRef] [PubMed]
  16. Su, Y.Z.; Zhao, H.L. Soil properties and plant species in an age sequence of Caragana microphylla plantations in the Horqin Sandy Land, north China. Ecol. Eng. 2003, 20, 223–235. [Google Scholar] [CrossRef]
  17. Moukoumi, J.; Farrell, R.E.; van Rees, K.J.C.; Hynes, R.K.; Bélanger, N. Growth and nitrogen dynamics of juvenile short rotation intensive cultures of pure and mixed Salix miyabeana and Caragana arborescens. Bioenergy Res. 2012, 5, 719–732. [Google Scholar] [CrossRef]
  18. Issah, G.; Kimaro, A.A.; Kort, J.; Knight, J.D. Quantifying biological nitrogen fixation of agroforestry shrub species using 15N dilution techniques under greenhouse conditions. Agroforest. Syst. 2014, 8, 607–617. [Google Scholar] [CrossRef]
  19. Agriculture and Agri-Food Canada. The soils of Indian Head Rural Municipality. In Saskatchewan Soil Survey, 156; Saskatchewan Institute of Pedology, University of Saskatchewan: Saskatoon, SK, Canada, 1986. [Google Scholar]
  20. Carter, M.R.; Gregorich, E.G. Soil sampling and methods of analysis. In Canadian Society of Soil Science, 2nd ed.; CRC Press: Boca Raton, FL, USA, 2008. [Google Scholar]
  21. Malhi, S.S.; Johnston, A.M.; Schoenau, J.J.; Wang, Z.H.; Vera, C.L. Seasonal biomass accumulation and nutrient uptake of wheat, barley and oat on a Black Chernozem soil in Saskatchewan. Can. J. Plant Sci. 2006, 86, 1005–1014. [Google Scholar] [CrossRef]
  22. SAS Institute. version 9.2; SAS/STAT user’s guide; SAS Institute Inc.: Cary, NC, USA, 2008. [Google Scholar]
  23. Read, R.A. Tree windbreaks for the central Great Plains. In Agriculture Handbook 250; USDA forest Service: Washington, DC, USA, 1964; p. 68. [Google Scholar]
  24. Lyles, L.; Tatarko, J.; Dickerson, J.D. Windbreak effects on soil water and wheat yield. Trans. ASAE 1984, 20, 69–72. [Google Scholar] [CrossRef]
  25. Henderson, D.C.; Chapman, R. Caragana arborescens invasion in Elk Island National Park, Canada. Nat. Areas J. 1996, 26, 261–266. [Google Scholar] [CrossRef]
  26. Rao, A.V.; Giller, K.E. Nitrogen fixation and its transfer from Leucaena to grass using 15N. For. Ecol. Manag. 1993, 61, 221–227. [Google Scholar] [CrossRef]
  27. Arnebrandt, K.; Ek, H.; Finlay, R.D.; Soderstrom, B. Nitrogen translocation between Alnus lutinosa (L.) Gaertn. seedlings inoculated with Frankia sp. and Pinus contorta Doug, ex Loud seedlings connected by a common ectomycorrhizal mycelium. New Phytol. 1993, 124, 231–242. [Google Scholar] [CrossRef]
  28. Ekbland, A.; Huss-Danell, K. Nitrogen fixation by Alnus incana and nitrogen transfer from A. incana to Pinus sylvestris influenced by macronutrients and ectomycorrhiza. New Phytol. 1995, 131, 453–459. [Google Scholar] [CrossRef]
  29. Roggy, J.C.; Moiroud, A.; Lensi, R.; Domenach, A.M. Estimating N transfer between N2-fixing ctinorhizal species and the non-N2-fixing Prunus avium under partially controlled conditions. Biol. Fert. Soils 2004, 39, 312–319. [Google Scholar]
  30. Binkley, D.; Sollins, P.; McGill, W.B. Natural abundance of nitrogen-15 as a tool for tracing alder-fixed nitrogen. Soil Sci. Soc. Am. J. 1985, 49, 444–447. [Google Scholar] [CrossRef]
  31. Snoeck, D.; Zapata, F.; Domenach, A.M. Isotopic evidence of the transfer of nitrogen fixed by legumes to coffee trees. Biotech. Agron. Soc. Environ. 2000, 4, 95–100. [Google Scholar]
  32. Sierra, J.; Nygren, P. Transfer of N fixed by a legume tree to the associated grass in a tropical silvopastoral system. Soil. Biol. Biochem. 2006, 3, 1893–1903. [Google Scholar] [CrossRef]
  33. Kremer, R.J.; Li, J. Developing weed-suppressive soils through improved soil quality management. Soil Tillage Res. 2003, 72, 193–202. [Google Scholar] [CrossRef]
  34. Udawatta, R.P.; Kremer, R.J.; Adamson, B.W.; Anderson, S.H. Variations in soil aggregate stability and enzyme activities in a temperate agroforestry practice. Appl. Soil Ecol. 2008, 39, 153–160. [Google Scholar] [CrossRef]
  35. Paudel, B.R.; Udawatta, R.P.; Kremer, R.J.; Anderson, S.H. Agroforestry and grass buffer effects on soil quality parameters for grazed pasture and row-crop systems. Appl. Soil Ecol. 2011, 48, 125–132. [Google Scholar] [CrossRef]
  36. Hogberg, P. 15N natural abundance in soil-plant systems. New Phytol. 1997, 137, 179–203. [Google Scholar] [CrossRef]
  37. Daudin, D.; Sierra, J. Spatial and temporal variation of below-ground N transfer from a leguminous tree to an associated grass in an agroforestry system. Agri. Ecosyst. Environ. 2008, 126, 275–280. [Google Scholar] [CrossRef]
  38. Isaac, M.E.; Harmand, J.M.; Lesueur, D.; Lelon, J. Tree age and soils phosphorus conditions influence N2-fixation rates and soil N dynamics in natural populations of Acacia senegal. For. Ecol. Manag. 2013, 261, 582–588. [Google Scholar] [CrossRef]

