
Allelic Variation in Cinnamyl Alcohol Dehydrogenase (LoCAD) Associated with Wood Properties of Larix olgensis

Abstract
:1. Introduction
2. Experimental Section
2.1. Association Population
2.2. Phenotypic Data
2.3. DNA Extraction and CAD Gene Identification
2.4. SNP Discovery and Genotyping
2.5. Nucleotide Diversity and Linkage Disequilibrium
2.6. Association Analysis
3. Results
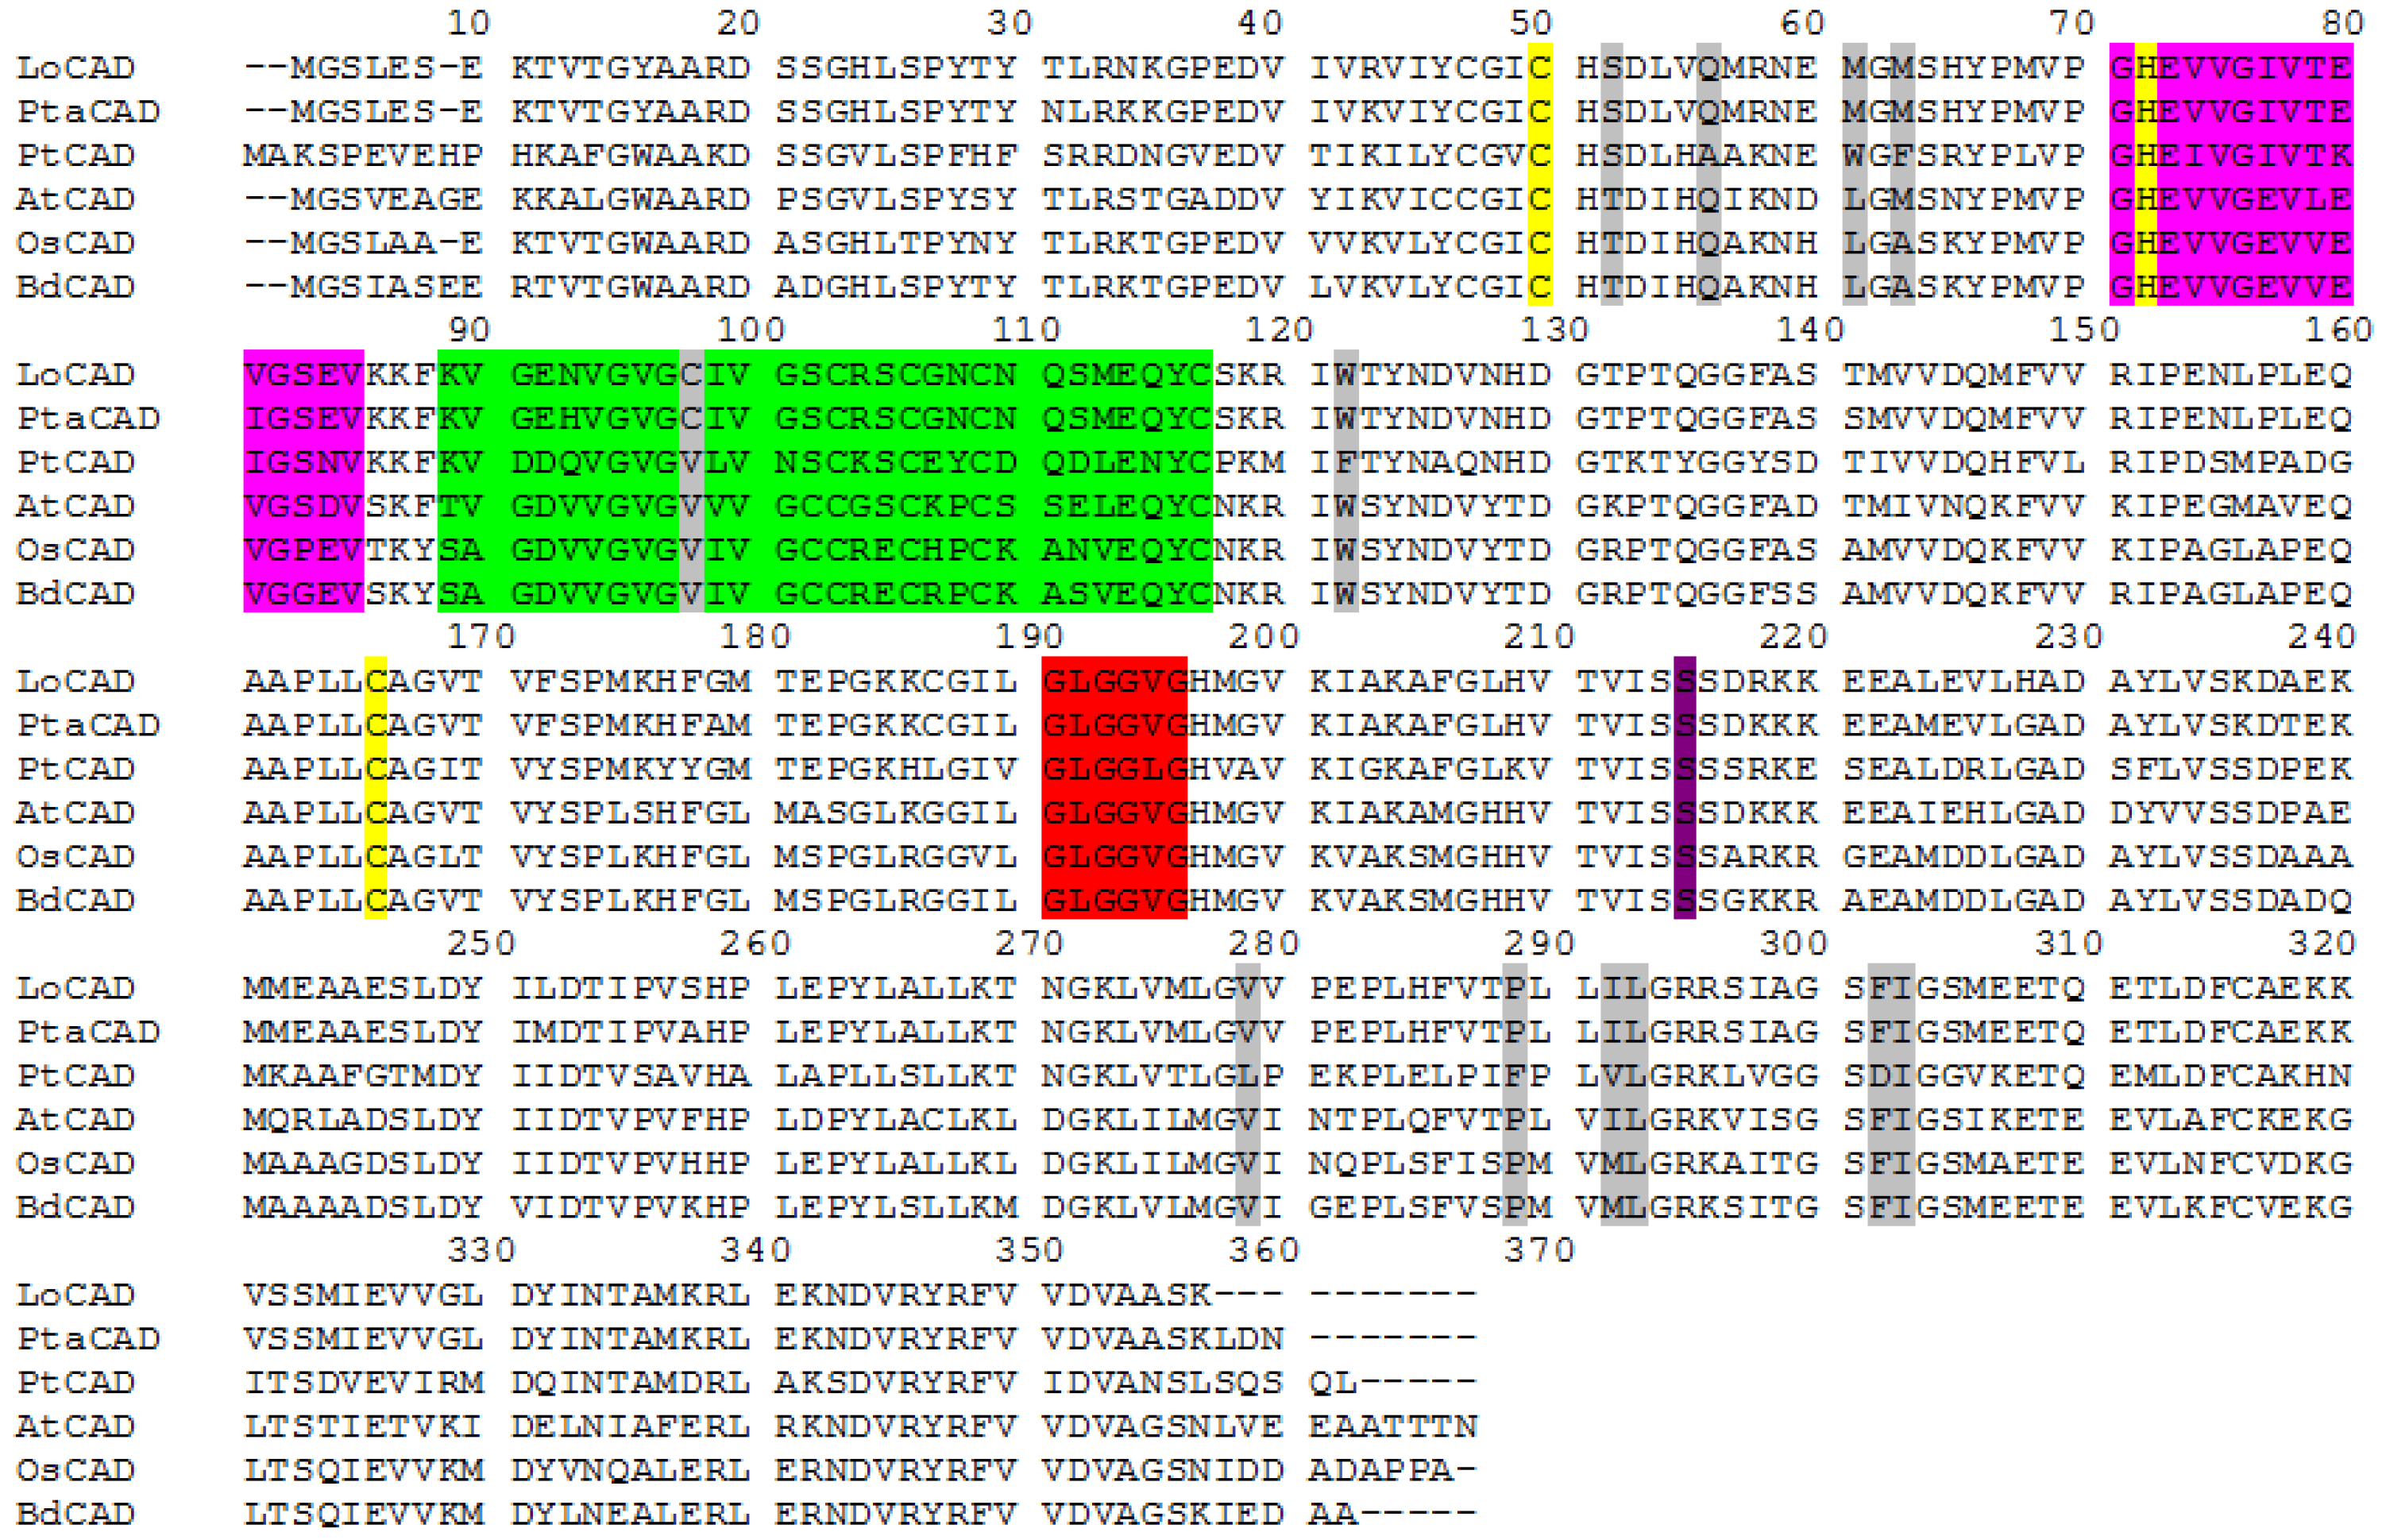
3.1. Identification and Phylogenetic Analysis of LoCAD
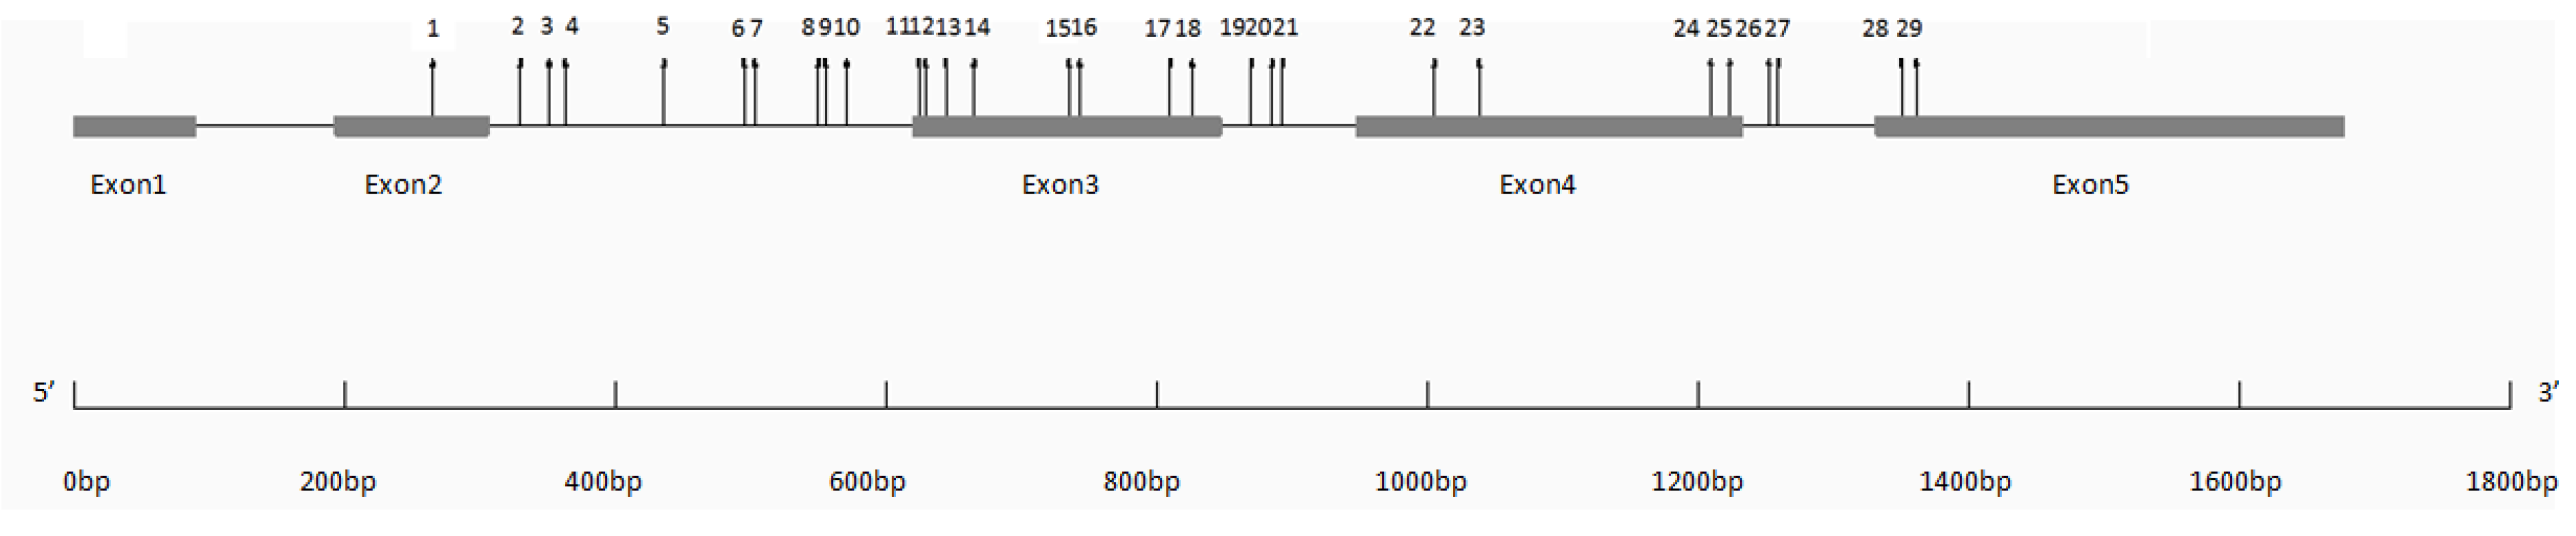
3.2. SNP Diversity and Genotyping

| Region | Length (bp) | Number of Polymorphic Sites | Frequency (bp−1) | Nucleotide Diversity | |
|---|---|---|---|---|---|
| πT | θW | ||||
| Exon 1 | 90 | 0 | - | - | - |
| Intron 1 | 103 | 0 | - | - | - |
| Exon 2 | 113 | 1 | 113 | 0.00141 | 0.00219 |
| Intron 2 | 312 | 9 | 35 | 0.01018 | 0.00738 |
| Exon 3 | 227 | 8 | 28 | 0.00420 | 0.00498 |
| Intron 3 | 100 | 3 | 33 | 0.01012 | 0.00994 |
| Exon 4 | 285 | 4 | 71 | 0.00373 | 0.00276 |
| Intron 4 | 99 | 2 | 50 | 0.00524 | 0.00406 |
| Exon 5 | 346 | 2 | 173 | 0.01515 | 0.01836 |
| Synonymous | 141.14 | 3 | 40 | 0.00269 | 0.00271 |
| Nonsynonymous | 572.86 | 12 | 47 | 0.00303 | 0.00304 |
| Total exon | 1061 | 15 | 71 | 0.00377 | 0.00474 |
| Total intron | 614 | 14 | 44 | 0.00731 | 0.00667 |
| Total | 1675 | 29 | 58 | 0.00622 | 0.00646 |
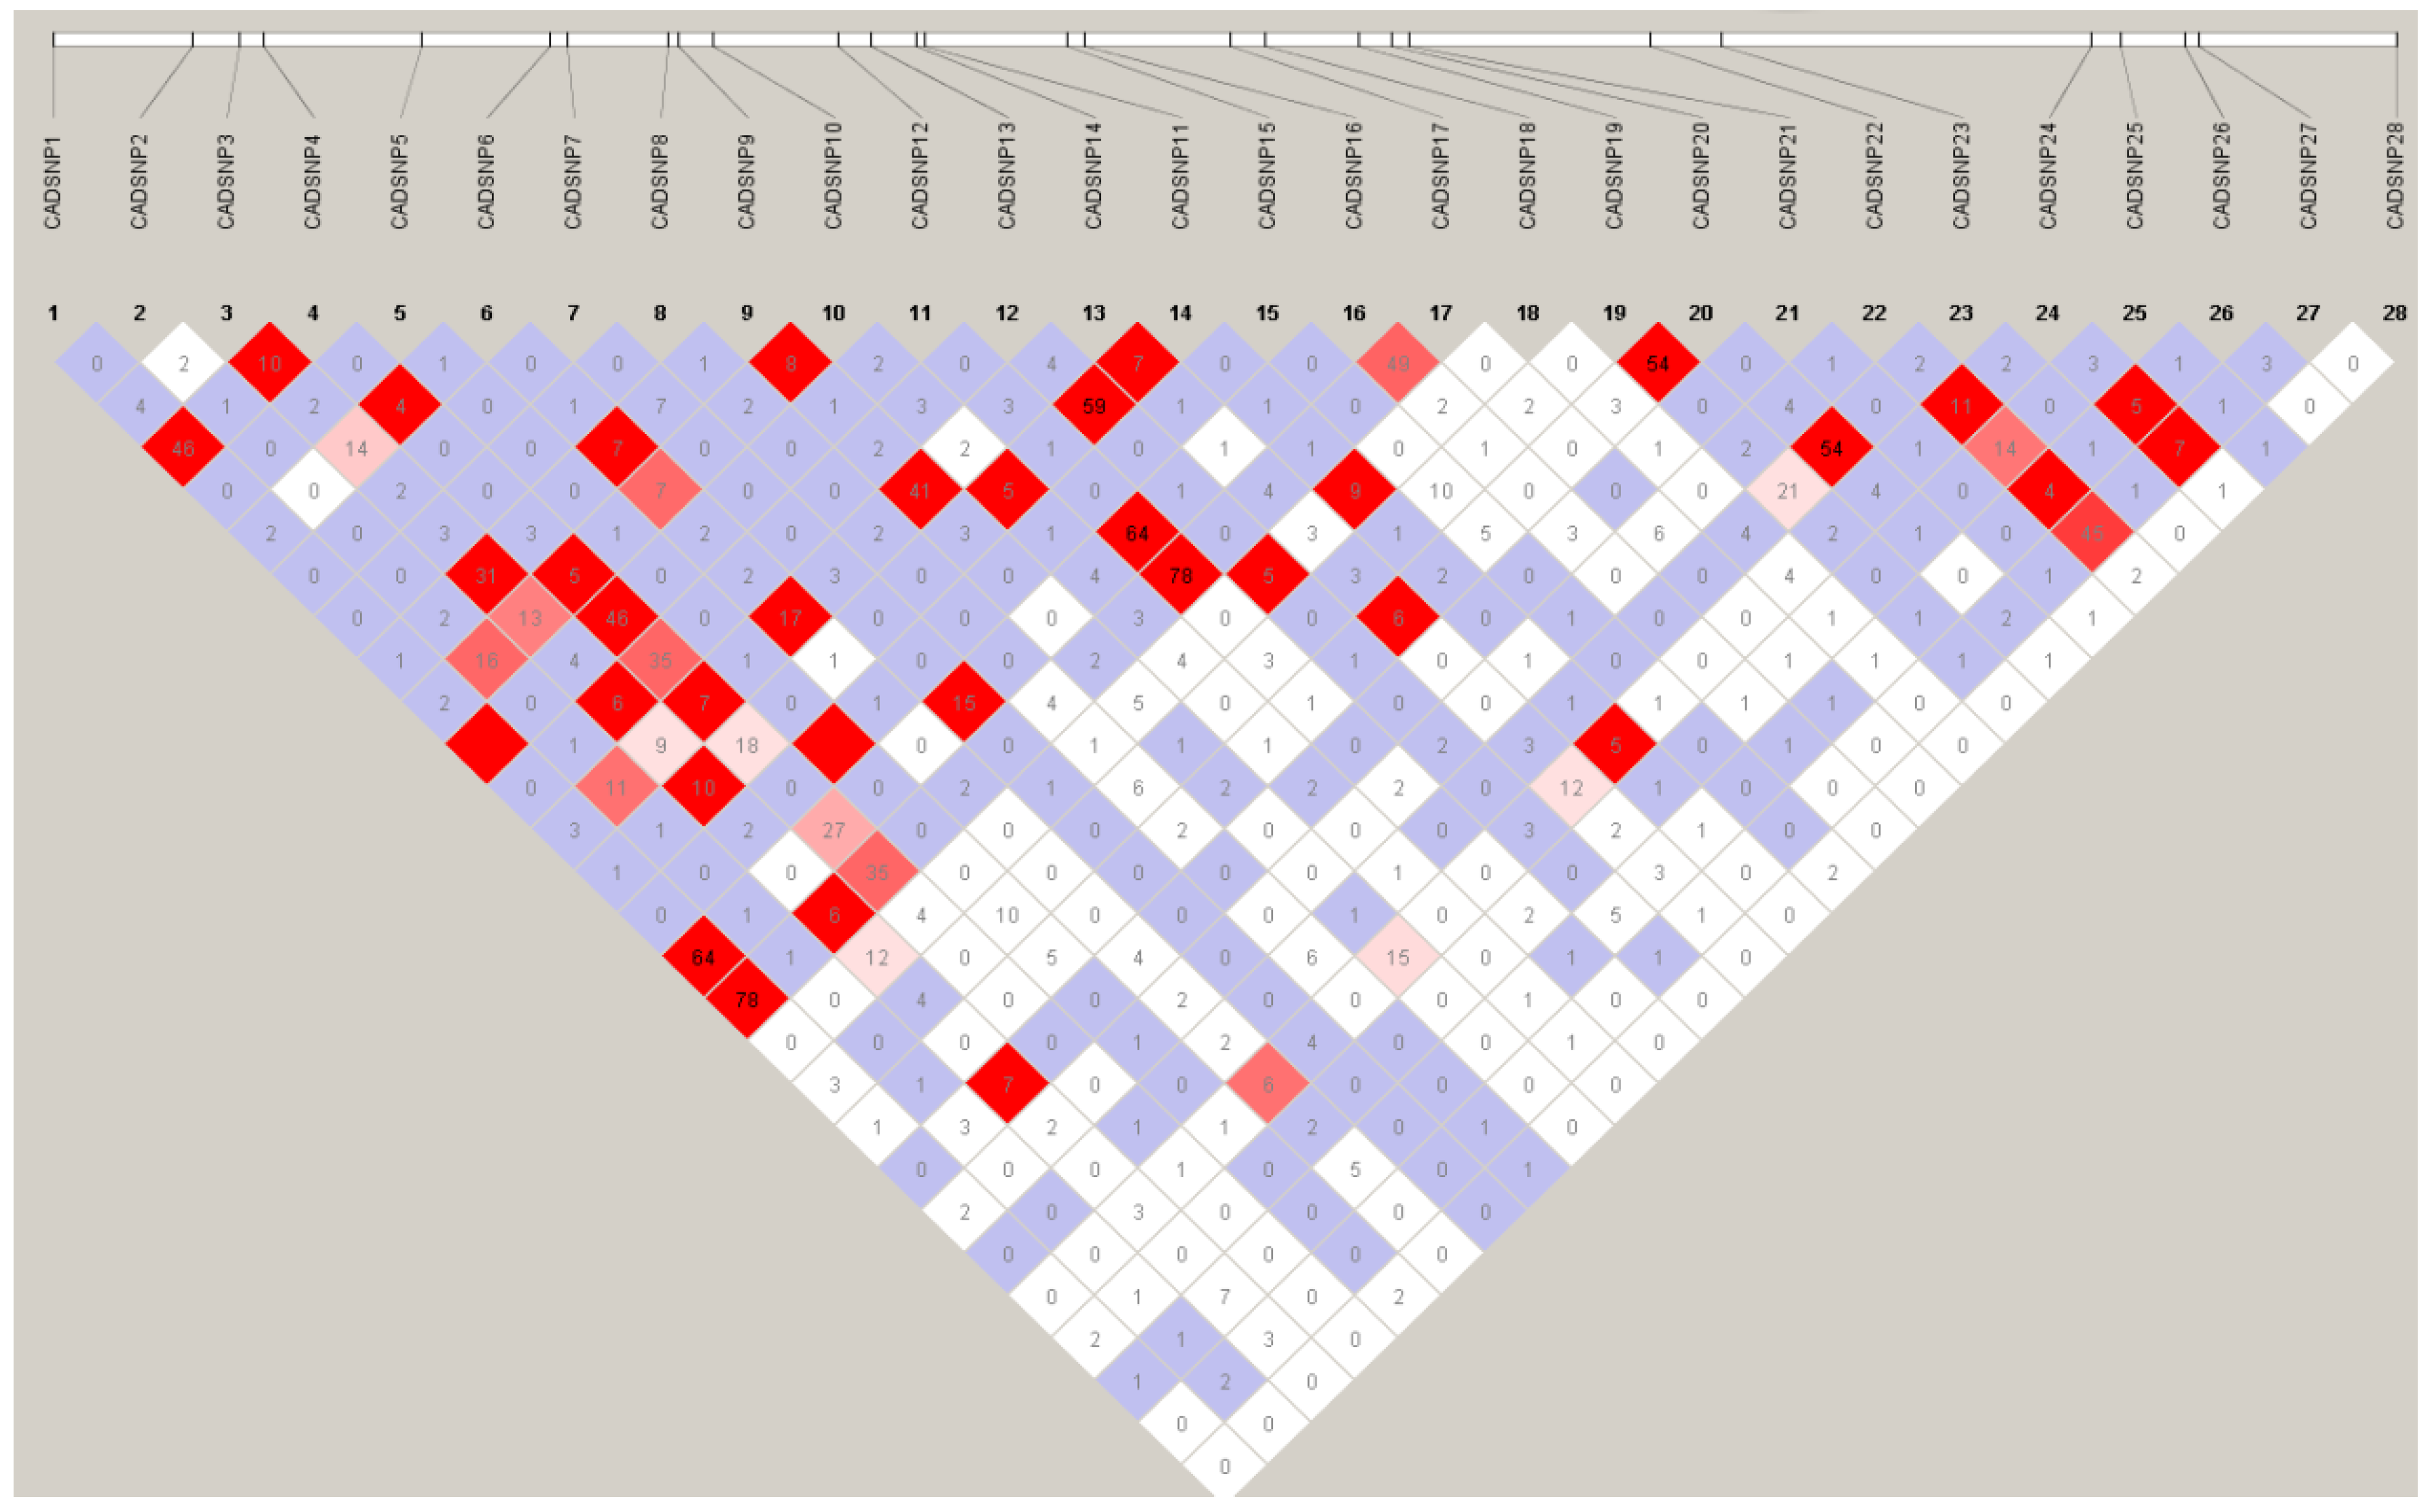
3.3. LD Analysis
3.4. Association Analysis
| Windows | Lignin | Cellulose | Height | DBH | Density | Volume | CB | CCR |
|---|---|---|---|---|---|---|---|---|
| 1(5) | 0.1362 | 0.5297 | 0.0437 * | 0.8234 | 0.1904 | 0.8755 | 0.2961 | 0.4595 |
| 2(5) | 0.1374 | 0.7240 | 0.0480 * | 0.8310 | 0.2954 | 0.8970 | 0.2965 | 0.2854 |
| 3(4) | 0.1219 | 0.4307 | 0.0256 * | 0.9428 | 0.1015 | 0.9627 | 0.0842 | 0.2266 |
| 4(4) | 0.1332 | 0.5183 | 0.0185 * | 0.9457 | 0.1033 | 0.9580 | 0.0573 | 0.1805 |
| 5(4) | 0.0932 | 0.5082 | 0.0481 * | 0.9395 | 0.0360 * | 0.9465 | 0.0541 | 0.4621 |
| 6(4) | 0.1908 | 0.7644 | 0.0121 * | 0.9316 | 0.0611 | 0.8589 | 0.0957 | 0.3051 |
| 7(4) | 0.1077 | 0.6644 | 0.0377 * | 0.8474 | 0.0546 | 0.7996 | 0.1449 | 0.3078 |
| 8(4) | 0.1074 | 0.6561 | 0.0384 * | 0.6958 | 0.1778 | 0.7087 | 0.0268 * | 0.2043 |
| 9(4) | 0.1358 | 0.5000 | 0.1033 | 0.3932 | 0.1642 | 0.6393 | 0.0243 * | 0.3486 |
| 10(4) | 0.1359 | 0.4249 | 0.0266 * | 0.5502 | 0.1112 | 0.7128 | 0.0252 * | 0.2026 |
| 11(4) | 0.1075 | 0.5509 | 0.0210 * | 0.6249 | 0.1101 | 0.7647 | 0.0267 * | 0.2015 |
| 12(4) | 0.0236 * | 0.3801 | 0.0120 * | 0.9362 | 0.1398 | 0.9437 | 0.2360 | 0.3917 |
| 13(4) | 0.0322 * | 0.3151 | 0.0600 | 0.9130 | 0.0981 | 0.9511 | 0.0666 | 0.3859 |
| 14(5) | 0.009 ** | 0.1297 | 0.0508 | 0.8631 | 0.0140 * | 0.8735 | 0.1053 | 0.4675 |
| 15(5) | 0.1062 | 0.5070 | 0.0310 * | 0.8980 | 0.0695 | 0.9631 | 0.0782 | 0.2674 |
| 16(6) | 0.1331 | 0.7762 | 0.0346 * | 0.9634 | 0.2690 | 0.9860 | 0.2884 | 0.2946 |
| 17(7) | 0.1112 | 0.7294 | 0.0285 * | 0.8164 | 0.1287 | 0.7927 | 0.2488 | 0.3193 |
| 18(5) | 0.1447 | 0.6631 | 0.0904 | 0.7772 | 0.1651 | 0.7777 | 0.1084 | 0.6097 |
| 19(4) | 0.1016 | 0.7278 | 0.0862 | 0.9731 | 0.1398 | 0.9749 | 0.1615 | 0.5112 |
| 20(4) | 0.1106 | 0.3637 | 0.0828 | 0.3963 | 0.1726 | 0.5819 | 0.1678 | 0.5536 |
| 21(4) | 0.1160 | 0.3853 | 0.0840 | 0.3870 | 0.2175 | 0.5734 | 0.1414 | 0.2992 |
| 22(4) | 0.1154 | 0.2899 | 0.0721 | 0.3841 | 0.1054 | 0.5740 | 0.0228 * | 0.3710 |
| 23(4) | 0.1112 | 0.4683 | 0.0834 | 0.9241 | 0.1014 | 0.9148 | 0.0111 * | 0.3512 |
| 24(4) | 0.1193 | 0.4125 | 0.0462 * | 0.5816 | 0.1267 | 0.5440 | 0.0169 * | 0.5200 |
| 25(4) | 0.0486 * | 0.2998 | 0.0398 * | 0.5227 | 0.0832 | 0.4852 | 0.0269 * | 0.3868 |
| 26(6) | 0.0494 * | 0.3519 | 0.0788 | 0.3555 | 0.1523 | 0.2635 | 0.0484 * | 0.1284 |
| 27(5) | 0.0144 * | 0.1307 | 0.0673 | 0.4304 | 0.0666 | 0.3238 | 0.0852 | 0.1256 |
| Mutation | Position | Frequency | Lignin | Cellulose | Height | DBH | Density | Volume | CB | CCR |
|---|---|---|---|---|---|---|---|---|---|---|
| g.361C > T | Intron 2 | 0.41(T) | 0.0462 * | 0.5060 | 0.0299 * | 0.7597 | 0.5967 | 0.2466 | 0.0257 * | 0.3391 |
| g.428C > T | Intron 2 | 0.21(T) | 0.0193 * | 0.7256 | 0.0341 * | 0.8435 | 0.0353 * | 0.2583 | 0.2247 | 0.3809 |
| g.480A > G | Intron 2 | 0.18(A) | 0.0484 * | 0.5938 | 0.0350 * | 0.4847 | 0.5695 | 0.1710 | 0.2165 | 0.4751 |
| g.549A > C ns | Exon 3 | 0.21(C) | 0.0142 * | 0.6063 | 0.0349 * | 0.3165 | 0.5172 | 0.1638 | 0.0429 * | 0.2023 |
| g.554C > T s | Exon 3 | 0.11(T) | 0.0112 * | 0.6569 | 0.0077 * | 0.7681 | 0.4352 | 0.3279 | 0.0991 | 0.2857 |
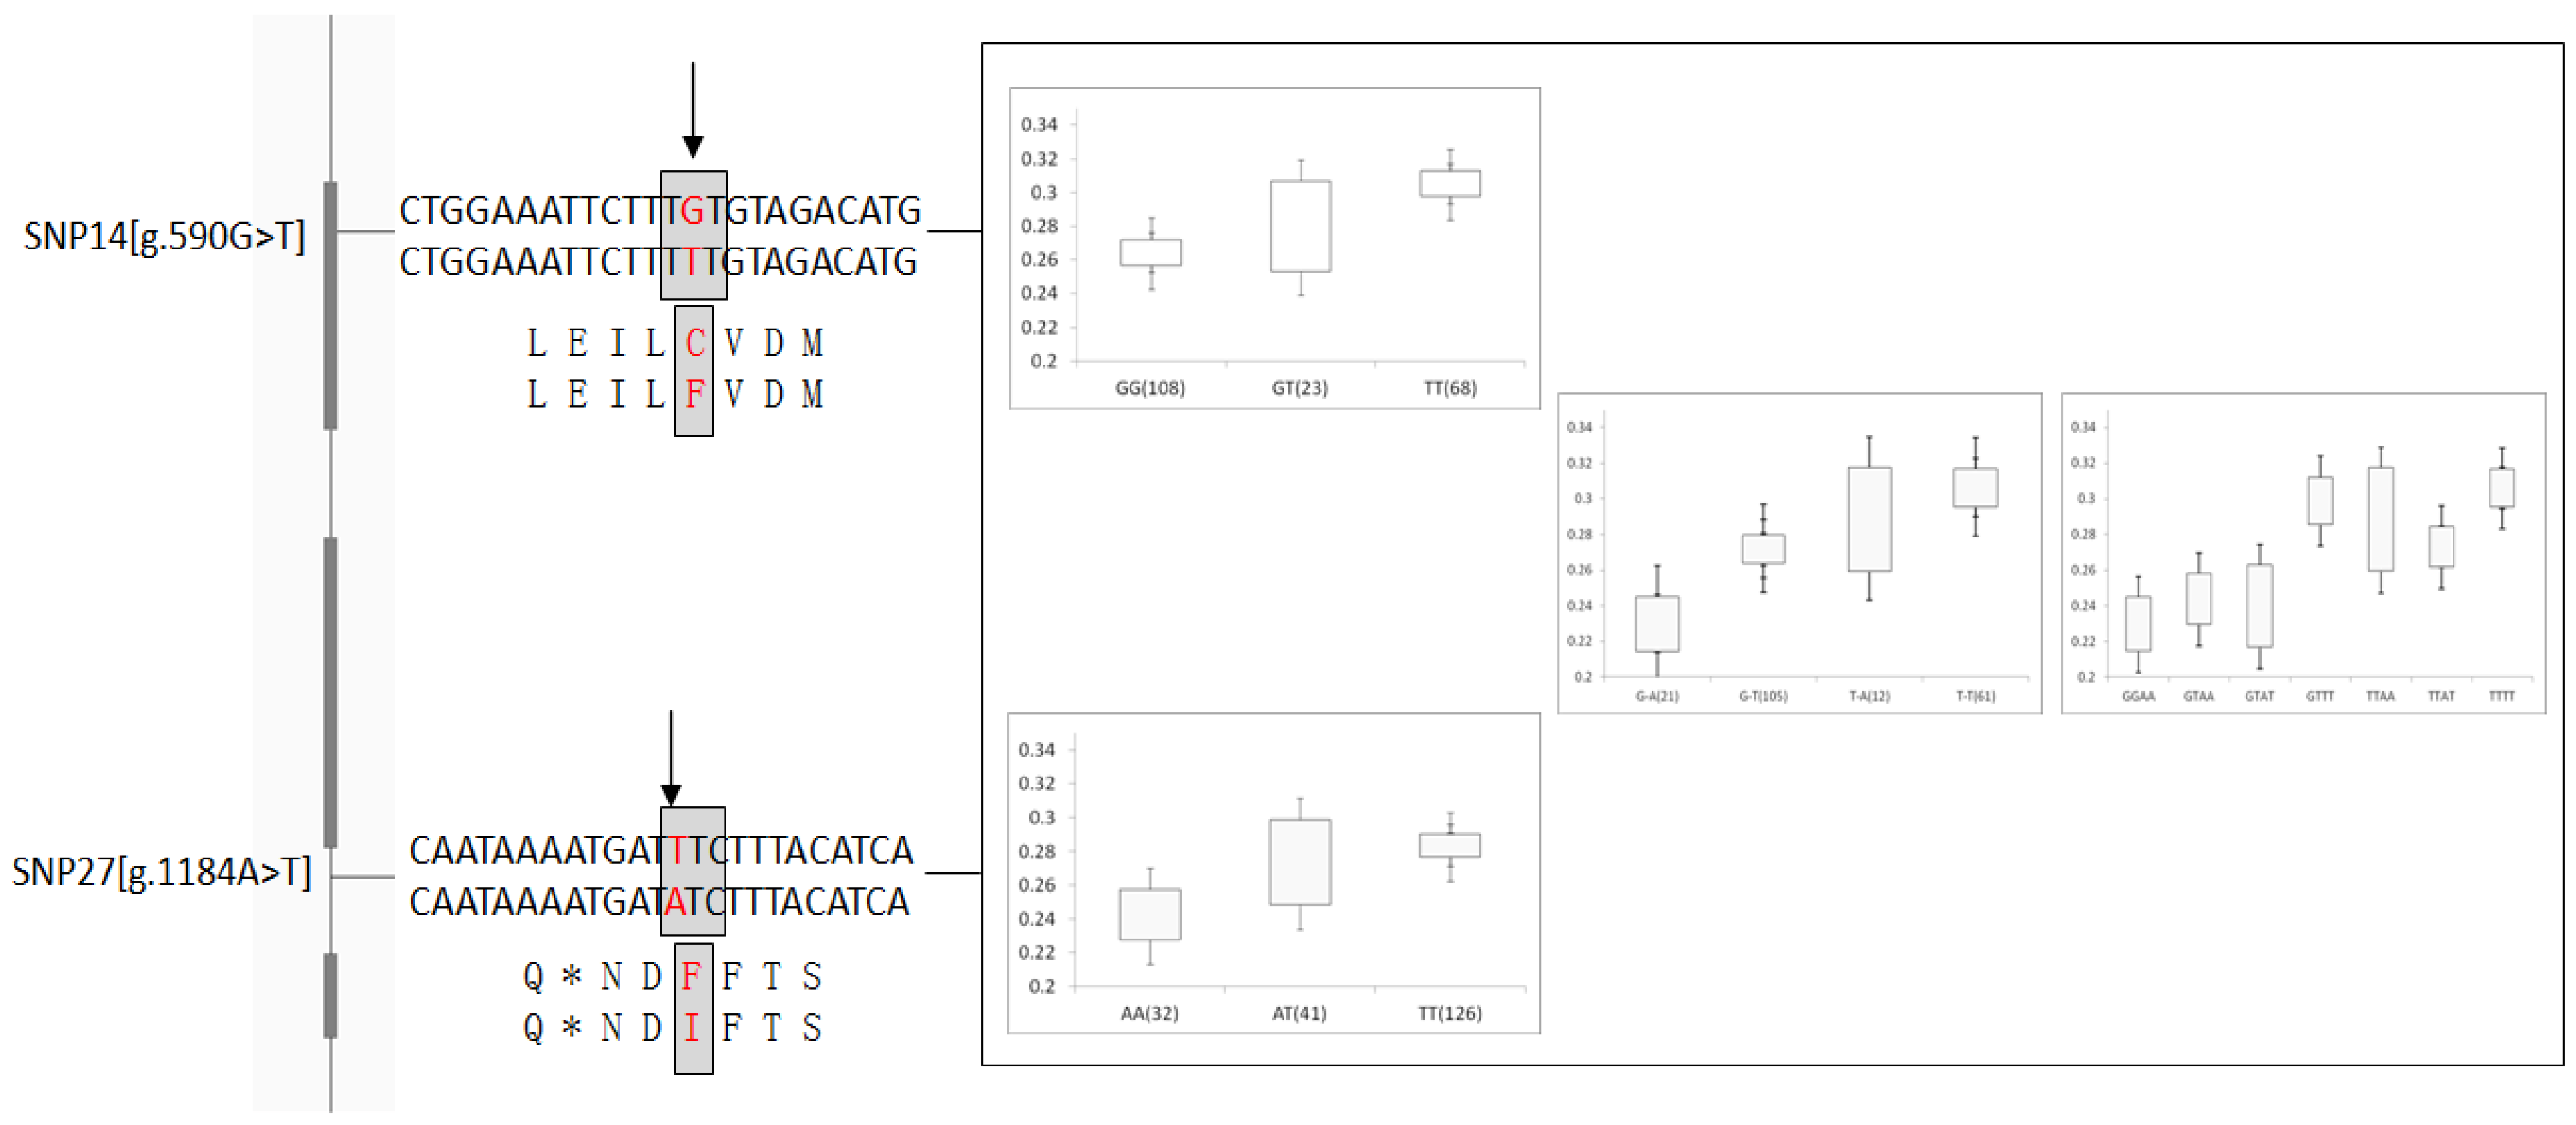
| g.590G > T ns | Exon 3 | 0.34(T) | 0.0043 ** | 0.6359 | 0.0290 * | 0.5402 | 0.5988 | 0.1353 | 0.1669 | 0.3398 |
| g.1148A > G ns | Exon 4 | 0.12(G) | 0.0496 * | 0.7501 | 0.0272 * | 0.6813 | 0.1691 | 0.5196 | 0.0233 * | 0.4252 |
| g.1177A > G | Intron 4 | 0.13(G) | 0.0473 * | 0.7426 | 0.0185 * | 0.6347 | 0.1710 | 0.5186 | 0.1917 | 0.3304 |
| g.1184A > T | Intron 4 | 0.26(A) | 0.0024 ** | 0.2962 | 0.0225 * | 0.5077 | 0.0407 * | 0.3126 | 0.2012 | 0.3576 |
4. Discussion
4.1. Nucleotide Diversity in L. olgensis
4.2. Detection of Phenotype-Genotype Associations in L. olgensis
5. Conclusions
Acknowledgments
Author Contributions
Conflicts of Interest
Supplementary Materials
References
- Zhu, J.; Yang, K.; Yan, Q.; Liu, Z.; Yu, L.; Wang, H. Feasibility of implementing thinning in even-aged Larix olgensis plantations to develop uneven-aged larch–broadleaved mixed forests. J. For. Res. 2010, 15, 71–80. [Google Scholar] [CrossRef]
- Guan, C.; Zhang, H.; Zhang, L.; Li, X.; Deng, J.; Jiang, T. Construction of Genetic Linkage Maps of Larch. Biotechnol. Biotechnol. Equip. 2014, 25, 2197–2202. [Google Scholar] [CrossRef]
- Liu, S. Nitrogen cycling and dynamic analysis of man made larch forest ecosystem. Plant Soil 1995, 168–169, 391–397. [Google Scholar] [CrossRef]
- Pâques, L.E.; García-Casas, M.D.C.; Charpentier, J. Distribution of heartwood extractives in hybrid larches and in their related European and Japanese larch parents: Relationship with wood colour parameters. Eur. J. For. Res. 2013, 132, 61–69. [Google Scholar] [CrossRef]
- Zhao, J.; Wang, B.; Wang, X.; Zhang, Y.; Dong, M.; Zhang, J. iTRAQ-based comparative proteomic analysis of embryogenic and non-embryogenic tissues of Prince Rupprecht’s larch (Larix principis-rupprechtii Mayr). Plant Cell Tissue Organ Cult. 2015, 120, 655–669. [Google Scholar] [CrossRef]
- Sibout, R. CINNAMYL ALCOHOL DEHYDROGENASE-C and -D Are the Primary Genes Involved in Lignin Biosynthesis in the Floral Stem of Arabidopsis. Plant Cell Online 2005, 17, 2059–2076. [Google Scholar] [CrossRef]
- Zapata-Valenzuela, J.; Isik, F.; Maltecca, C.; Wegrzyn, J.; Neale, D.; McKeand, S.; Whetten, R. SNP markers trace familial linkages in a cloned population of Pinus taeda—Prospects for genomic selection. Tree Genet. Genomes 2012, 8, 1307–1318. [Google Scholar] [CrossRef]
- Xu, Y.; Thammannagowda, S.; Thomas, T.P.; Azadi, P.; Schlarbaum, S.E.; Liang, H. LtuCAD1 Is a Cinnamyl Alcohol Dehydrogenase Ortholog Involved in Lignin Biosynthesis in Liriodendron tulipifera L., a Basal Angiosperm Timber Species. Plant Mol. Biol. Rep. 2013, 31, 1089–1099. [Google Scholar] [CrossRef]
- Matsui, N.; Chen, F.; Yasuda, S.; Fukushima, K. Conversion of guaiacyl to syringyl moieties on the cinnamyl alcohol pathway during the biosynthesis of lignin in angiosperms. Planta 2000, 210, 831–835. [Google Scholar] [CrossRef] [PubMed]
- Poke, F.S.; Vaillancourt, R.E.; Elliott, R.C.; Reid, J.B. Sequence variation in two lignin biosynthesis genes, cinnamoyl CoA reductase (CCR) and cinnamyl alcohol dehydrogenase 2 (CAD2). Mol Breed. 2003, 12, 107–118. [Google Scholar] [CrossRef]
- Guillet-Claude, C.; Birolleau-Touchard, C.; Manicacci, D.; Fourmann, M.; Barraud, S.; Carret, V.; Martinant, J.P.; Barri Re, Y. Genetic diversity associated with variation in silage corn digestibility for three O-methyltransferase genes involved in lignin biosynthesis. Theor. Appl. Genet. 2004, 110, 126–135. [Google Scholar] [CrossRef] [PubMed]
- Hancock, J.E.; Bradley, K.L.; Giardina, C.P.; Pregitzer, K.S. The influence of soil type and altered lignin biosynthesis on the growth and above and belowground biomass allocation of Populus tremuloides. Plant Soil 2008, 308, 239–253. [Google Scholar] [CrossRef]
- Gonzalez-Martinez, S.C.; Wheeler, N.C.; Ersoz, E.; Nelson, C.D.; Neale, D.B. Association Genetics in Pinus taeda L. I. Wood Property Traits. Genetics 2007, 175, 399–409. [Google Scholar] [CrossRef] [PubMed]
- Boudet, A. A new view of lignification. Trends Plant Sci. 1998, 3, 67–71. [Google Scholar] [CrossRef]
- Bonawitz, N.D.; Chapple, C. The genetics of lignin biosynthesis: Connecting genotype to phenotype. Annu. Rev. Genet. 2010, 44, 337–363. [Google Scholar] [CrossRef] [PubMed]
- Baucher, M.; Chabbert, B.; Pilate, G.; van Doorsselaere, J.; Tollier, M.T.; Petit-Conil, M.; Cornu, D.; Monties, B.; van Montagu, M.; Inze, D.; et al. Red Xylem and Higher Lignin Extractability by Down-Regulating a Cinnamyl Alcohol Dehydrogenase in Poplar. Plant Physiol. 1996, 112, 1479–1490. [Google Scholar] [PubMed]
- Lapierre, C.; Pollet, B.; MacKay, J.J.; Sederoff, R.R. Lignin structure in a mutant pine deficient in cinnamyl alcohol dehydrogenase. J. Agric. Food Chem. 2000, 48, 2326–2331. [Google Scholar] [CrossRef] [PubMed]
- Pilate, G.; Guiney, E.; Holt, K.; Petit-Conil, M.; Lapierre, C.; Leple, J.C.; Pollet, B.; Mila, I.; Webster, E.A.; Marstorp, H.G.; et al. Field and pulping performances of transgenic trees with altered lignification. Nat. Biotechnol. 2002, 20, 607–612. [Google Scholar] [CrossRef] [PubMed]
- Sibout, R. Expression Pattern of Two Paralogs Encoding Cinnamyl Alcohol Dehydrogenases in Arabidopsis. Isolation and Characterization of the Corresponding Mutants. Plant Physiol. 2003, 132, 848–860. [Google Scholar] [CrossRef] [PubMed]
- Yu, Q.; Li, B.; Nelson, C.D.; McKeand, S.E.; Batista, V.B.; Mullin, T.J. Association of the cad-n1 allele with increased stem growth and wood density in full-sib families of loblolly pine. Tree Genet. Genomes 2006, 2, 98–108. [Google Scholar] [CrossRef]
- Marroni, F.; Pinosio, S.; Zaina, G.; Fogolari, F.; Felice, N.; Cattonaro, F.; Morgante, M. Nucleotide diversity and linkage disequilibrium in Populus nigra cinnamyl alcohol dehydrogenase (CAD4) gene. Tree Genet. Genomes 2011, 7, 1011–1023. [Google Scholar] [CrossRef]
- Rahantamalala, A.; Rech, P.; Martinez, Y.; Chaubet-Gigot, N.; Grima-Pettenati, J.; Pacquit, V. Coordinated transcriptional regulation of two key genes in the lignin branch pathway—CAD and CCR—Is mediated through MYB- binding sites. BMC Plant Biol. 2010, 10, 130. [Google Scholar] [CrossRef] [PubMed]
- Rogers, L.A.; Dubos, C.; Surman, C.; Willment, J.; Cullis, I.F.; Mansfield, S.D.; Campbell, M.M. Comparison of lignin deposition in three ectopic lignification mutants. New Phytol. 2005, 168, 123–140. [Google Scholar] [CrossRef] [PubMed]
- Kirk, T.K.; Obst, J.R. Lignin Determination. In Methods in Enzymology; Willis, A., Wood, S.T.K., Eds.; Academic Press: Waltham, MA, USA, 1988; Volume 161, pp. 87–101. [Google Scholar]
- Porth, I.; Klapste, J.; Skyba, O.; Lai, B.S.; Geraldes, A.; Muchero, W.; Tuskan, G.A.; Douglas, C.J.; El-Kassaby, Y.A.; Mansfield, S.D. Populus trichocarpa cell wall chemistry and ultrastructure trait variation, genetic control and genetic correlations. New Phytol. 2013, 197, 777–790. [Google Scholar] [CrossRef] [PubMed]
- Zhu, H.Y.; Weng, Y.H.; Zhang, H.G.; Meng, F.R.; Major, J.E. Comparing fast- and slow-growing provenances of Picea koraiensis in biomass, carbon parameters and their relationships with growth. For. Ecol. Manag. 2013, 307, 178–185. [Google Scholar] [CrossRef]
- Saghai-Maroof, M.A.; Soliman, K.M.; Jorgensen, R.A.; Allard, R.W. Ribosomal DNA spacer-length polymorphisms in barley: Mendelian inheritance, chromosomal location, and population dynamics. Proc. Natl. Acad. Sci. USA 1984, 81, 8014–8018. [Google Scholar] [CrossRef] [PubMed]
- Araki, N.H.T.; Khatab, I.A.; Hemamali, K.K.G.U.; Inomata, N.; Wang, X.; Szmidt, A.E. Phylogeography of Larix sukaczewii Dyl. and Larix sibirica L. inferred from nucleotide variation of nuclear genes. Tree Genet. Genomes 2008, 4, 611–623. [Google Scholar] [CrossRef]
- Mandrou, E.; Hein, P.R.G.; Villar, E.; Vigneron, P.; Plomion, C.; Gion, J. A candidate gene for lignin composition in Eucalyptus: Cinnamoyl-CoA reductase (CCR). Tree Genet. Genomes 2012, 8, 353–364. [Google Scholar] [CrossRef]
- Kumar, S.; Tamura, K.; Nei, M. MEGA3: Integrated software for Molecular Evolutionary Genetics Analysis and sequence alignment. Brief Bioinform. 2004, 5, 150–163. [Google Scholar] [CrossRef] [PubMed]
- Tajima, F. Statistical method for testing the neutral mutation hypothesis by DNA polymorphism. Genetics 1989, 123, 585–595. [Google Scholar] [PubMed]
- Watterson, G.A. On the number of segregating sites in genetical models without recombination. Theor. Popul. Biol. 1975, 7, 256–276. [Google Scholar] [CrossRef] [PubMed]
- Zhang, H.; Liu, S.H.; Zhang, Q.; Zhang, Y.D.; Wang, S.Z.; Wang, Q.G.; Wang, Y.X.; Tang, Z.Q.; Li, H. Fine-mapping of quantitative trait loci for body weight and bone traits and positional cloning of the RB1 gene in chicken. J. Anim. Breed. Genet. 2011, 128, 366–375. [Google Scholar] [CrossRef] [PubMed]
- Thumma, B.R.; Southerton, S.G.; Bell, J.C.; Owen, J.V.; Henery, M.L.; Moran, G.F. Quantitative trait locus (QTL) analysis of wood quality traits in Eucalyptus nitens. Tree Genet. Genomes 2010, 6, 305–317. [Google Scholar] [CrossRef]
- Zhang, D.; Du, Q.; Xu, B.; Zhang, Z.; Li, B. The actin multigene family in Populus: Organization, expression and phylogenetic analysis. Mol. Genet. Genomics 2010, 284, 105–119. [Google Scholar] [CrossRef] [PubMed]
- Zhang, D.; Xu, B.; Yang, X.; Zhang, Z.; Li, B. The sucrose synthase gene family in Populus: Structure, expression, and evolution. Tree Genet. Genomes 2011, 7, 443–456. [Google Scholar] [CrossRef]
- Selman-Housein, G.; López, M.A.A.; Hernández, D.; Civardi, L.; Miranda, F.; Rigau, J.; Puigdomènech, P. Molecular cloning of cDNAs coding for three sugarcane enzymes involved in lignification. Plant Sci. 1999, 143, 163–171. [Google Scholar] [CrossRef]
- Lynch, D.; Lidgett, A.; McInnes, R.; Huxley, H.; Jones, E.; Mahoney, N.; Spangenberg, G. Isolation and characterisation of three cinnamyl alcohol dehydrogenase homologue cDNAs from perennial ryegrass (Lolium perenne L.). J. Plant Physiol. 2002, 159, 653–660. [Google Scholar] [CrossRef]
- Hawkins, S.; Boudet, A.; Grima-Pettenati, J. Characterisation of caffeic acid O-methyltransferase and cinnamyl alcohol dehydrogenase gene expression patterns by in situ hybridisation in Eucalyptus gunnii Hook. plantlets. Plant Sci. 2003, 164, 165–173. [Google Scholar] [CrossRef]
- Eudes, A.; Pollet, B.; Sibout, R.; Do, C.; Séguin, A.; Lapierre, C.; Jouanin, L. Evidence for a role of AtCAD 1 in lignification of elongating stems of Arabidopsis thaliana. Planta 2006, 225, 23–39. [Google Scholar] [CrossRef] [PubMed]
- Hirano, K.; Aya, K.; Kondo, M.; Okuno, A.; Morinaka, Y.; Matsuoka, M. OsCAD2 is the major CAD gene responsible for monolignol biosynthesis in rice culm. Plant Cell Rep. 2012, 31, 91–101. [Google Scholar] [CrossRef] [PubMed]
- Dillon, S.K.; Nolan, M.; Li, W.; Bell, C.; Wu, H.X.; Southerton, S.G. Allelic Variation in Cell Wall Candidate Genes Affecting Solid Wood Properties in Natural Populations and Land Races of Pinus radiata. Genetics 2010, 185, 1477–1487. [Google Scholar] [CrossRef] [PubMed]
- Gilchrist, E.J.; Haughn, G.W. TILLING without a plough: A new method with applications for reverse genetics. Curr. Opin. Plant Biol. 2005, 8, 211–215. [Google Scholar] [CrossRef] [PubMed]
- Tian, J.; Chang, M.; Du, Q.; Xu, B.; Zhang, D. Single-nucleotide polymorphisms in PtoCesA7 and their association with growth and wood properties in Populus tomentosa. Mol. Genet. Genomics 2014, 289, 439–455. [Google Scholar] [CrossRef] [PubMed]
- Tian, J.; Du, Q.; Chang, M.; Zhang, D. Allelic variation in PtGA20Ox associates with growth and wood properties in Populus spp. PLoS ONE 2012, 7, e53116. [Google Scholar] [CrossRef] [PubMed]
- Zhang, D.; Yang, X.; Zhang, Z.; Li, B. Expression and nucleotide diversity of the poplar COBL gene. Tree Genet. Genomes 2010, 6, 331–344. [Google Scholar] [CrossRef]
- Thumma, B.R. Polymorphisms in Cinnamoyl CoA Reductase (CCR) Are Associated With Variation in Microfibril Angle in Eucalyptus spp. Genetics 2005, 171, 1257–1265. [Google Scholar] [CrossRef] [PubMed]
- Xu, N.; Loflin, P.; Chen, C.Y.; Shyu, A.B. A broader role for AU-rich element-mediated mRNA turnover revealed by a new transcriptional pulse strategy. Nucleic Acids Res. 1998, 26, 558–565. [Google Scholar] [CrossRef] [PubMed]
- Gonzalez-Martinez, S.C.; Huber, D.; Ersoz, E.; Davis, J.M.; Neale, D.B. Association genetics in Pinus taeda L. II. Carbon isotope discrimination. Heredity 2008, 101, 19–26. [Google Scholar] [CrossRef] [PubMed]
- Tian, J.; Du, Q.; Li, B.; Zhang, D. Single-nucleotide polymorphisms in the 5' UTR of UDP-glucose dehydrogenase (PtUGDH) associate with wood properties in Populus tomentosa. Tree Genet. Genomes 2014, 10, 339–354. [Google Scholar] [CrossRef]
- Thumma, B.R.; Matheson, B.A.; Zhang, D.; Meeske, C.; Meder, R.; Downes, G.M.; Southerton, S.G. Identification of a Cis-Acting Regulatory Polymorphism in a Eucalypt COBRA-Like Gene Affecting Cellulose Content. Genetics 2009, 183, 1153–1164. [Google Scholar] [CrossRef] [PubMed]
© 2015 by the authors; licensee MDPI, Basel, Switzerland. This article is an open access article distributed under the terms and conditions of the Creative Commons Attribution license (http://creativecommons.org/licenses/by/4.0/).
Share and Cite
Wang, Y.; Jia, Q.; Zhang, L.; Zhang, Z.; Zhang, H. Allelic Variation in Cinnamyl Alcohol Dehydrogenase (LoCAD) Associated with Wood Properties of Larix olgensis. Forests 2015, 6, 1649-1665. https://doi.org/10.3390/f6051649
Wang Y, Jia Q, Zhang L, Zhang Z, Zhang H. Allelic Variation in Cinnamyl Alcohol Dehydrogenase (LoCAD) Associated with Wood Properties of Larix olgensis. Forests. 2015; 6(5):1649-1665. https://doi.org/10.3390/f6051649
Chicago/Turabian StyleWang, Yanhong, Qinbin Jia, Lei Zhang, Zhen Zhang, and Hanguo Zhang. 2015. "Allelic Variation in Cinnamyl Alcohol Dehydrogenase (LoCAD) Associated with Wood Properties of Larix olgensis" Forests 6, no. 5: 1649-1665. https://doi.org/10.3390/f6051649