Article

Lichen Monitoring Delineates Biodiversity on a Great Barrier Reef Coral Cay

1
Wildland Resources Department & Ecology Center, Utah State University, Logan, UT 84322, USA
2
Geography Planning and Environmental Management (Visiting Fellow), The University of Queensland, Brisbane 4072, Australia
3
Queensland Herbarium, Brisbane Botanic Gardens, Department of Botany (Emeritus), The University of Queensland, Brisbane 4072, Australia
4
Merrill-Cazier Library, Utah State University, Logan, UT 84322, USA
5
Geography Planning and Environmental Management, The University of Queensland, Brisbane 4072, Australia
*
Author to whom correspondence should be addressed.
Forests 2015, 6(5), 1557-1575; https://doi.org/10.3390/f6051557
Submission received: 7 March 2015 / Revised: 28 April 2015 / Accepted: 28 April 2015 / Published: 5 May 2015
(This article belongs to the Special Issue Biodiversity and Conservation in Forests)

Abstract

:
Coral islands around the world are threatened by changing climates. Rising seas, drought, and increased tropical storms are already impacting island ecosystems. We aim to better understand lichen community ecology of coral island forests. We used an epiphytic lichen community survey to gauge Pisonia (Pisonia grandis R.BR.), which dominates forest conditions on Heron Island, Australia. Nine survey plots were sampled for lichen species presence and abundance, all tree diameters and species, GPS location, distance to forest-beach edge, and dominant forest type. Results found only six unique lichens and two lichen associates. A Multi-Response Permutation Procedures (MRPP) test found statistically distinct lichen communities among forest types. The greatest group differences were between interior Pisonia and perimeter forest types. Ordinations were performed to further understand causes for distinctions in lichen communities. Significant explanatory gradients were distance to forest edge, tree density (shading), and Pisonia basal area. Each of these variables was negatively correlated with lichen diversity and abundance, suggesting that interior, successionally advanced, Pisonia forests support fewer lichens. Island edge and presumably younger forests—often those with greater tree diversity and sunlight penetration—supported the highest lichen diversity. Heron Island’s Pisonia-dominated forests support low lichen diversity which mirrors overall biodiversity patterns. Lichen biomonitoring may provide a valuable indicator for assessing island ecosystems for conservation purposes regionally.

Graphical Abstract

1. Introduction

Changing climates are projected to impact low-lying islands as sea levels rise, cyclonic disturbances intensify, and droughts and exotic invasions multiply [1,2,3,4]. Plant communities which occupy such locales will likely register the first effects of rapid climate shifts. These forests are also highly prized for their floral and faunal diversity, ecological links to coral reef health, and economic values related to tourism. For example, there are nearly 1000 islands along the Great Barrier Reef (GBR)—a World Heritage Site comprised of coral reefs and cays—that encompass a high priority conservation region paralleling Australia’s northeastern coast. Designation of protected areas, of course, is only the first step in a series of actions including gaining ecological insight, designing and implementing plans, monitoring, and adjusting actions toward effective resource conservation. In complex systems, such as coral cay forests, key indicators not only help us to understand relations between ecological components, they provide representational metrics for understanding anthropogenic and natural change.
Pisonia (Pisonia grandis R.BR.) forests occur on small islands and coral cays across the Indian and Pacific oceans. Interspecies dynamics of these unique tropical forests are only marginally understood [5,6]. Throughout the GBR, the greatest concentration of Pisonia forests occurs within the southern Capricorn and Bunker island groups [7]. Coral cays within this region, which are Pisonia-dominant, have been shown to develop a successional pattern where beach grasses and forbs give way to Casuarina equisitefolia L. and Argusia argentea L.f., which eventually succeeds to recently established Pisonia, then to “old growth” Pisonia farthest from the forest-beach ecotone at an island’s interior [5,8]. Pisonia appear to be effective colonizers due to their ability to reproduce by vegetative suckering, rooting of both attached and detached branches, and by seed dispersal and germination. Sticky seeds of Pisonia may become affixed to seabirds and thereby be transported to adjacent islands [5,7,8]. To date, the prime influences on Pisonia forests have been tourist development, drought, invasive insects, and cyclonic disturbance [2,3,4].
Epiphytic lichens may be used as indicators of broader forest conditions, such as status, health, pollution and other human impacts, and long-term trends [9]. We are unaware of applications of this bioindicator approach in coral cay ecosytems though it is accepted practice elsewhere [9]. Previous studies have linked lichen communities to forest cover change [10,11], wildlife concerns [12], and landscape-level biological diversity [13,14]. Forest systems with a wider range of tree species (i.e., those with diverse bark chemistries and textures) often support broader lichen floras [11,15,16]. In Australia, epiphytic lichens were shown to be particularly sensitive to forest disturbance among a wide suite of indicators [17]. Australia’s mainland woodland ecosystems have yielded from 50–60 lichen species [16,18], although little is known about lichen diversity in more monotypic, often geographically isolated, forested island environments.
In the present study we aim to further understand the community ecology of epiphytic lichens on islands dominated by Pisonia forests. Specifically, our objectives are to: (1) document forest conditions and epiphytic lichen flora of Heron Island (Figure 1); (2) determine whether lichen communities differ between dominant forest cover types; and (3) examine causal factors for putative differences in epiphytic lichen communities and how these factors may be affected by shifts in forest cover over time. Greater understanding of coral cay lichens generally, and factors contributing to their diversity and abundance specifically, are expected to inform future conservation efforts where more detailed plant and animal inventories will be cost prohibitive. As coral cay forests change, due to anthropogenic or other factors, lichen inventories, as a proxy for system-wide forest conditions (including biodiversity), may provide an “early alert” avenue for efficient, objective, and credible monitoring.
Figure 1. Heron Island study area (inset) in the context of the northeast Australia. Nine lichen monitoring plots (red dots) were selected using a systematic grid overlaid on the Capricornia Cays National Park (eastern) part of the island. The black line surrounding the vegetated portion represents the approximate mean sea level boundary. The Pisonia grandis dominated interior section of the forest appears as a denser, slightly lighter green, cover in contrast to the grey-green fringe Casuarina equisetifolia/Argusia argentea type. Base map of Heron Island from ©Google 2015 (Imagery date: 2 August 2006).
Forests 06 01557 g001

2. Materials and Methods

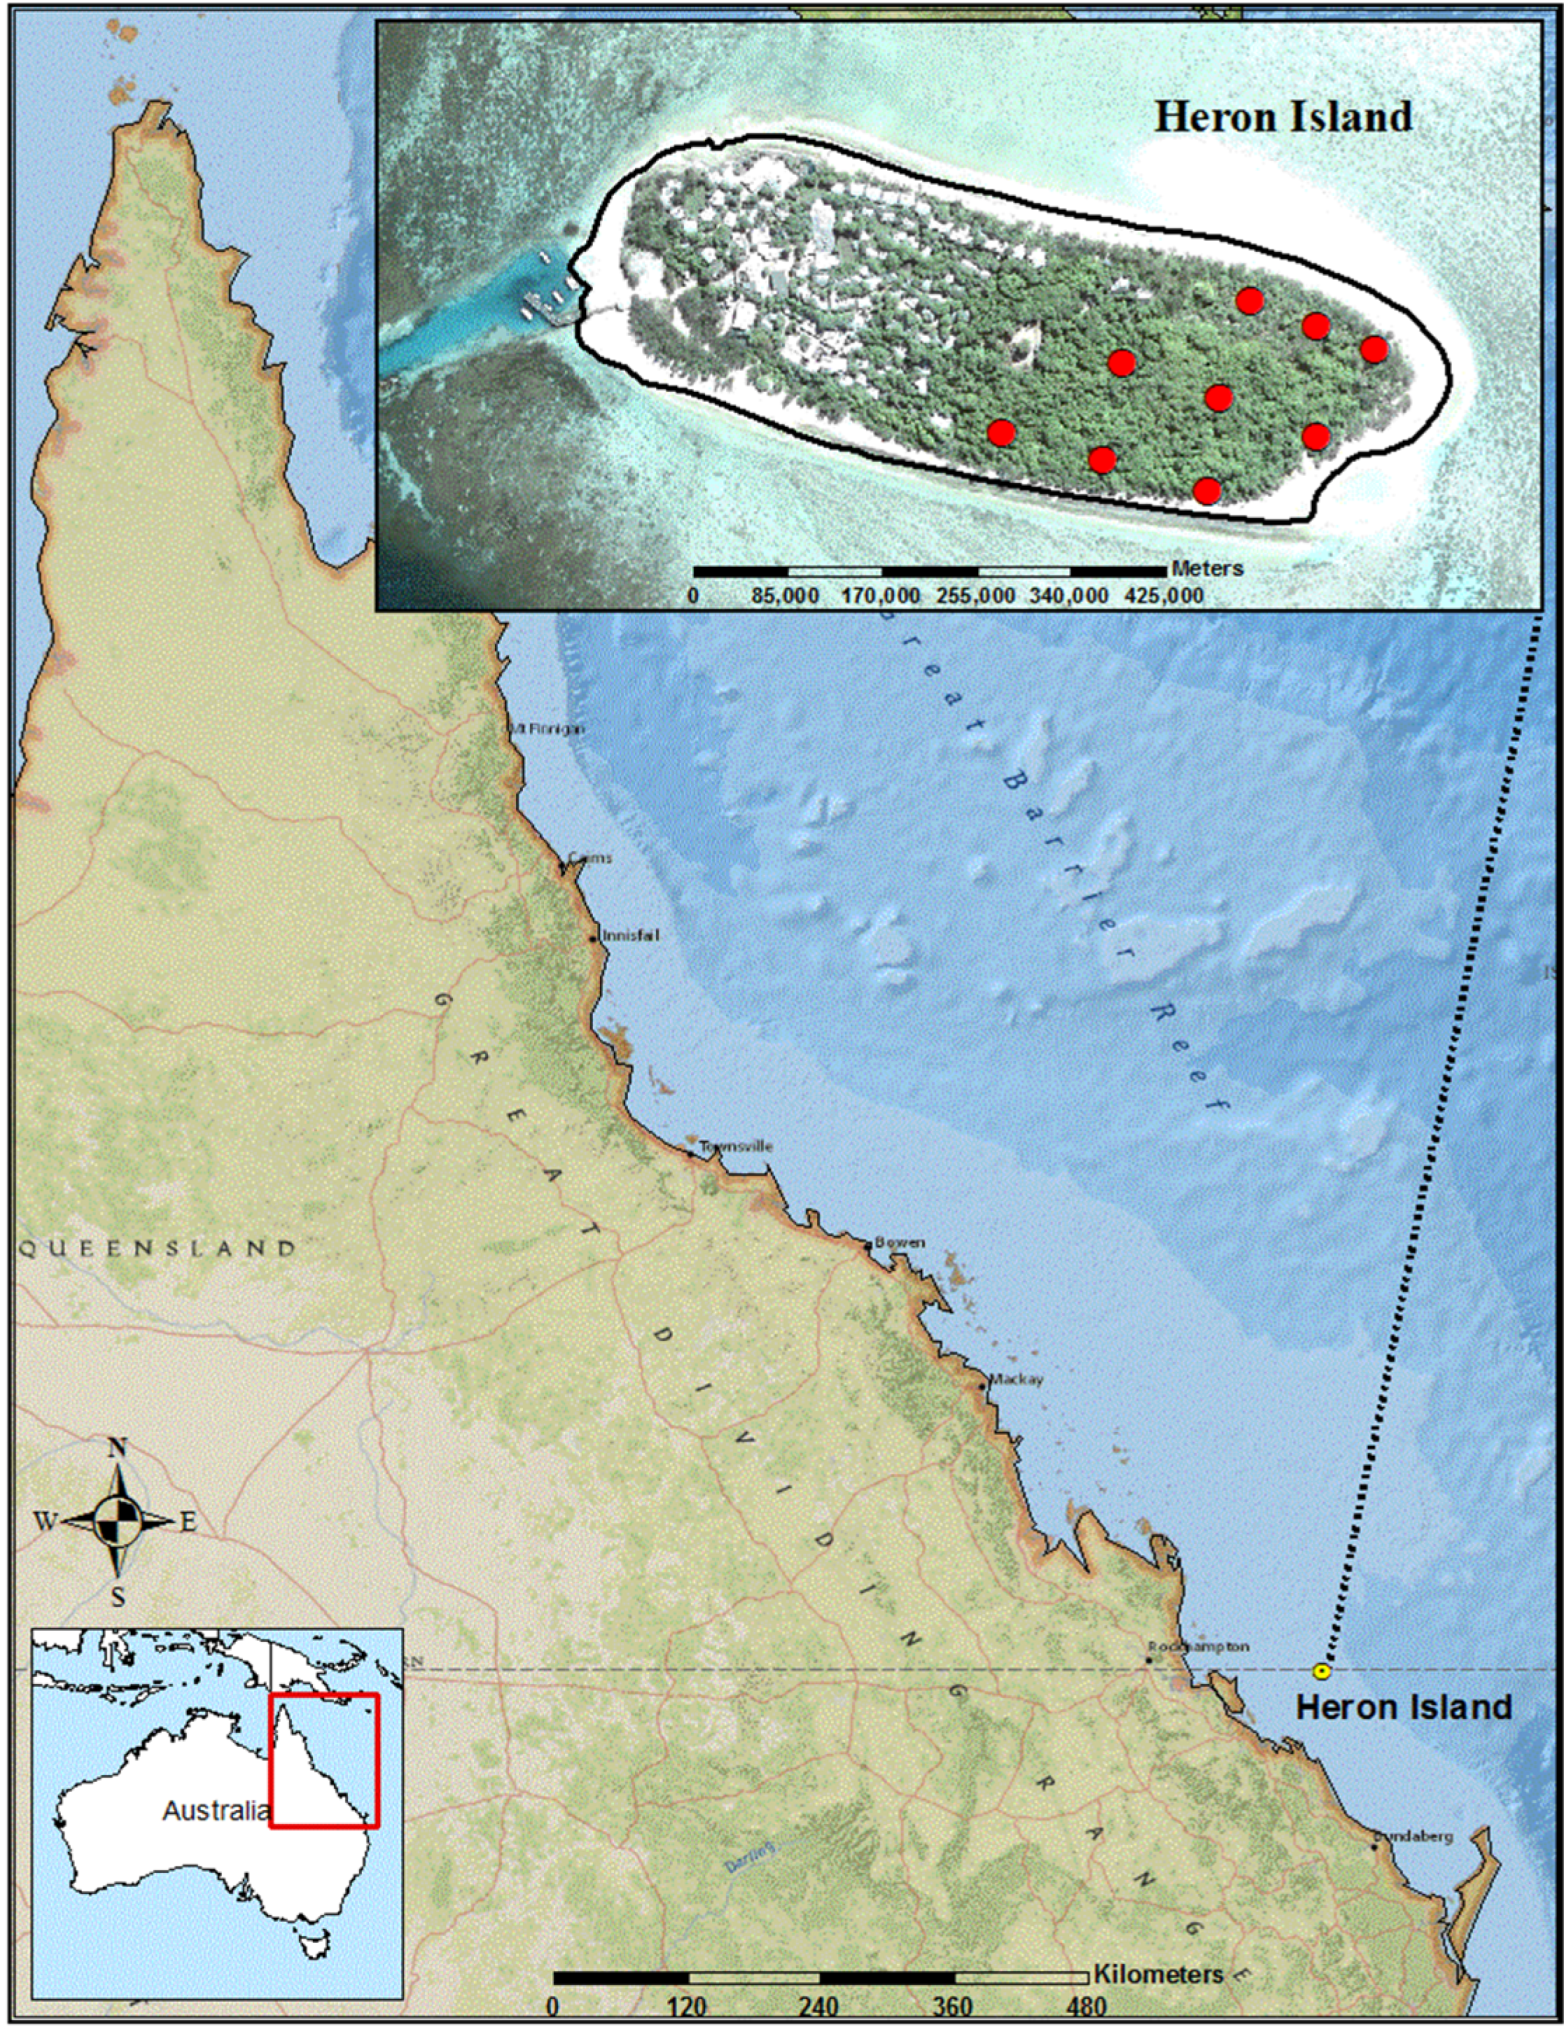
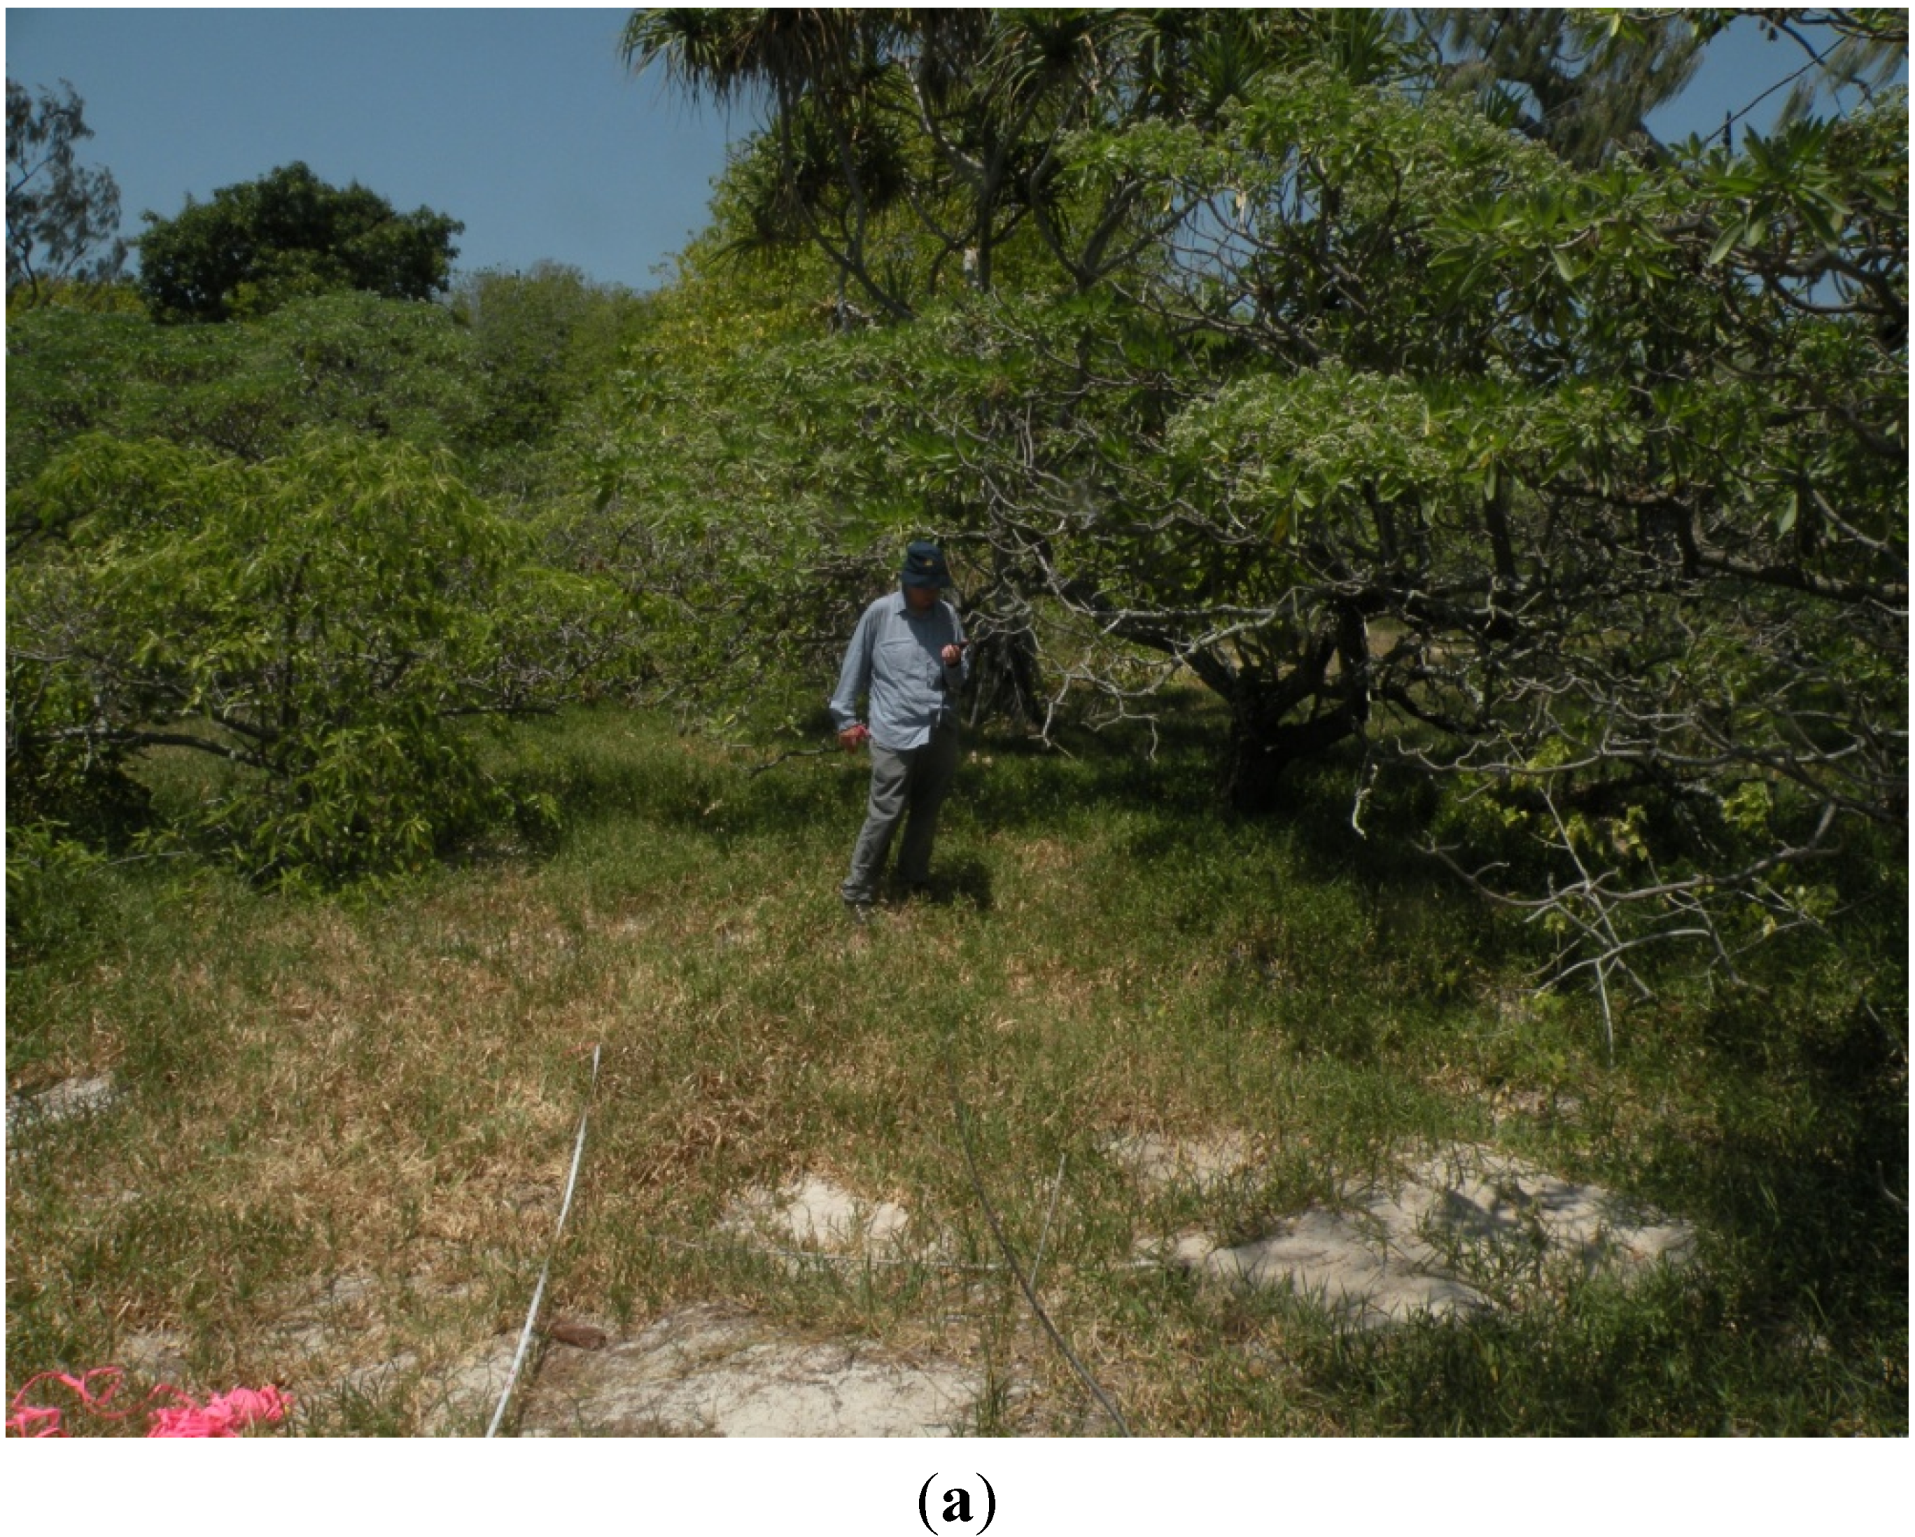
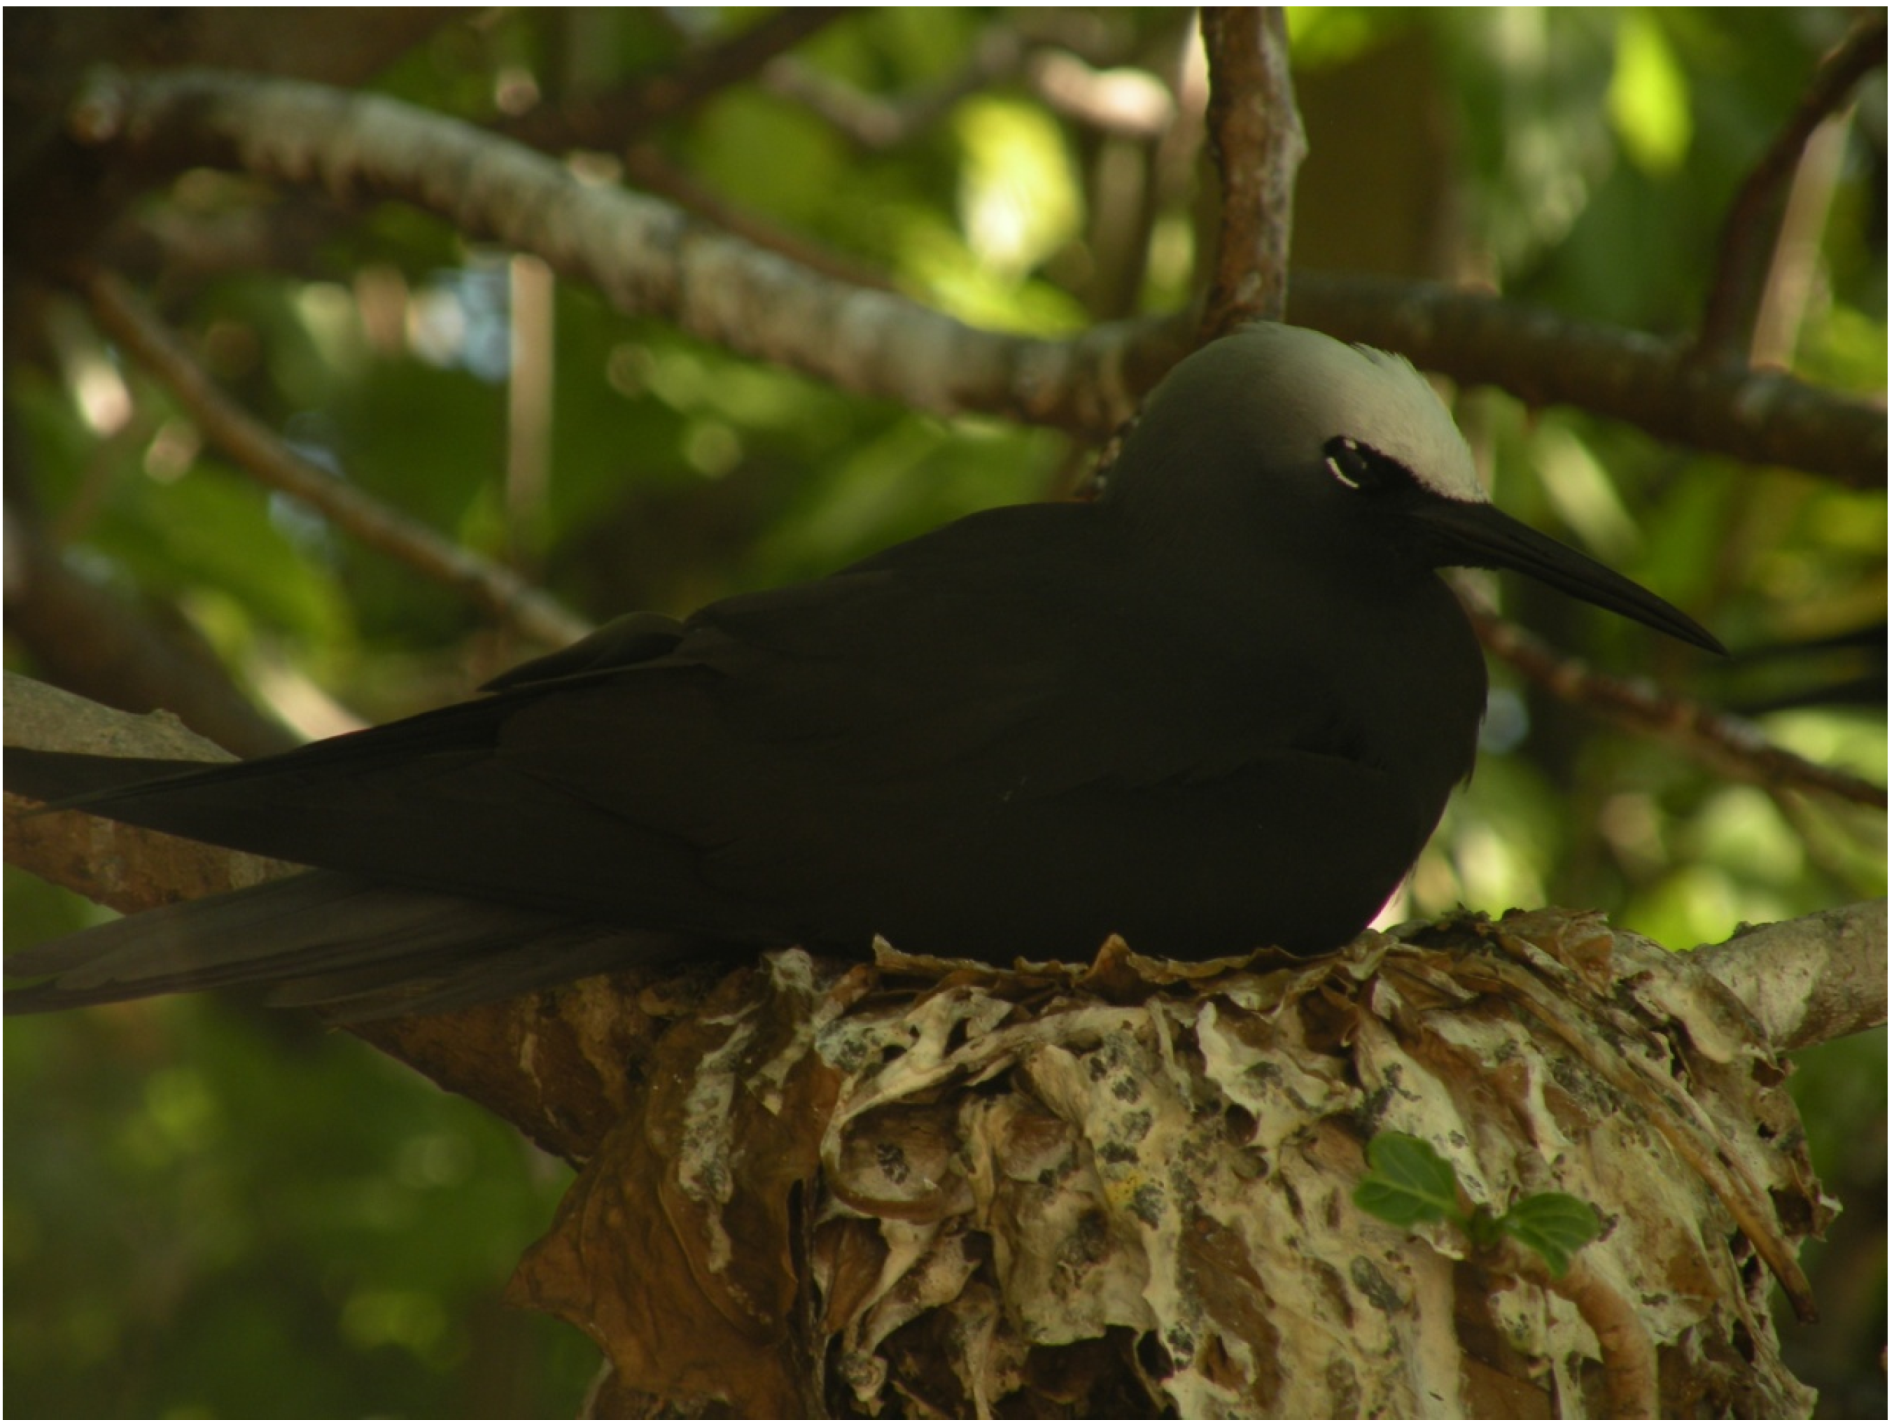
2.1. Study Area and Field Methods

Heron Island is a coral cay located on the Great Barrier Reef approximately 80 km northeast of Gladstone, Australia (UTM zone 56 k: 389,285 E, 7,407,039 N). The island is roughly rectangular in shape with an east-west orientation and a high point of just over 9 m. The total area of the island at high tide is about 23 ha, with the vegetated portion covering 20 ha. Annual precipitation averaged 1028 mm and minimum and maximum temperatures were 20.8 and 26.2 °C, respectively, from 1956–2007 (Australian BOM, Heron Island Research Station). About half of Heron Island was excluded from our study due to presence of research, administrative, and tourist facilities. Thus, 9.4 ha of forest terrain on the Capricornia Cays National Park portion (east half) of the island comprised the study landscape. Field activities were conducted during mid-November 2014. Our method set out to establish at least one lichen and forest mensuration plot per h−1 of undeveloped forest. We projected a 50 × 50 m grid over the study area and sub-selected sample plots from the alternate intersecting points along roughly east-west grid lines (273° magnetic). The northern most grid line intersected the non-forest (beach) zone, so we reselected a new plot (H2) from the original 50 × 50 m gird (i.e., not an alternating intersection point) same grid line to include a similar edge forest type. Thus, while most sample locations were 100 m from one another, those along the first island transect are just 50 m a part (Figure 1). The final sample design consists of nine plots in three forest types: three each in Casuarina equisetifolia/Argusia argentea (CAEQ/ARAR), Pisonia grandis mixed (PIGR-mixed), and Pisonia grandis dominant (PIGR). This sampling scheme is not proportional to forest type coverage (Pisonia = ~75%–80% of the study area); we favored sampling to maximize substrate and lichen diversity, rather than oversampling what appeared to be a low lichen diversity Pisonia community. Thus, by design, we selected plots along pre-established transect lines, which favored equality among differing forest types, but added some bias against oversampling of Pisonia communities. Since our first objective was to conduct a thorough sample of epiphytic lichens on Heron Island we felt justified in making this decision. In terms of sampling area, each plot represents slightly more than 1 ha of the total forested area within the National Park portion of Heron Island.
For the current study all data was recorded in sub-sampling overlying areas, either 20 m radius (lichen communities) or 7 m radius (tree measures), that were assumed to be representative of a ha−1 area centered on grid intersections (plot center). At each plot center we recorded Universal Transverse Mercator (UTM) coordinates using a Geographic Positioning System (GPS) and noted the dominant tree overstorey (forest type). A series of forest measures were taken within a 7 m radius (154 m2) sample plot. We tallied all trees that reached breast height (1.3 m), noted species and status (live/dead), and recorded their diameter at breast height (dbh) to the nearest cm. Trees were classed by diameter as follows: Mature > 12 cm dbh; Submature = 3–11.9 cm; Immature < 3 cm. Where trees grew in irregular forms at dbh we measured the most consistent narrow portion of the tree bole between basal root collar and multiple trunks [7].
A larger lichen survey area (20 m radius) was centered on the tree plot and followed the basic protocols of the United States Forest Service, Forest Health Monitoring (FHM) program [19,20]. This larger lichen sample area is required to pick up the widest diversity of lichens within a reasonable data collection period. Lichen surveys are conducted under a limited time regime to ensure consistency of sampling between plots. Because our plot areas were much smaller than the FHM program we shortened the survey time to a maximum of 60 min. If no species are found for 10 min following the 30 minute mark the survey is terminated. Lichen field personnel attempt to look at all woody substrates above 0.5 m height, but may include recently fallen tree branches to include lichens which may grow only high in the forest canopy. Putative species are placed in separate packets, given an abundance rating, and positively identified in the laboratory. We included lichen associates—lichen-like bodies of consistent form and relative abundance, but underdeveloped properties (i.e., containing fungal and algal elements)—because we felt they strongly indicate potential for establishment of additional lichen flora. For each lichen packet we recorded tree species substrate, as well as any further identifying characteristics. After completion of the lichen survey each species is assigned a qualitative abundance class for the entire survey area: 1 = 1–3 individuals (distinct thalli); 2 = 4–10 individuals; 3 = more than 10 individuals, but less than presence on 50% of all woody substrates; 4 = presence on more than 50% of woody substrates. A previous study indicated that for sparsely populated epiphytic communities, visual lichen abundance classes were preferable to continuous cover measures because accuracy was comparable while efficiency was greatly increased [21]. Voucher specimens were retained by the lead author, though a number of unknown samples were checked and retained at the Queensland Herbarium, Brisbane Botanic Gardens (second author).

2.2. Derived Variables and Analytical Methods
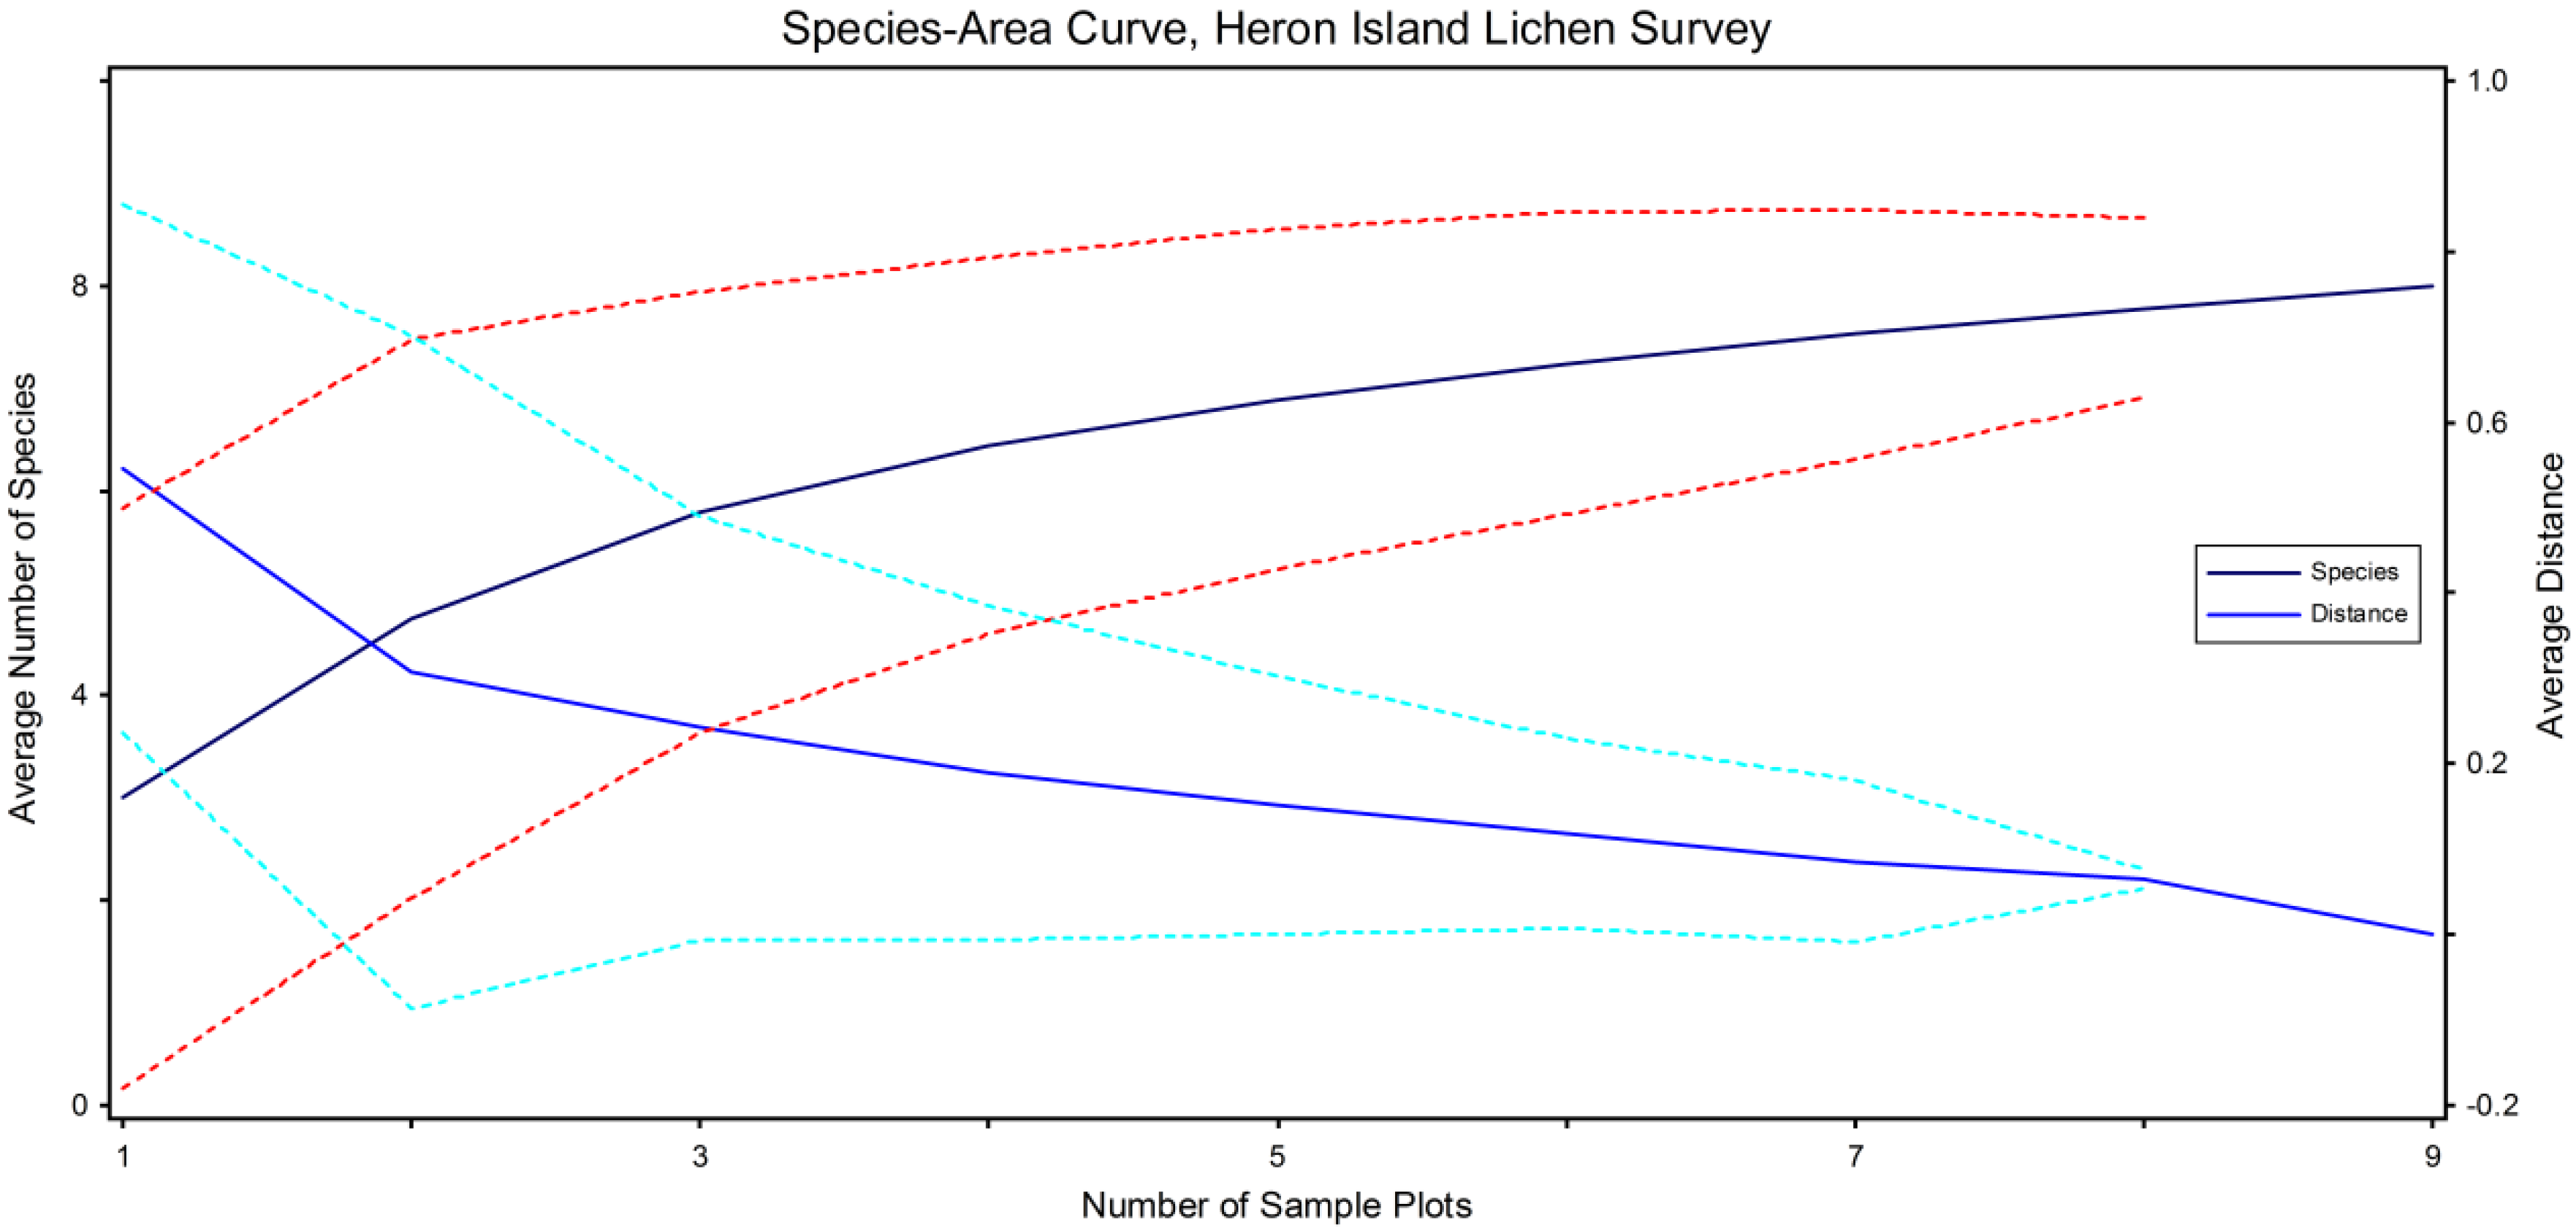
Following data collection all values were checked for accuracy and completeness, then expanded to reflect the 1 ha sample unit. GPS values were verified for accuracy by projecting them onto a map of Heron Island, then the variable “Distance to Forest Edge” was measured to the nearest meter using GIS (ESRI ArcMap®) digital tools. Trees ha−1 were calculated by multiplying the plot tally from the fixed area (154 m2) by a factor of 66.99. The two larger dbh classes were used to calculate basal area (BA) and the immature class was intended to capture reproduction rates. All ha−1 BA values were derived by multiplying the total of all individual tree BAs by same fixed area expansion factor. Live BA and Pisonia BA were calculated separately for each plot to assess their contribution to lichen community diversity. For number of tree species, number of lichens, lichen species abundance, and total lichen abundance we assumed that values obtained on sample plots accurately reflected the larger 1 ha sample unit.
Other than descriptive characterization of the study area forests and lichens (objective 1), our analysis used multivariate statistics to assess potential differences in lichen communities by forest type groups (objective 2) and, if significant differences were found, explored environmental factors contributing to these differences (objective 3). We used PC-ORD® v. 6.0 software [22] for all statistical analyses. Multi-Response Permutation Procedures (MRPP) is a nonparametric test for describing within group agreement of species assemblages. We selected MRPP because of the nature of our small total data matrix and the number of small-occurrence lichen species [23]. The Sørensen distance measure was used because it is less inclined to exaggeration of the outliers inherent in our data set. MRPP produces an A-value which is the chance-corrected within group agreement (effect size), as well as a p-value establishing level of test significance [24]. For exploratory analyses of explanatory factors we used nonmetric multidimensional scaling (NMS) [25] to ordinate a primary matrix of lichen species by sample locations (plots). A secondary matrix of environmental variables by plots was evaluated in relation to the main species ordination. The lowest stress solution was derived from 250 runs with real plot data. “Stress” is a quantitative assessment final NMS solution monotonicity, a measure of how well real data fit the ordination [23,24]. The lowest stress solution was subjected to a Monte Carlo test of an additional 250 randomized iterations to evaluate the probability of the final NMS solution being greater than chance occurrence. Orthogonal rotation of the final ordination was used to maximize correlation between the strongest environmental variables (i.e., Pearson r values) and the major ordination axes. The lowest number of dimensions (axes) was selected when adding another dimension would have decreased the final stress by <5 [24]. For all tests we used a 95% confidence level (p ≤ 0.05) to determine significance.

3. Results

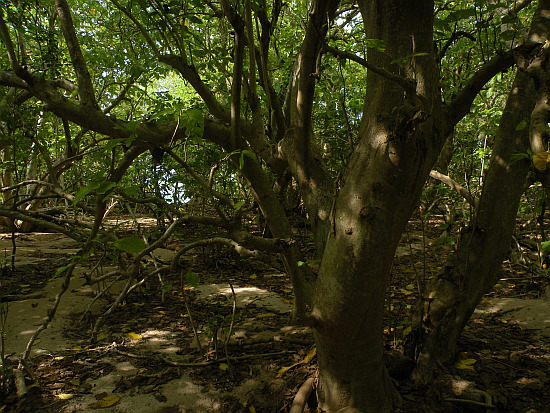
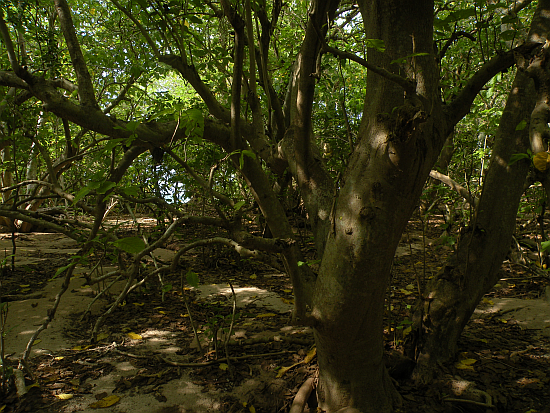
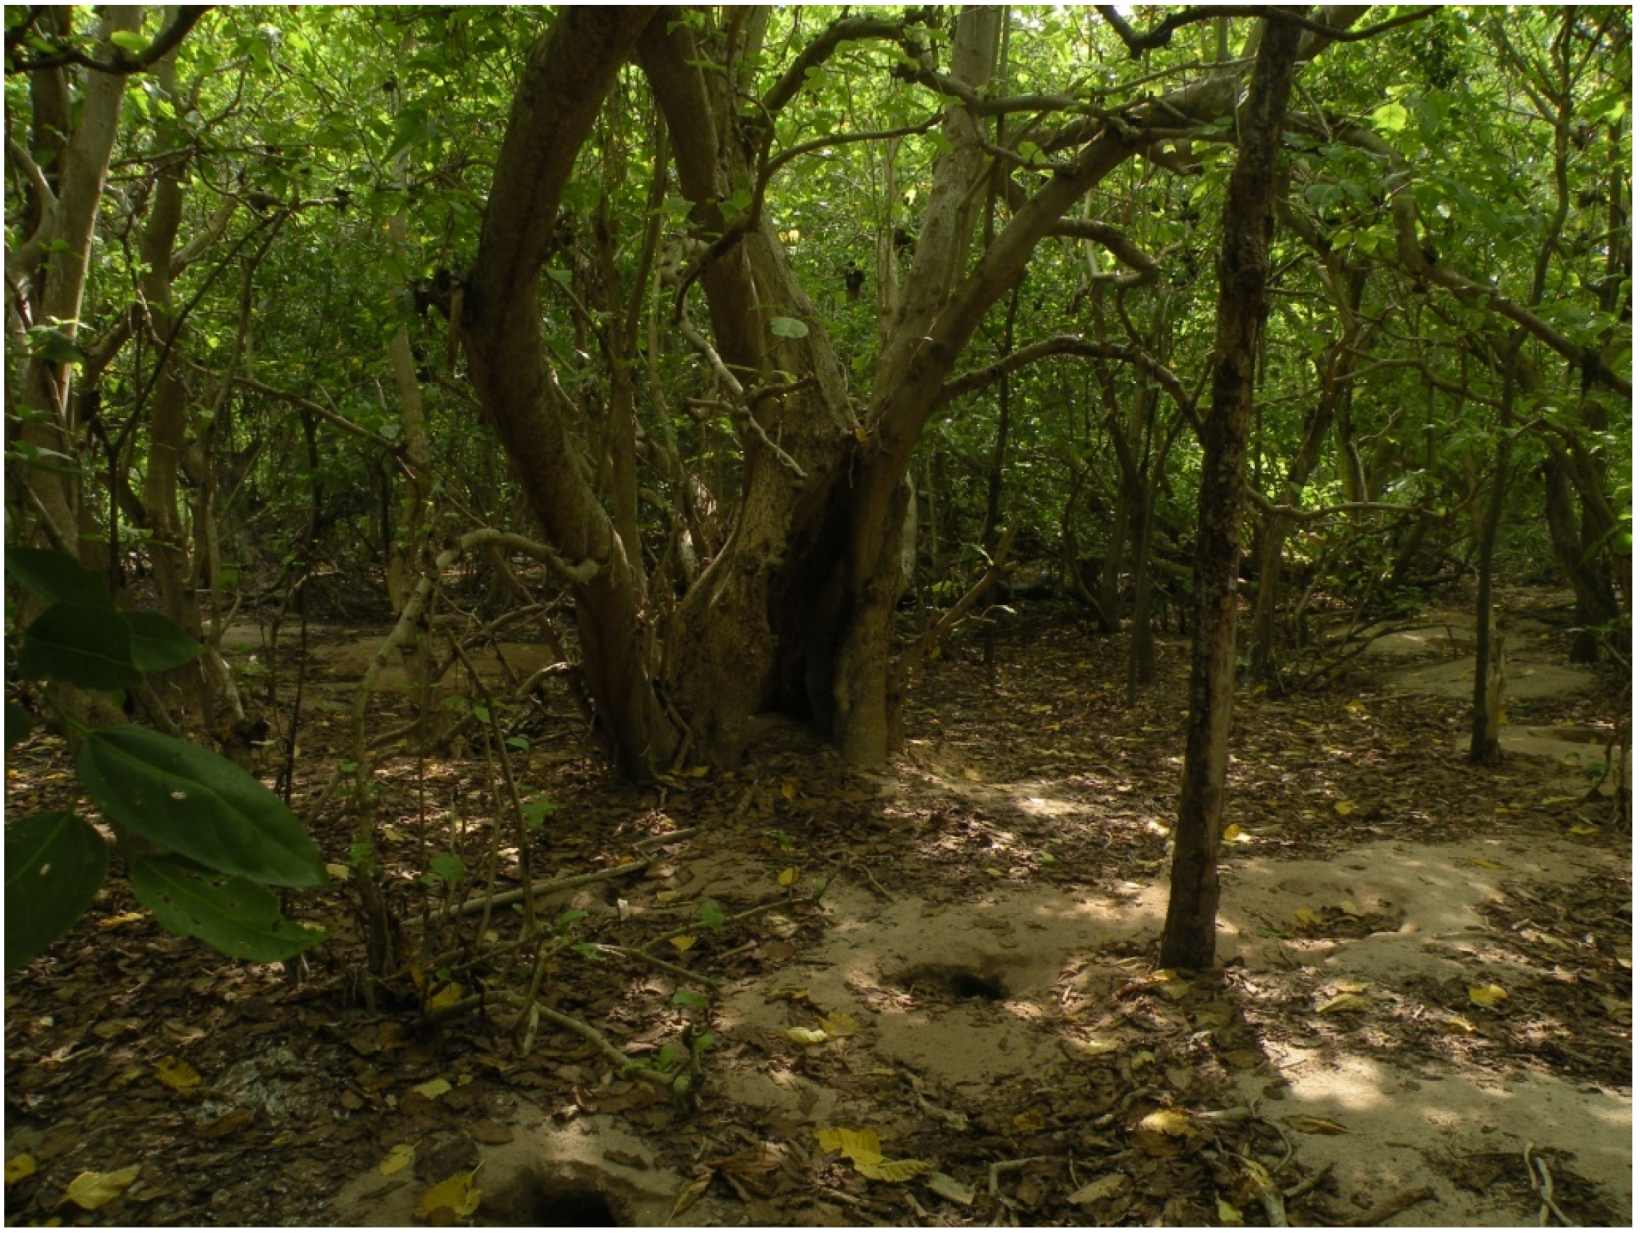
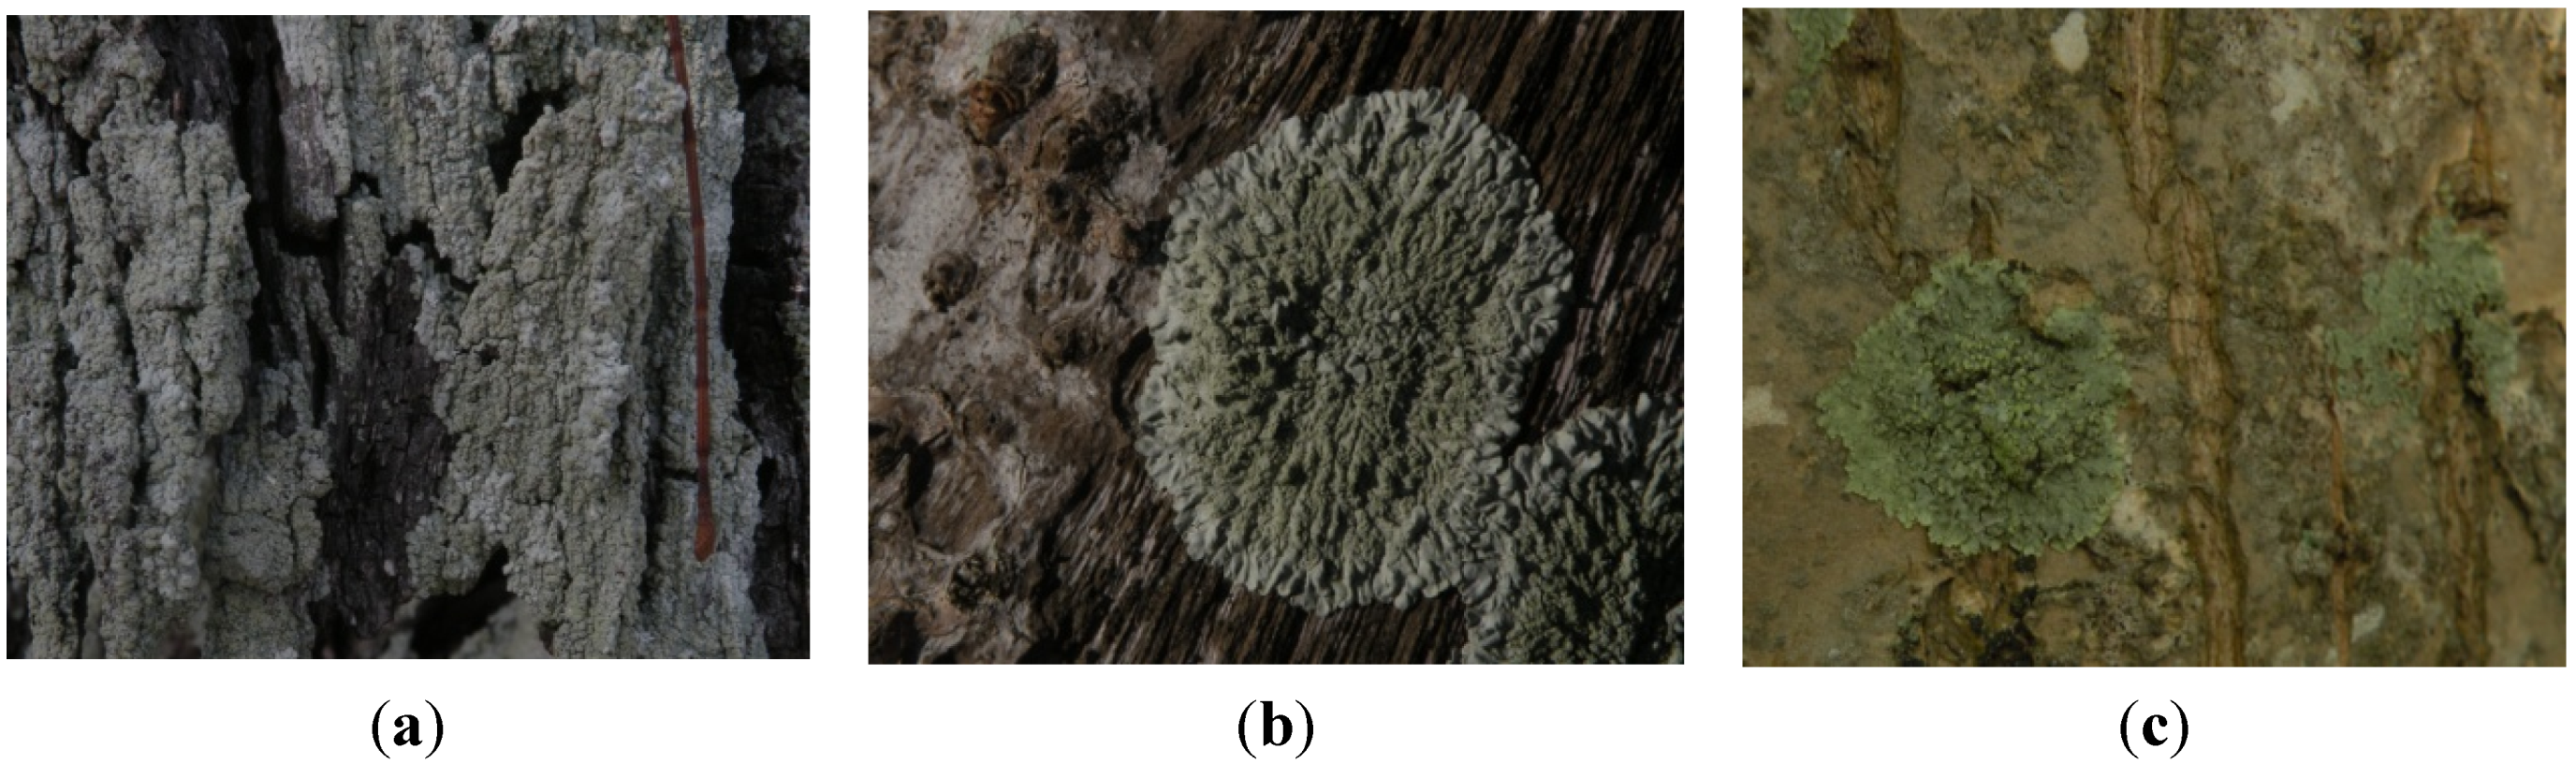
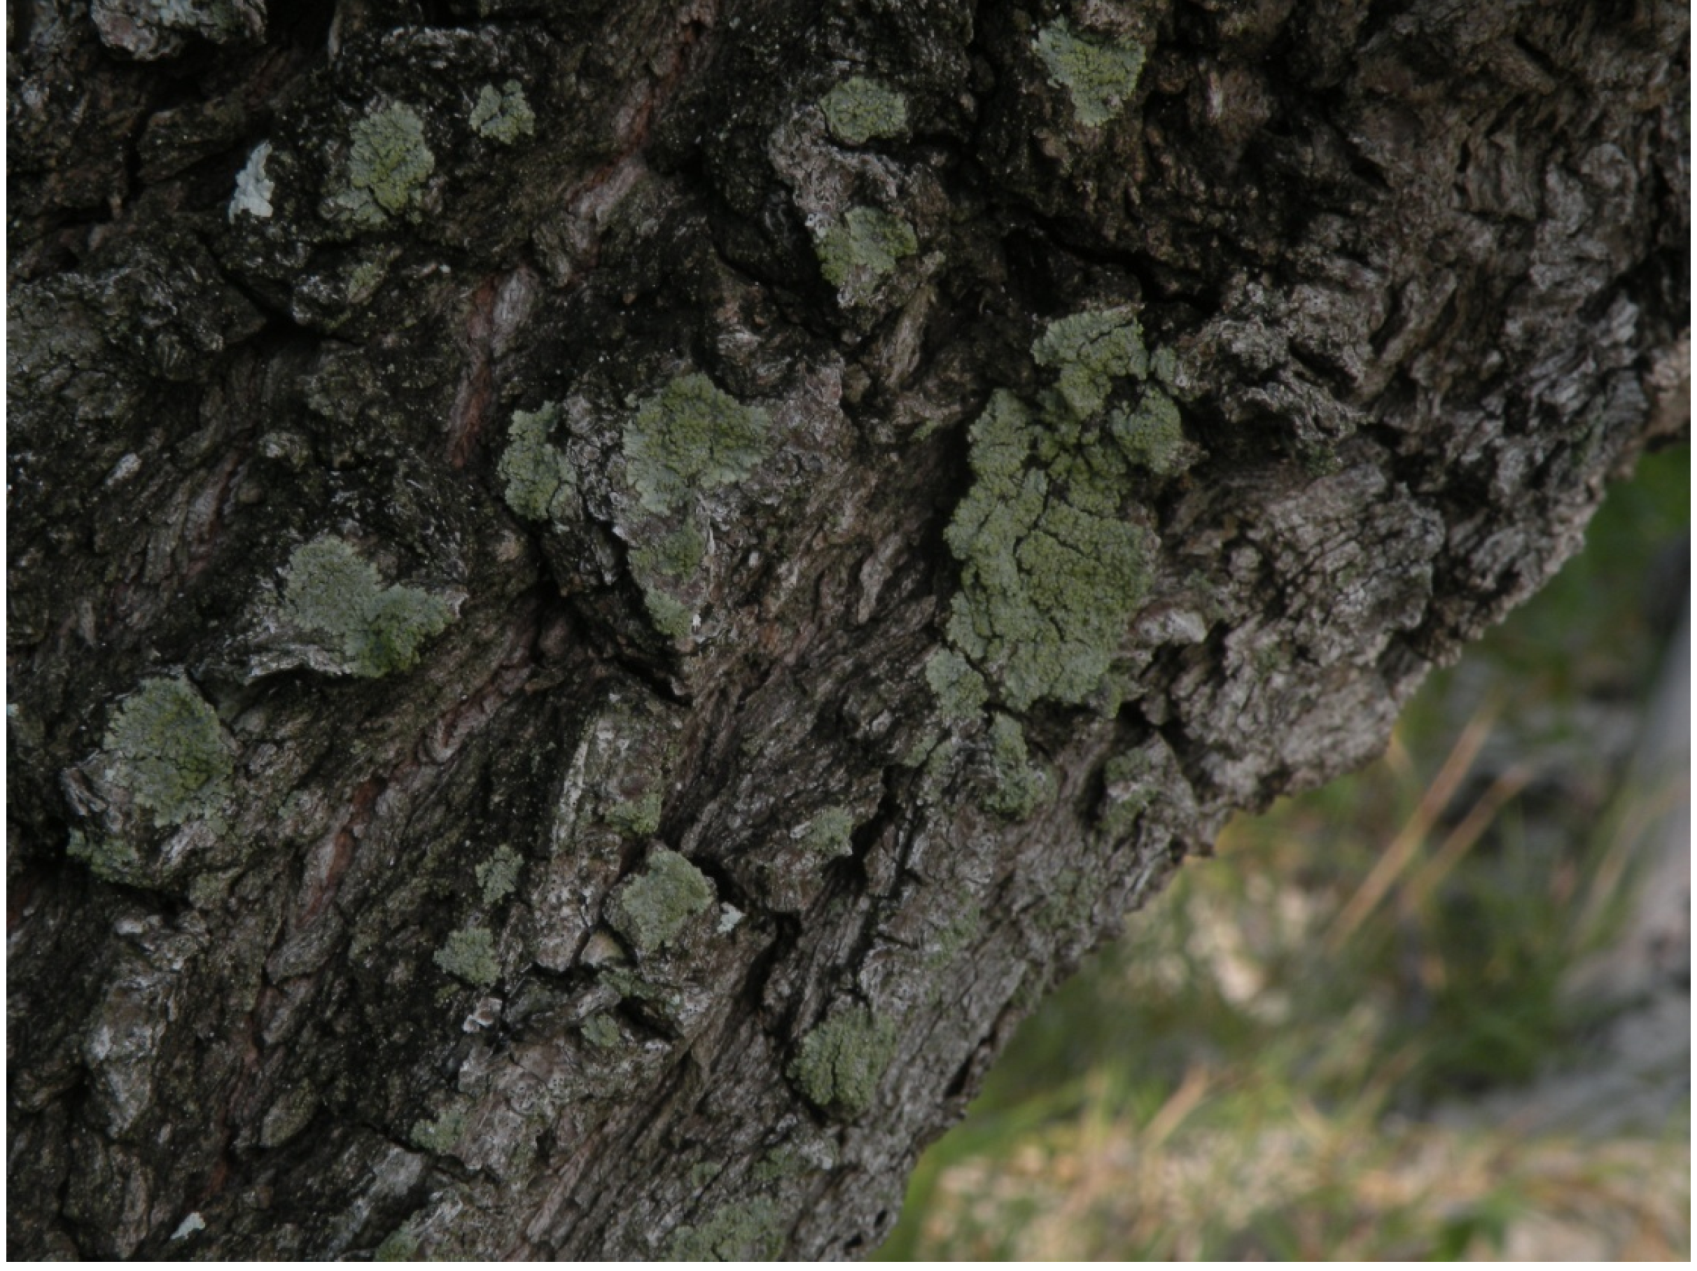
3.1. Forest Conditions and Lichen Species of Heron Island

Nine forest-lichen sample plots on Heron Island yielded an array of community conditions in a relatively small area. Table 1 presents basic location and forest statistics by three principal forest types. UTM locations simply represent east-west and north-south physical locations of sample plots. Plot distance to forest edge ranged from 8–108 m; those forests farthest from the beach/forest ecotone tended to be nearly pure, often dense, and likely older Pisonia stands. The average number of trees ha−1 was 1228, with the greatest number of trees being found on Pisonia and Pisonia mixed plots. Total BA measures were again mostly elevated in Pisonia stands as compared to plots located in forests of non-Pisonia species. Overall, there are very few standing dead trees on Heron Island as shown in the small difference between total and live BA (Table 1). As expected, we find a higher volume of Pisonia BA in the Pisonia forest type versus mixed and other types. Two locations (H1, H3) tallied no Pisonia, resulting in overall low BA. The plot the farthest from the forest edge (H15) did not match dominant study patterns: a high number of small trees, largely Pisonia, resulted in a relatively low BA. Pisonia stands contained fewer trees species and lower lichen diversity and abundance (Table 1). We tallied only 12 immature tree stems in the entire study; eight Pisonia and the remaining four divided among Ficus opposita Miq. (2), Cordia subcordata Lam. (1), and Celtis paniculata Endl. (1).
Table 1. Forest statistics by sample location (plot) for Heron Island, Australia. Forest Types are comprised of the principal overstorey tree species: CAEQ/ARAR = Casuarina equisetifolia/Argusia argentea; PIGR mixed = 50%–95% Pisonia grandis with lesser coverage of CAEQ, ARAR, Pandanus heronensis (PAHE), and Pipturus argenteus (PIAR); PIGR ≥ 95% PIGR. BA = basal area.
Plot IDForest TypeUTM EastingUTM NorthingDistance to Forest Edge (m)Trees ha−1Total BA (m2/ha−1)Live BA (m2/ha−1)Pisonia BA (m2/ha−1)Tree Species CountLichen Species CountTotal Lichen Abundance
H1CAEQ/ARAR389,4587,407,11718.807809.549.540.004414
H2CAEQ/ARAR389,4057,407,1478.0032541.1740.6629.394412
H3CAEQ/ARAR389,3687,407,1538.6939032.0731.060.003414
H11PIGR mixed389,4677,406,98314.7097546.7246.7232.523310
H13PIGR389,3877,407,02383.831755144.87144.74144.87114
H15PIGR mixed389,2857,407,039103.10195028.9227.4915.90426
H21PIGR mixed389,3427,406,94614.361820116.84116.48109.293512
H23PIGR389,2617,406,96325.43188597.1997.1996.80237
H25PIGR389,1337,407,03331.75117075.9174.4474.26314
Our survey recorded six identifiable lichens and two lichen “associates” (see Materials and Methods). We included lichen associates—lichen-like bodies of consistent form and relative abundance, but underdeveloped properties—because we felt they strongly indicate potential for establishment of additional lichen flora (both contained fungal and algal elements). Lichen species, as well as their presence, abundance, and prominent substrates are shown in Table 2. The few species tallied parallels a limited diversity in woody substrates on the island. The species list here comprises mostly common northeastern Australian species, with the exception of one incidence of Strangospora ochrophora (Nyl.) R.A. Anderson (new to tropical Australia). Lichen forms are exclusively foliose and crustose in the study area, a feature common in environments of limited resources [26]. No individual lichen species was found at every sample location and two species were found only on a single plot. The most common lichen, though not most abundant, was Hyperphyscia adglutinata (Flörke) H. Mayrhofer and Poelt. Landscape abundance scores reflect low lichen community presence overall (maximum possible per species = 36). A total of eight tree species were tallied in our survey, though only five of these supported lichens (Table 2). No lichens were recorded on Ficus opposita, Cordia subcordata, or Celtis paniculata, primarily interior forest tree species.
Table 2. Epiphytic lichens and associates recorded by form, frequency, landscape abundance, and substrate tree species. Associates are lichen-like thalli of consistent form and relative abundance on trees in the study area that were unidentifiable due to poor development. Tree species are listed by code: Argusia argentea (ARAR), Casuarina equisetifolia (CAEQ), Pandanus heronensis (PAHE), Pipturus argenteus (PIAR), Pisonia grandis (PIGR). Landscape abundance is the sum of abundance scores, by species, across all sample plots.
SpeciesSpecies CodeFormFrequency of Presence (% Plots)Landscape AbundanceSubstrate Tree Species
LICHENS
Dirinaria pictaDIPIfoliose3311CAEQ
Pyxine cocoesPYCOfoliose5619ARAR, CAEQ, PAHE, PIGR
Hyperphyscia adglutinataHYADfoliose6617ARAR, CAEQ, PAHE, PIAR, PIGR
Coenogonium queenslandicumCOQUcrustose223ARAG, PIGR
Lecanora arthothelinellaLEARcrustose112ARAR
Strangospora ochrophoraSTOCcrustose112PIGR
ASSOCIATES
CyanobacteriumCYANOcrustose5613ARAR, CAEQ, PIGR
Sterile thalliTHALLIcrustose4416PIGR

3.2. Lichen Community Differences among Forest Types

MRPP results found significant homogeneity within groups for the overall data set (A = 0.411, p = 0.015), as well as among individual group pairs (Table 3). CAEQ/ARAR vs. PIGR displayed the most within group agreement for lichen communities (A = 0.490, p = 0.024), while the two mixed forest types showed somewhat less similarity though results were highly significant (A = 0.190, p = 0.025). The lower negative T statistic (−1.364) and insignificant result (p = 0.09) for PIGR mixed vs. PIGR indicates the weakest between group distinction in lichen tally. Overall, A values (i.e., effect size) for this study are somewhat high suggesting a strong group difference, though some caution is warranted given the small sample size [24].
Table 3. Multi-Response Permutation Procedures (MRPP) test results for differences in lichen communities between forest types. “T” is the MRPP test statistic which calculates the difference between observed and expected delta. “A” is the chance-corrected within-group agreement [24] (pp. 188–193).
Forest Type PairsTAp
CAEQ/ARAR vs. PIGR mixed−2.4570.1900.025
CAEQ/ARAR vs. PIGR−2.6040.4900.024
PIGR mixed vs. PIGR−1.3640.2350.097
All types (grand test)−2.7040.4110.015

3.3. Environmental Factors Affecting Coral Cay Lichen Communities
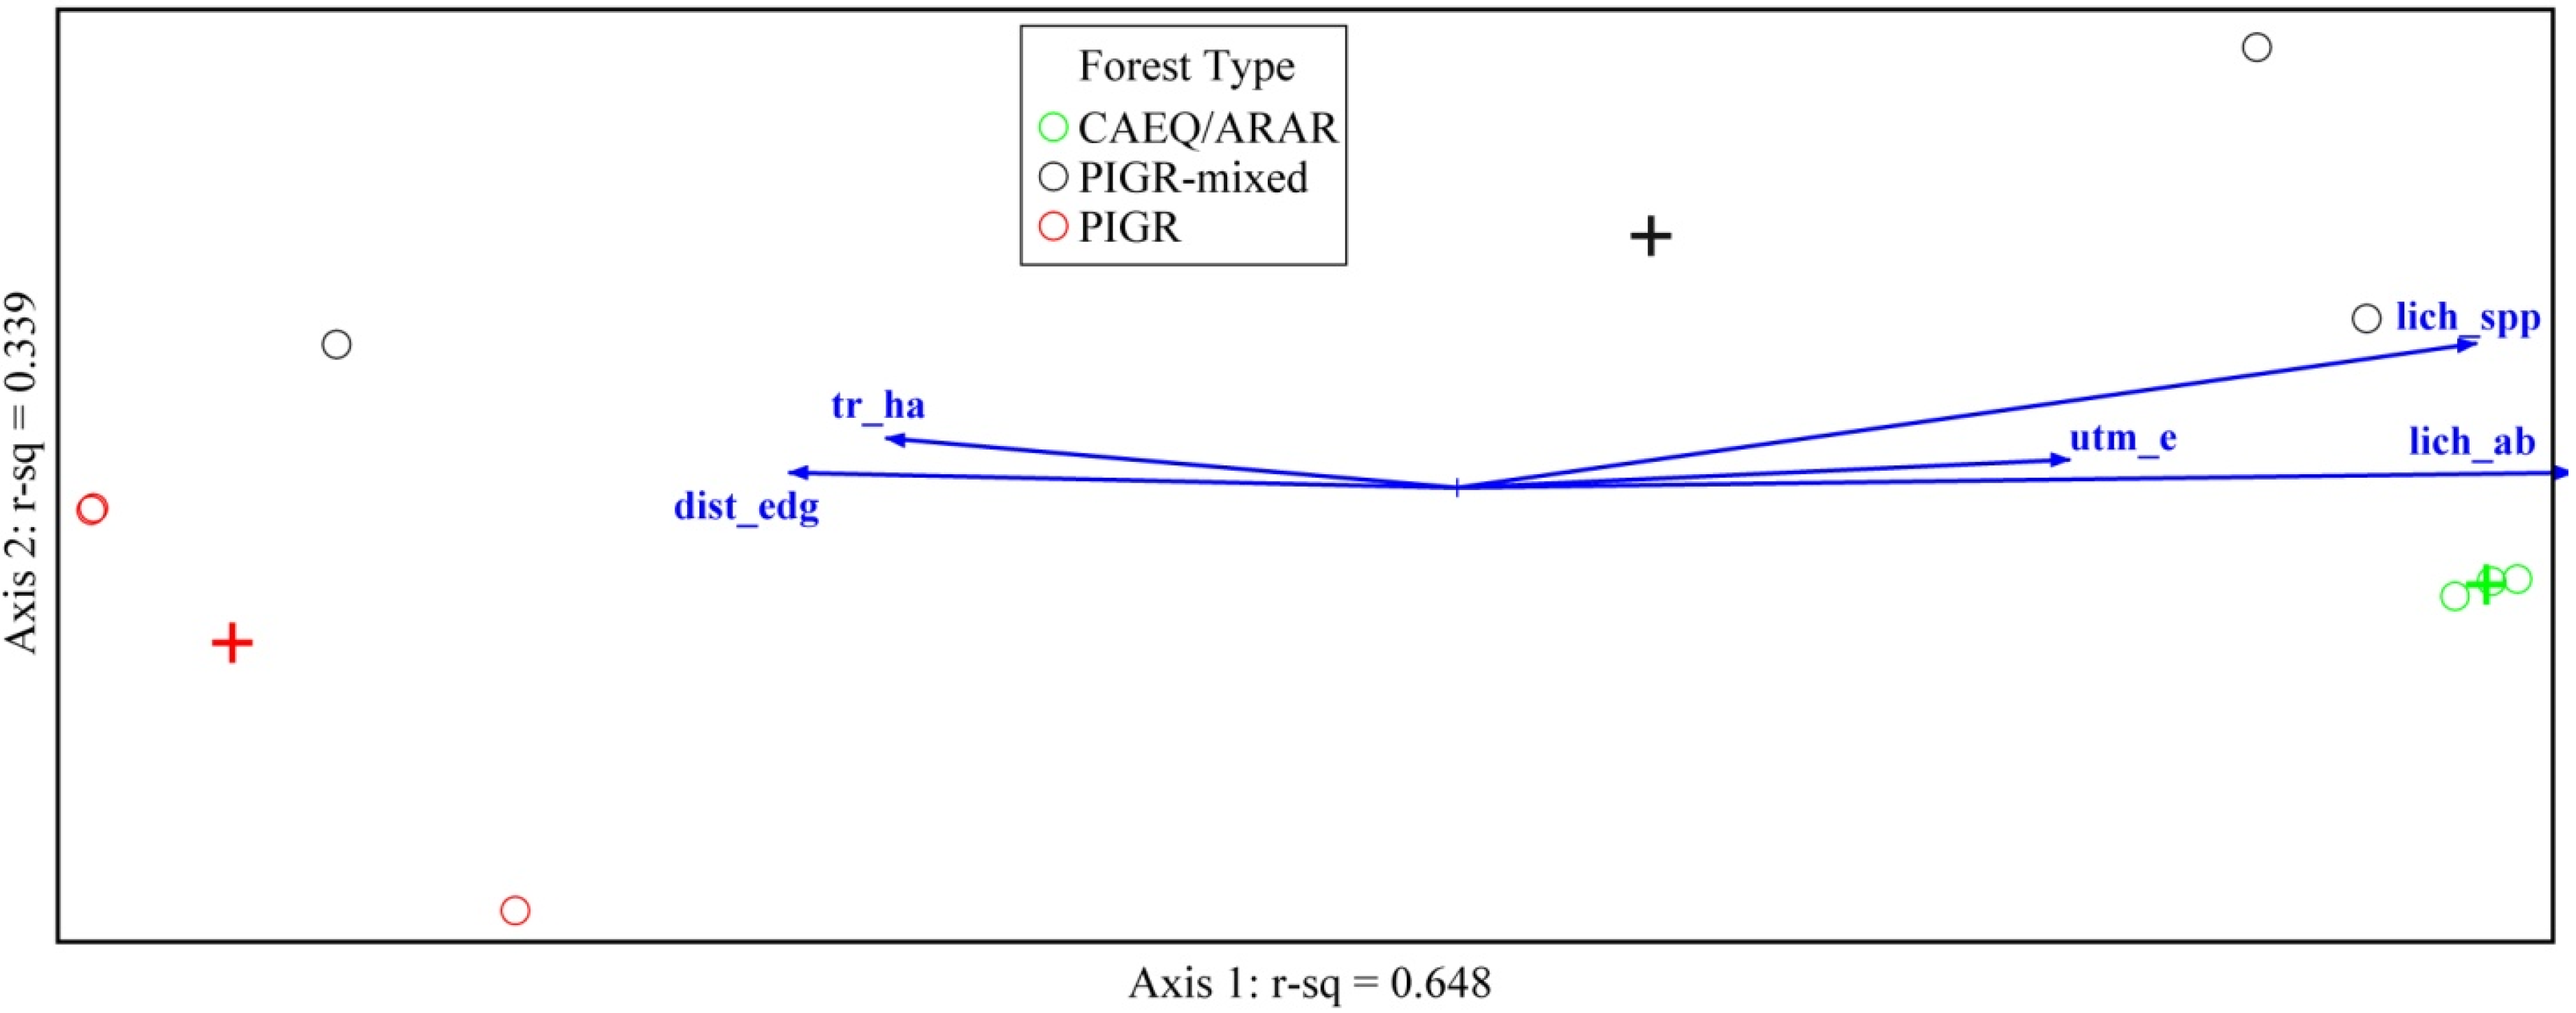
Ordination resulted in a two-dimensional solution on a matrix of eight species by nine sample locations, with a secondary matrix of nine environmental variables. The final NMS solution produced a stress value of 0.001 with an instability of 0.00. A Monte Carlo test of 250 random data runs versus the real data set verified a significant NMS outcome (p = 0.008). Figure 2 displays a joint plot of the ordination where an overlay of the categorical variable forest type is plotted in lichen “species space” further supporting results of the MRPP test for within group agreement and between group separation. The two-axis solution described about 97% of ordination variance (axis 1: r2 = 0.648; axis 2: r2 = 0.339; orthogonality = 28.5). Length and direction of vectors corresponds to environmental (explanatory) variable strength and relationship to the two-dimensional lichen species space. Only environmental variables making the strongest contributions to species distributions are shown (i.e., r ≥ 0.5 or < −0.5) in the joint plot (Figure 2). Table 4 presents NMS results by axes for all environmental variables and lichen species. Strong positive and negative responses to axis 1 (Figure 2, Table 4) suggest factors working in opposition to each other in terms of their influence on lichen presence and abundance on Heron Island. As the stronger of the two dimensions represented here, axis 1 appears to describe a gradient of available light, tree density, and tree diversity where higher lichen species richness and abundance align positively with UTM easting and more diverse forest types, and negatively with distance to forest edge and number of trees ha−1. Lack of strong responses along axis 2 indicate poorly defined explanatory factors or the absence of critical elements in our survey (Figure 2). Foliose lichen species (Dirinaria picta (Sw.) Clem. and Shear, Pyxine cocoes (Sw.) Nyl., Hyperphyscia adglutinata (Flörke) H. Mayrhofer and Poelt) strongly favor the apparent light and tree species diversity gradient suggested by axis 1 (Figure 3), while crustose lichens (Coenogonium queenslandicum (Kalb and Vĕzda) Lücking, Lecanora arthothelinella Lumbsch (Figure S1), Strangospora ochrophora appear to favor the undefined factor(s) determining nearly 40% of the variance within axis 2 of this ordination (Table 4).
Figure 2. A jointplot depicts the results of nonmetric multidimensional scaling (NMS) ordination of eight lichen species by nine sample plots. Highly correlated environmental variables (r > 0.5 or < −0.5; Table 4) are overlaid on the ordination to show relationships to primary axes. Vectors indicate direction (arrow) and strength (length) of these factors in the ordination space defined by plot values of all measured variables. Variables shown are: distance from the sample plot center to forest/beach edge (dist_edg), total trees per ha (tr_ha), lichen species count per plot (lich_spp), UTM location easting (utm_e), and abundance of all lichen species per plot (lich_ab). Forest types are described in Table 1 (CAEQ/ARAR = Casuarina equisetifolia/Argusia argentea) and show how groups separate in the Heron Island lichen ordination space. Symbols in bold correspond to forest type group centroid values.
Forests 06 01557 g002
Figure 3. Foliose lichens of Heron Island. (a) Dirinaria picta on she-oak (Casuarina equisetifolia) bark; (b) Pyxine cocoes on she-oak bark; (c) Hyperphyscia adglutinata on Pisonia (Pisonia grandis) bark. White polygons in 3c are the sterile thalli found commonly throughout the study on Pisonia.
Forests 06 01557 g003
Table 4. Coefficients of determination for correlations between environmental variables, lichen species, and primary ordination axes. Variables in boldface have r values >0.5 or <−0.5.
r Value
CodeAxis 1Axis 2
ENVIRONMENTAL VARIABLES
UTM Eastingutm_e0.7100.151
UTM Northingutm_n0.401−0.318
Distance to Forest Edge (beach)dist_edge−0.7410.109
Number of Trees ha−1tr_ha−0.6850.202
Total Basal Area ha−1ba_total−0.4910.111
Live Basal Area ha−1ba_live−0.4850.108
Pisonia grandis Basal Area ha−1ba_pigr−0.5470.072
Number of Tree Speciestr_spp0.4990.216
Number of Lichen Specieslich_spp0.9160.344
Total Lichen Abundance (Plot)lich_ab0.9590.113
LICHEN SPECIES
Dirinaria pictaDIPI0.667−0.299
Pyxine cocoesPYCO0.9740.355
Hyperphyscia adglutinataHYAD0.9780.145
Coenogonium queenslandicumCOQU−0.2230.544
Lecanora arthothelinellaLEAR0.2610.695
Strangospora ochrophoraSTOC−0.308−0.667
Cyanobacteria (unknown)CYANO0.9640.231
Sterile lichen thalli (unknown)THALLI−0.992−0.319

4. Discussion

4.1. Lichens as Indicators of Forest Diversity

Relatively low plant diversity of Pisonia-dominated islands is mirrored in both the tree and lichen communities of Heron Island. Walker et al. [7] recorded 35 vascular plant species for Heron Island, while Batianoff [5] and Batianoff and Hacker [6] documented 40 and 28 plant species for nearby Masthead and Wilson Islands, respectively. We found six identifiable lichen species and two potentially nascent lichen forms within the Heron Island forest community. We acknowledge this low tally of among our target taxon limits the power of statistical analysis, though a species-area curve illustrates that our sampling was adequate for the number of lichen species captured (S2). Also, a very limited lichen flora presents some unique considerations. The greatest diversity of these lichens was found in forests not dominated by Pisonia (Figure S3). Three of the six lichens occurred on only one or two of our nine sample locations and landscape abundance of species was moderate to low (Table 2). Pisonia dominated stands—visually depauperate of understorey vascular plants (Figure 4)—were among the most limited in lichen diversity and total abundance (Table 1). Moreover, the most significant contrast in lichen community make-up was found between CAEQ/ARAR and PIGR forest types, indicating a strong habitat gradient predicated upon the number of tree species present and reflective of greater plant diversity under CAEQ/ARAR cover [5] (Figure S3). We also note an apparent phenotypic distinction between CAEQ/ARAR and PIGR where the former correlated well with foliose lichens and the later favored crustose species (Table 4).
Figure 4. Highly shaded Pisonia (Pisonia grandis) forests support few understorey plants or arboreal lichens. Shearwater nests are visible as excavated holes and sandy mounds across the forest floor.
Forests 06 01557 g004
Systematic inventories of coral cay lichen communities are uncommon, but may aid conservationist efforts in rapid assessments of forest status, diversity, and change over time where vascular plant surveys are potentially cost prohibitive. Simple visual surveys, or other techniques such as measures of light penetration, may lack a quantitative basis that relates directly to overall biodiversity such as demonstrated here with a lichen community indicator. In North America [19], Europe [27], and Australia [17] such practices have yielded great insights into forest conditions and are now commonly included in larger suites of national forest monitoring indicators [9,20]. Our challenge will be to assess how well lichen communities track changes in plant diversity as we move from relatively simple island systems to those of greater diversity. For example, Walker et al. [7] make a case for higher floral diversity on Pisonia islands of the northern Great Barrier Reef versus the southern islands. The bulk of all Pisonia forest coverage in Australia, however, is found in the southernmost island groups [5]. Similarly, we may consider tracking changes in vegetative diversity using successional gradients (based on dominant tree cover) as a surrogate for time [11]. Relationships between biodiversity and Pisonia height, time since disturbance, relative amount of coverage, presence of other tree species, plus salt, light, and wind tolerance have been posited by others [7,28]. Use of this information alongside systematic lichen community surveys can provide indices of plant diversity, as well as establish baseline data for addressing status and trend issues within the broader context of Great Barrier Reef conservation.

4.2. Key Factors Influencing Pisonia-Dominated Lichen Communities

The present study, in both field and analytical approach, was limited in scope and number of lichen species; therefore, results should be viewed in an exploratory vein. Nonetheless, findings presented here suggest that lichen communities, and by extension greater plant diversity, are dependent on relative coverage of Pisonia forests. Near the forest fringe we recorded greater tree diversity and more lichen species; the interior Pisonia forest displayed the opposite pattern (Figure 4). Ordination of all lichen, tree, and environmental data for this study resulted in a strong gradient to support this finding (Figure 2, Table 4). Axis 1 demonstrates a lichen community affinity for available sunlight where those plots located generally further east on the island and having more tree species (COEQ/ARAR) strongly correlated with higher lichen diversity and abundance. In contrast, PIGR and one PIGR mixed tree plot (H15) were located far from the forest-beach ecotone, had high tree density, and high Pisonia BA, all of which are associated with low light, shaded, and limited tree species environments. Number of tree species is just below the threshold for inclusion in the ordination jointplot, though it is still strongly positively correlated with lichen rich and high light environments (Table 4). In moist forests, available light, often measured in terms of forest gaps, is positively correlated to lichen diversity [10,15]. Further examination of one sample location (H15) is illustrative of several key points. This interior forest stand was dominated by Pisonia, though the presence of three other tree species (i.e., diverse lichen habitat) was insufficient to overcome the negative effects of a low light environment on lichen community vigor (Table 1, Figure 2). Another possible reason for limited lichens at H15 is that recent localized disturbance to this forest has promoted ingrowth of additional trees which are too young to have allowed lichen establishment. This recent “gap” disturbance theory is somewhat supported by the high tree count, but low total BA found at H15.
Axis 2 of our ordination provides no clear explanatory value toward understanding lichen community gradients on Heron Island even though nearly 40% of our variance resides here (Figure 2). One possible explanation that was not specifically tested here is nitrogen (N) deposition. A rich body of research in Europe and North American provides evidence for strong gradients related to airborne N [15,29,30,31]. In these works, documentation of nitrogen tolerant (nitrophilous) and intolerant lichen species has aided ecologists in determining previously unseen sources of forest degradation. Heron Island, similar to other Pisonia-dominated cays, is a prime breeding site for large populations of two prominent Great Barrier Reef seabirds: white-capped noddy (Anous minutus Boie) and wedge-tailed shearwater (Puffinus pacificus Gmelin). While the shearwater, which nests underground, is thought to be instrumental in transporting Pisonia seed [7], approximately 70,000 noddies nest in Heron Island tree canopies and deposit an estimated 103 g·m−2 of N annually (Figure S4) [32]. Direct deposition of N from seabird guano on trees, as well as indirect uptake of N via groundwater leaching and root uptake may, while apparently being tolerable to Pisonia itself [33], be intolerant for potential lichen colonizers. In the present study, we note that nascent lichens in the form of cyanobacteria were only recorded in locations near the island’s perimeter (high light environments) and with putatively low N deposits (non- or mixed-Pisonia forest types). Neitlich and McCune (10) have noted that N-fixing cyanolichens also thrive in high light communities such as those found near Heron Islands forest edge. Additionally, Schmidt et al. [33] found a vascular plant gradient of sorts on Heron Island where greater presence of N in plants associated with Pisonia appeared to be lessened in plants at or near the forest-beach ecotone. Further work in this arena will be required to fully understand light, nitrogen, and species diversity issues in coral cay forest environments.
A final factor, also not measured directly here, is tree bark texture. In general, trees with smoother bark are less conducive to lichen establishment [15]. Previous work on North American quaking aspen (Populus tremuloides Michx.) tested whether portions of trees with smooth versus rough or scarred bark would attract more species and found stark contrast in favor of scarred trunk sections [11]. We note here that Pisonia has smooth bark which may be deleterious to lichen colonization and may be partly responsible for undefined factors reflected in axis 2 of our ordination.
From a temporal perspective, Pisonia-dominated coral cays should be viewed as dynamic systems in which dependent plant communities, including lichens, will respond to periodic forest disturbances and recovery processes. Previous work on Heron Reef (and elsewhere) advocated for an “intermediate disturbance hypothesis” wherein the highest species diversity was associated with moderate disturbance levels [28]. A key explanatory ingredient for lichen communities in the Rocky Mountains, USA, in addition to N deposition was forest succession [31]. In their work, the temporal transition between dominant forest cover types, also an intermediate level, explained more environmental variance than all other factors. Recent work in a boreal setting also supports greater lichen diversity among mixed tree species at mid succession stages [34].
Climate variability plays a key role in Pisonia forest dynamics, with both cyclone activity and drought resulting in tree mortality. There is clear evidence that cyclones can dramatically impact Pisonia forests, with Cyclone Dinah in 1967 [35], Cyclone David in 1976 [36], and Cyclone Paul in 1980 [3] all damaging Pisonia via wind shearing. These events resulted in much more open forest environments in the 1970s and 1980s compared to the present. Drought can also stress Pisonia trees, making them more susceptible to mortality through infestation by scale insects (Pulvinaria urbicola Cockerell) and attendant ants, which collectively reduce Pisonia cover [1]. There is evidence that climate variability may influence scale insects and ant population dynamics, with trees being more susceptible to infestation through stressed trees mobilizing nutrients in the soil during drought events and indirectly through a reduction in Nitrogen soil inputs due to rising sea temperatures reducing prey availability to resident seabirds [2]. Greenslade [2] also noted that scale insect and ant populations dropped when wetter and cooler conditions returned. Thus, we speculate, given the present study addressing lichen communities on Heron Island, that broader regional impacts to Pisonia forests impacted by disturbance and climate change will be reflected in early warning mechanisms such as the lichen bioindicator approach demonstrated here.

5. Conclusions

We conducted a systematic survey of epiphytic lichen communities on a small coral cay on the Great Barrier Reef, Australia. Heron Island, less than 0.2 km2, is dominated by Pisonia grandis forests which often exhibit low vegetative diversity. The results of this exploratory study strongly suggest that lichen communities are no exception; six identifiable species were confirmed here where mainland forests supported 50–60 lichen species [16,18]. Lichen forms within the forested environment of Heron Island were either foliose or crustose and were most abundant and diverse near the beach-forest ecotone. In contrast, Pisonia-dominated interior forests were nearly depauperate of epiphytic lichens. Conclusions of this study suggest lichens demonstrated distinct preferences for forest communities found near the island’s perimeter. The most important explanatory variables for lichen presence, abundance, and distribution on Heron Island were distance to forest edge, number of trees ha−1 and Pisonia basal area. As each of these variables increases, they positively relate to the degree of shading and negatively influence lichen occurrence. Mature forests severely limit sunlight penetration, which in turn inhibits most understorey growth. This study highlights a gradient for response to Pisonia shading, providing further evidence for lichens as indicators of broader forest diversity. We speculate that the trends in plant community development shown here will vary depending on frequency of coral cay disturbances. Demonstrated links between lichen communities and forest/successional pathways, such as those shown here, have potential to inform policy and management actions. A key question for future work is whether the lichen biomonitoring techniques applied here are exportable to greater regional studies of island forest development, biodiversity, and change over time.

Acknowledgments

The University of Queensland (UQ), Geography Planning and Environmental Management School provided funding, facilities, and administrative assistance to the lead author under a Visiting Fellowship agreement. UQ Heron Island Research Station staff was instrumental in supporting this research. We wish to thank Queensland Government Department of Environment and Heritage for collections and research permits. Utah State University (USU) Ecology Center and Wildland Resources department also provided logistical support and administration. Chris McGinty, USU College of Natural Resources GIS Lab Assistant Director, provided aid with mapping. We are grateful for the comments of anonymous reviewers.

Author Contributions

Paul C. Rogers, Anne E. Hedrich, and Patrick T. Moss conceived and designed the study; Paul C. Rogers and Anne E. Hedrich implemented the study, collected lichen samples, and compiled/edited field data; Roderick W. Rogers and Paul C. Rogers identified and archived lichen samples; Paul C. Rogers performed all data analysis; Paul C. Rogers, Patrick T. Moss and Anne E. Hedrich wrote the paper.

%20ary

Figure S1. The lichen Lecanora arthothelinella on Argusia argentea bark.
Forests 06 01557 g005
Figure S2. Species-Area Curve for number of plots required to capture complete lichen census at Heron Island, Australia. The asymptotic nature of the species curve (dark blue), as well as Sørensen distance curve (bright blue), describes a maximization of effort (number of plots) required to capture the complete epiphytic lichen flora of the survey area. Dotted lines represent ±1 standard deviation.
Forests 06 01557 g006
Figure S3. Two views of island edge forests (CAEQ/ARAR), which allow much greater light penetration, understorey plant cover, and tree diversity. (a) depicts field measures among predominantly Argusia argentea cover; (b) shows Pandanus heronensis.
Forests 06 01557 g007aForests 06 01557 g007b
Figure S4. White-capped noddy (Anous minutus) nesting in Pisonia (Pisonia grandis) tree. The lack of nesting material and great number of noddies present (est. 70,000 birds; [32]) restricts bird nest make-up to only Pisonia leaves.
Forests 06 01557 g008

Conflicts of Interest

The authors declare no conflict of interest.

References

  1. Batianoff, G.N.; Naylor, G.C.; Olds, J.A.; Fechner, N.A.; Neldner, V.J. Climate and Vegetation Changes at Coringa-Herald National Nature Reserve, Coral Sea Islands, Australia 1. Pac. Sci. 2010, 64, 73–92. [Google Scholar] [CrossRef]
  2. Greenslade, P. Climate variability, biological control and an insect pest outbreak on Australia’s Coral Sea islets: Lessons for invertebrate conservation. J. Insect Conserv. 2008, 12, 333–342. [Google Scholar] [CrossRef]
  3. Ogden, J. On cyclones, Pisonia grandis and the mortality of Black Noddy Anous minutus on Heron Island. Emu 1993, 93, 281–283. [Google Scholar] [CrossRef]
  4. Woinarski, J. Biodiversity conservation in tropical forest landscapes of Oceania. Biol. Conserv. 2010, 143, 2385–2394. [Google Scholar] [CrossRef]
  5. Batianoff, G.N. Floristic, vegetation and shoreline changes on Masthead Island, Great Barrier Reef. Proc. R. Soc. Qld. 1999, 108, 1–11. [Google Scholar]
  6. Batianoff, G.N.; Hacker, J.L.F. Vascular plant protrait of Wilson Island, Great Barrier Reef, Australia. Proc. R. Soc. Qld. 2000, 109, 31–38. [Google Scholar]
  7. Walker, T.A.; Chaloupka, M.Y.; King, B.R. Pisonia islands of the Great Barrier Reef. Atoll Res. Bull. 1991, 350, 1–23. [Google Scholar] [CrossRef]
  8. Cribb, A.B.; Cribb, J.W. Plant Life of the Great Barrier Reef and Adjacent Shores; University of Queensland Press: St. Lucia, QLD, Australia, 1985. [Google Scholar]
  9. Nimis, P.L.; Scheidegger, C.; Wolseley, P. (Eds.) Monitoring with Lichens—Monitoring Lichens; Kluwer Academic Publishers: Dordrecht, The Netherlands, 2002.
  10. Neitlich, P.N.; McCune, B. Hotspots of epiphytic lichen diversity in two young managed forests. Conserv. Biol. 1997, 11, 172–182. [Google Scholar] [CrossRef]
  11. Rogers, P.C.; Ryel, R.J. Lichen community change in response to succession in aspen forests of the Rocky Mountains, USA. For. Ecol. Manag. 2008, 256, 1760–1770. [Google Scholar] [CrossRef]
  12. Rosso, A.L.; Rosentreter, R. Lichen diversity and biomass in relation to management practices in forests of northern Idaho. Evansia 1999, 16, 97–104. [Google Scholar]
  13. Will-Wolf, S.; Esseen, P.A.; Neitlich, P. Monitoring biodiversity and ecosystem function: Forests. In Monitoring with Lichens—Monitoring Lichens; Nimis, P.L., Scheidegger, C., Wolseley, P.A., Eds.; Kluwer Academic Publishers: Dordrecht, The Netherlands, 2002; pp. 203–222. [Google Scholar]
  14. Hedenås, H.; Ericson, L. Aspen lichens in agricultural and forest landscapes: The importance of habitat quality. Ecography 2004, 27, 521–531. [Google Scholar] [CrossRef]
  15. Barkman, J.J. (Ed.) Phytosociology and Ecology of Cryptogamic Epiphytes; Van Gorcum & Co.: Assen, The Netherlands, 1958.
  16. Morley, S.E.; Gibson, M. Successional changes in epiphytic rainforest lichens: Implications for the management of rainforest communities. Lichenologist 2010, 42, 311–321. [Google Scholar] [CrossRef]
  17. Abbott, I.; Williams, M.R. Silvicultural impacts in jarrah forest of Western Australia: Synthesis, evaluation, and policy implications of the Forestcheck monitoring project of 2001–2006. Aust. For. 2011, 74, 350–360. [Google Scholar] [CrossRef]
  18. Stevens, G.N.; Rogers, R.W. The macrolichens flora from the mangroves of Moreton Bay. Proc. R. Soc. Qld. 1979, 90, 33–49. [Google Scholar]
  19. Will-Wolf, S.; Scheidegger, C.; McCune, B. Methods for monitoring biodiversity and ecosystem function: Monitoring scenarios, sampling strategies and data quality. In Monitoring with Lichens—Monitoring Lichens; Nimis, P.L., Scheidegger, C., Wolseley, P.A., Eds.; Kluwer Academic Publishers: Dordrecht, The Netherlands, 2002; pp. 147–162. [Google Scholar]
  20. McCune, B. Lichen communities as indicators of Forest Health. New Front. Bryol. Lichenol. 2000, 103, 353–356. [Google Scholar]
  21. McCune, B.; Lesica, P. The trade-off between species capture and quantitative accuracy in ecological inventory of lichens and bryophytes in forests in Montana. Bryologist 1992, 95, 296–304. [Google Scholar] [CrossRef]
  22. McCune, B.; Mefford, M.J. PC-ORD: Multivariate Analysis of Ecological Data; MjM Software: Gleneden Beach, OR, USA, 2006. [Google Scholar]
  23. Peck, J.E. Multivariate Analysis of Community Ecologists: Step-by-Step Using PC-ORD; MjM Sortware Design: Gleneden Beach, OR, USA, 2010. [Google Scholar]
  24. McCune, B.; Grace, J.B.; Urban, D.L. Analysis of Ecological Communities; MjM Software: Gleneden Beach, OR, USA, 2002. [Google Scholar]
  25. Kruskal, J.B. Nonmetric multidimensional scaling: A numerical method. Psychometrika 1964, 29, 115–129. [Google Scholar] [CrossRef]
  26. Rogers, P.C.; Rosentreter, R.; Ryel, R. Aspen indicator species in lichen communities in the Bear River Range of Idaho and Utah. Evansia 2007, 24, 34–41. [Google Scholar] [CrossRef]
  27. Wolseley, P.A.; Hill, D.J. Methods for Monitoring Lichens. In Monitoring with Lichens—Monitoring Lichens; Nimis, P.L., Scheidegger, C., Wolseley, P.A., Eds.; Kluwer Academic Publishers: Dordrecht, The Netherlands, 2002; pp. 269–272. [Google Scholar]
  28. Connell, J.H. Diversity in tropical rain forests and coral reefs. Science 1978, 199, 1302–1310. [Google Scholar] [CrossRef] [PubMed]
  29. Van Herk, C.M.; Mathijssen-Spiekman, A.M.; de Zwart, D. Long distance nitrogen air pollution effects on lichens in Europe. Lichenologist 2003, 35, 347–359. [Google Scholar]
  30. Jovan, S.; McCune, B. Using epiphytic macrolichen communities for biomonitoring ammonia in forests of the greater Sierra Nevada, California. Water Air Soil Pollut. 2006, 170, 69–93. [Google Scholar] [CrossRef]
  31. Rogers, P.C.; Moore, K.; Ryel, R.J. Aspen succession and nitrogen loading: A case for epiphytic lichens as bioindicators in the Rocky Mountains, USA. J. Veg. Sci. 2009, 20, 498–510. [Google Scholar] [CrossRef]
  32. Allaway, W.G.; Ashford, A.E. Nutrient input by seabirds to the forest on a coral island of the Great Barrier Reef. Mar. Ecol. Prog. Ser. 1984, 19, 297–298. [Google Scholar] [CrossRef]
  33. Schmidt, S.; Dennison, W.C.; Moss, G.J.; Stewart, G.R. Nitrogen ecophysiology of Heron Island, a subtropical coral cay of the Great Barrier Reef, Australia. Funct. Plant Biol. 2004, 31, 517–528. [Google Scholar] [CrossRef]
  34. Bartels, S.F.; Chen, H.Y. Dynamics of epiphytic macrolichen abundance, diversity and composition in boreal forest. J. Appl. Ecol. 2015, 52, 181–189. [Google Scholar] [CrossRef]
  35. Kikkawa, J. Birds recorded at Heron Island. Sunbird 1970, 1, 34–48. [Google Scholar]
  36. Flood, P.G.; Jell, J.S. The effect of cyclone ‘David’ (January 1976) on the sediment distribution patterns on Heron Reef, Great Barrier Reef. In Proceedings of the Third International Coral Reef Symposium, University of Miami, Miami, FL, USA, May 1977; pp. 119–125.

