Article

Evaluating the Ecological Integrity of Structural Stand Density Management Models Developed for Boreal Conifers

Canadian Wood Fibre Centre, Canadian Forest Service, Natural Resources Canada, 1219 Queen Street East, Sault Ste. Marie, ON P6A 2E5, Canada
Forests 2015, 6(4), 992-1030; https://doi.org/10.3390/f6040992
Submission received: 12 December 2014 / Revised: 4 March 2015 / Accepted: 9 March 2015 / Published: 7 April 2015

Abstract

:
Density management decision-support systems (e.g., modular-based structural stand density management models (SSDMMs)), which are built upon the modeling platform used to develop stand density management diagrams, incorporate a number of functional relationships derived from forest production theory and quantitative ecology. Empirically, however, the ecological integrity of these systems has not been verified and hence the degree of their compliance with expected ecological axioms is unknown. Consequently, the objective of this study was to evaluate the ecological integrity of six SSDMMs developed for black spruce (Picea mariana) and jack pine (Pinus banksiana) stand-types (natural-origin and planted upland black spruce and jack pine stands, upland natural-origin black spruce and jack pine mixtures, and natural-origin lowland black spruce stands). The assessment included the determination of the biological reasonableness of model predictions by determining the degree of consistency between predicted developmental patterns and those expected from known ecological axioms derived from even-aged stand dynamics theoretical constructs, employing Bakuzis graphical matrices. Although the results indicated the SSDMMs performed well, a notable departure from expectation was a possible systematic site quality effect on the asymptotic yield-density relationships. Combining these results with confirmatory evidence derived from the literature suggest that the site-invariant self-thinning axiom may be untenable for certain stand-types.

1. Introduction

The complexity of density management decision-making for traditional volumetric-based objectives has been greatly reduced with the introduction of stand density management diagrams (SDMDs; e.g., [1,2,3]). As traditionally presented, the SDMD is a graphical decision-support tool that is used to determine the density management regime required to realize a specified stand-level management objective. Classified as stand-level distance-independent average tree models within the context of the forest modeling nomenclature [4], SDMDs can be subdivided into either static or dynamic types depending on their ability to describe density change dynamics throughout the rotation [5]. The latter type explicitly accounts for density-dependent mortality throughout all stages of stand development via the inclusion of a mortality submodel whereas the former type does not. Given the paradigm shift in management focus from the traditional objective of volumetric yield maximization to one based on maximizing end-product quality [6], economic worth [7], and/or ecosystem service potentials, it was evident that SDMDs would also require a generational shift in order for them to maintain their utility in forest management decision-making. As a consequence, the modular-based structural stand density management model (SSDMM) was developed. This model was developed by expanding the dynamic SDMD modelling framework through the incorporation of recovery modules for deriving diameter, height, log-type, biomass, carbon, product quality and value distributions and calibrated for natural-origin (naturally regenerated stands without a history of density regulation) and managed (naturally or artificially regenerated stands with a history of density regulation) jack pine (Pinus banksiana Lamb.) stand-types [8]. Similar SSDMMs were subsequently developed for natural-origin and managed black spruce (Picea mariana (Mill) BSP) stands [9], natural-origin black spruce and jack pine mixtures [10], and natural-origin lowland black spruce stand-types [11]. The hierarchical-based SSDMM structure consists of six sequentially-linked estimation modules, denoted as follows: Module A—Dynamic SDMD; Module B—Diameter and Height Recovery; Module C—Taper Analysis and Log Estimation; Module D—Biomass and Carbon Estimation; Module E—Product and Value Estimation; and Module F—Fiber Attribute Estimation (e.g., see Figure 1 in [9]). The dynamic elements of the model that drive the overall SSDMM are included solely within Module A, which is essentially a mathematical replication of the traditional modeling framework used to develop dynamic SDMDs. These relationships include a site-specific height-age function with modifiers for quantifying thinning and genetic worth effects, density-dependent and density-independent mortality functions, reciprocal equations of the competition and yield density effect, and the self-thinning rule [8,9,10,11]. These static and dynamic ecological-based relationships derived from the plant population biology, forest production theory and empirical experimentation, provide a biological foundation for the models [2,3,12]. Consequentially, determining the degree of consistency in predicted volumetric yield production patterns, site-specific mortality trends, and yield-density interrelationships in reference to expectations derived from known axioms of even-aged stand dynamics, is of primary importance in determining the ecological integrity of the overall modeling approach. Among others, these include the Sukatsckew effect, Eichhorn rule, yield-density relationships and density-dependent allometry. These axioms or hypotheses have general applicability to even-aged stands irrespective of species or locale.
More generally, determining the integrity of ecological-based forecasting models used to formulate policy, guide silvicultural practices or design optimal management strategies, is a critical prerequisite to model deployment [13]. Determining the degree of consistency between predicted developmental patterns and those expected from known ecological axioms derived from even-aged stand dynamics, represents an important step in this process. Fortunately, Bakuzis graphical matrices offer an analytical framework for such an assessment (sensu [14]). Thus, the objective of this study was to evaluate the ecological integrity of the SSDMMs employing this approach. The SSDMMs were developed for potential deployment in operational stand-level management planning within the central portion of the Canadian Boreal Forest Region. Hence the scope of the evaluation included the consideration of a set of plausible crop planning scenarios involving precommercial thinning (PCT) within natural-origin stand-types and commercial thinning (CT) within plantations, across a wide range of site qualities with varying rotation lengths and initial densities. A secondary assessment focusing on the empirical precision of model forecasts will be reported on separately.

SSDMMs and Their Evaluation

An integrated set of stand-type-specific functional and empirical relationships within each of the SSDMMs quantifies the effect of density manipulation on resource competition processes and associated consequences in terms of stand dynamics and rotational yields, end-products, and value outcomes. Among others, these relationships include the reciprocal equations of the competition-density (C-D) and yield-density (Y-D) effect [15,16], self-thinning rule [17,18], composite height-diameter, taper, biomass, product, and value equations [19], diameter recovery parameter prediction equation systems [20], and height-age equation modifiers for quantifying thinning and genetic worth effects. More specifically, these latter response models account for the increased rate of stand development arising from precommercial thinning treatments and from the planting of genetically-improved stock, through temporal adjustments to the species-specific site-based mean dominant height-age functions. The thinning model utilized a relative height growth modifier, which is dependent on the degree of the thinning intensity (i.e., number of trees removed) and the magnitude of response chosen (maximum or minimum). Similarly, the genetic worth effects model employed a relative height growth modifier which was based on known estimates of genetic gain and was modelled either from the specified selection age to rotation (Type 1) or from the time of establishment to rotation (Type 2). In order to account for the intrinsic temporal decline in the magnitude of both thinning and genetic worth effects throughout the rotation, the models incorporated phenotypic juvenile age-mature age correlation functions (sensu [21]). Computationally, for a given stand-type, site quality, crop plan (inclusive of specific information regarding initial densities, genetic worth effects, thinning treatments, merchantable specifications, operational adjustment factors, degrade factors, cost profiles, and rotation lengths), the enhanced modular-based SSDMMs employ a hierarchal sequence to estimate volumetric yields, diameter distributions, tree heights, log assortments, components-specific biomass and carbon outcomes, sawmill-specific products and associated values, and fiber quality attributes. Operationally, the algorithmic variants enable end-users to determine the optimal crop plan for a given volumetric, end-product or economic objective by simultaneously contrasting a set of density management regimes in terms of (1) annual measures at the diameter class and stand levels of volumetric, log product, biomass, carbon, and end-product production; and (2) rotational-based performance metrics reflecting overall productivity, volumetric yield outcomes, end-product quantity and quality, economic efficiency, and ecological sustainability. For a complete description of each model component including the analytical details regarding the thinning and genetic response models and the overall computational sequence utilized, refer to Newton [8,9,10,11].
Similar to most SDMD-based and stand-level growth and yield models used in forest management planning, the site-specific mean dominant height–age function is the main temporal driver affecting yield-density relationships, mortality rates, and overall stand dynamics. This function is also used to incorporate accelerated height growth arising from precommercial thinning treatments and the use of genetically enhanced stock. Consequently, ensuring that the predicted site-specific height-age patterns adhere to expectation in terms of increased height growth following precommercial thinning in the case of natural-origin stand-types and the use of improved stock in the case of plantations, is a prime prerequisite for model acceptance. Theory also predicts that even-aged stands exhibit structural uniformity across site qualities in terms of the site invariant relationship between mean dominant height and quadratic mean diameter (site form [14]). Stand development patterns should also be consistent with the Sukatsckew effect, which is a fundamental premise underlying most growth and yield stand level models (sensu [14]): self-thinning rates increase with site quality irrespective of initial density or rotation length. In essence, this effect implies that even-aged stands follow similar developmental pathways (e.g., size-density trajectories) across all site qualities but differ in their rate of development, which is site dependent. At full stocking or asymptotic levels of density-stress, even-aged stands are also expected to exhibit consistent size-density allometric relationships across all site qualities irrespective of species. These include site invariant relationships between density and quadratic mean diameter (stand density index) and between mean volume and density (self-thinning rule). Another important empirical-based expectation for even-aged stands is expressed by Eichhorn’s rule (sensu [14]): total stand volume for a given mean stand height is constant across site quality classes. Essentially the focus of this study was to determine the degree of adherence of the stand development patterns generated from the SSDMMs to these globally accepted empirical and theoretical expectations (hypotheses). The results of these comparisons provide a foundation for model acceptance or rejection according to model compliance with accepted theory. If departures from expectation arise then the model is either deficient and requires modification or the axiom under evaluation may require revision. In such cases, supporting experimental findings derived from the literature are used to assist in determining if the former or latter applies.

2. Experimental Section

Simulation output from 120 three-regime-based crop plans were generated using a Fortran-variant of the SSDMM for each of the 4 natural-origin stand-types. This included assessment of annual and rotational outcomes for 5 site qualities, 3 site-specific rotation lengths and 8 initial densities. The crop plans consisted of an unthinned control stand (Regime 1), which was contrasted with 2 PCT stands (Regimes 2 and 3) while holding site quality, rotation length and initial density constant but varying the thinning response model utilized. Specifically, Regime 2 was initially identical to Regime 1 but the stands were subjected to a single PCT treatment at a stand age of 10 years, in which the maximum thinning response model was used. Regime 3 was identical to Regime 2 with the exception that the minimum thinning response model was utilized. The PCT treatments reduced stand densities to a constant residual crop density of approximately 2864 stems/ha (min/max = 2838/2884). The input parameter settings used in the SSDMM simulations for these natural-origin stand-types are listed in Table 1.
Table 1. Parameter settings and conditions for the SSDMMs simulations.
Input ParameterDenotations and (or) Value
Stand-typeNatural-origin Stands (n., subscripted by N)
Natural Upland Black Spruce (PImUN)
Natural Jack Pine (PNbN)
Natural Black Spruce and Jack Pine Mixtures (PImPNbN)
Natural Lowland Black Spruce (PImLN)
Plantations (n., subscripted by M)
Managed Upland Black Spruce (PImUM)
Managed Jack Pine (PNbM)
Site Index (SI)SI ranging from 11 to 19 by 2 m intervals across all 6 stand-types. Note, Ontario-based stand-type-specific SI models were used. For the upland black spruce stand-types (PImUN and PImUM), the SI model developed by Carmean [22] was utilized. For the jack pine stand-types ( PNbN and PNbM), the SI model developed by Carmean [23] was employed. For the mixed black spruce and jack pine stand-type (PImPNbN), the SI models developed by Carmean [22,23] were used in combination. Lastly, for the lowland black spruce stand-types (PImLN), the SI model developed by Newton [24] was used.
Rotation Age (RA)Varied by stand-type and SI. Specifically, for natural-origin stands (PImUN, PNbN, PImPNbN and PImLN): (1) if SI < 15 then RA ranged from 100 to 120 by 10 year intervals; or (2) if SI ≥ 15 then RA ranged from 80 to 100 by 10 year intervals. For plantations (PImM and PNbM): (1) if SI < 15 then RA ranged from 70 to 90 by 10 year intervals; or (2) if SI ≥ 15 then RA ranged from 50 to 70 by 10 year intervals.
Initial Density (NI)Varied by stand-type. Specifically, for natural-origin stands (PImUN, PNbN, PImPNbN and PImLN), NI ranged from 3000 to 10,000 stems/ha by 1000 stems/ha intervals. For plantations (PImM and PNbM), NI ranged from 1500 to 3500 stems/ha by 500 stems/ha intervals.
ThinningVaried by stand-type.
TreatmentsSpecifically, for natural-origin stands (PImUN, PNbN, PImPNbN and PImLN), a single PCT treatment was applied with the following conditions:
Time of Thinning (TA) = 10 years
Thinning Type (TY) = PCT for Regimes 2 and 3 (TY =1)
Thinning Response Model: varied by Regime. Specifically, the maximum response model was used in Regime 2 whereas the minimum response model was used in Regime 3.
Thinning Removal: varied by the stand density existing at the time of thinning: residual target density post-PCT = 2000 to 3000 stems/ha.
For plantations (PImM and PNbM), a single CT treatment was applied.
TA = RA-25 for Regimes 2 and 3
TY: CT for Regimes 2 and 3 (TY = 2)
Thinning Units: %BA
Thinning Removal = 35% basal area
MerchantableLength of pulplog (m) = 2.59
SpecificationsLength of sawlog (m) = 5.03
Minimum small-end inside-bark diameter for pulplogs (cm) = 10
Minimum small-end inside-bark diameter for sawlogs (cm) = 14
Minimum small-end inside-bark diameter for merchantable volume (cm) = 4
Operational0.01%/year
Adjustment Factor
Genetic WorthPlantations only.
EffectsGenetic worth (GW) and selection age (GA):
(1) for black spruce plantations (PImM), GW was set at 10% and GA at 15 years; and (2) for jack pine plantations (PNbM), GW was set at 7% and GA at 20 years.
Genetic worth response model:
(1) Regimes 1 (Control) and 2 utilized a Type 1 response model initiating from the specified selection age; and (2) Regime 3 utilized a Type 2 response model initiating at the time of planting.
Note, for a complete description of all model components including the analytical details regarding the thinning and genetic response models, variable definitions and computations for each of the SSDMMs, refer to the original modelling articles presented by Newton [8,9,10,11].
Similarly, output from 75 three-regime-based crop plans were derived from a Fortran variant of the SSDMM for each of the 2 plantation stand-types. Likewise, this included annual and rotational outcomes for 5 site quality classes, 3 site-specific rotation lengths and 5 initial densities. The crop plans consisted of contrasting a genetically-enhanced unthinned plantation (Regime 1) with 2 CT plantations while holding site quality, rotation length and initial density constant but varying the genetic worth effect response model employed. Specifically, output from an unthinned control plantation (Regime 1) and 2 CT plantations which were identically treated but used different genetic worth effect response models (Regime 2 and 3), were evaluated. Regime 1 represented the unthinned plantation in which genetic worth effects were described by the Type 1 response model (i.e., increased rate of stand development arising from genetic worth effects initiated at the specified selection age). Regime 2 employed the same response model as Regime 1 but included a CT treatment implemented at a rotation-specific age (rotation length −25) during which 35% of the standing basal area was removed. Regime 3 was identical to Regime 2 with the exception that the Type 2 genetic worth effect response model was used (i.e., increased rate of stand development arising from genetic worth effects initiated at the time of establishment). The input parameter settings used in the SSDMM simulations for these plantations are listed in Table 1.
The nested factorial simulation design yielded (1) 360 simulations for each natural-origin stand-type (5 site classes × 3 rotational lengths × 8 initial densities × 3 regimes) and (2) 270 simulations for each plantation type (5 site classes × 3 rotational lengths × 6 initial densities × 3 regimes). The resultant annual-based output from these 1980 simulations were assessed using a variant of Leary’s [14] triangular Bakuzis-based graphical matrices which were generated using an algorithm developed in the R-programming environment (RStudio Integrated Development Environment Version 0.98.484 (RStudio Inc., Boston, MA, USA); R-Development Core Team [25]). The R-coding was partially derived from the open-source program developed by Johnson and Hamlin [26]. The matrices were generated across the 5 site classes by rotation-length and initial density for each regime, yielding 120 graphical panels for each natural-origin stand-type and 90 graphical panels for each plantation stand-type. Each matrix consisted of 19 sub-graphs in which (1) dominant height, density, basal area, volume, and merchantable volume were plotted against total age and quadratic mean diameter (n = 10); (2) density, basal area, volume and merchantable volume were plotted against dominant height (n = 4); (3) basal area, volume and merchantable volume were plotted against density (n = 3); and (4) volume and merchantable volume against relative density (n = 2). In total, 660 graphical matrices within which 19 sub-graphs were generated for each regime. These individual matrices in the tagged image file format (tiff) were then converted to the portable document format (pdf) and combined to form a hierarchical-structured global file. For each of the 4 natural-origin stand-types, site and regime specific temporal developmental trajectories were presented for each rotation length and initial establishment density level. These included (1) unthinned control stands (Regime 1); (2) stands which were initially identical to those in Regime 1 but subjected to a single PCT treatment at a stand age of 10 years in which the maximum thinning response model was employed (Regime 2); and (3) stands which were identical to those in Regime 2 but utilize the minimum thinning response model to account for thinning effects (Regime 3). Similarly, for each of the 2 plantation stand-types, site and regime specific temporal developmental trajectories were presented for each rotation length and initial establishment density level. These consisted of (1) genetically improved unthinned plantations in which genetic worth effects were described by the Type 1 response model (Regime 1); (2) plantations identical to those in Regime 1 but subjected to a single CT treatment in which 35% of the basal area was removed and implemented at a rotation-age-specific age (i.e., rotation age–25; Regime 2); and (3) plantations which were identical to those in Regime 2 but utilizing the Type 2 genetic worth effect response model.
These nested structures facilitated the efficient and effective examination of the individual relationships through rapid scrolling, similar to relational querying, but within a graphical context. This process enabled the detection of departures from expectation and instantaneous comparative analysis among the regimes while holding initial density and rotation length constant. This allowed the relationships presented in the sub-graphs to be readily compared to those expected from known axioms of even-aged stand dynamics. Specifically, the degree of conformity and departures from expectation were assessed within the context of the theoretical constructs derived from forest production concepts, yield-density relationships, quantitative ecology, and population biology, as elaborated on below.

3. Results and Discussion

The results are discussed within the context of the relationships expected for each of the individual axioms examined. As defined in Table 1, the following stand-type-specific textual denotations were also used when reporting and discussing the results: PImUN, PImUM, PNbN, PNbM, PImPNbN and PImLN refer to upland natural-origin black spruce, black spruce plantations, natural-origin jack pine, jack pine plantations, natural-origin black spruce and jack pine mixtures, and natural-origin lowland black spruce stand-types, respectively. Basic matrix notation using the conventional m rows × n columns configuration is used to identify each subgraph under discussion. Given space limitations an abridged set of the graphical output consisting of representative matrices for each stand-type are presented: Figure 1 for PImUN and Figure A1, Figure A2, Figure A3, Figure A4 and Figure A5 in the Appendix for PImUM, PNbN, PNbM, PImPNbN and PImLN, respectively. Note, consistency is maintained throughout all the figures by using identical variables along both the x and y axis: Stand age (Age; year), quadratic mean diameter (QMD; cm), mean dominant height (Hd; m), stand density (Density; stems/ha), and relative density (Relative Density; %/100) along the x-axis versus mean dominant height (Hd; m), stand density (Density; stems/ha), stand basal area (BA; m2/ha), total stand volume (Volume; m3/ha), and total stand merchantable volume (Merch Volume; m3/ha) along the y-axis. Additionally, for reference purposes, the principal concept or relationship being evaluated is denoted in individual subgraphs using the following abbreviated subtitles (n., matrix position denoted in parentheses (row:column)): Site Curves (1:1), Site Form (1:2), Sukatschew Effect (2:1), Reineke (2:2), Spacing Percent (2:3), Stocking Guide (3:4). Yield Curves (4:1), Eichhorn’s Rule (4:3, 5:3), Yield-Density Effect (4:4), Yield-Rel (relative) Density Effect (4:5), Merch (merchantable) Yield Curves (5:1), merch (Merchantable) Yield-Density Effect (5:4) and Merch (merchantable) Yield-Rel (relative) Density Effect (5:5).
Figure 1. Bakuzis matrices for unthinned and precommercially thinned (PCT) upland black spruce (Sb) stands, which were established naturally (N) at an initial densities of 7000 stems/ha and grown on 5 site qualities (SI) over 100 year rotations: (a) Regime 1 represented unthinned control stands; (b) Regime 2 was initially identical to Regime 1 but the stands were subjected to a single PCT treatment at a stand age of 10 years in which stand densities were reduced to 2862 stems/ha and the maximum thinning response model setting was employed; and (c) Regime 3 was identical to Regime 2 but the stands utilized the minimum thinning response model to account for accelerated growth arising from the PCT treatment.
Forests 06 00992 g001aForests 06 00992 g001bForests 06 00992 g001c

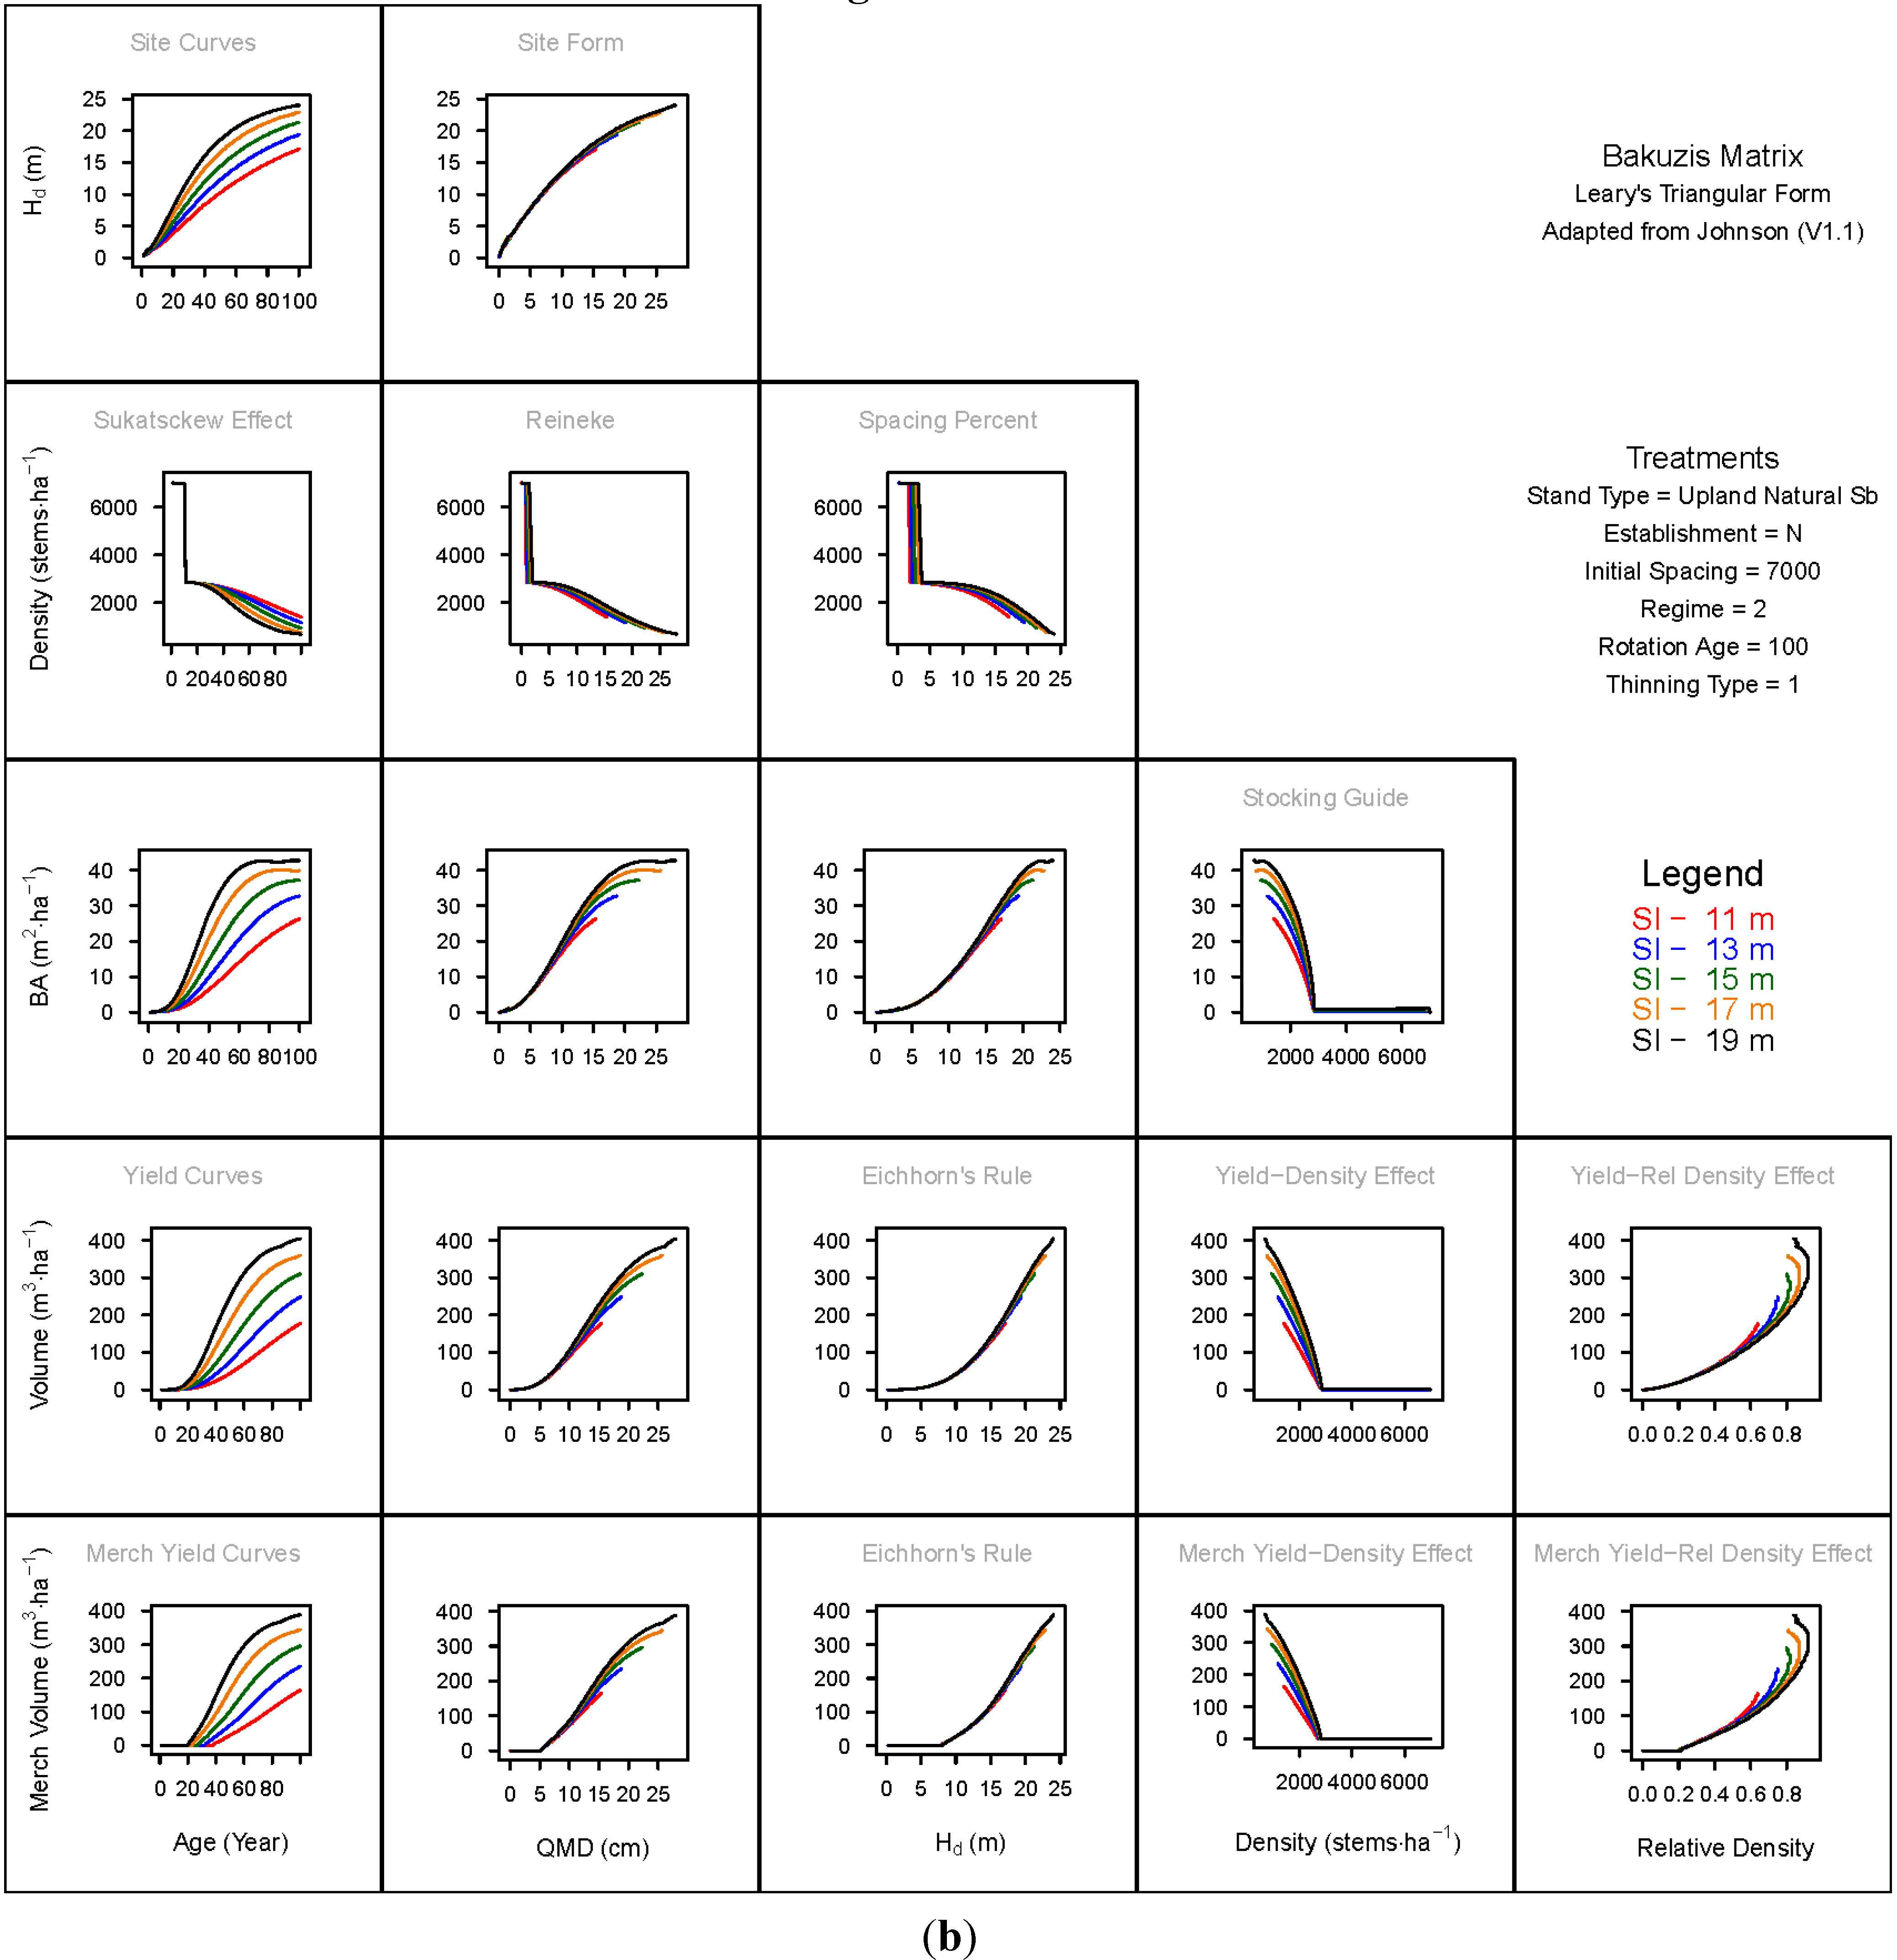
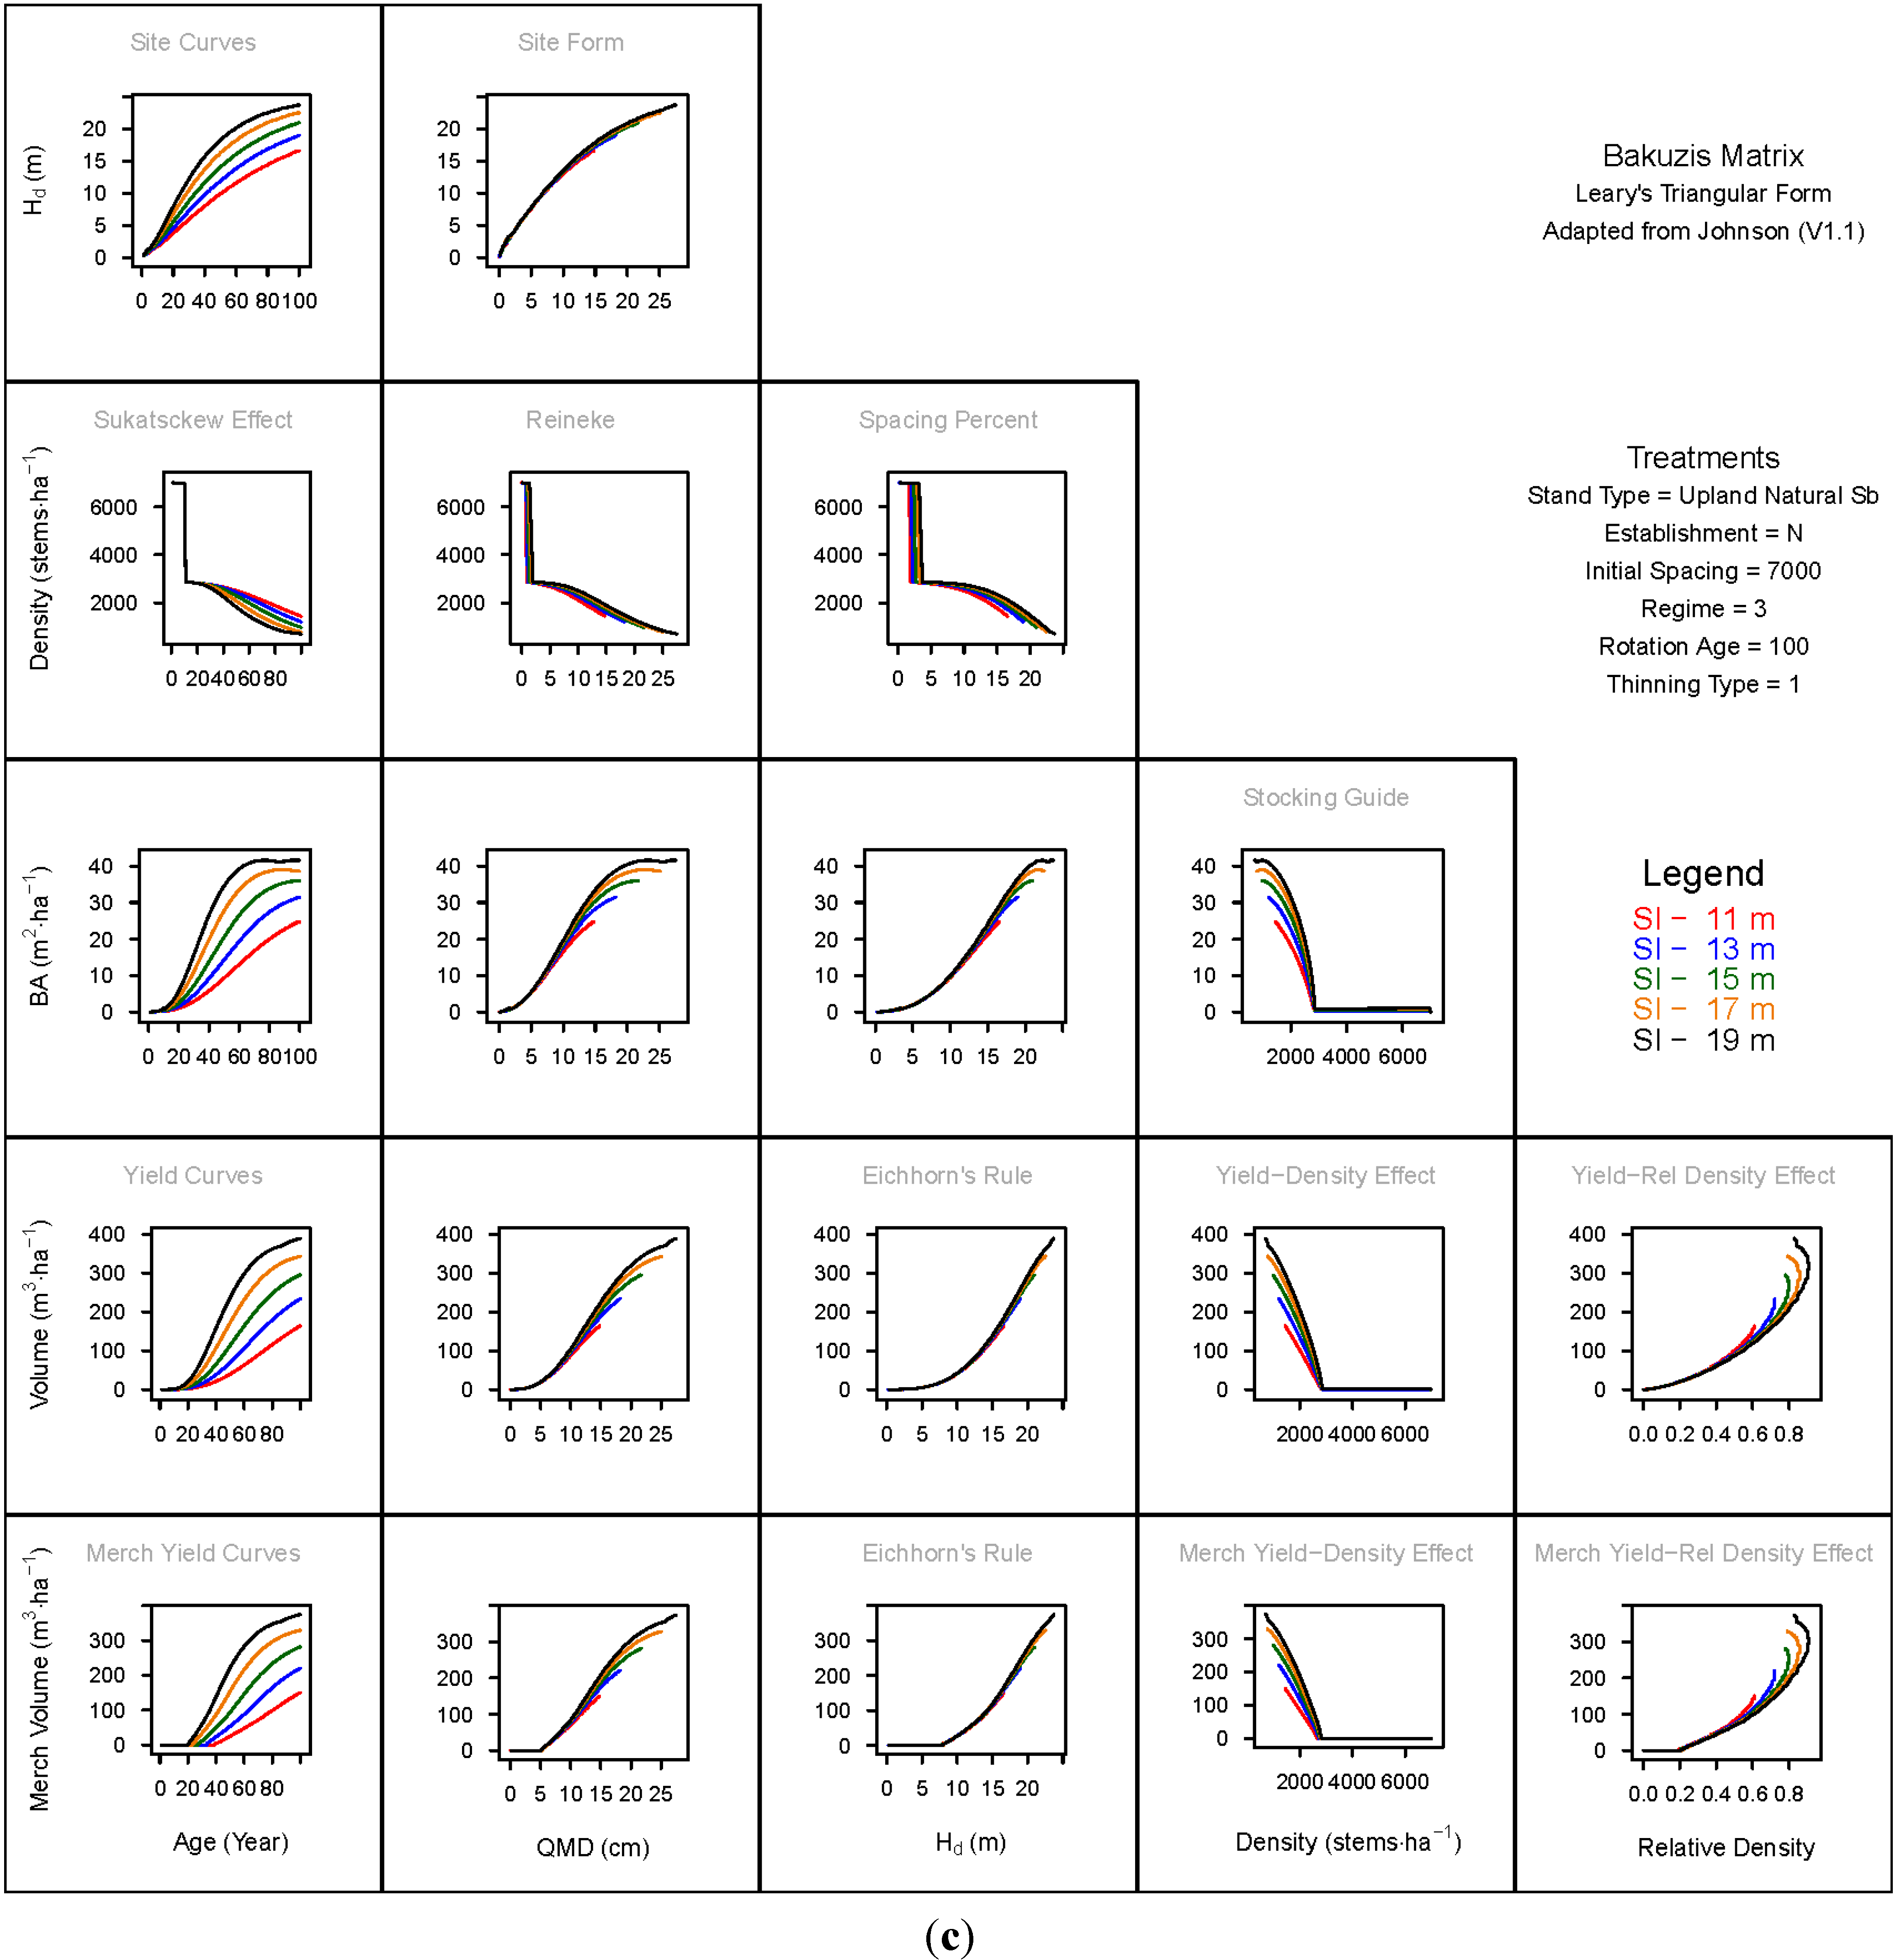
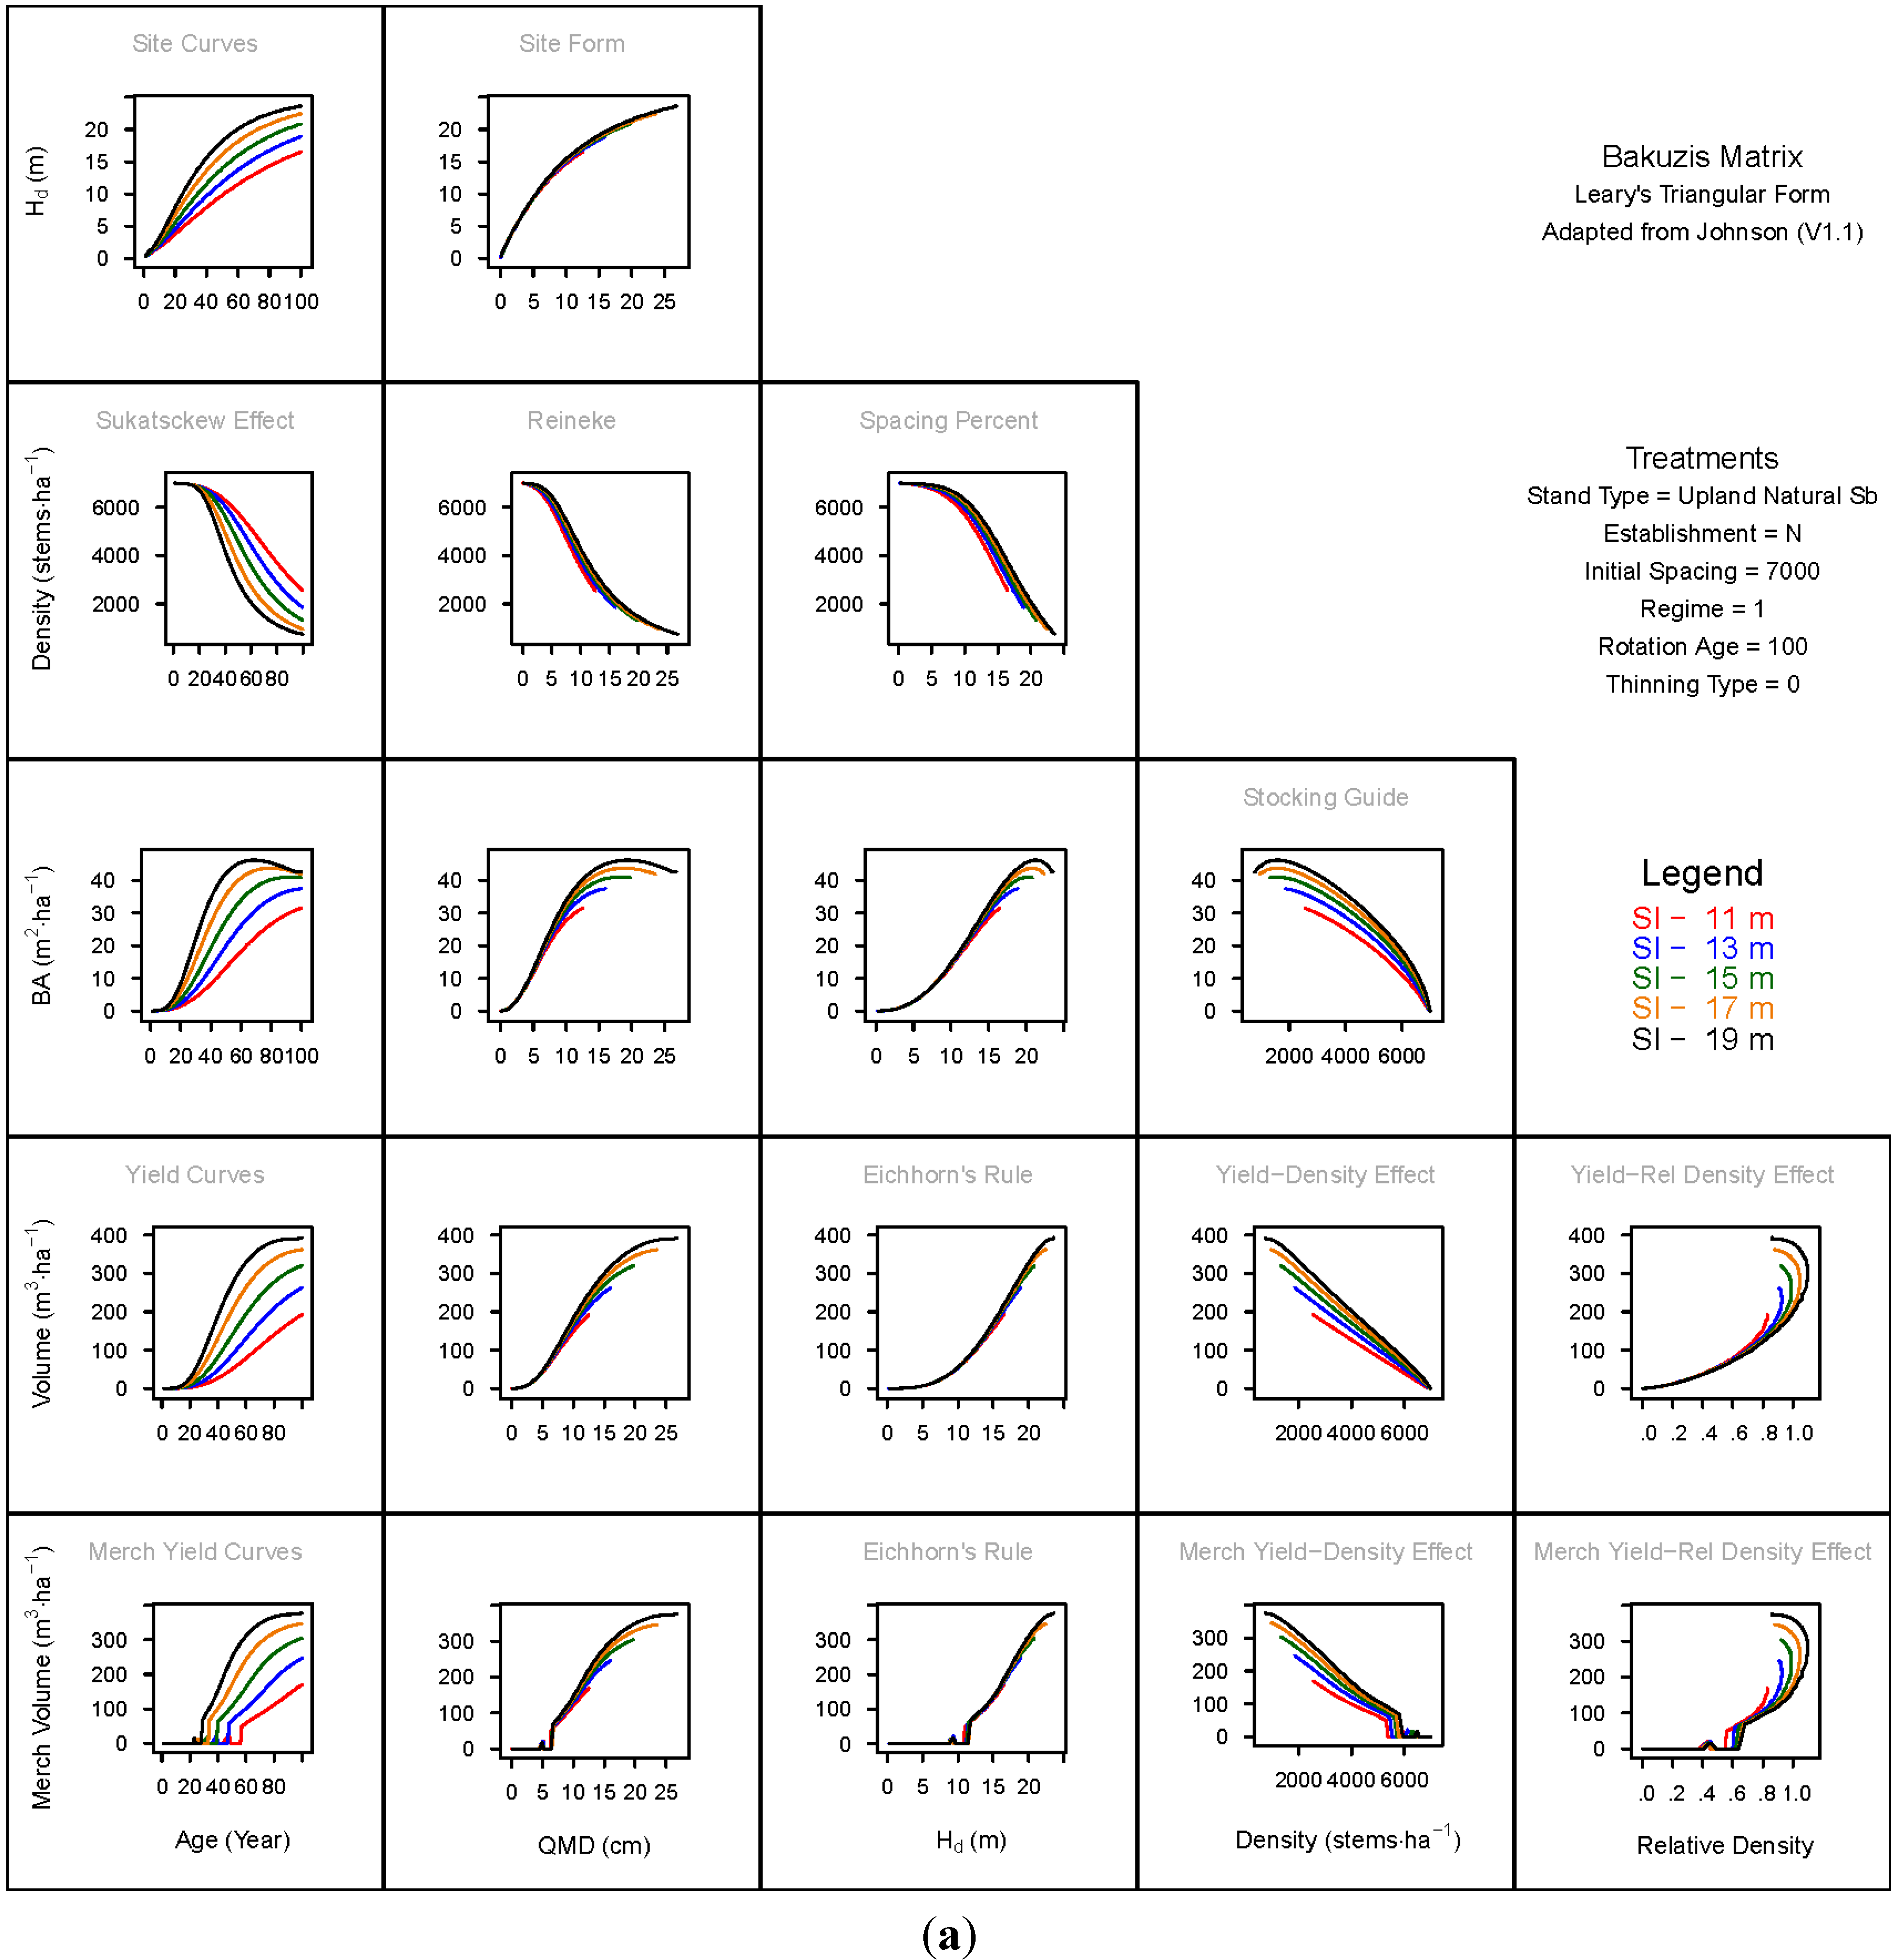
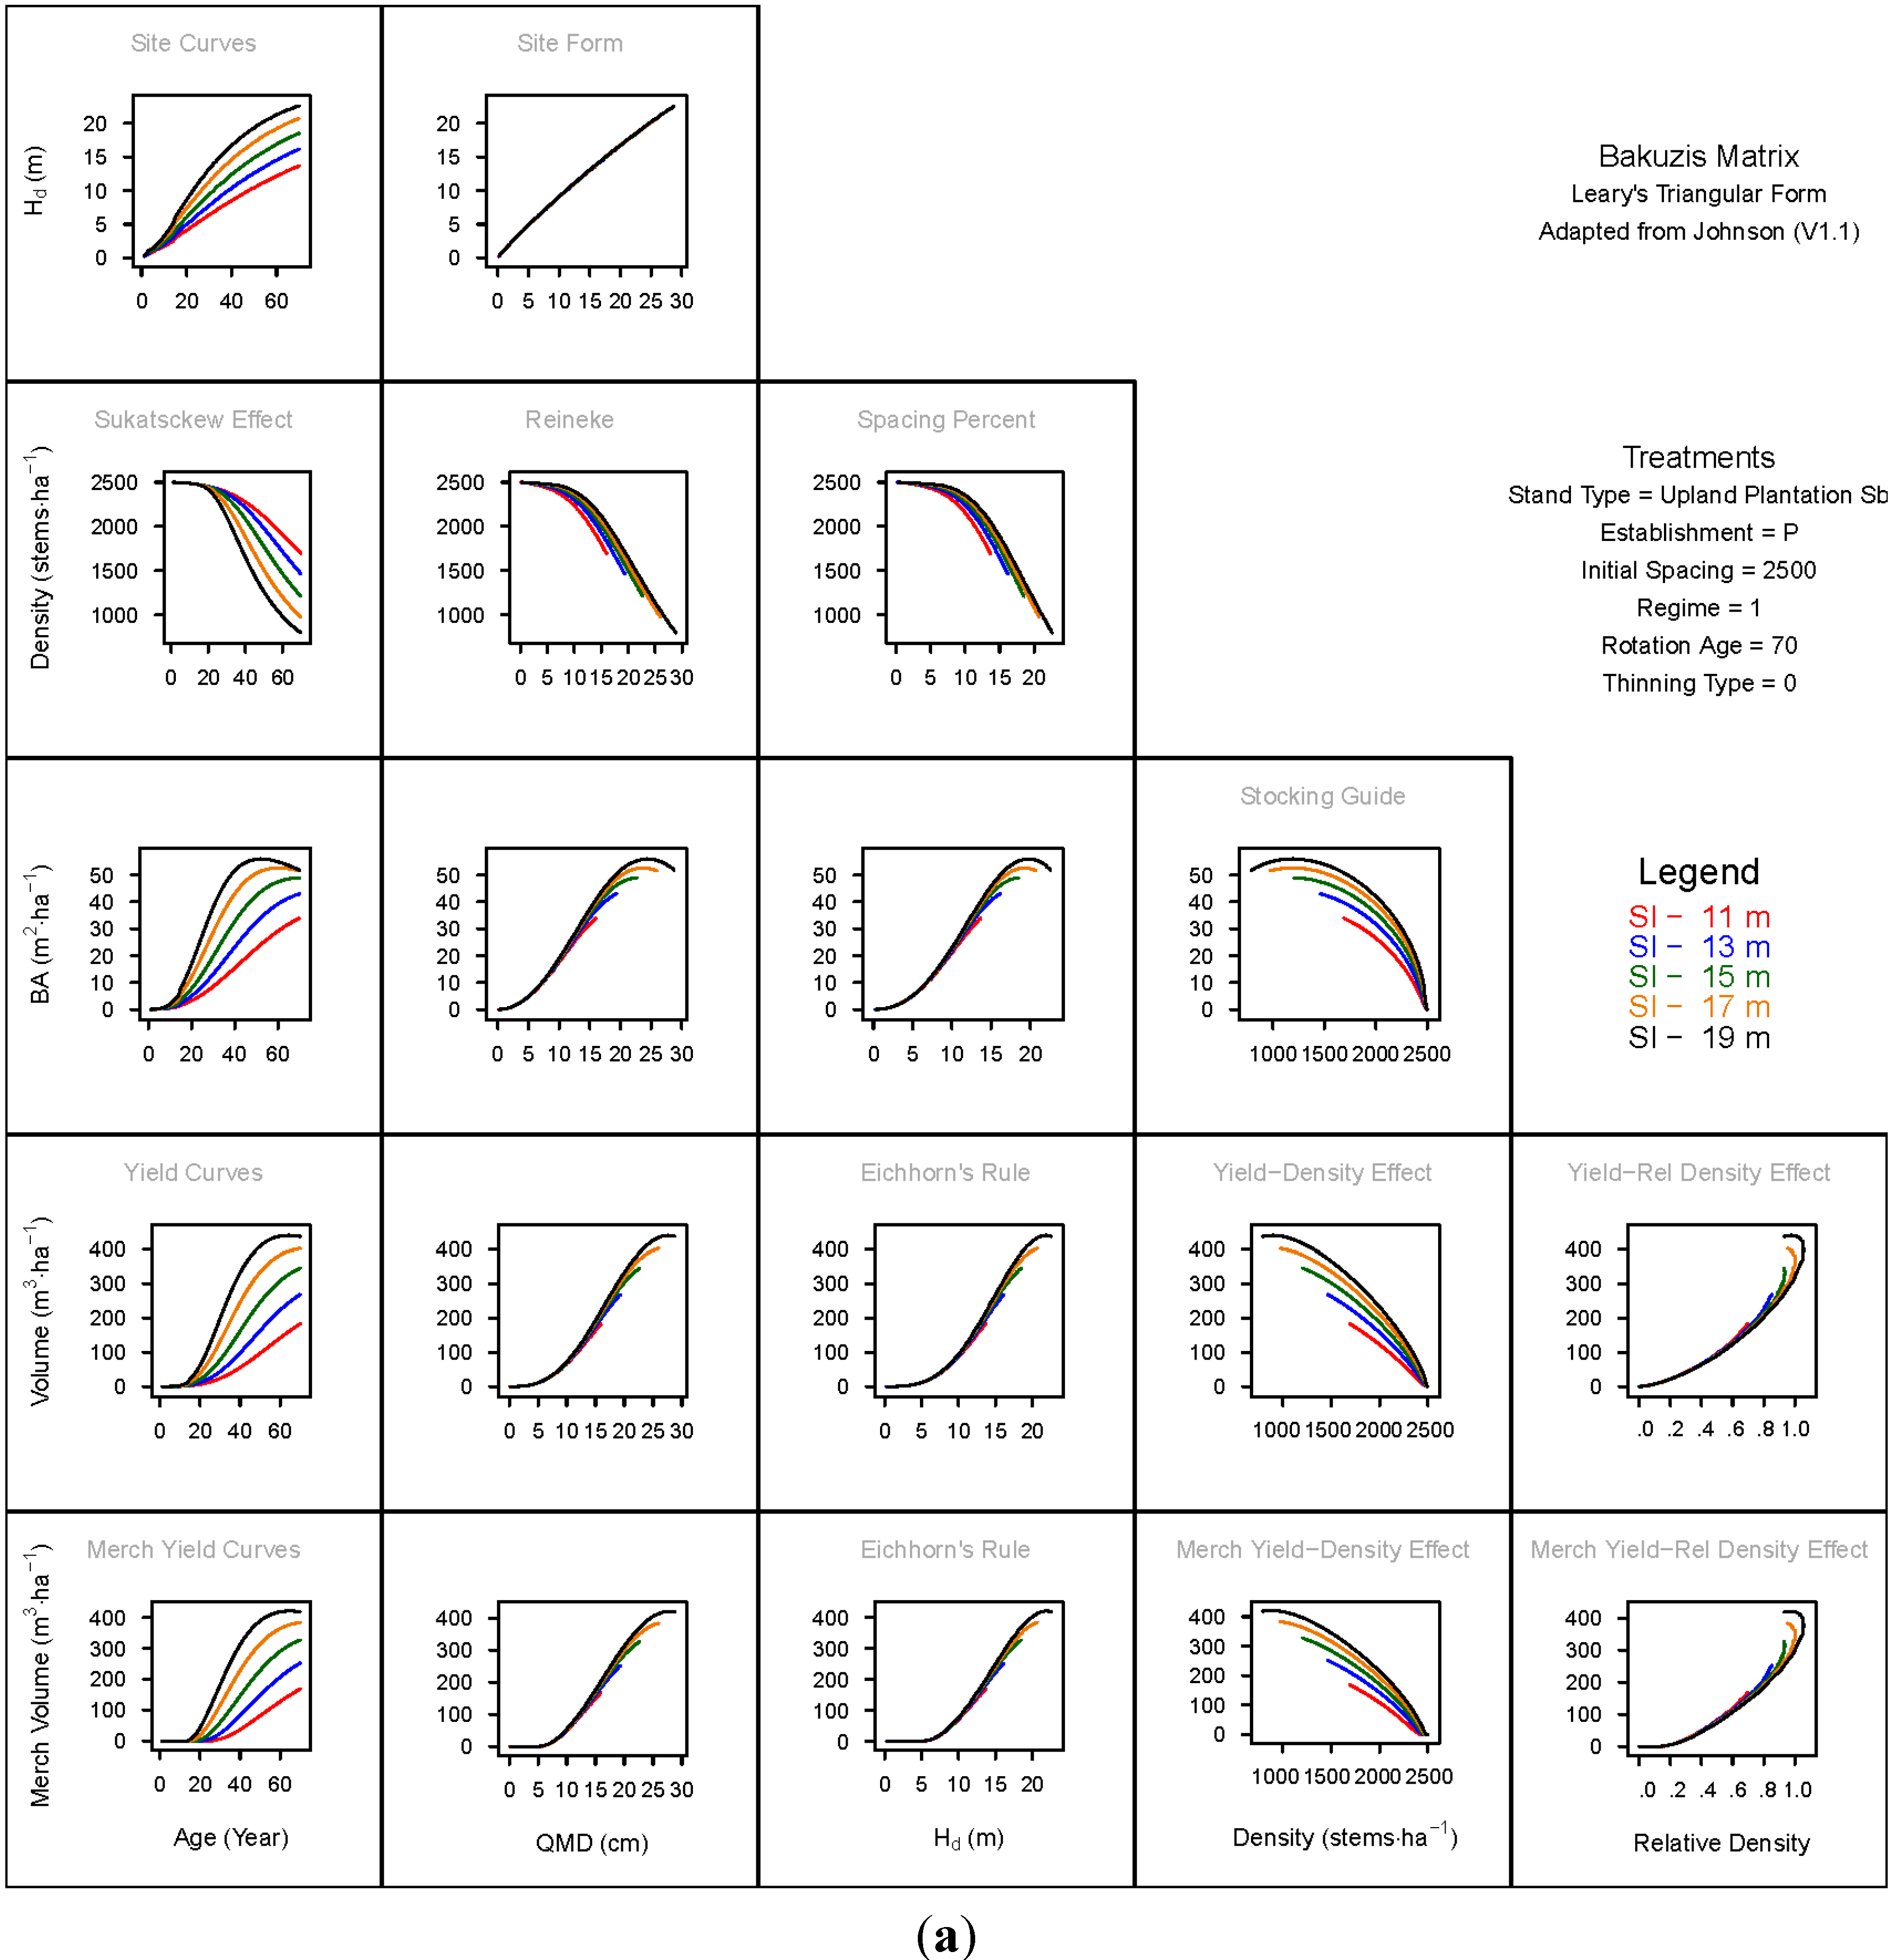
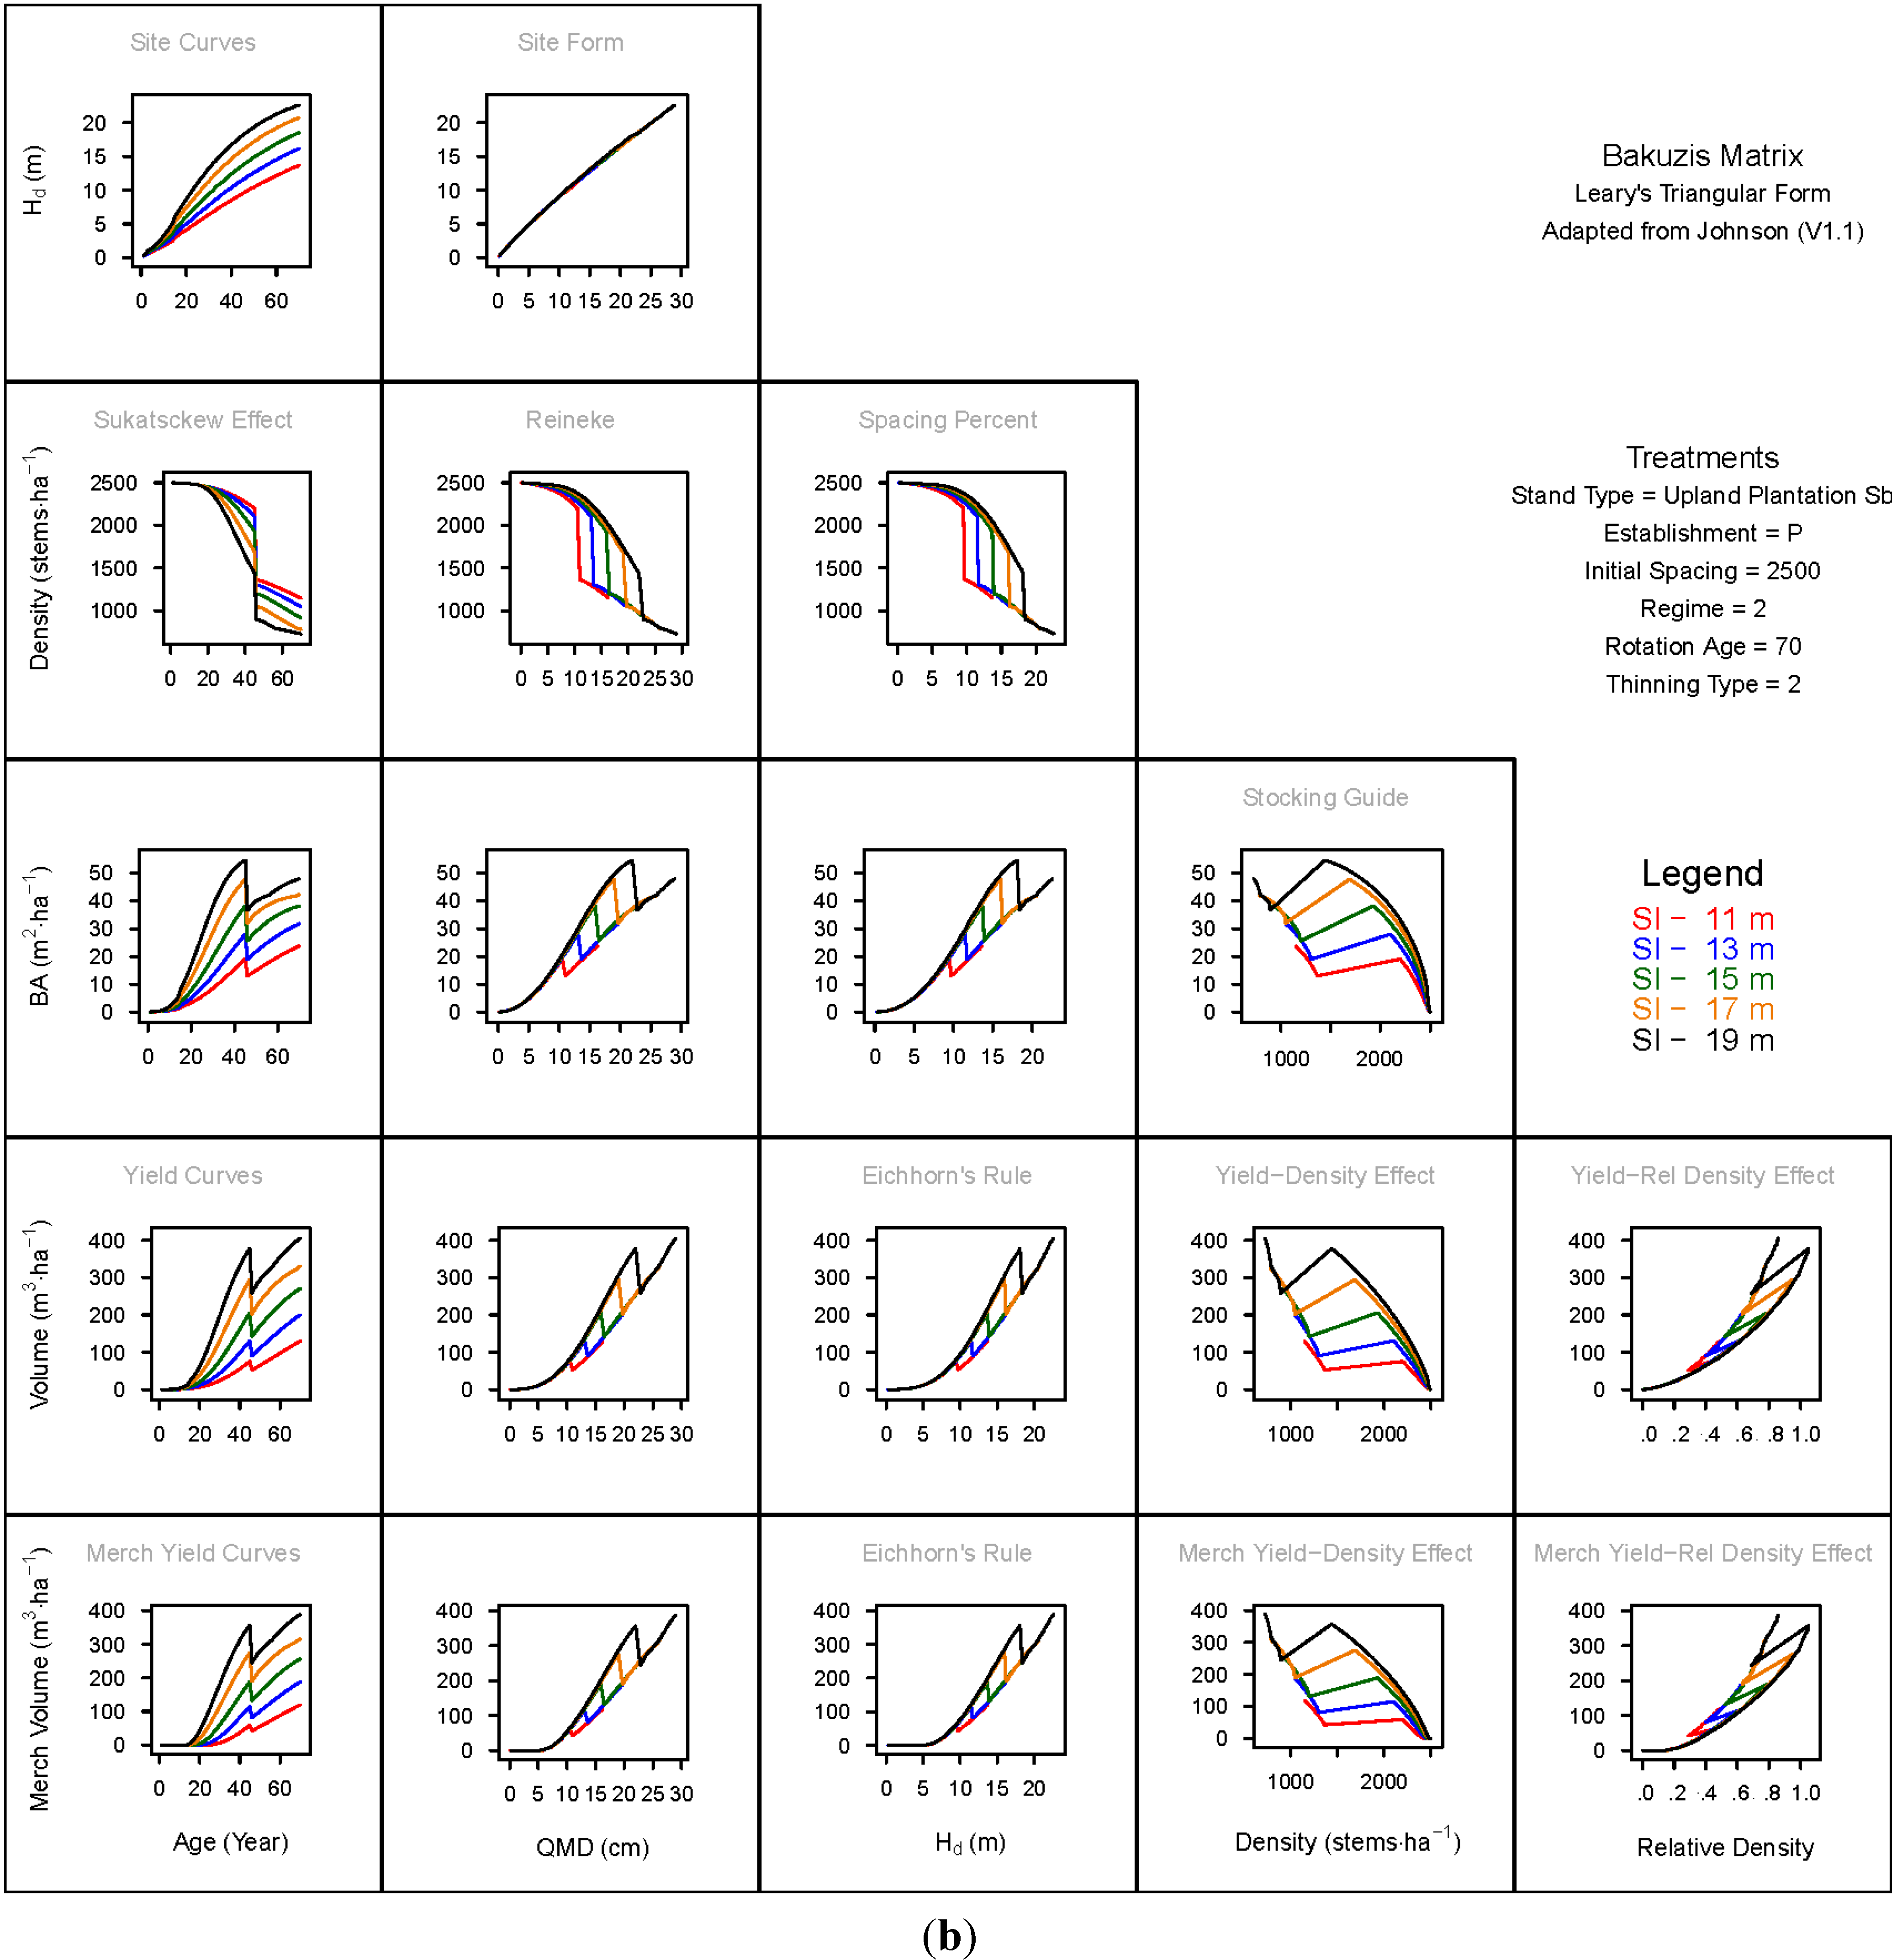
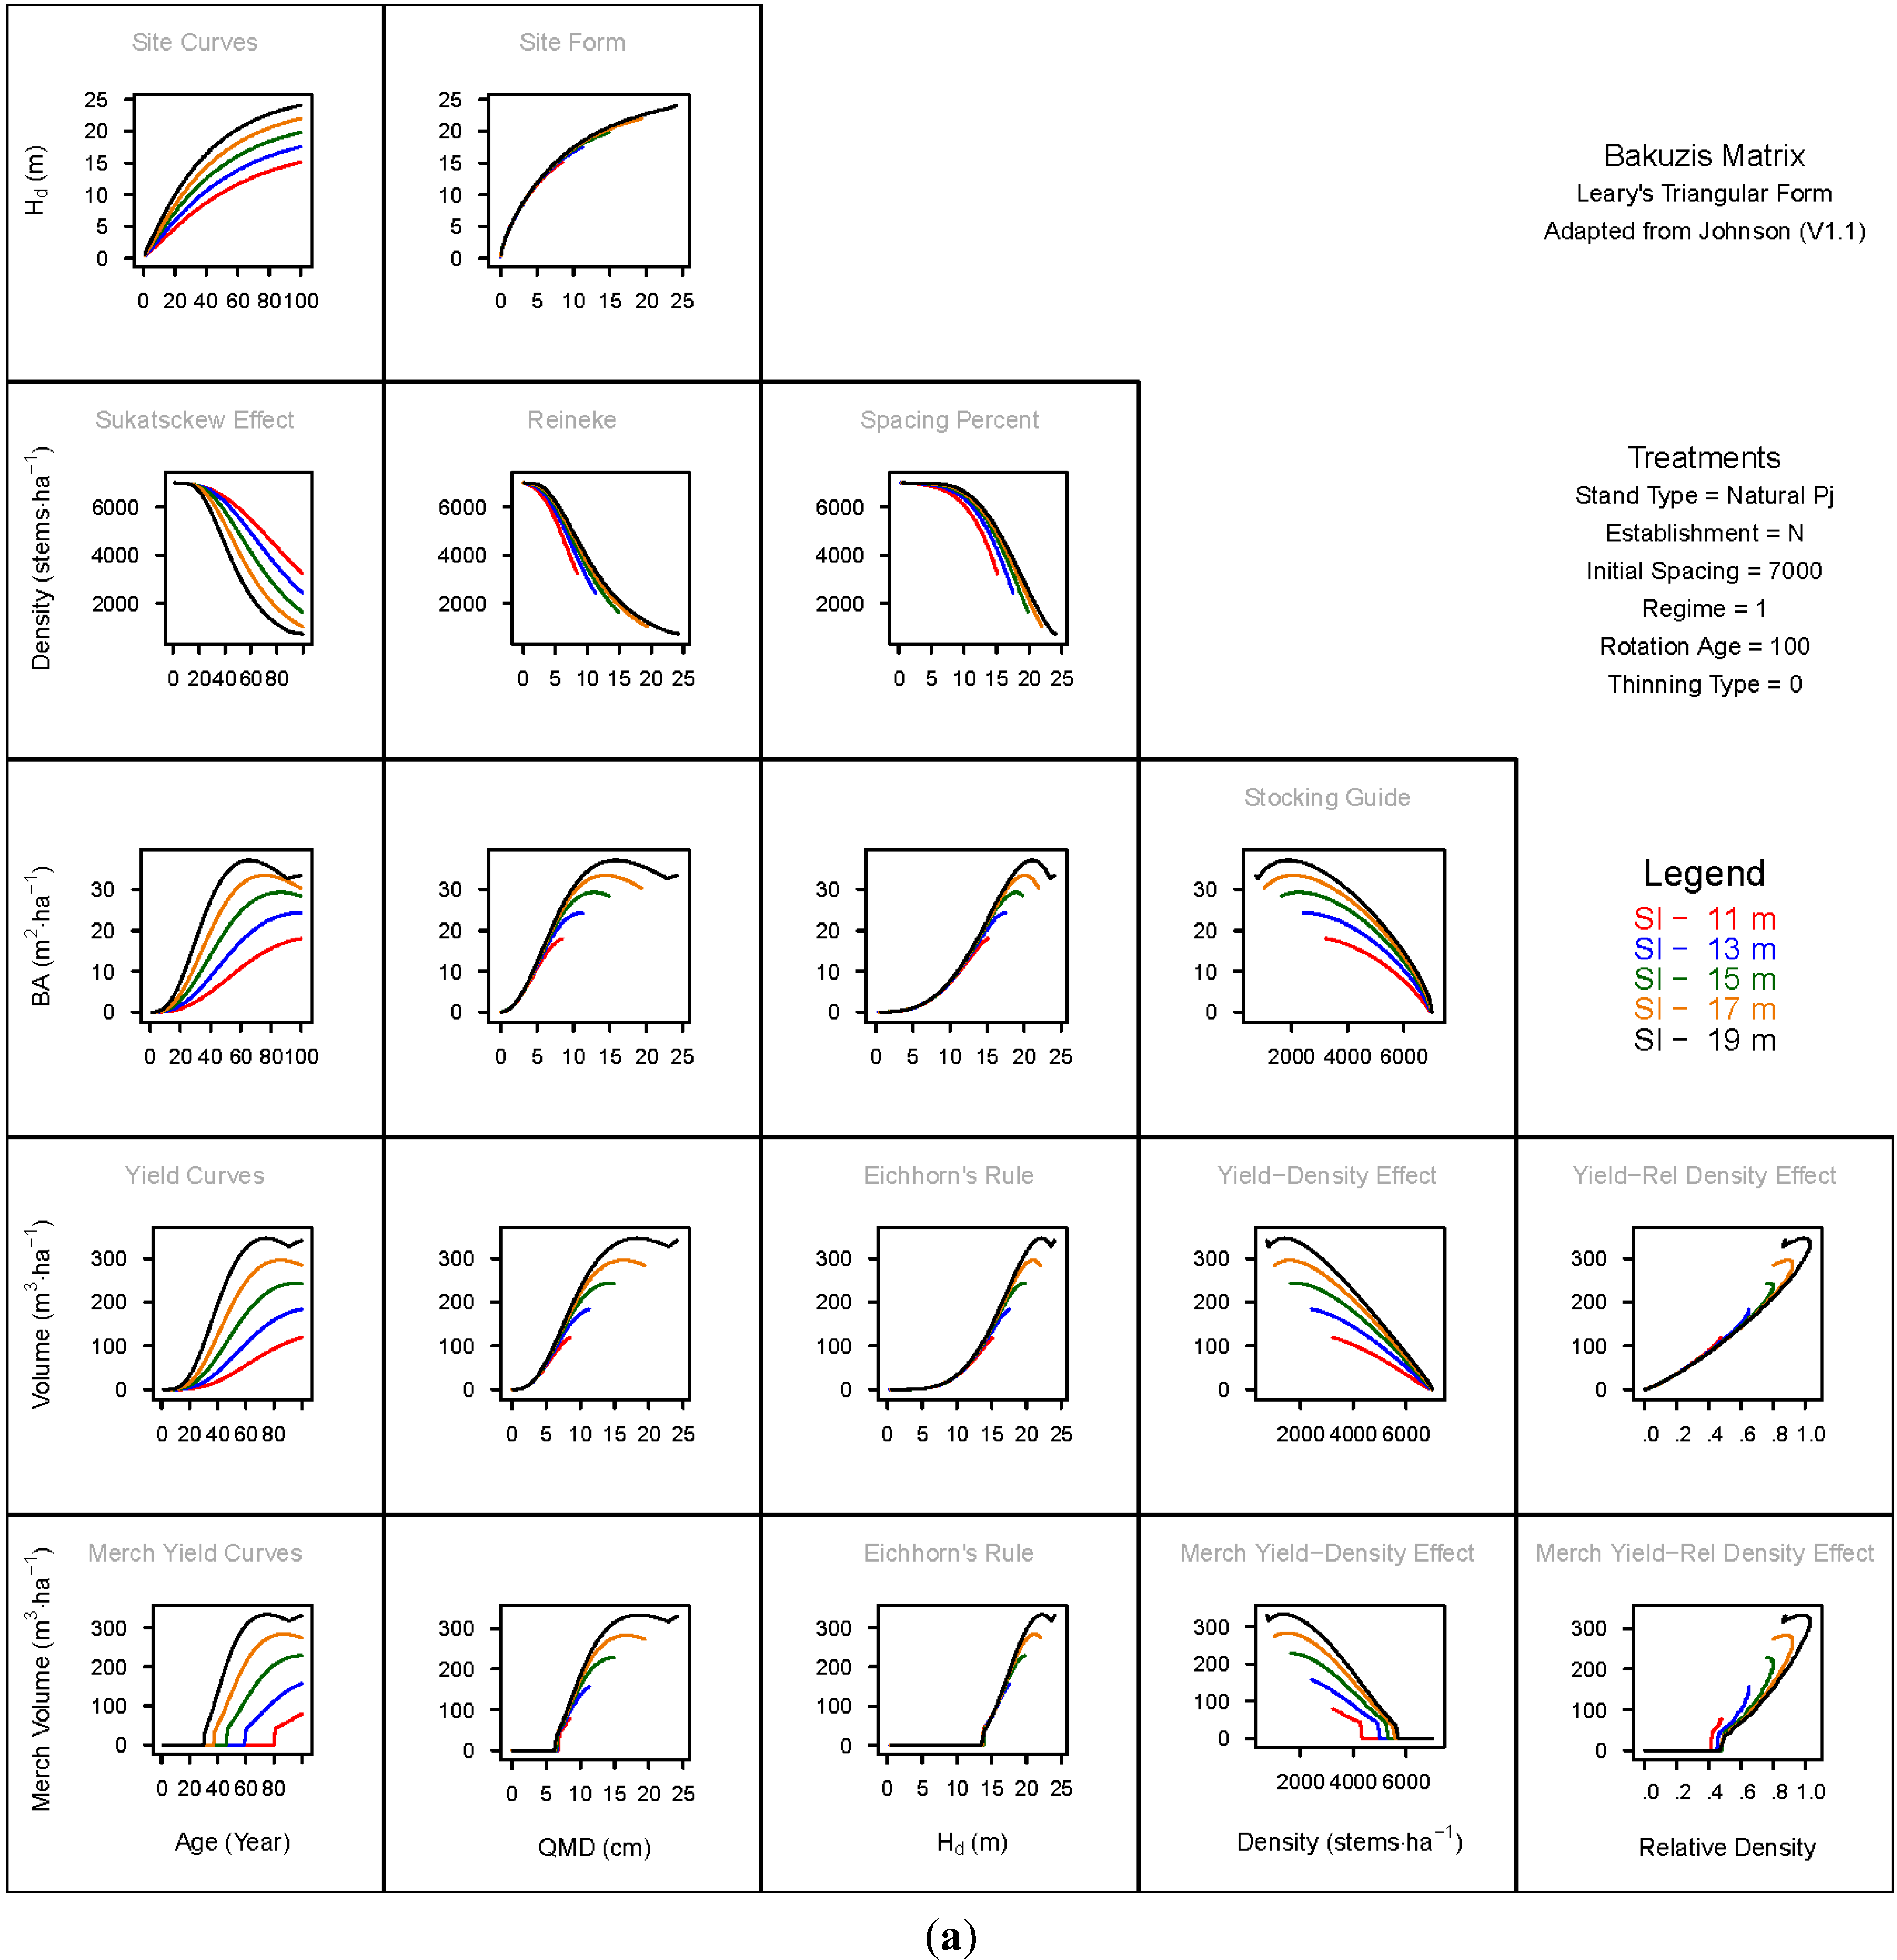
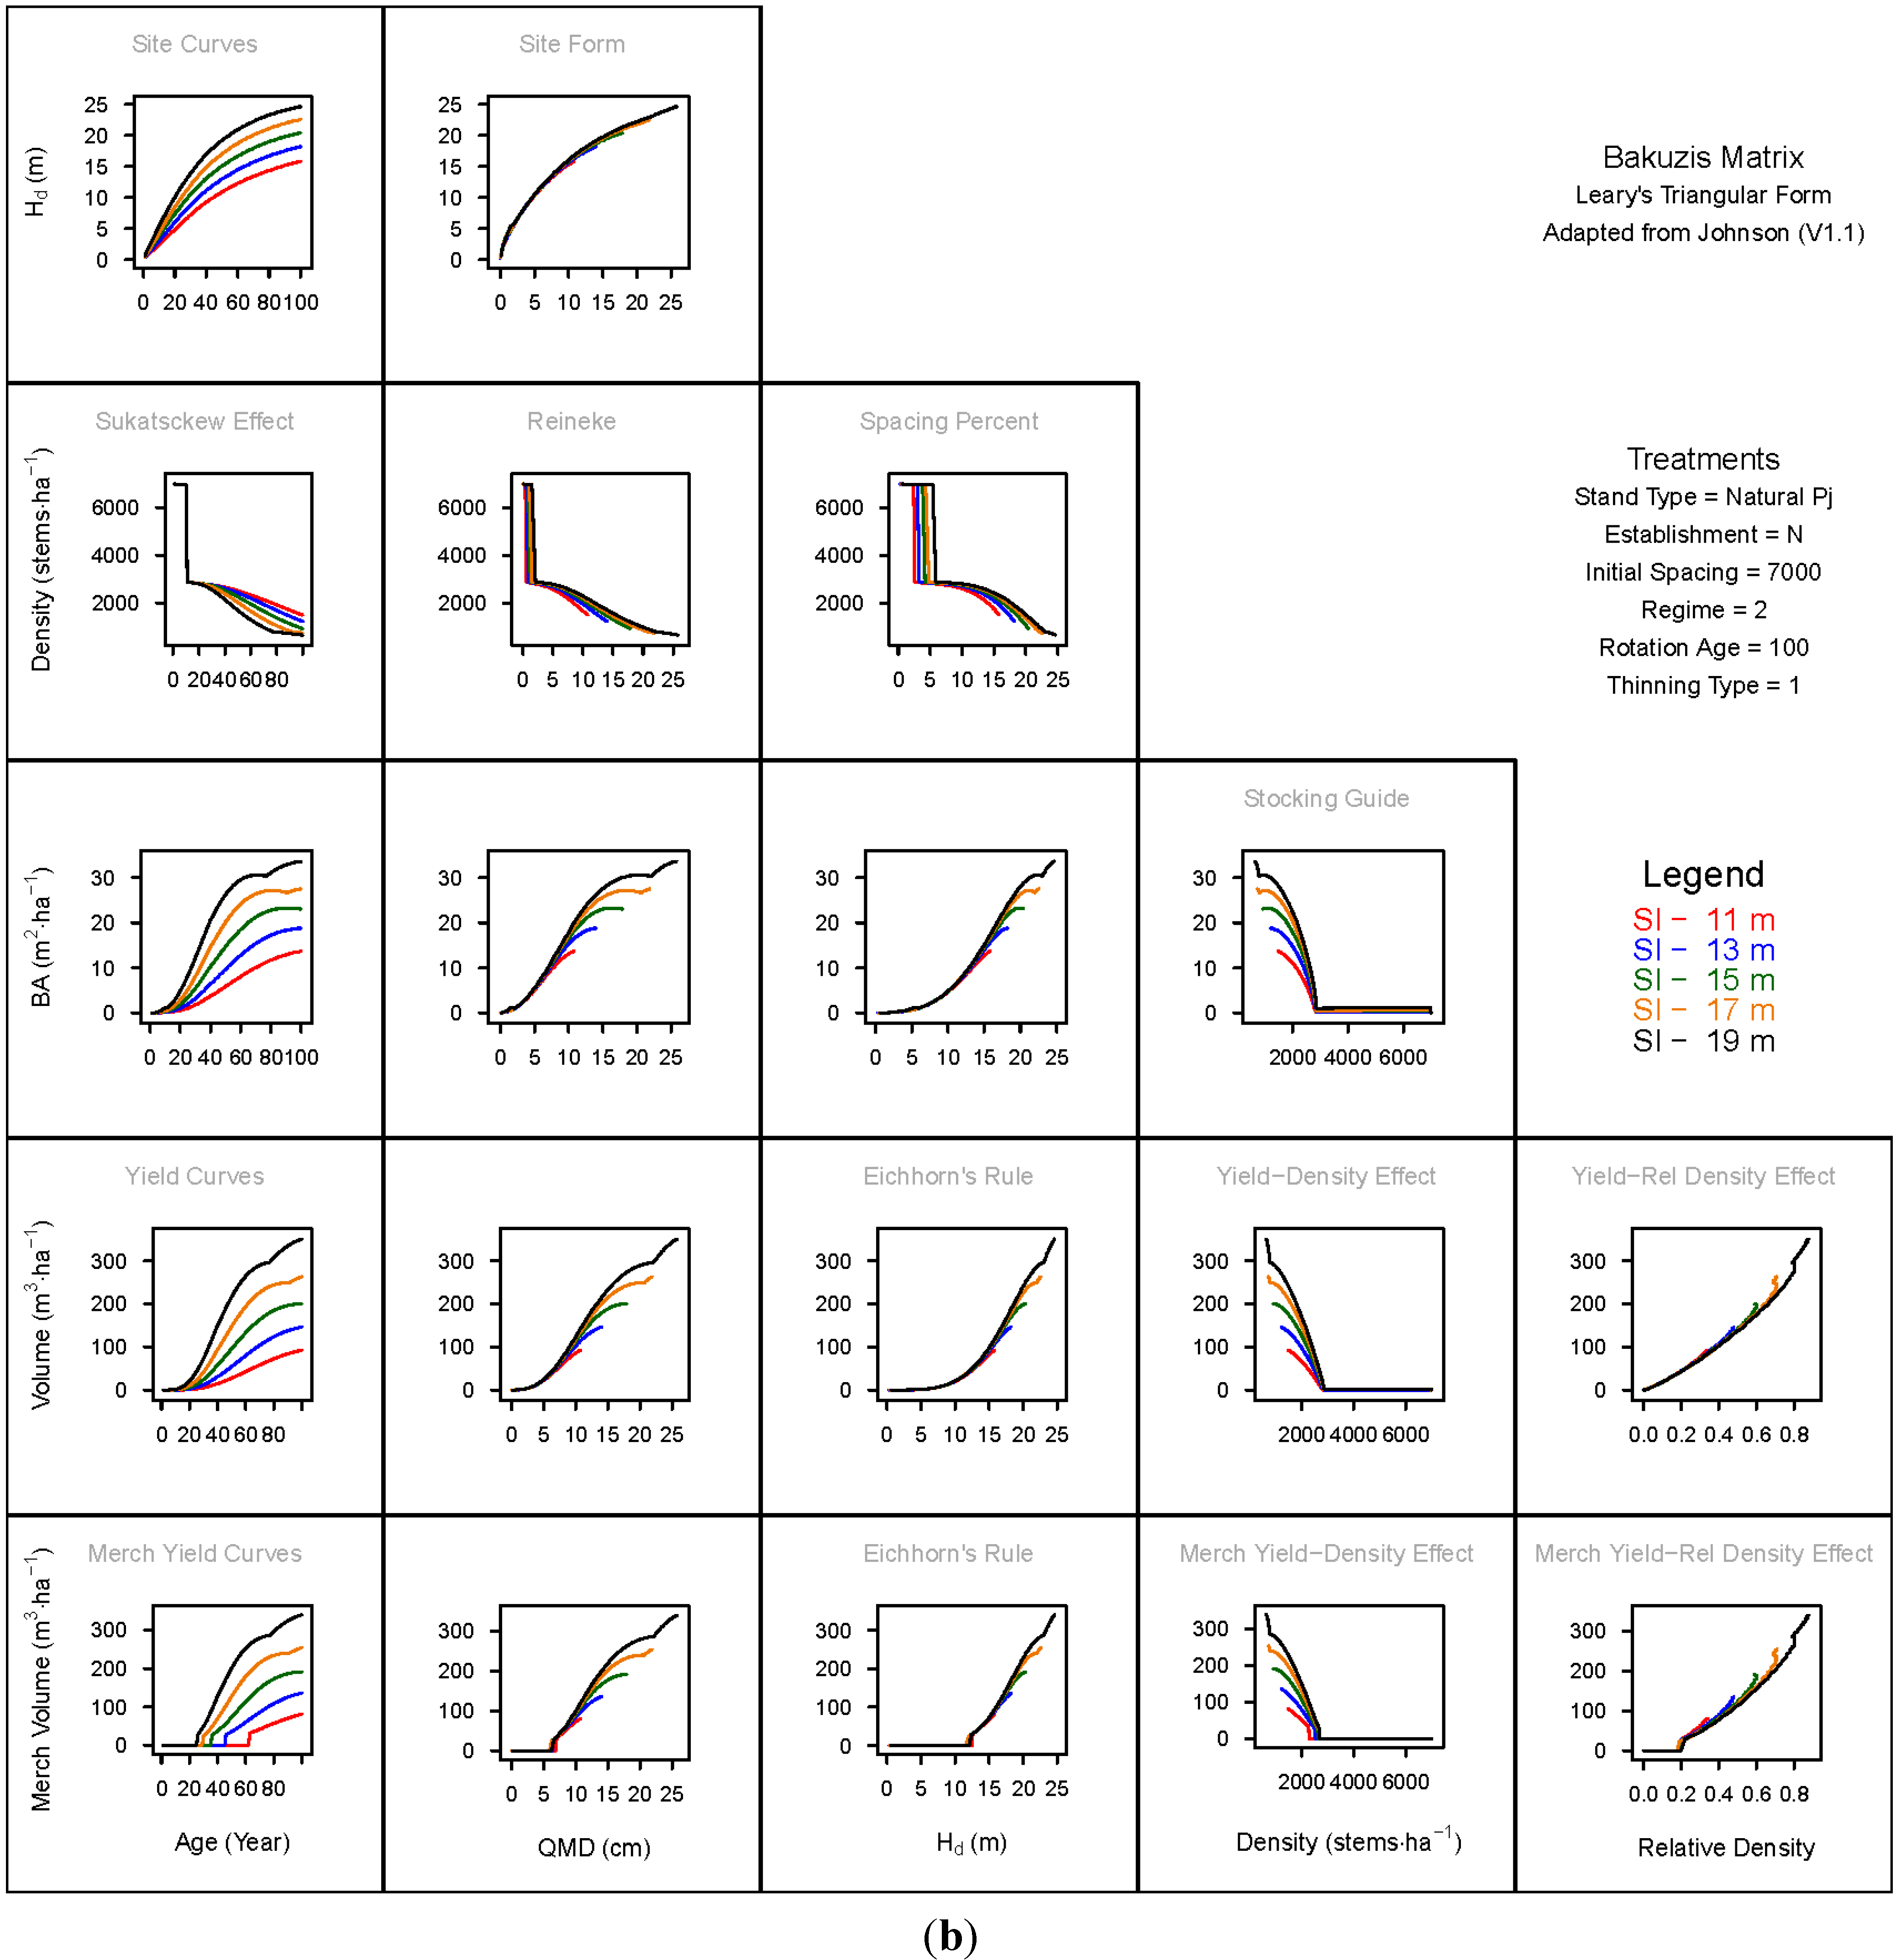
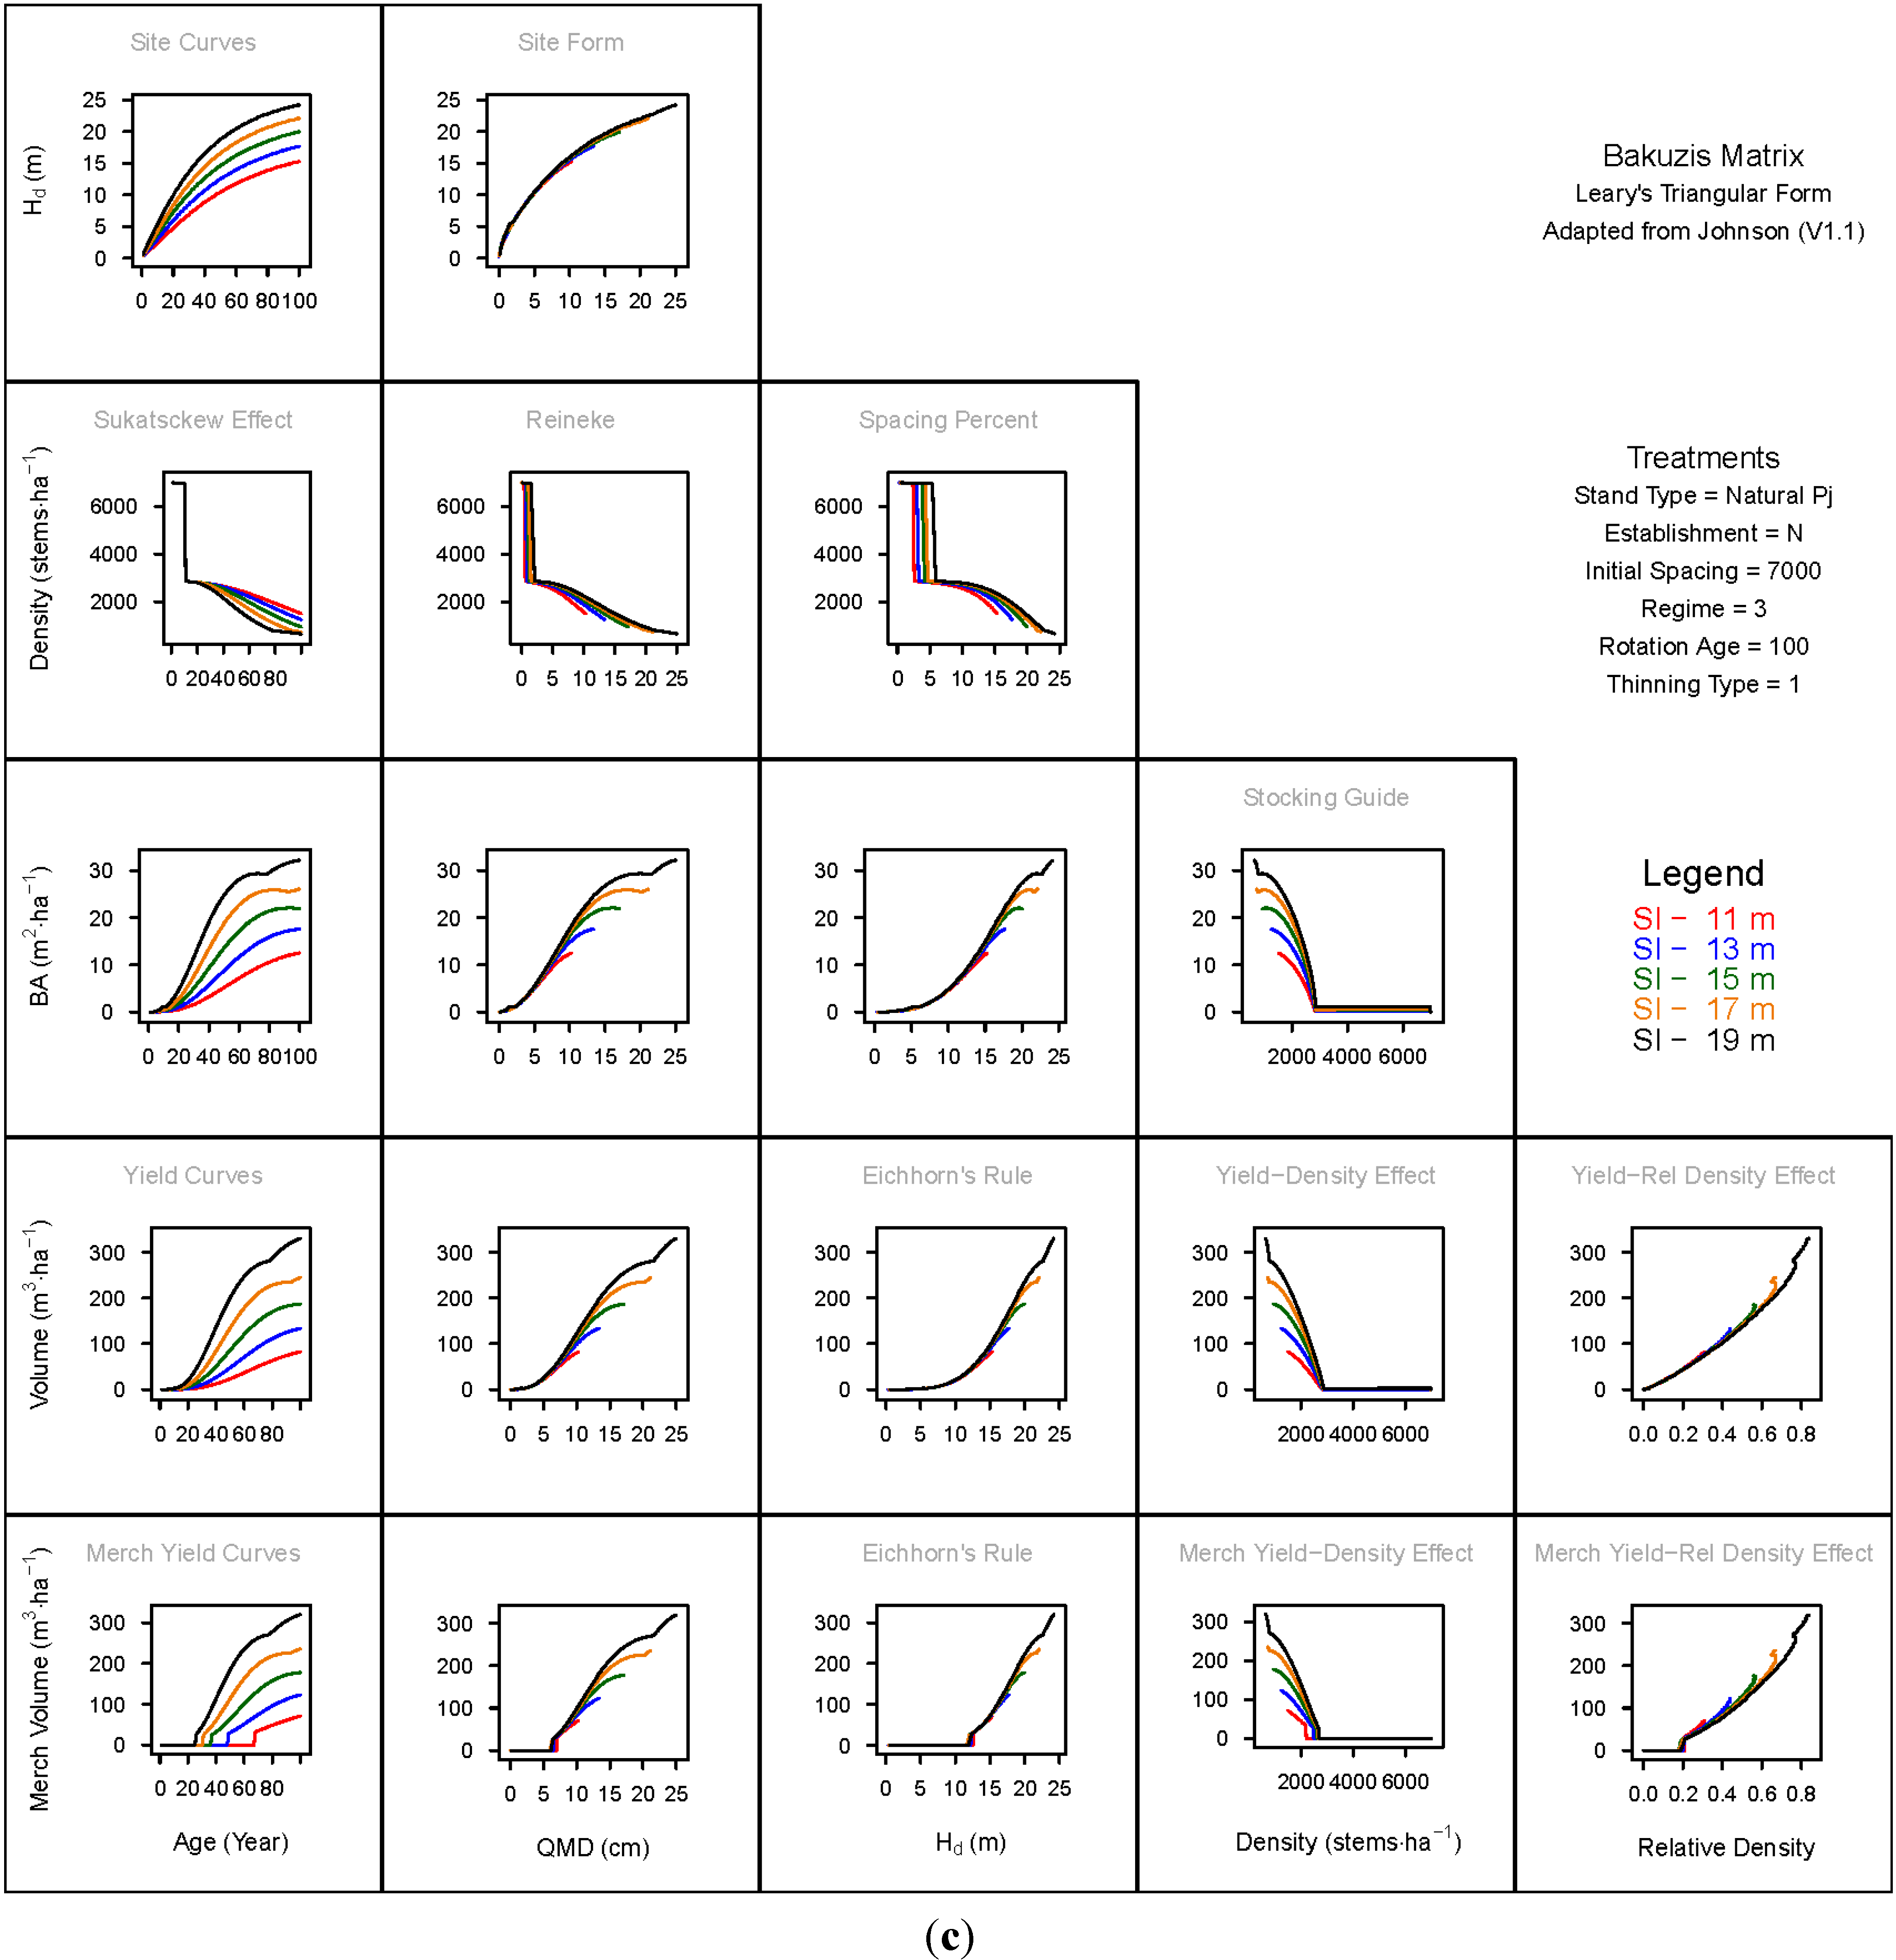
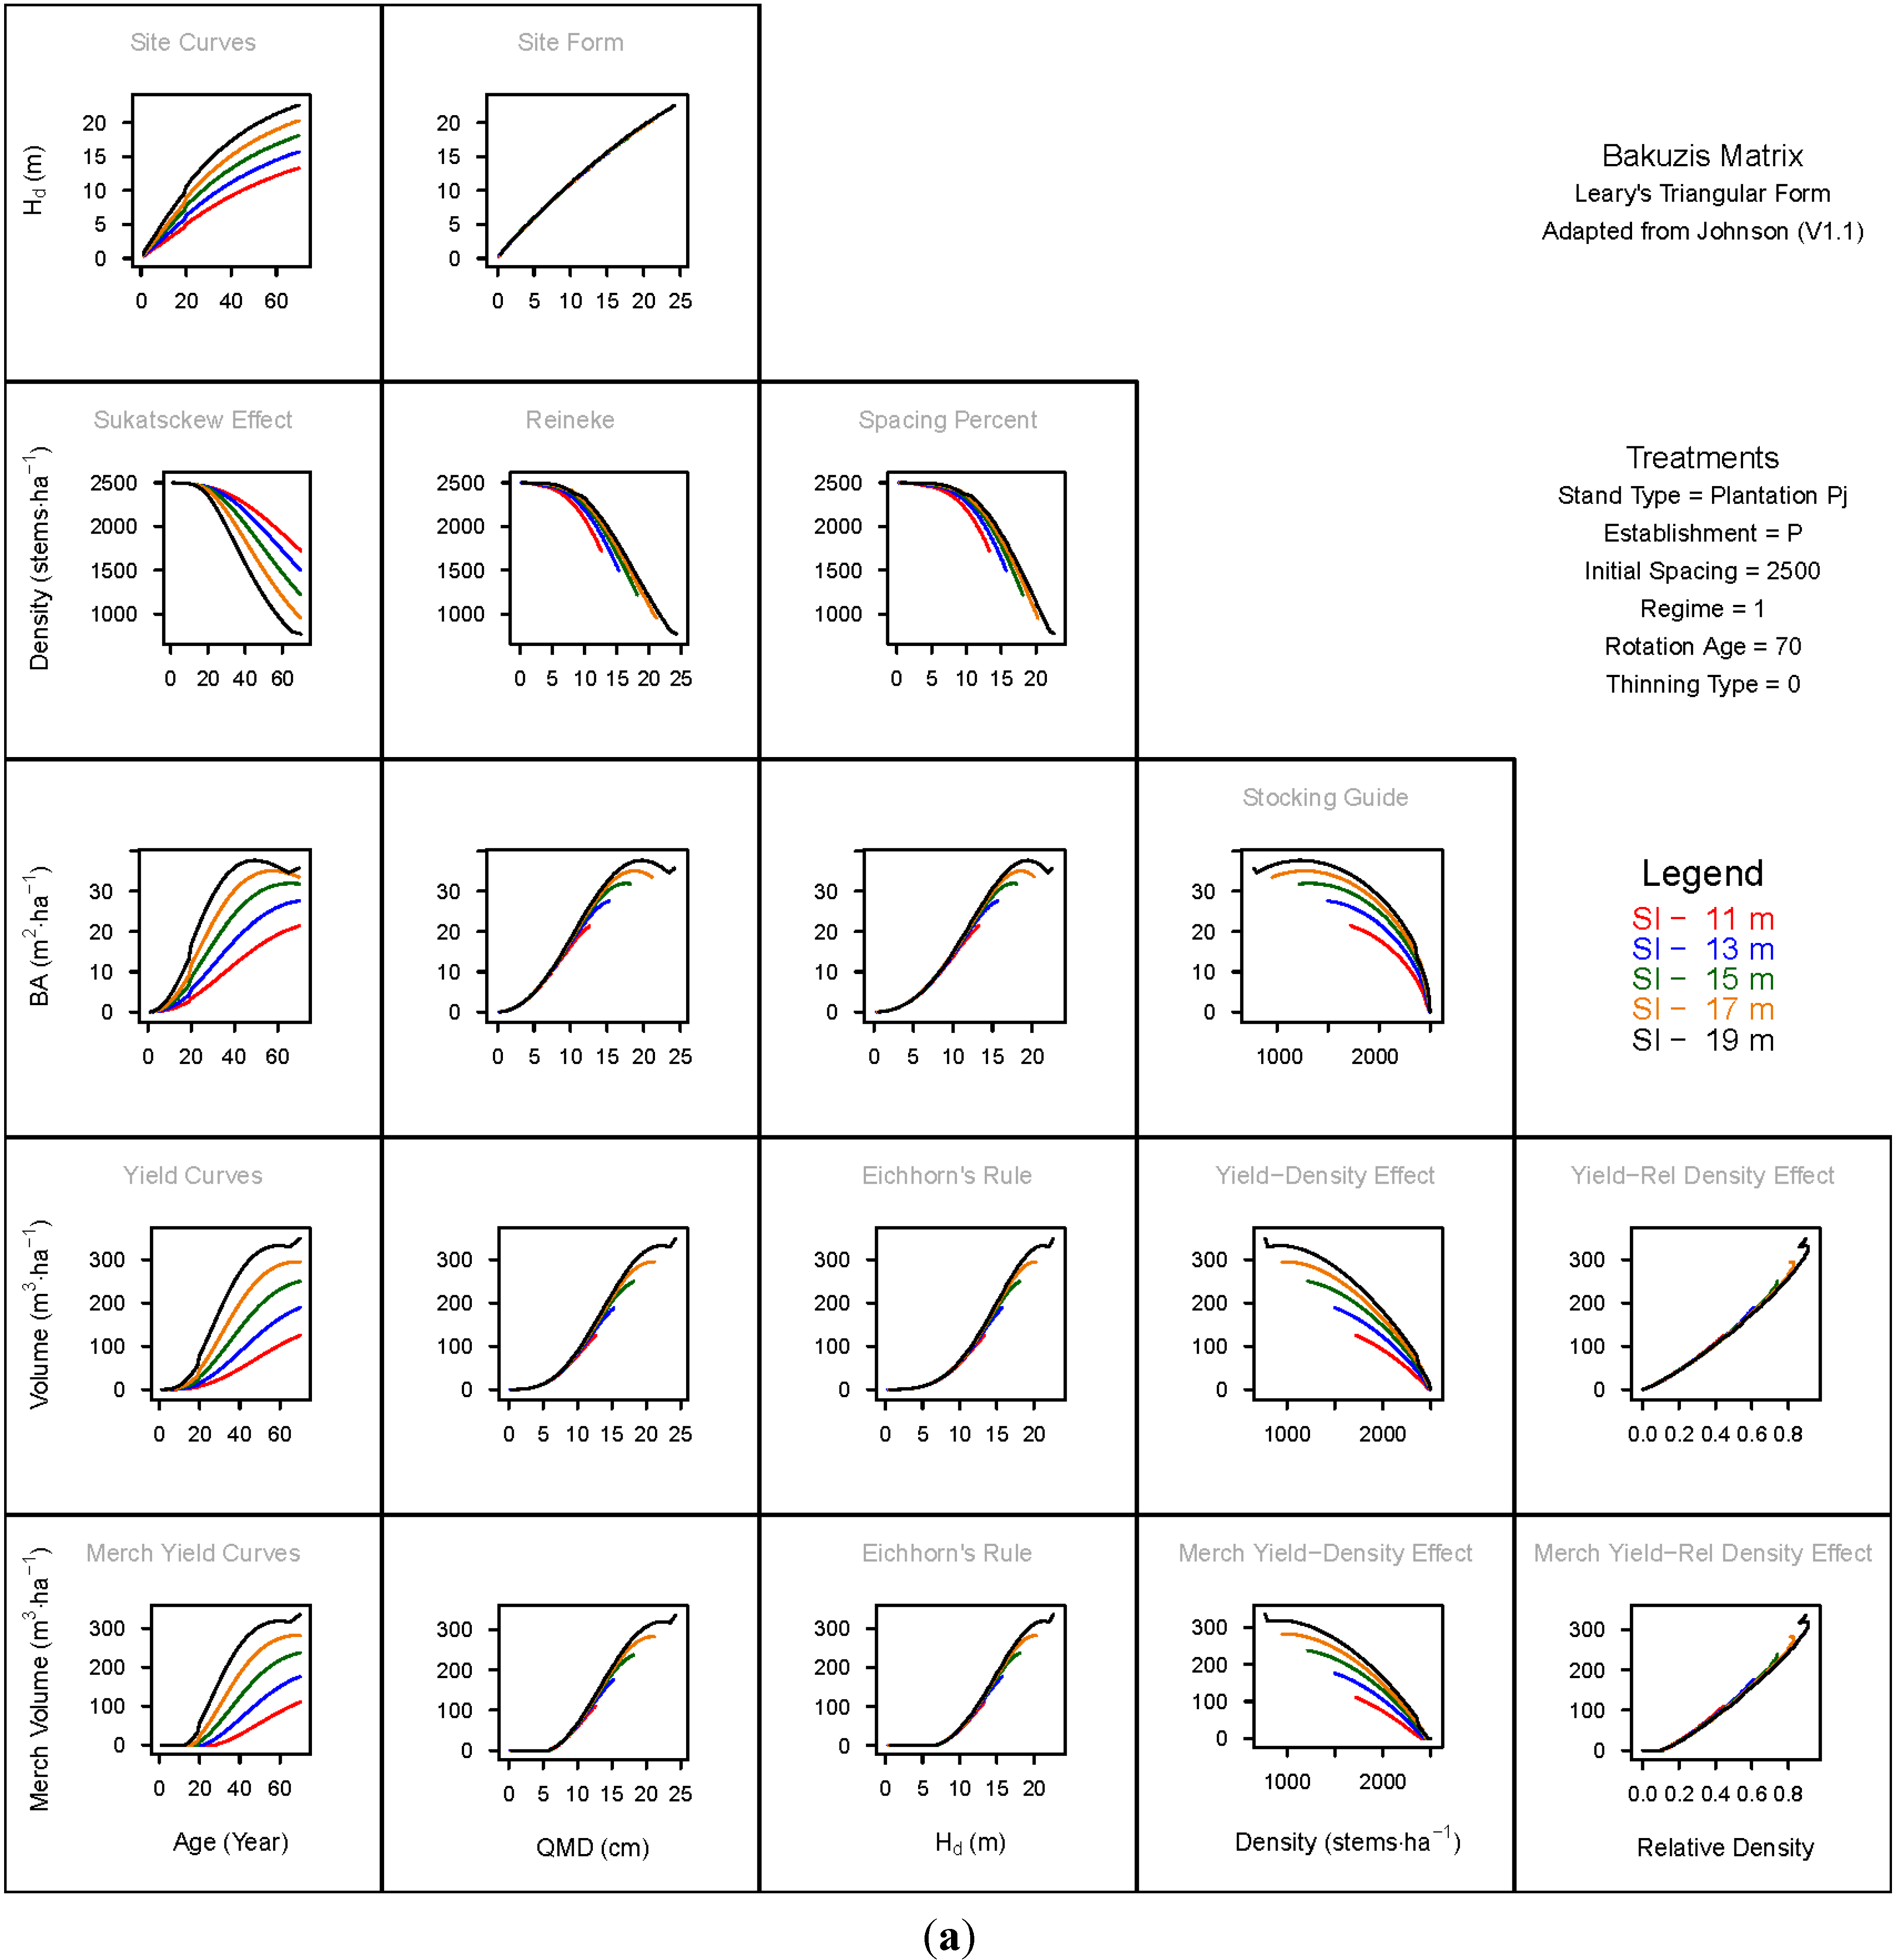
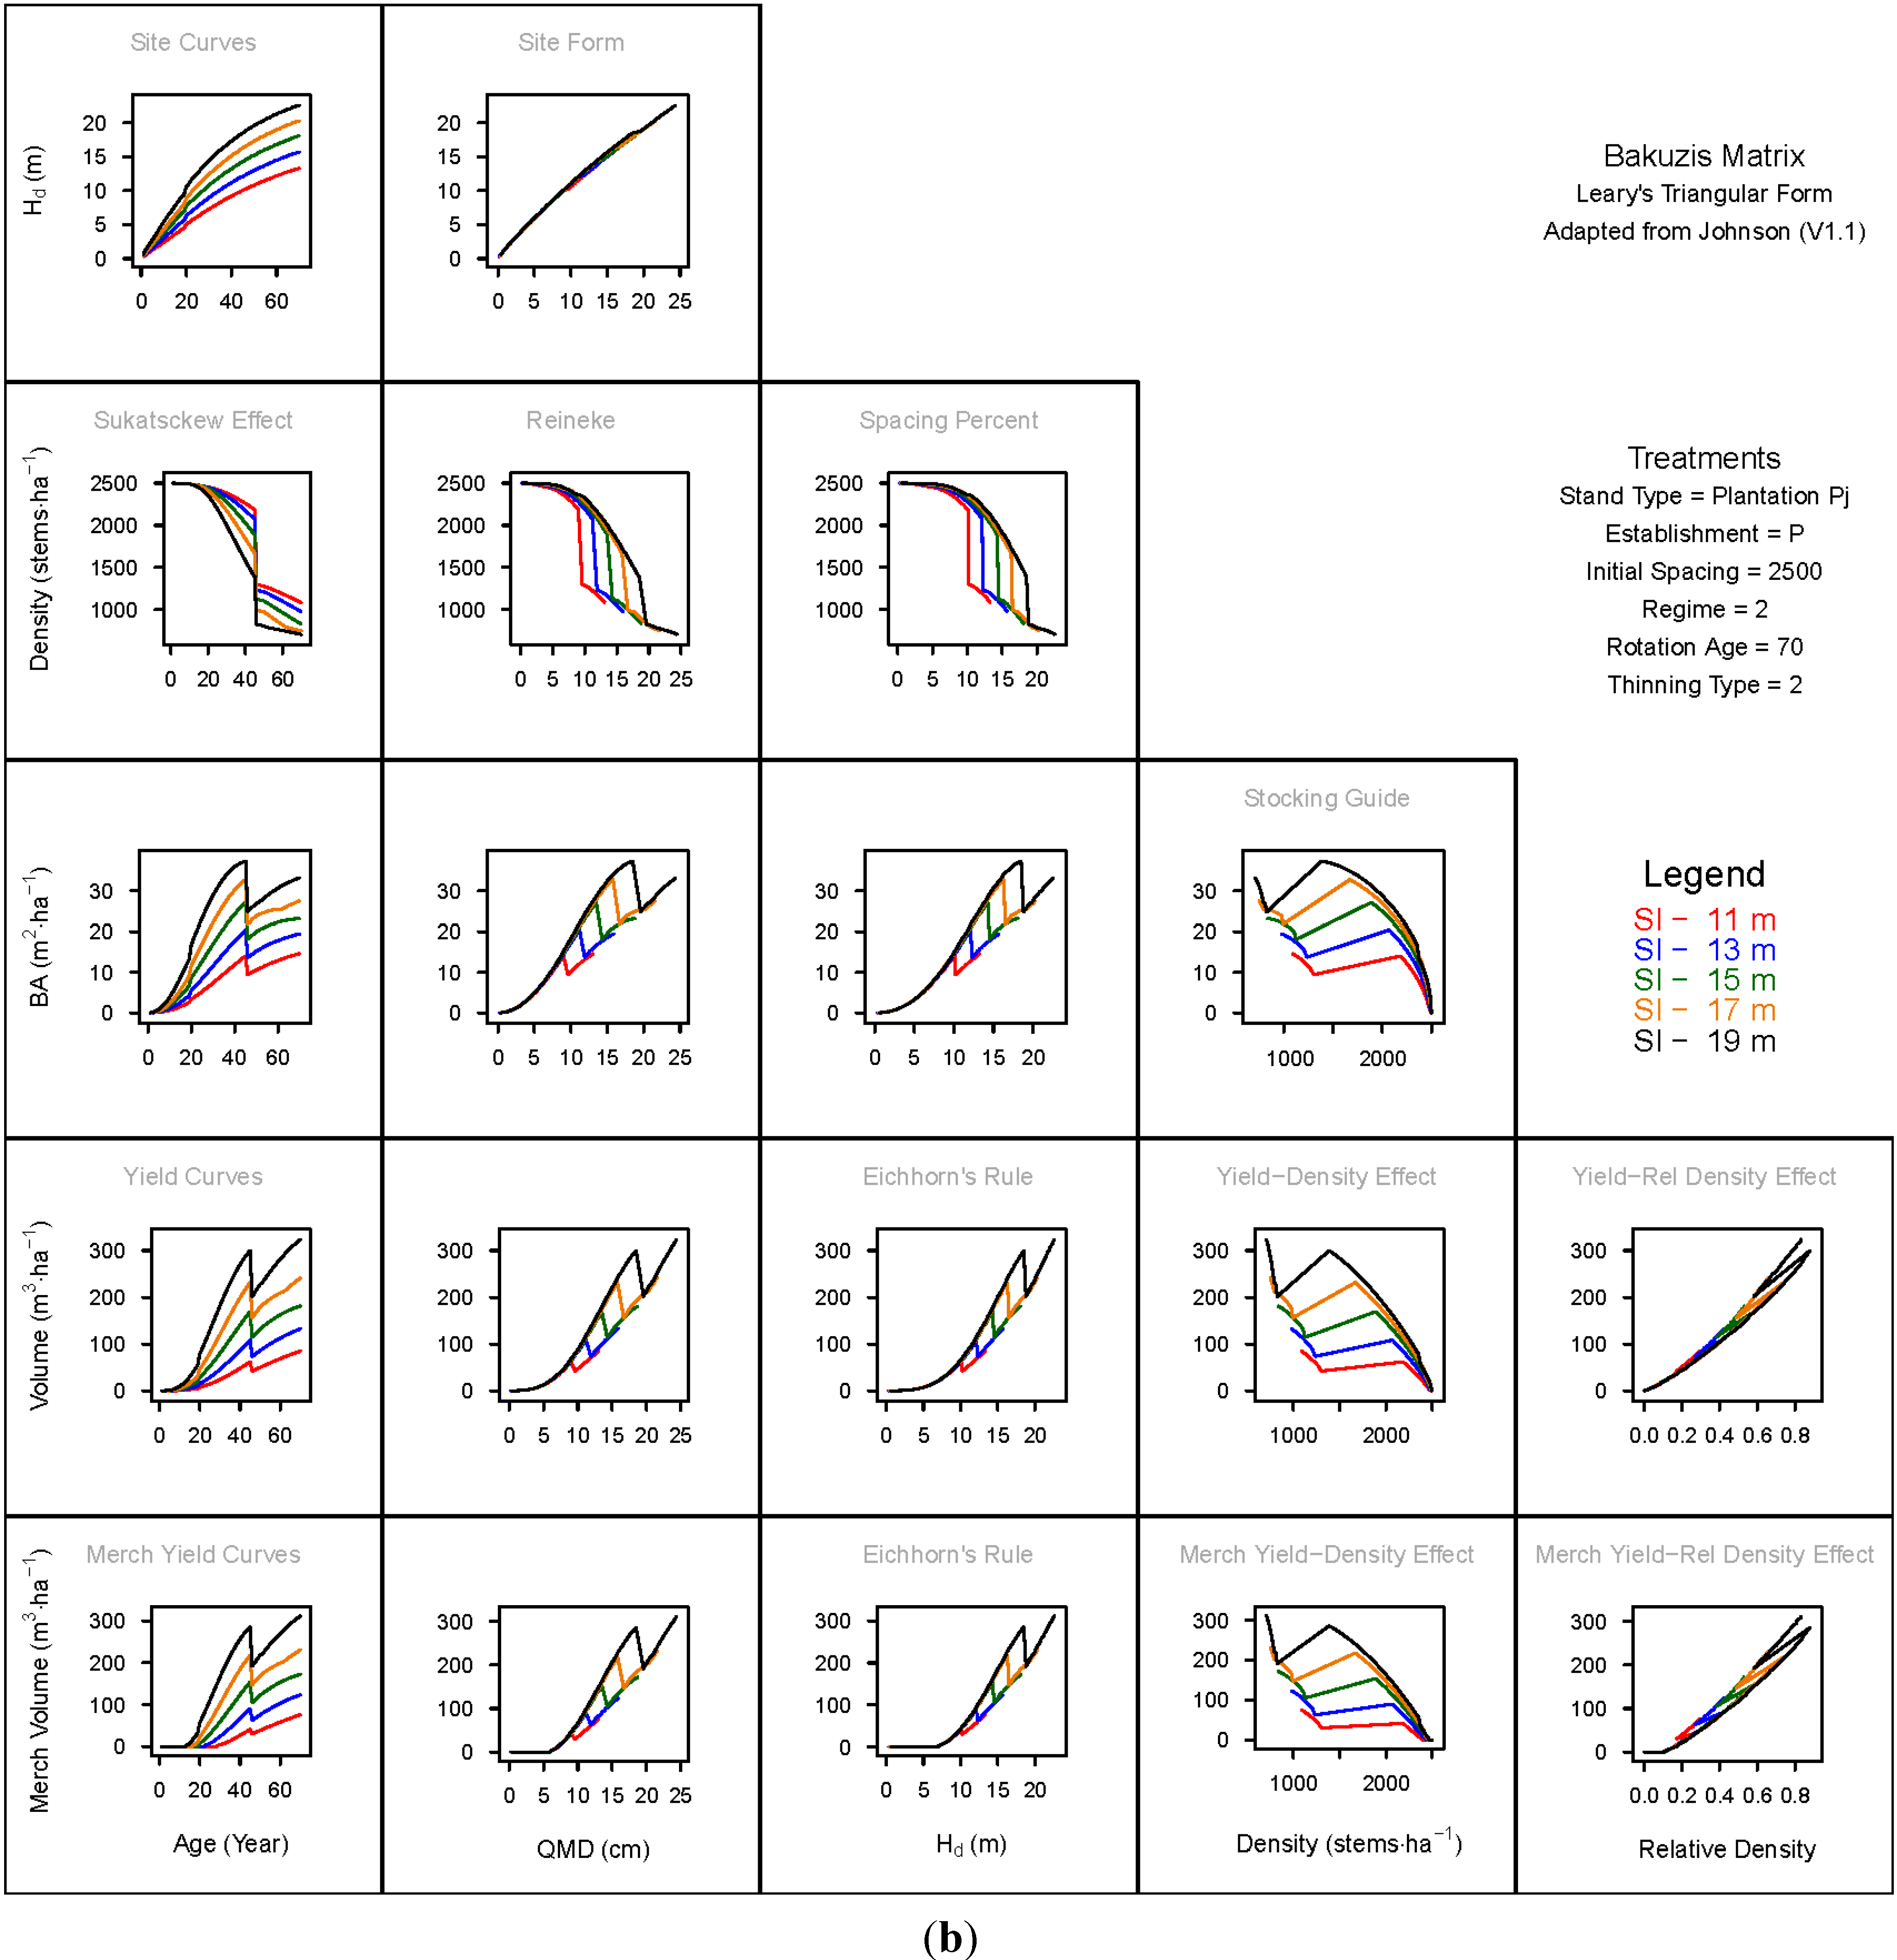
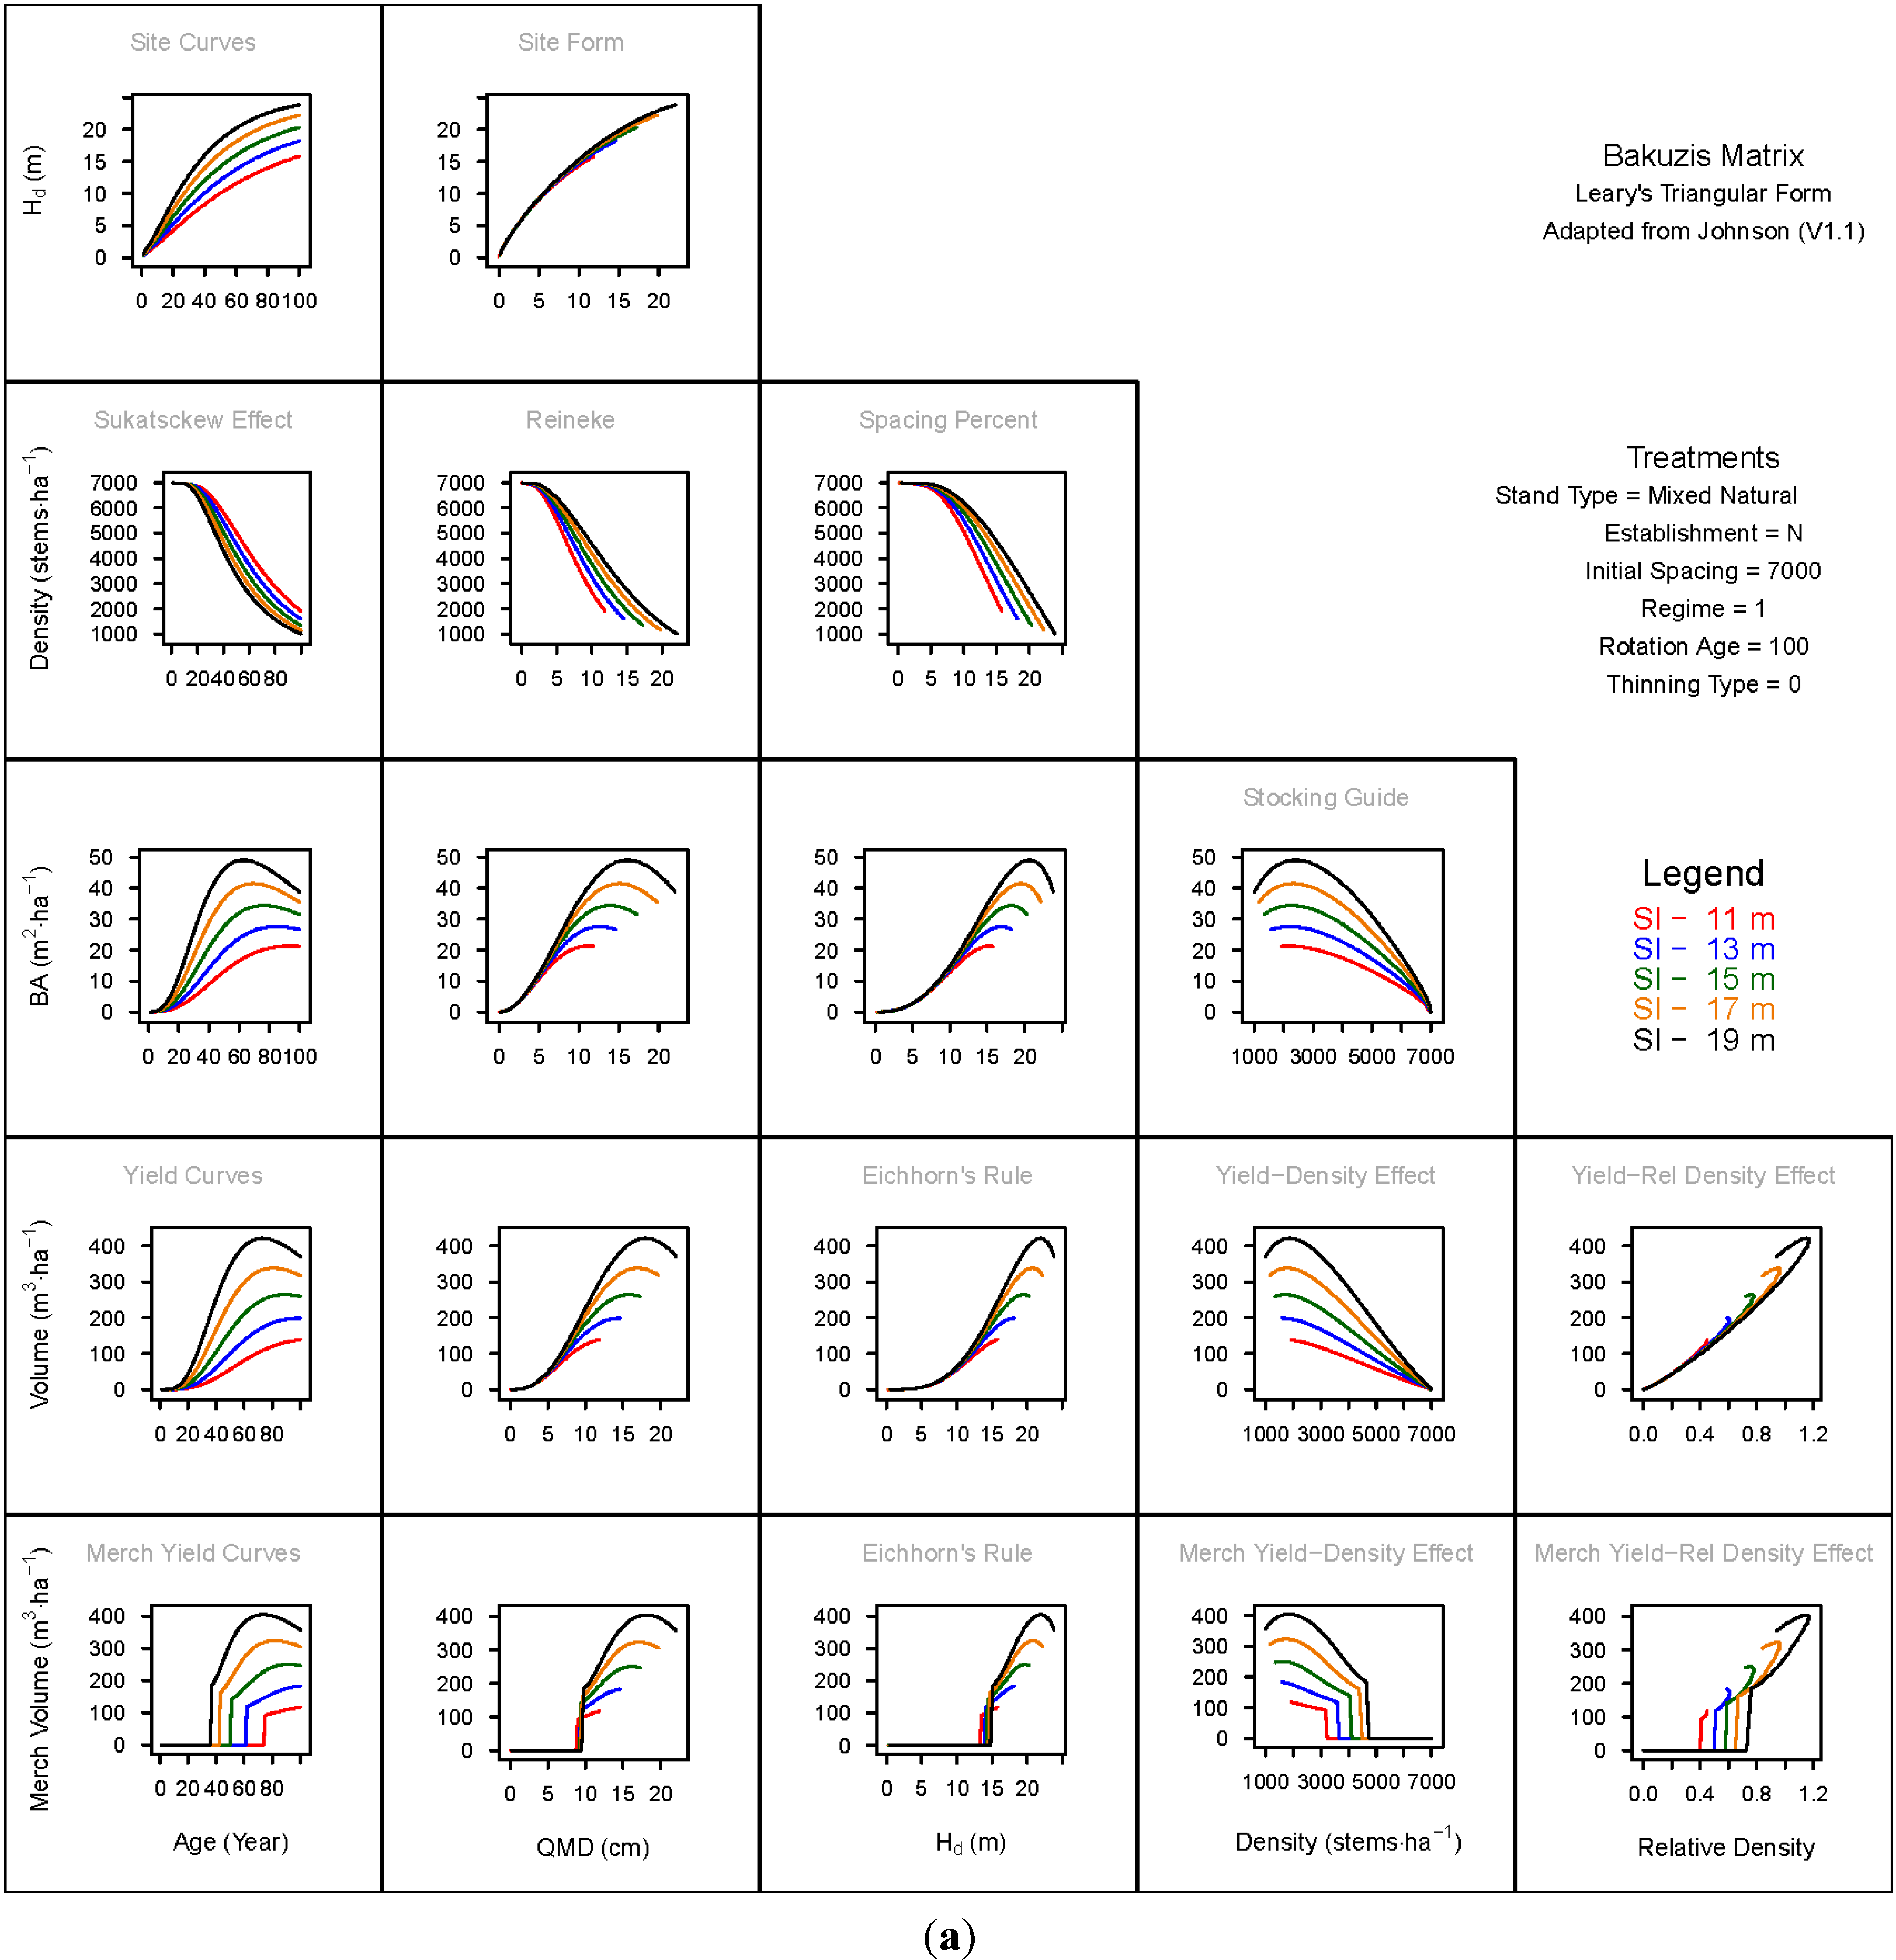
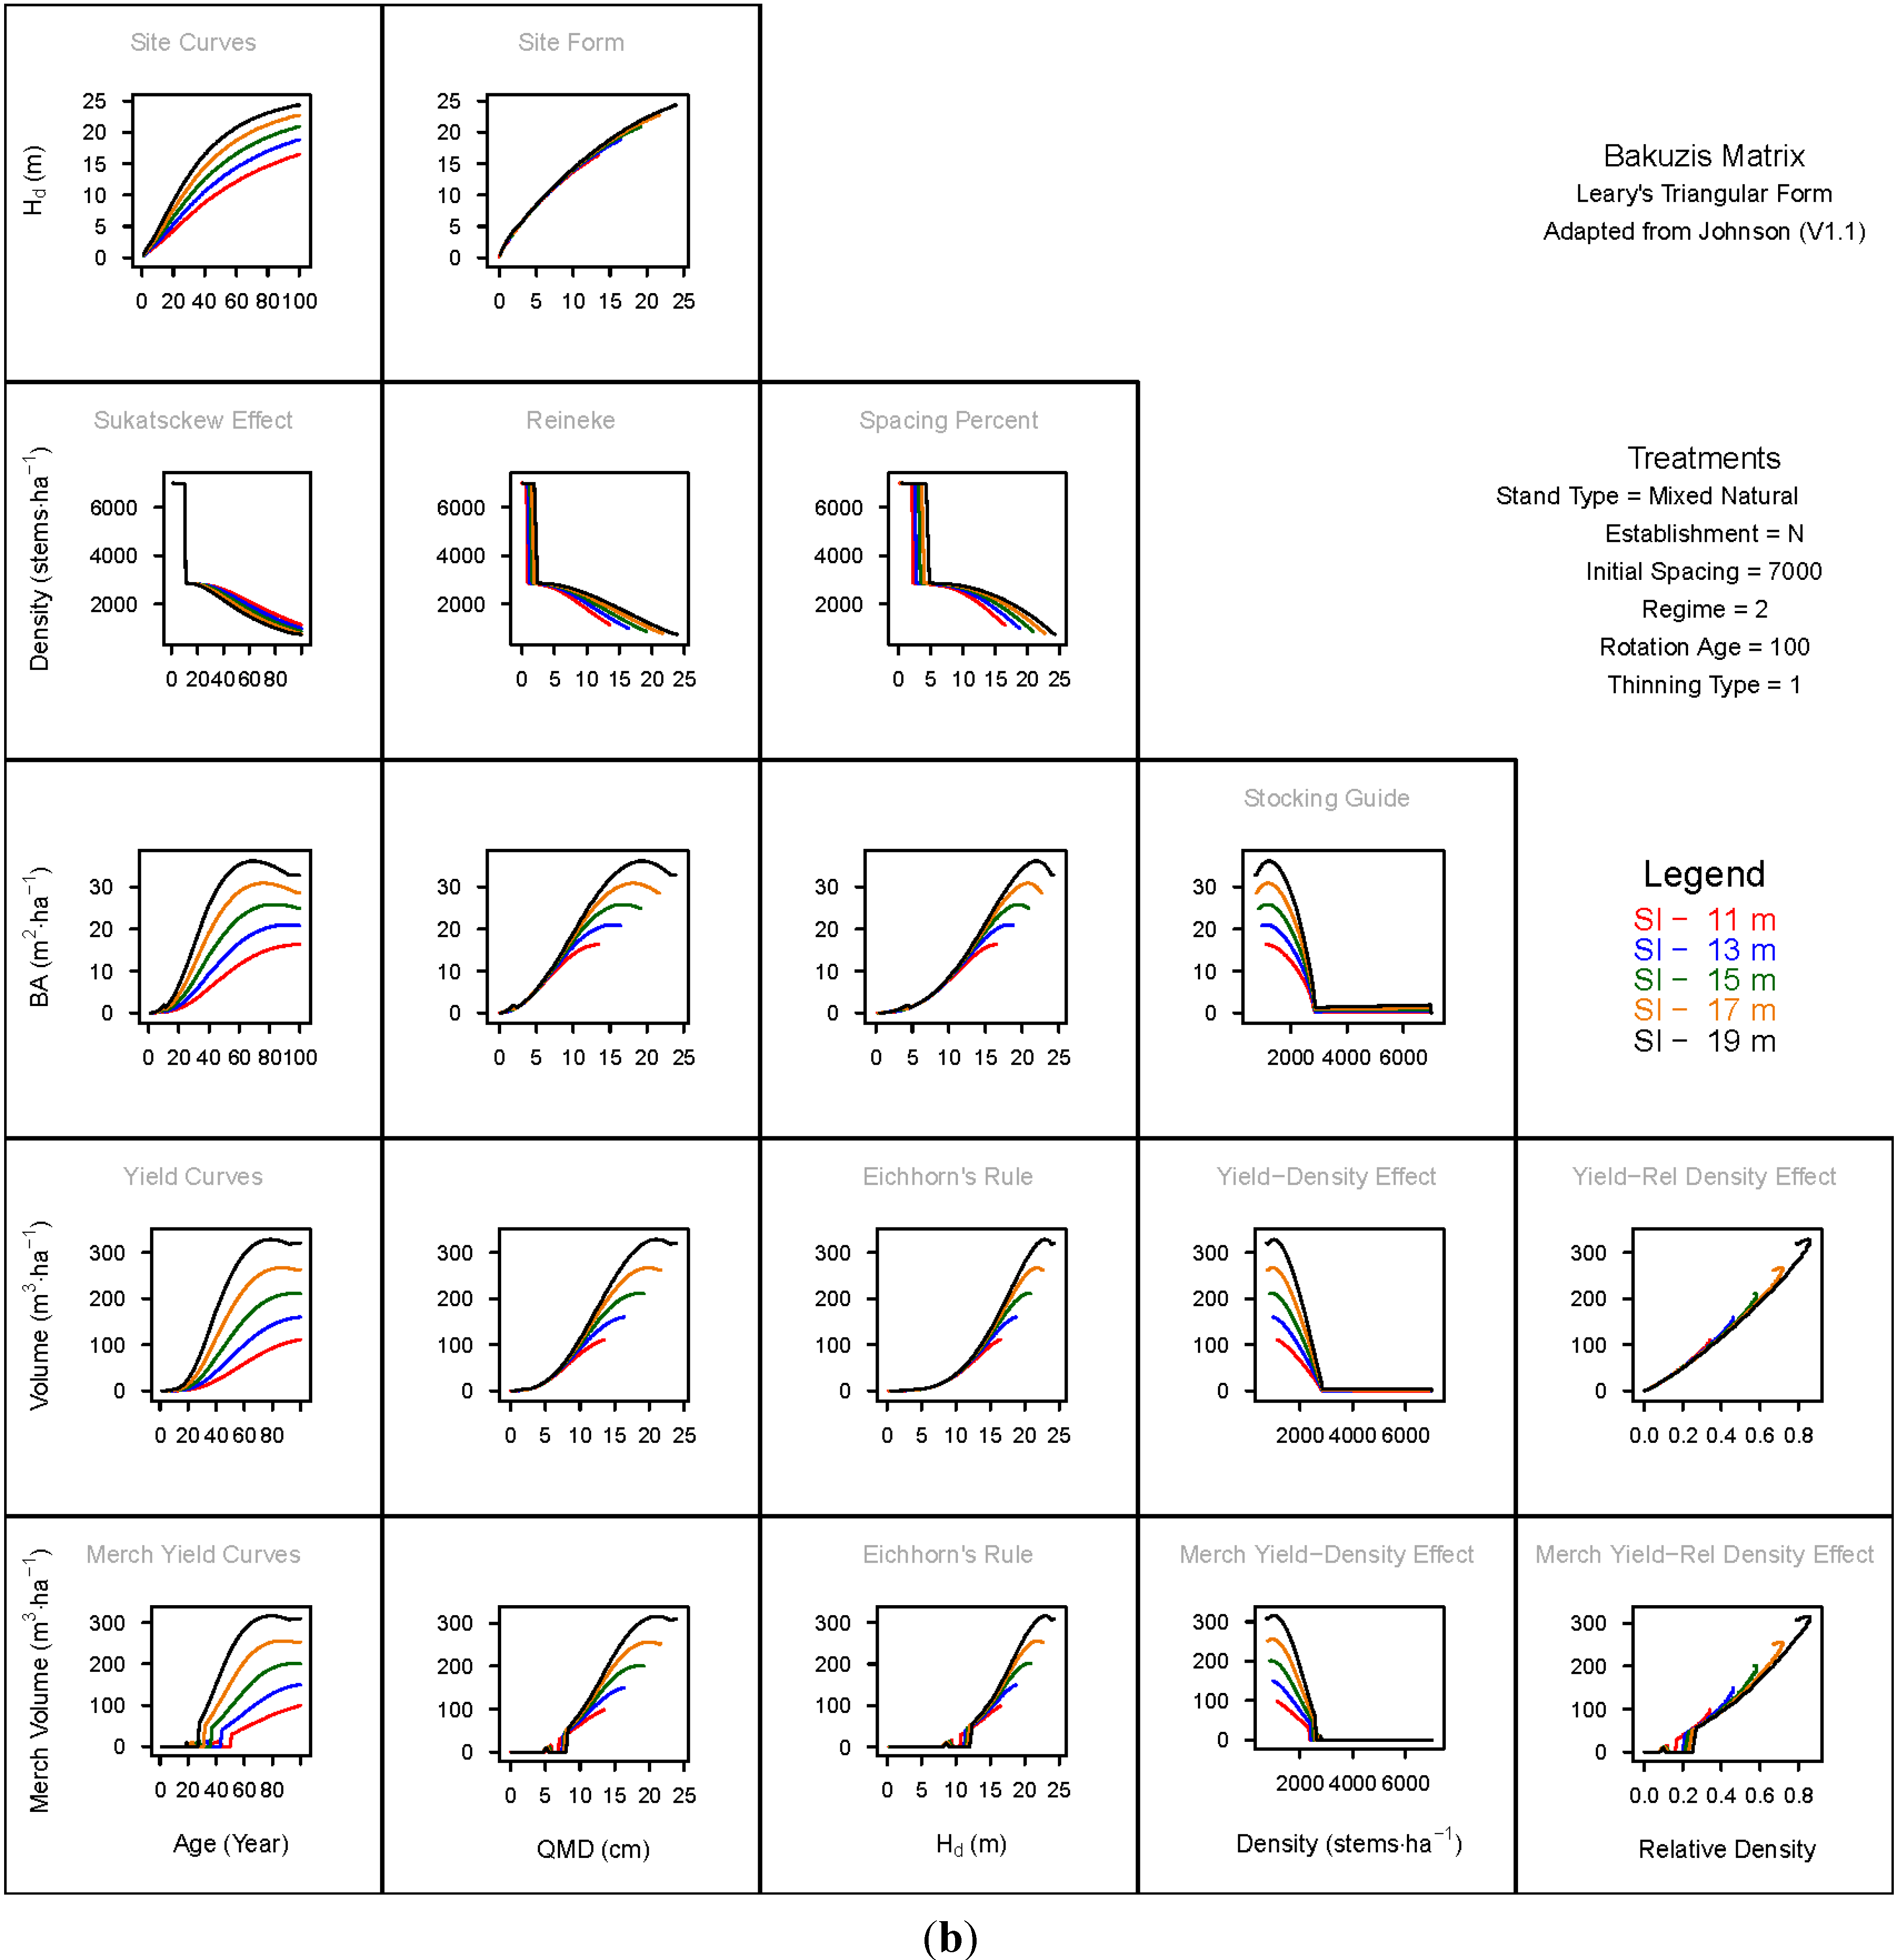
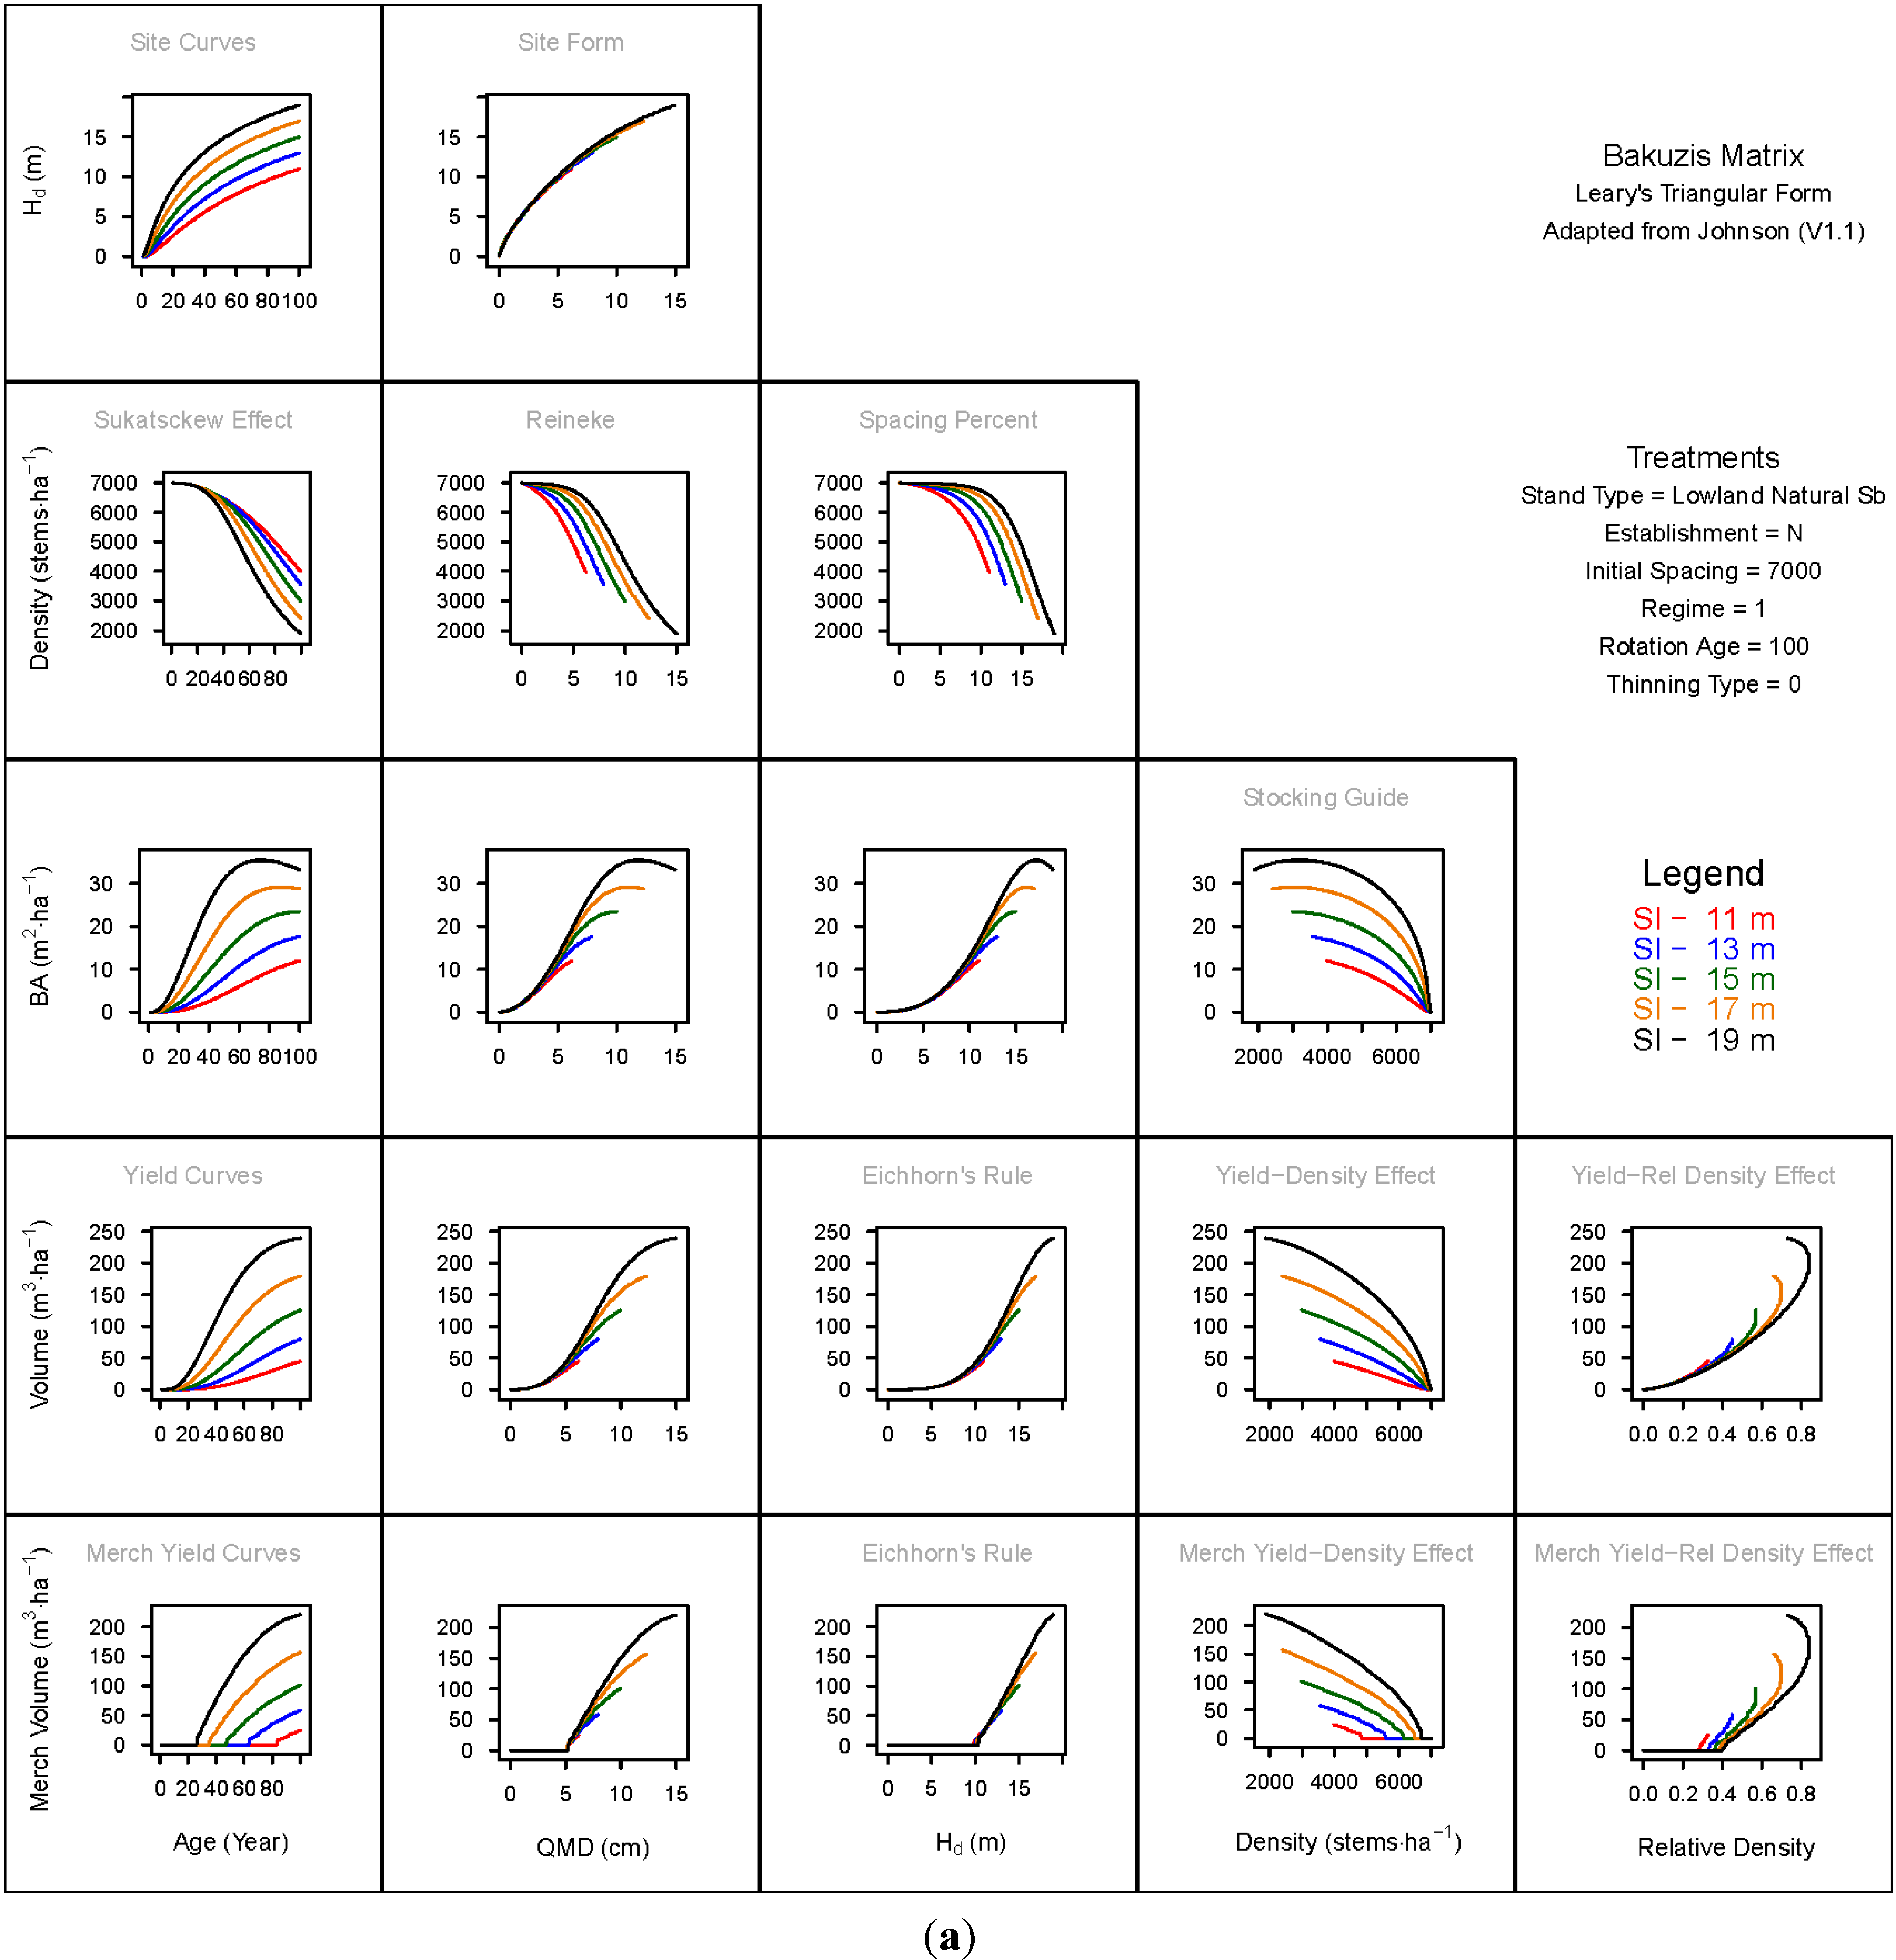
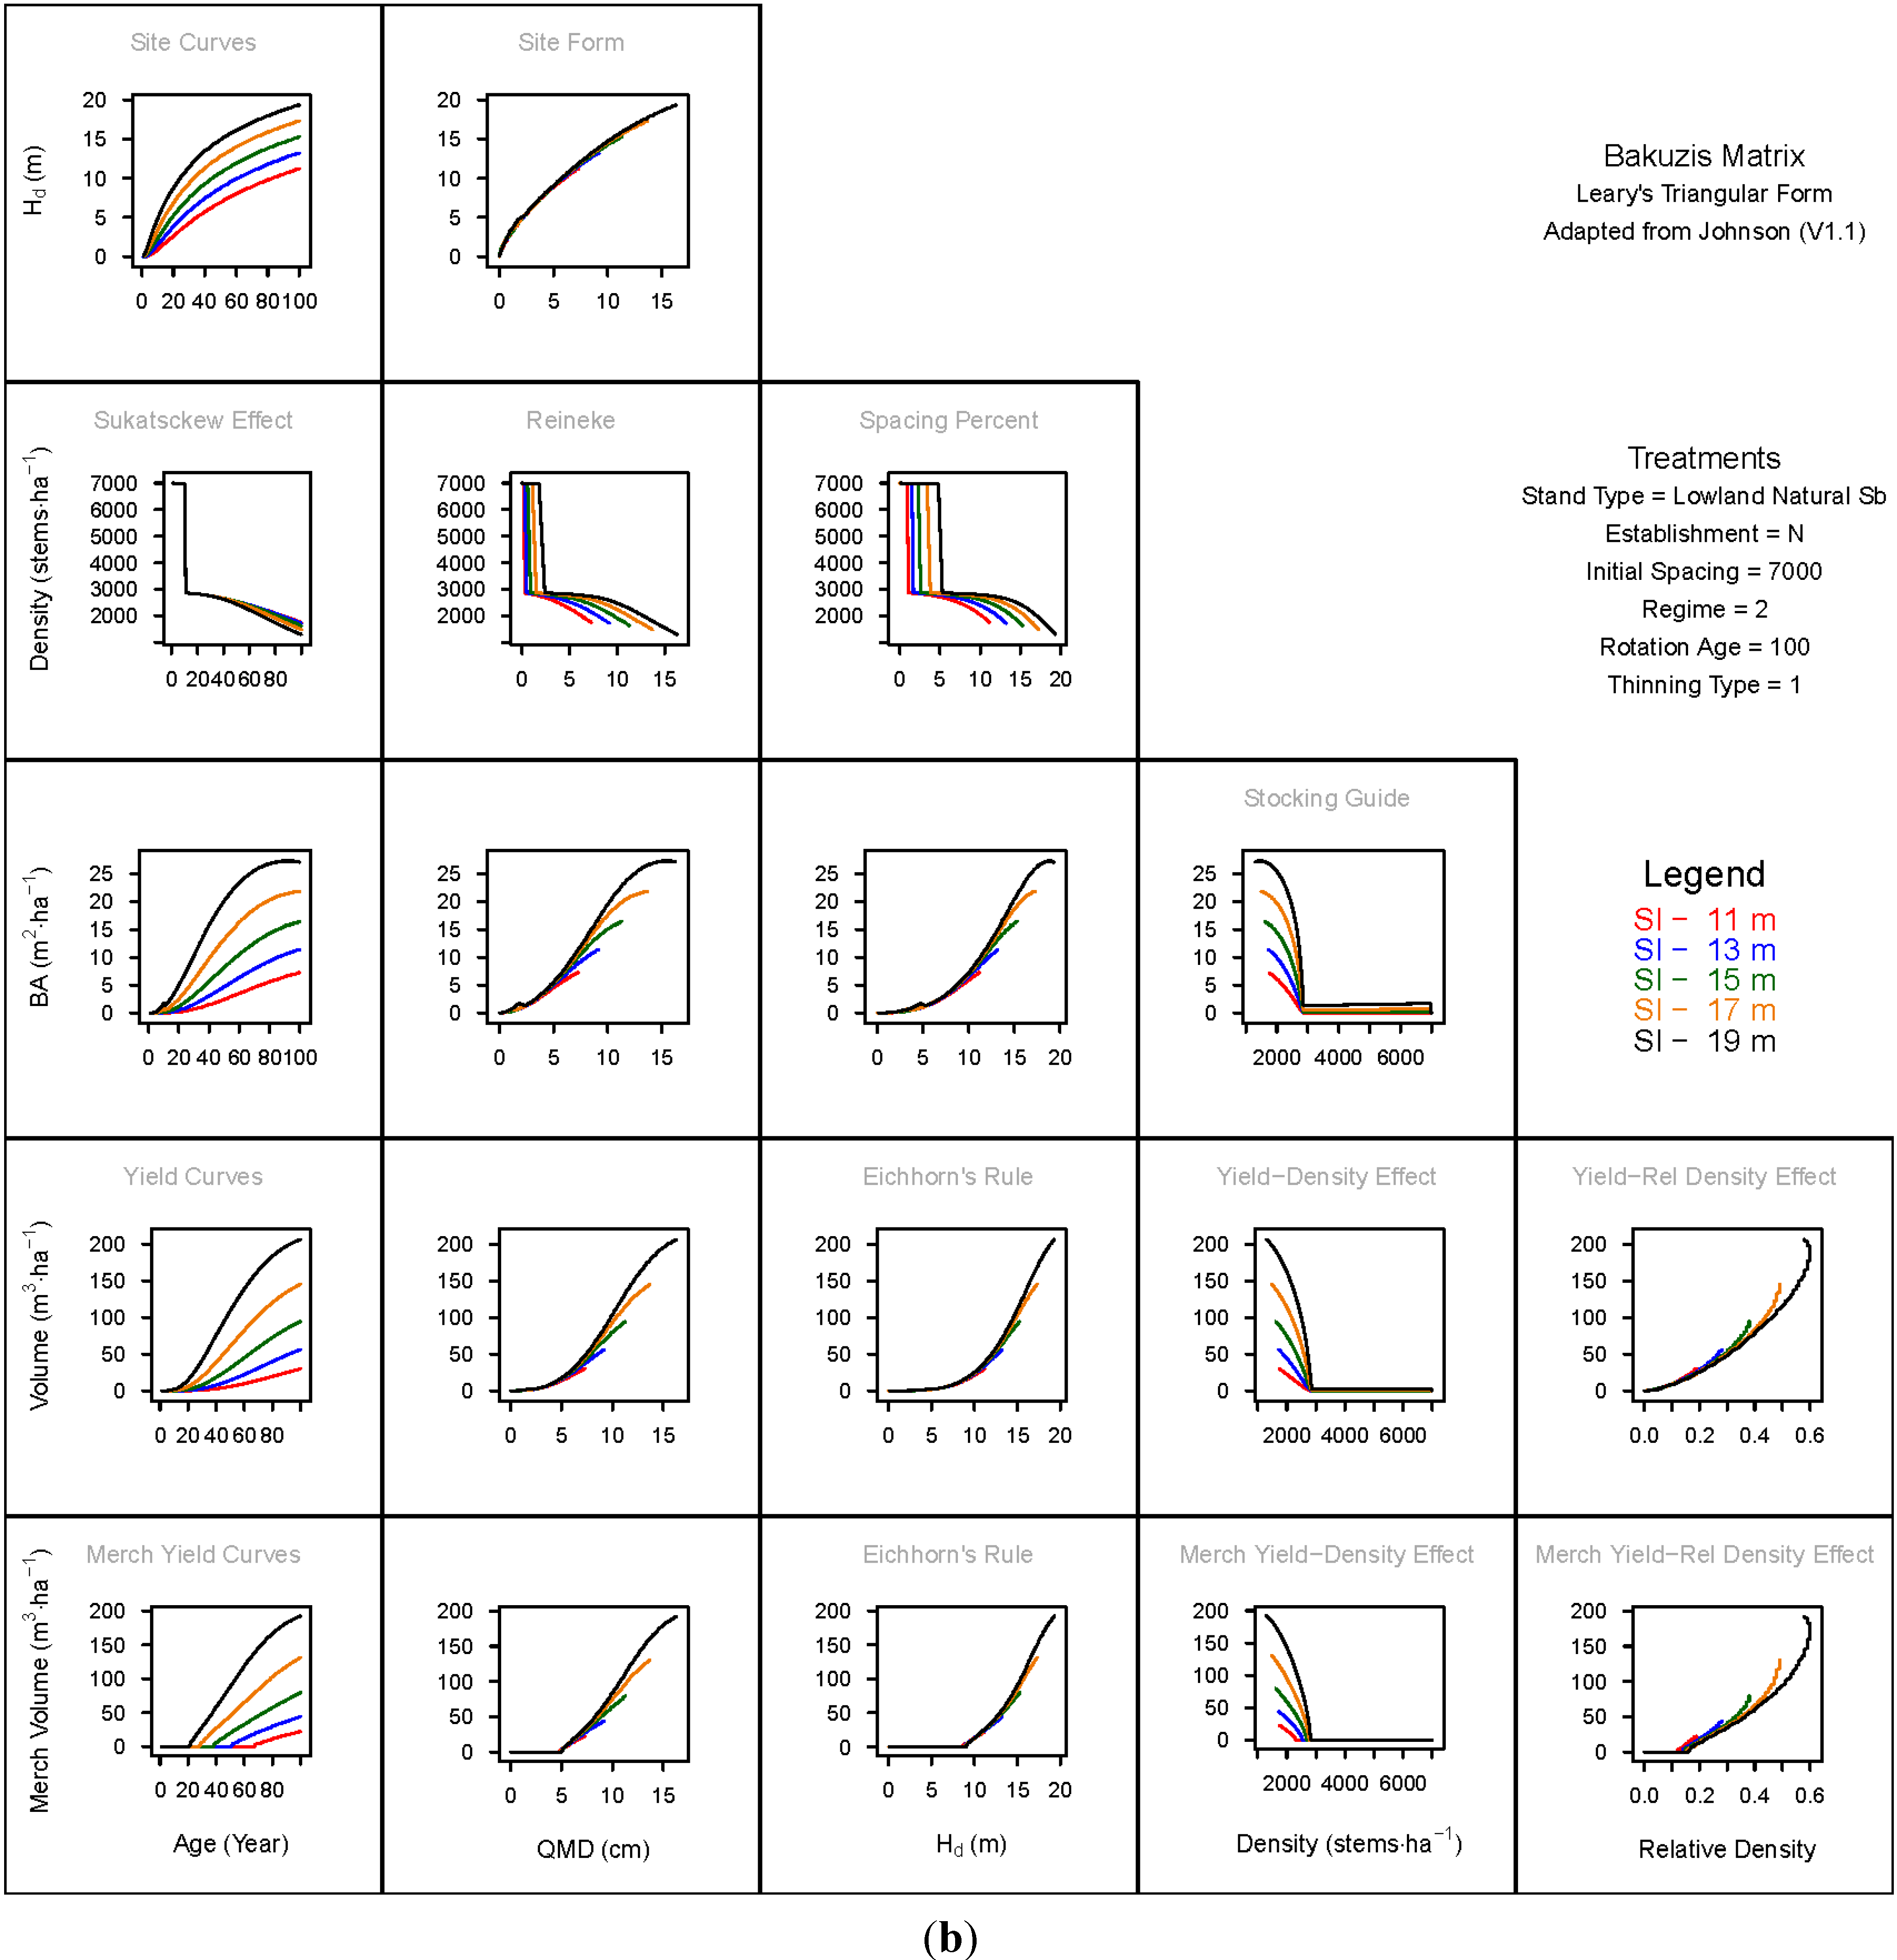
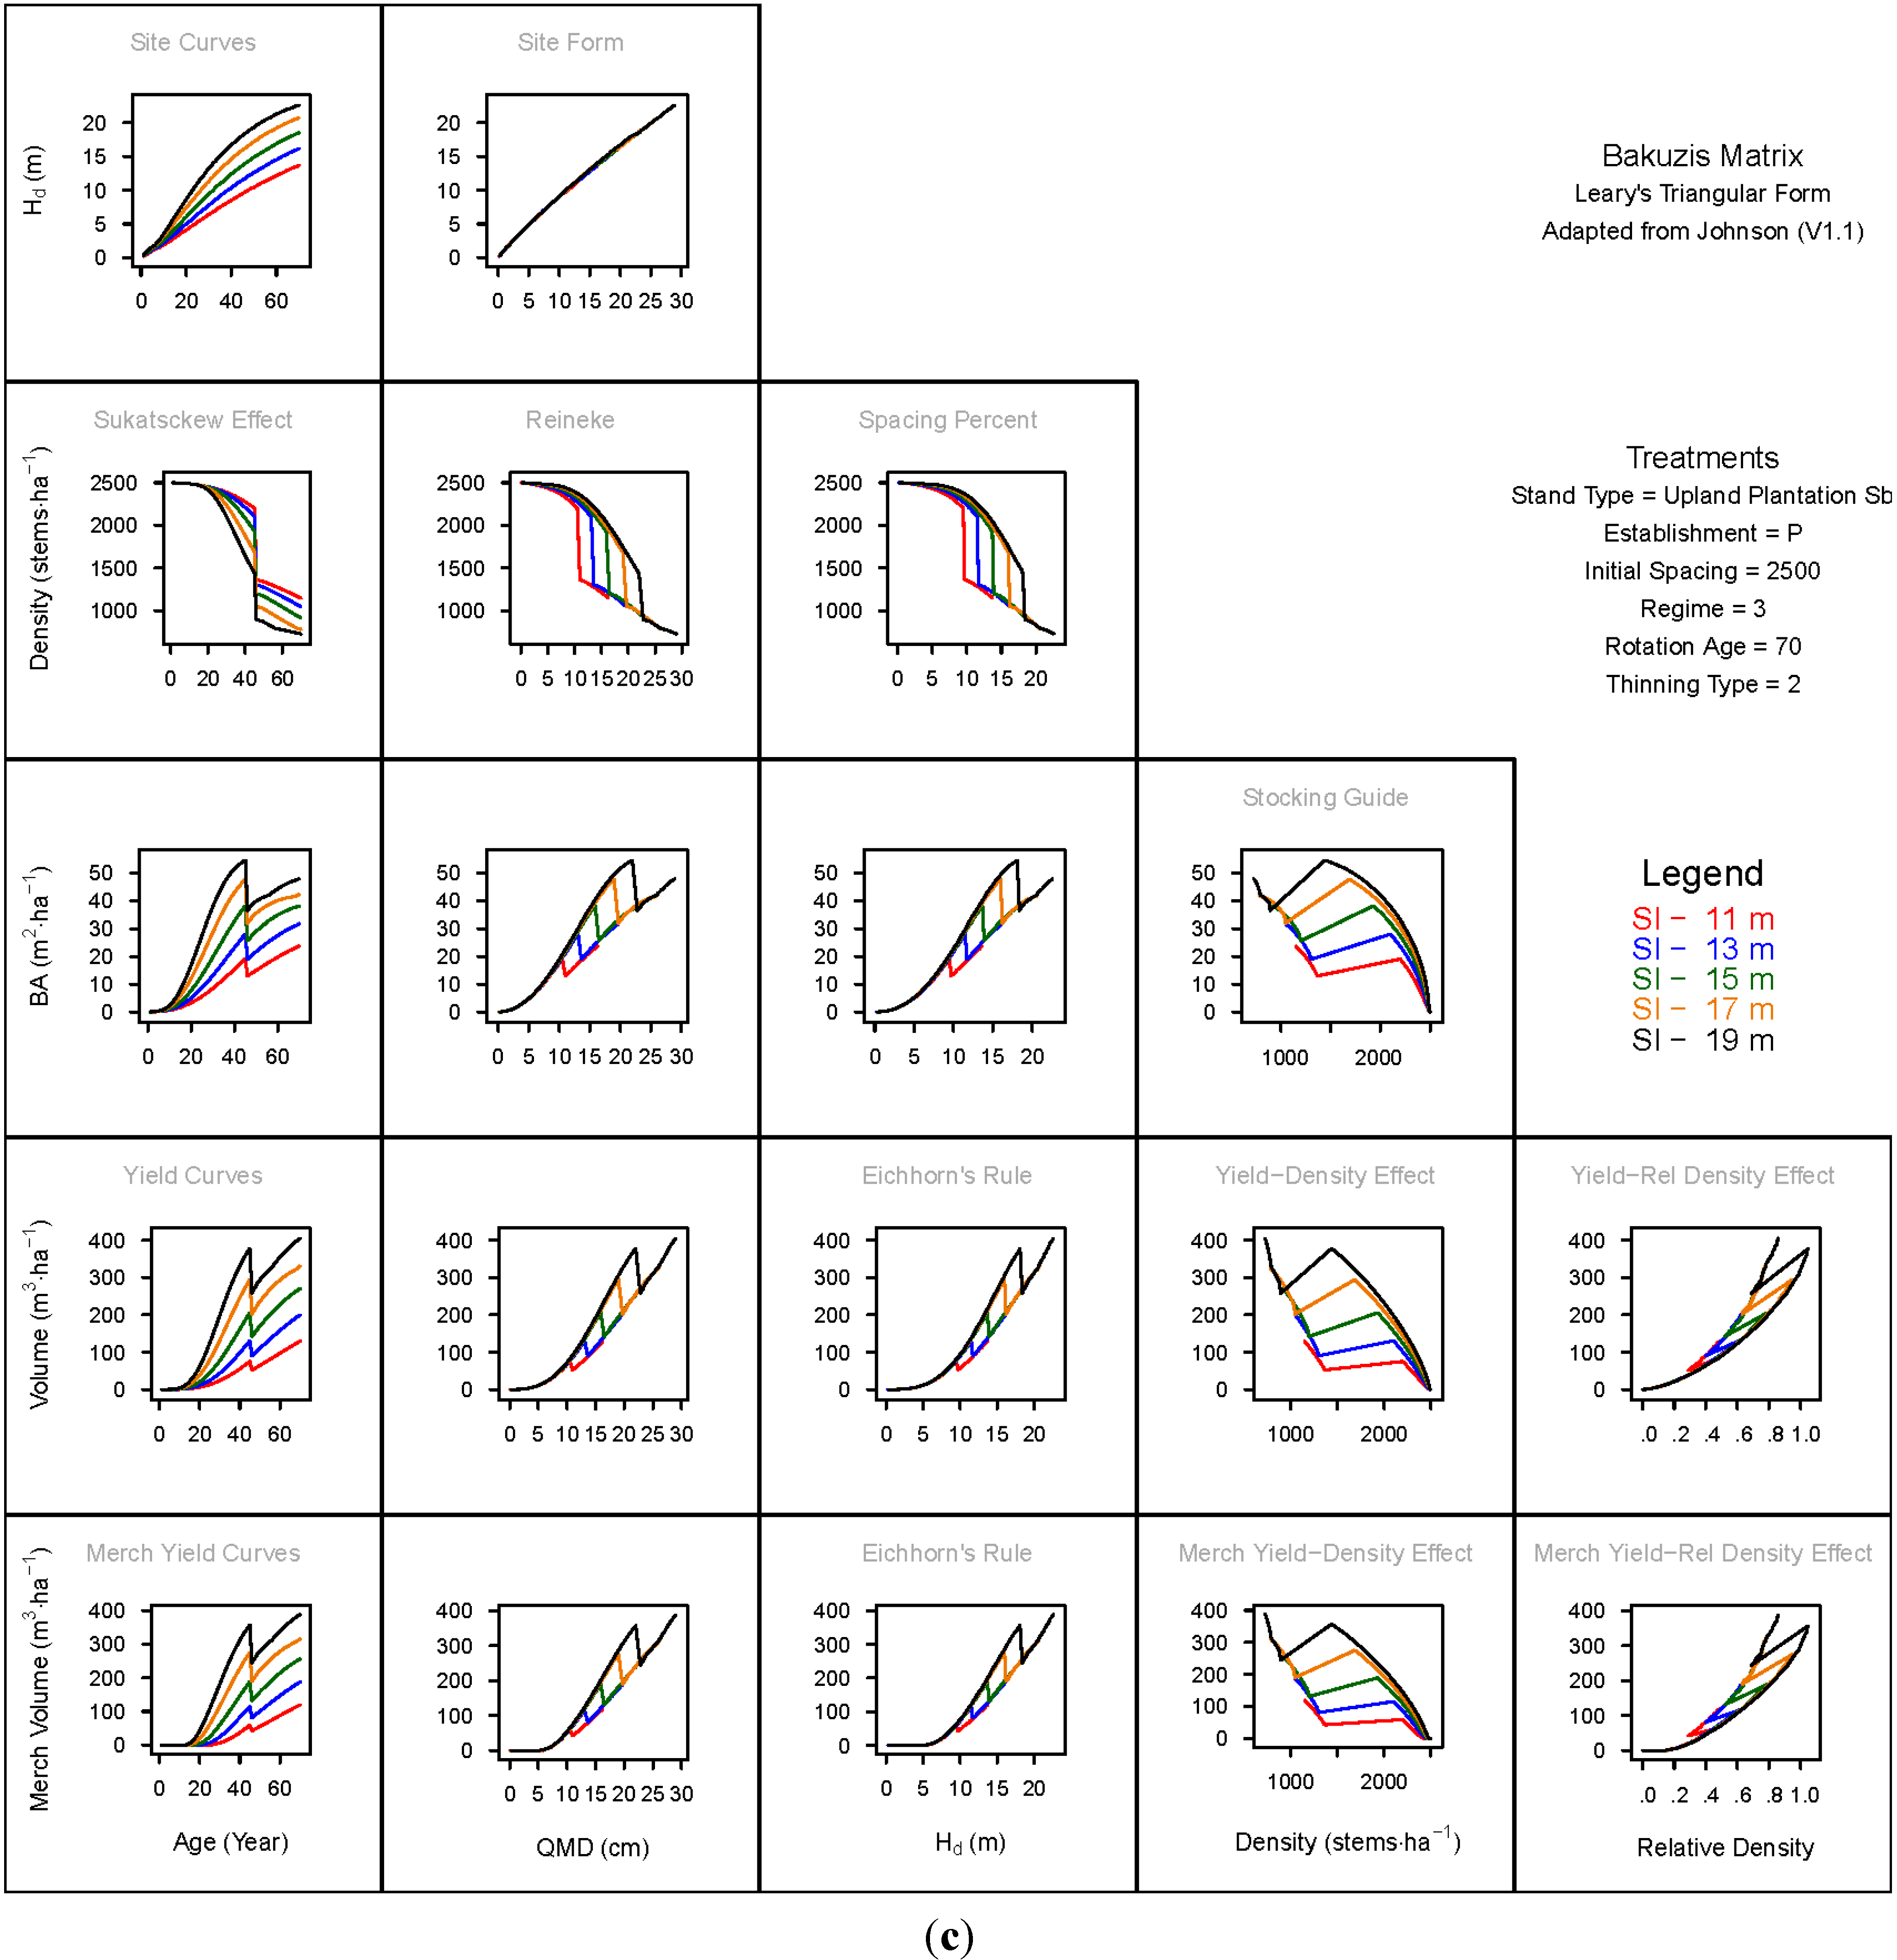
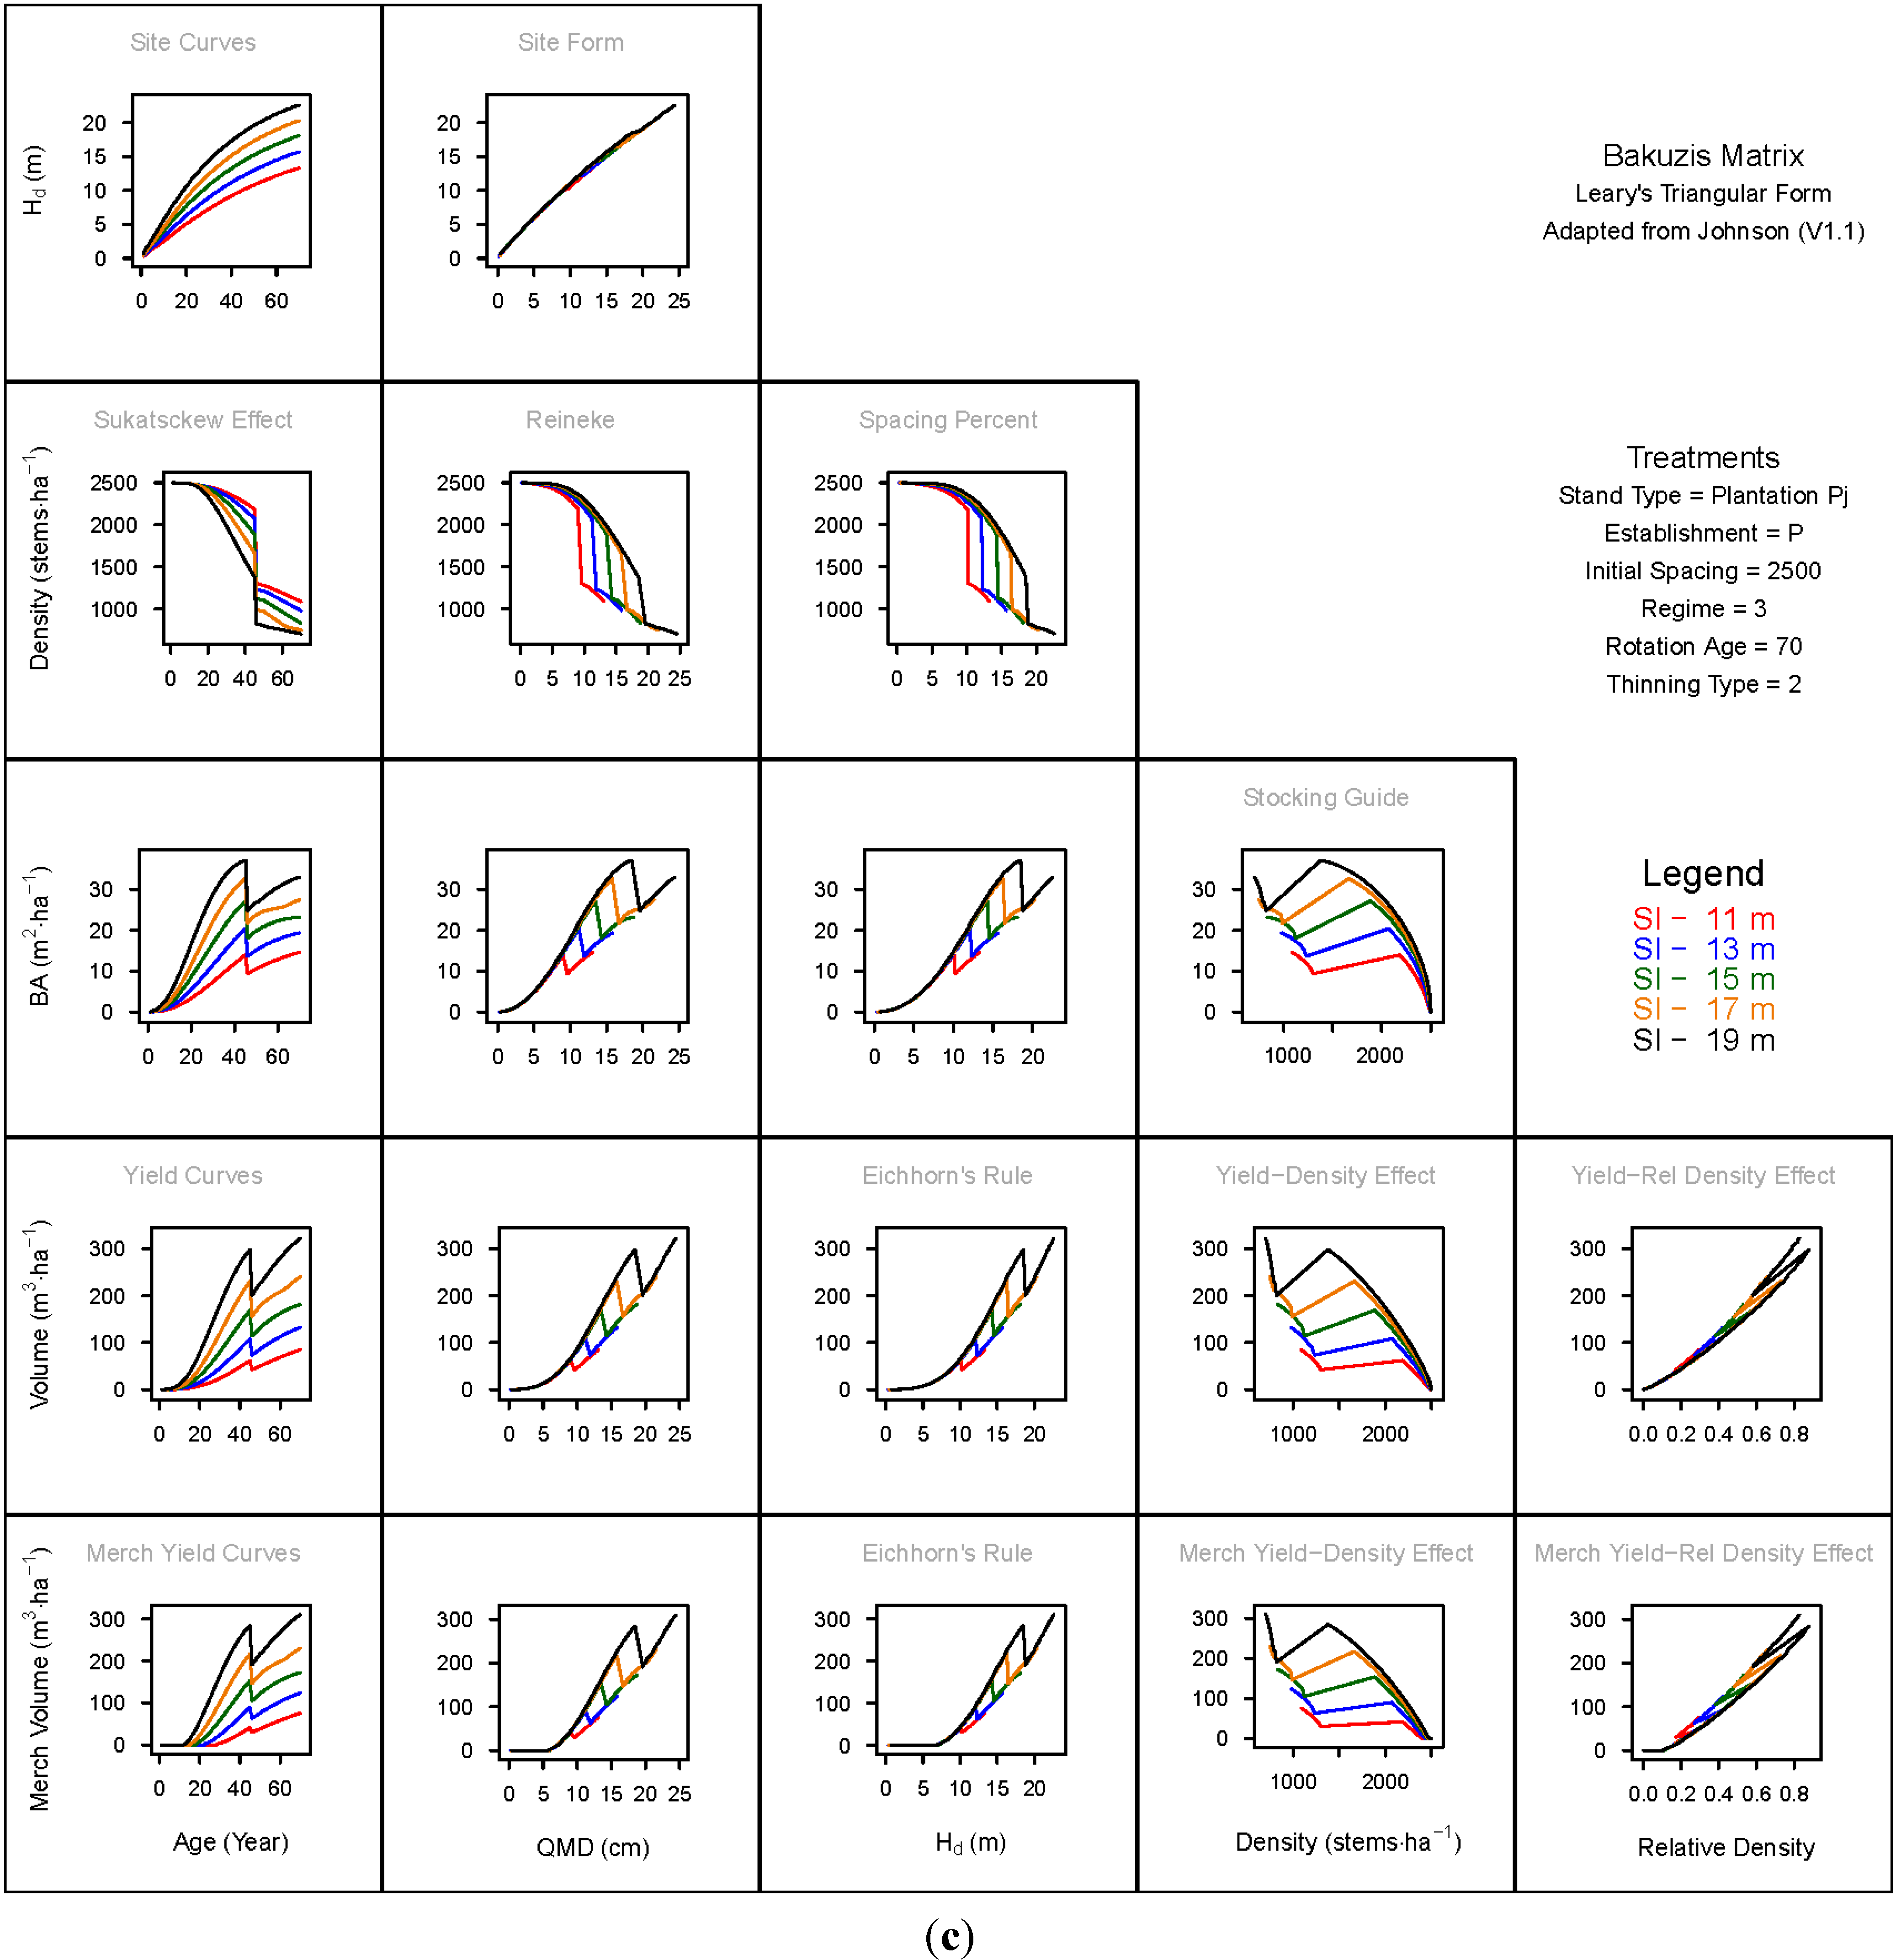
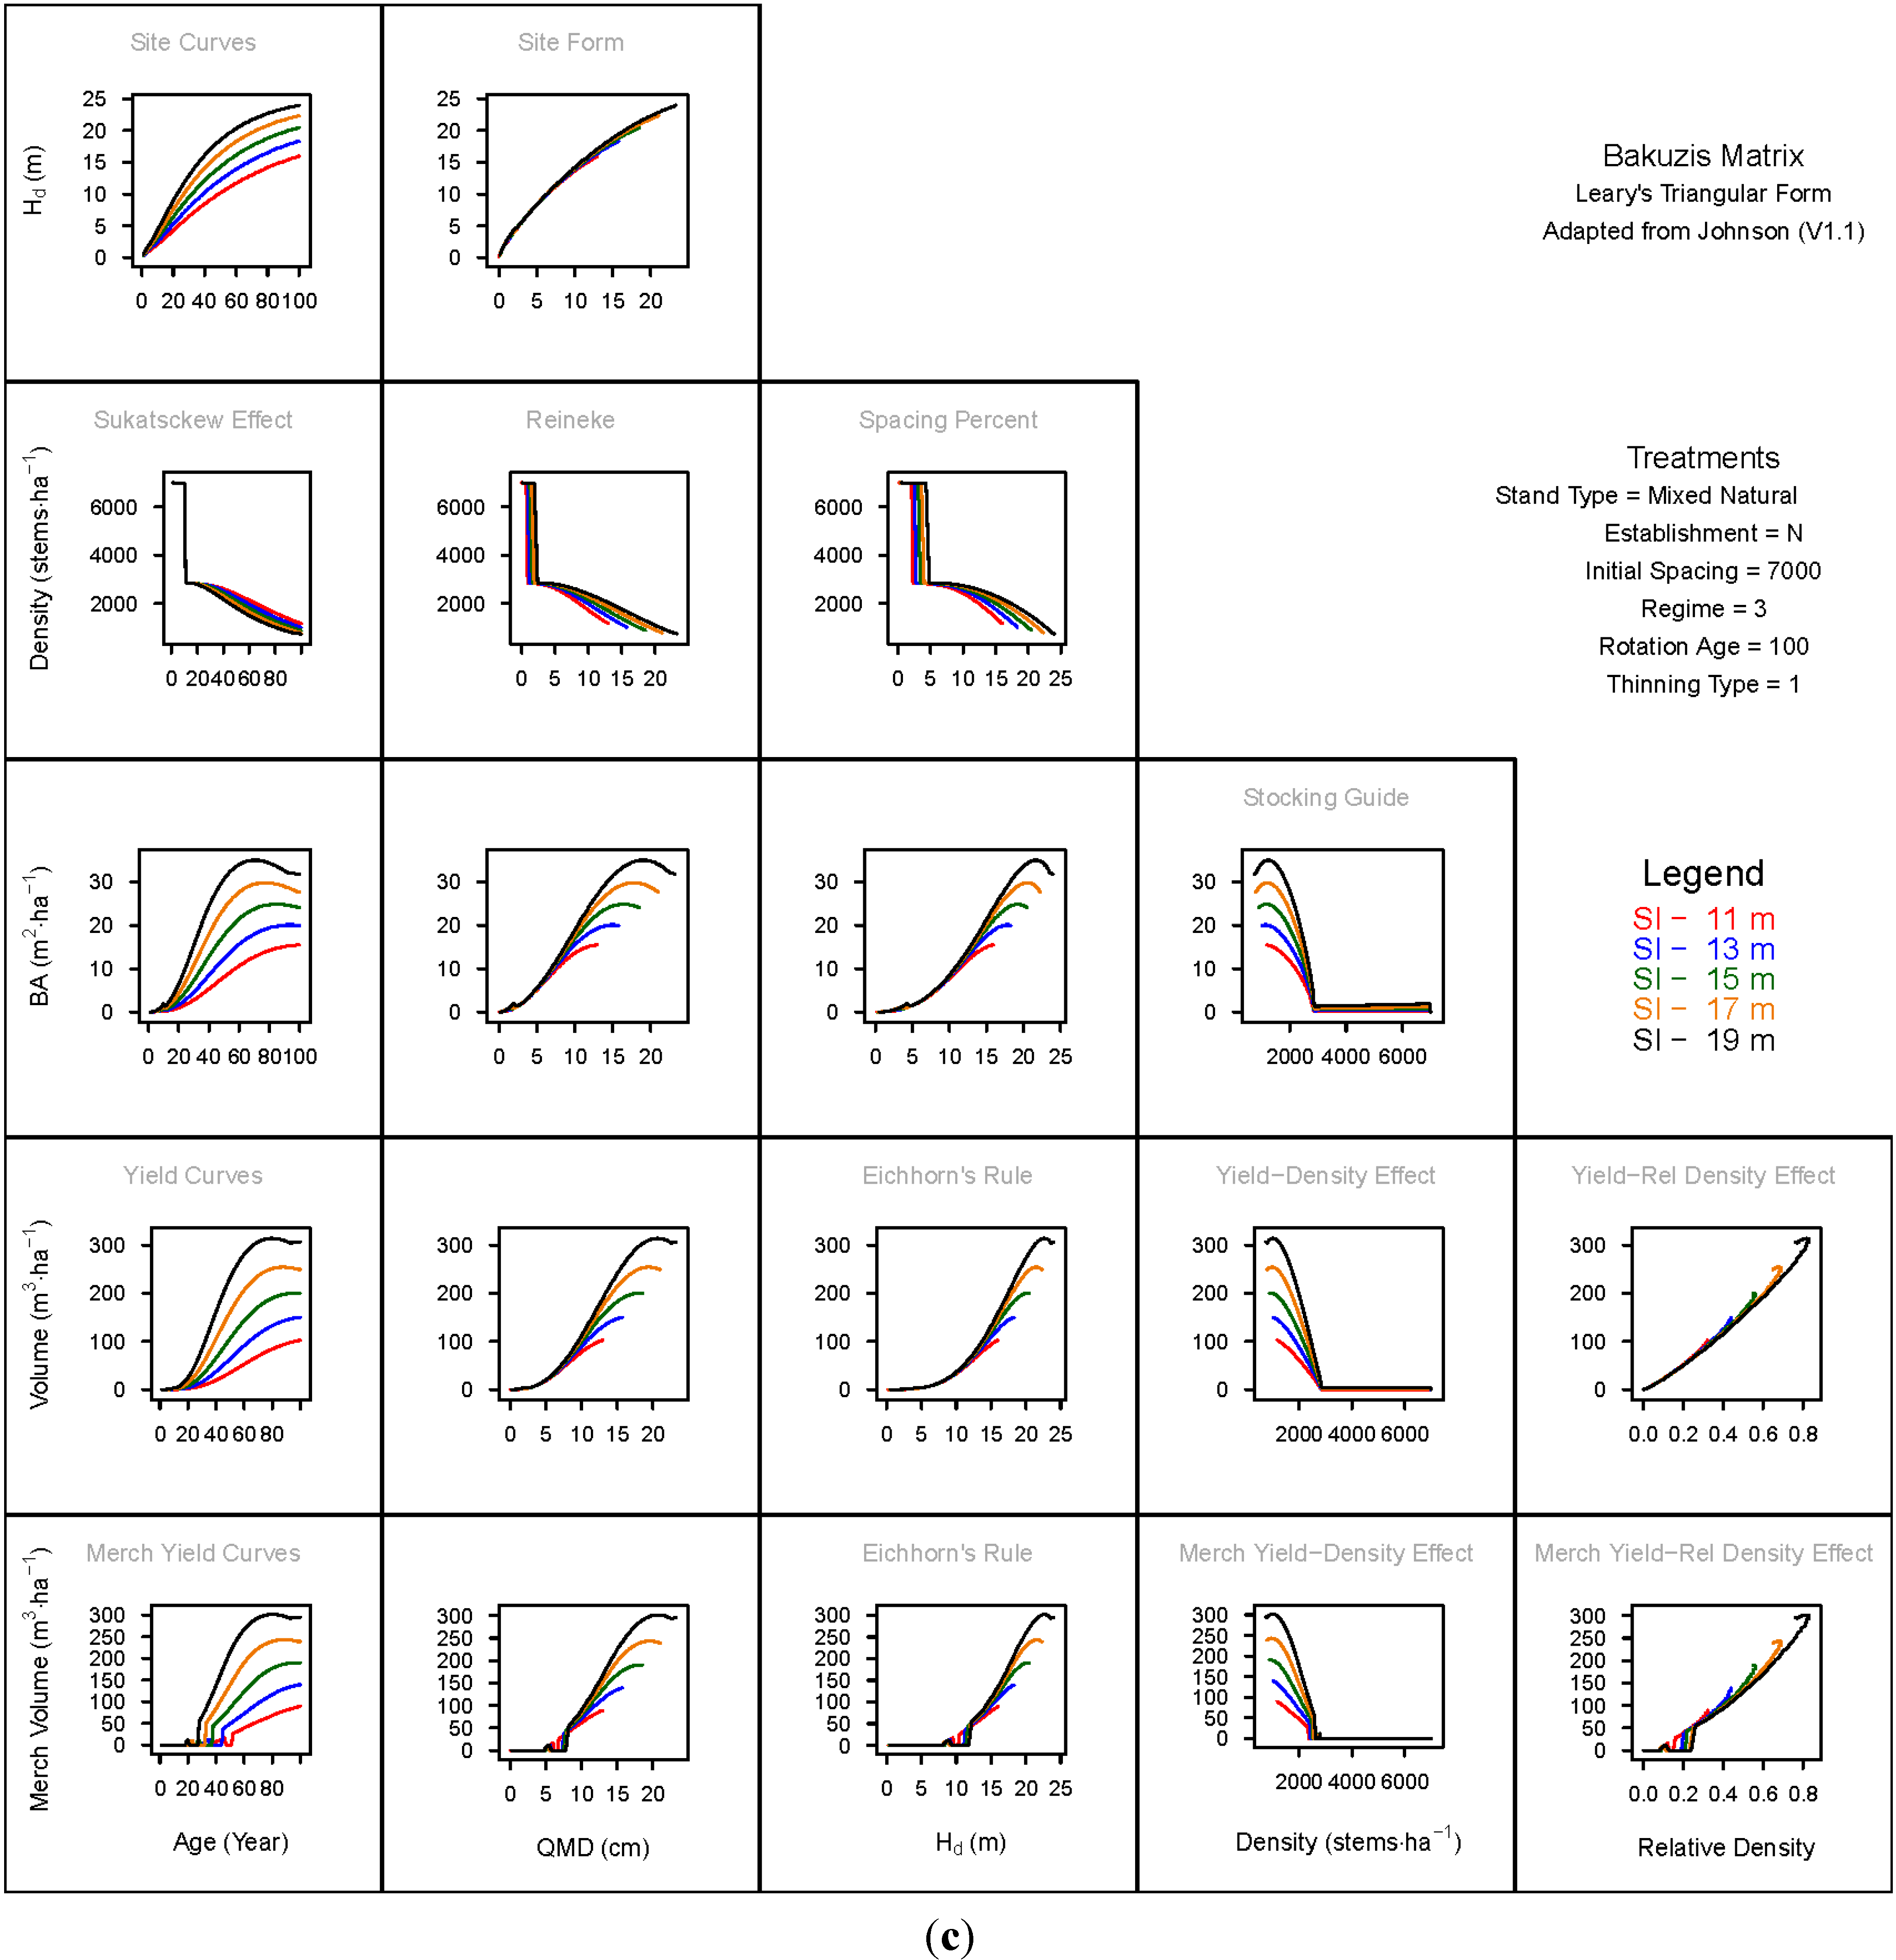
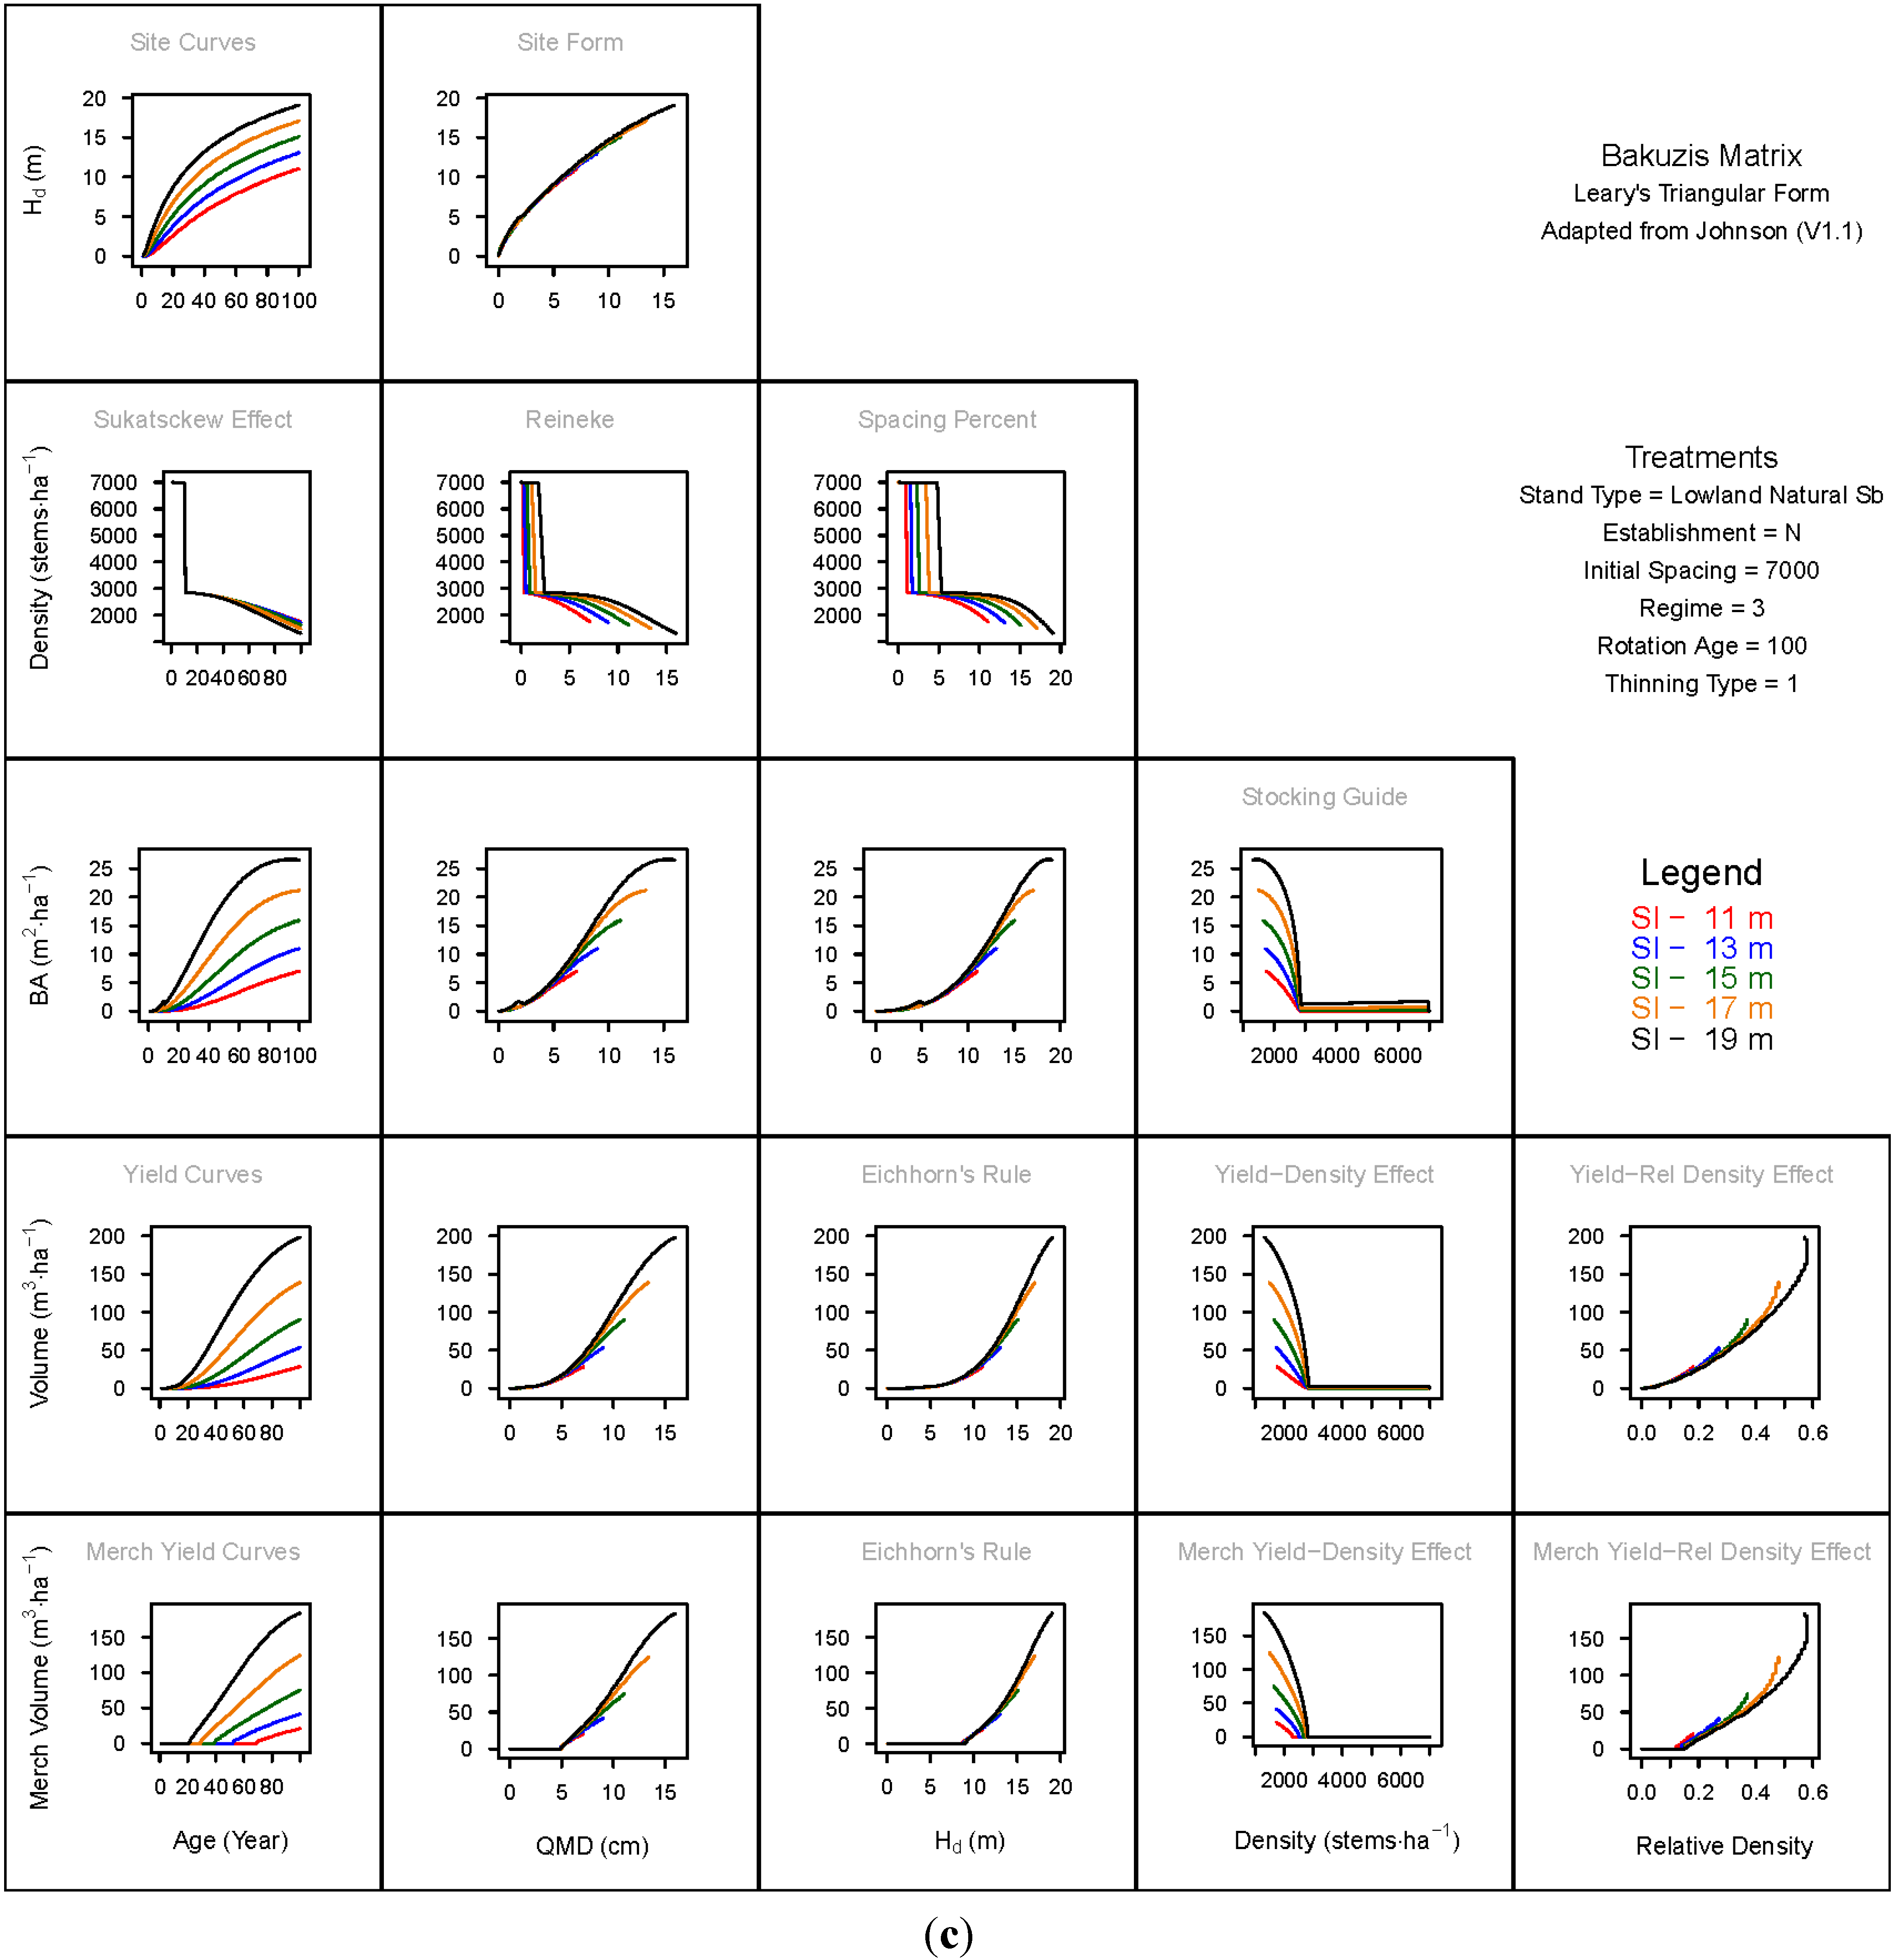
3.1. Principal Relationships Examined

3.1.1. Mean Dominant Height–Age Developmental Patterns (1:1)

Of all the quantitative relationships used within the SSDMMs, the site-based dominant height-age functions are among the most important given that they govern the temporal rate of stand development and structural change (e.g., [11]). Furthermore, the approach used to account for the accelerated rate of stand development arising from PCT treatments and planting of genetically-improved stock, is through temporal adjustments to the these species-specific functions. Specifically, the thinning model utilizes a density-dependent relative height growth modifier consistent with observed height repression release effects whereas the genetic model employs a relative height growth modifier based on known estimates of genetic gain. Both response models incorporated phenotypic juvenile age-mature age correlation relationships in order to address the intrinsic temporal decline in the magnitude of these effects over time.
The resultant mean dominant height–age trajectories generated from the SSDMM simulations for unthinned and thinned natural-origin stand-types and genetically-enhanced plantations were in empirical compliance with model-based expectations (e.g., accelerate rates of development for PCT treated stands and genetically-modified plantations). In addition, they conformed to the site productivity axioms applicable to even-aged stand development (e.g., asymptotic-like and polymorphic-shaped site-dependent temporal trajectories). Specifically, the trajectories for the upland natural-origin black spruce, jack pine, black spruce and jack pine mixtures, and lowland black spruce stand-types, were in accord with expectation. The unthinned stands (Regime 1) exhibited the expected site-specific polymorphic temporal trends in their height development patterns across all the stand-types, initial densities and rotation lengths assessed (e.g., matrix position (1:1) in Figure 1a and Figure A2a, Figure A4a, and Figure A5a, respectively). For the thinned stands (Regime 2 and 3), the mean dominant height for any given age past the termination of the thinning response delay period (approximately at 10 years) predicted by the maximum thinning response model, was greater than that calculated by the minimum thinning response model. For example, comparing the stand-type-specific trajectories for Regime 2 vs. Regime 3 for any given initial density, rotation age and site index, the difference is visually detectable (c.f., matrix position (1:1) in Figure 1b vs. Figure 1c for PImUN, Figure A2b vs. Figure A2c for PNbN, Figure A4b vs. Figure A4c for PImPNbN, and Figure A5b vs. Figure A5c for PImLN). Additionally, the post-thinning trajectories for the thinned stands employing the minimum thinning response model (Regime 3) were always greater than that calculated for the unthinned stand (Regime 1) (c.f., matrix position (1:1) in Figure 1a vs. Figure 1c for PImUN, Figure A2a vs. Figure A2c for PNbN, Figure A4a vs. Figure A4c for PImPNbN and Figure A5a vs. Figure A5c for PImLN). For a given stand-type, site class, rotation length and response model, the magnitude of the height increase varied directly with the number of trees removed during the PCT treatment, as expected.
For the black spruce and jack pine plantation stand-types, the mean dominant height–age trajectories were in accord with the modeling assumptions used to describe the growth increases arising from genetic worth effects. Specifically, an instantaneous jump-like increase attributed to genetic worth effects was observable at the specified selection age when employing the Type 1 response model (Regime 1 and 2; e.g., see matrix position (1:1) in Figure A1a and Figure A1b for PImUM and Figure A3a and Figure A3b for PNbM). Conversely, a smooth continuous curve from establishment to rotation characterized the mean dominant height–age relationship when the genetic worth effect was described by the Type 2 response model (Regime 3): e.g., see matrix position (1:1) in Figure A1c for PImUM and Figure A3c for PNbM. These patterns were consistent across all site classes, initial density levels and rotation lengths. Furthermore, irrespective of the model selected, the maximum height attained for a given site class and rotation length were equivalent. Basically, the height predicted for a given age by the Type 1 and Type 2 model specifications are only different during the initial period of development before the plantations reach the specified selection age. As expected, the height calculated for a given age using the unadjusted height–age function which did not account for genetic worth effects, was always less than the adjusted heights arising from the Type 1 response model during the post-selection age period, and from the Type 2 response model over the entire rotation (c.f., matrix position (1:1) in Figure 1a vs. Figure A1a–c for black spruce or Figure A2a vs. Figure A3a–c for jack pine).

3.1.2. Site Form: Mean Dominant Height-Quadratic Mean Diameter Relationship (1:2)

Dominant height increased with quadradic mean diameter in a curvilinear (PImUN, PNbN, PImPNbN, PImLN) or linear fashion (PImUM, PNbM) with the site-specific relationship converging into a single common relationship, irrespective of initial density, rotation length, management intensity (control versus thinning), thinning response model where applicable (i.e., natural-origin stand) or genetic response model where applicable (i.e., plantations) (e.g., (1:2) in Figure 1 and Figure A1, Figure A2, Figure A3, Figure A4 and Figure A5). The convergence of the relationships among site indices, suggest the maintenance of a certain degree of structural uniformity within a given stand-type.
Interpreting the relationships within the context of height-diameter surrogate-based ratios, indicate that stand instability increased with increasing diameter, although the specific patterns differed among the stand-types. The natural-origin stand-types exhibited an asymptotic pattern where the upland stand-types produced the largest ratios and, hence, the greatest degree of instability at rotation. In contrast, the lowland stand-type produced the lowest ratios (<1) and, thus, the highest degree of stability. The patterns for plantations were more linear in form indicating that structural stability was maintained throughout the rotation. These results suggest the increased intraspecific competition and spatial pattern heterogeneity may have contributed to the greater instability within the natural-origin stand-types. Given the non-existence of site quality effects on these height-diameter relationships (i.e., lack of site-specific differentiation among curves for a given stand-type), the proposed usage of height-diameter relationships for site quality estimation [27], would be inappropriate for the stand-types evaluated in this study (see [28] for an evaluation and discussion).

3.1.3. Sukatsckew Effect: Density–Stand Age Relationship (2:1)

The Sukatsckew effect states that the rate of density-dependent mortality or self-thinning increases with site fertility [29]. These expected patterns were observed across all the stand-types irrespective of initial density and rotation length. Specifically, for a given stand-type, initial density and rotation length without thinning treatments, the (1) rate of change along the reversed-sigmoidal density-age relationships increased with increasing site quality (site index); and (2) final rotational densities were inversely related to site quality (e.g., (2:1) in Figure 1a and Figure A1a, Figure A2a, Figure A3a, Figure A4a, Figure A5a). For similar conditions but when PCT treatments were applied resulting in approximately equivalent residual densities at the time of thinning, the rate of change along the relationships immediately following thinning was similar among site qualities (i.e., the relationships converged). However, once thinned trees fully reoccupied their newly allocated growing spaces and crown interlocking recommenced, the expected Sukatachew effect re-emerged (e.g., (2:1) in Figure 1b,c and Figure A2b,c, Figure A4b,c, Figure A5b,c). In the case of the CT treatments within the plantation stand-types when residual post-treatment densities were not conditioned to be approximately equivalent, the rate of change varied directly within site quality as expected (e.g., (2:1) in Figure A1b,c and Figure A3b,c).
The Sukatsckew effect was also observable for the thinned natural-origin stands and genetically-improved thinned plantations irrespective of the time of thinning, thinning type (PCT or CT), thinning intensity (magnitude of removal), PCT thinning response model utilized (maximum or minimum within natural-origin stands) or the genetic worth response model selected (Type 1 or 2 within plantations) (e.g., (2:1) in Figure 1b,c, Figure A1b,c Figure A2b,c, Figure A3b,c, Figure A4b,c and Figure A5b,c). Note, the embedded density-dependent mortality models within the SSDMMs are conditioned to operate when stand densities exceed 800 stems/ha. This minimum threshold rule was derived from density-dependent mortality patterns observed within long-term Nelder plots [11]. Although the density-independent mortality continues irrespective of stand density, the Sukatschew effect does not apply to these non-self-thinning phases of stand development where densities fall below the specified threshold. The density-dependent mortality models utilized by the SSDMMs are based on an extension of Khil’mi’s [30] survival model where net density change is expressed as a function of age, relative density index and site quality. Consequently, the SSDMMs’ overall compliance with the Sukatsckew effect is not unexpected given the use of a mortality model of this type.

3.1.4. Reineke’s Stand Density Index: Density–Quadratic Mean Diameter Relationship (2:2)

The empirically-derived stand density index (SDI) concept proposed by Reineke [31] and used extensively in the development of silvicultural stocking guides, is based on the relationship between maximum tree size (Dq; quadratic mean diameter (cm)) and density (N (stems/ha)). This relationship is expressed as a power function: N = k 1 D q k 2 where k1 is assumed to be a stand-type, regional-based and site-independent constant whereas k2 is an universal constant empirically-determined to be equivalent to −1.605 (n., alternatively this relationship can be expressed in a linear form via a double logarithmic transformation). Thus accordingly, the density–quadratic mean diameter relationship for fully-stocked even-aged stands should be log-linear with (1) an invariant intercept for a given stand-type and region across a range of site qualities; and (2) a slope of approximately −1.6, which is invariant to stand-type, locality, species, and site differences.
Within this conceptual framework, the SSDMMs produced density–diameter patterns that could be characterized as negative exponential or reversed-sigmoidal, irrespective of stand-type, initial density or rotation length (e.g., matrix position (2:2) in Figure 1a, Figure A1a, Figure A2a, Figure A3a, Figure A4a and Figure A5a). The relationship during the post-treatment phase following the thinning treatments within both the natural-origin stands and plantations, was mostly linear and exhibited considerable convergence among the site qualities (e.g., matrix position (2:2) in Figure 1b,c and Figure A1b,c, Figure A2b,c, Figure A3b,c, Figure A4b,c and Figure A5b,c). However, during the early stages of development when the stands were not at full stocking and not undergoing self-thinning, the degree of convergence among the site qualities was largely a function of initial density. As the level of site occupancy and density-stress increased either through the effect of higher establishment densities or the natural progression of increasing site occupancy via biomass accumulation, the greater the convergence of the density–diameter relationships among the site qualities. However, complete convergence was rare. The following ranking reflects the degree of convergence achieved among the stand-types: PImUM > PNbM > PImUN > PNbN > PImPNbN >> PImLN (c.f., matrix position (2:2) in Figure A1a, Figure A2a, Figure 1a, Figure A2a, Figure A4a and Figure A5a, respectively). Of note was the relationship for the lowland stand-type, which was quite different from the other stand-types. Specifically, the density-diameter relationships exhibited a significant degree of non-convergence in which the density for a given diameter decreased with declining site quality (e.g., (2:2) in Figure A5a).
These results suggest that site quality, and to a lesser degree stand purity, may be influencing the relationship through the conceptually site-independent intercept parameter (k1). These patterns also infer that site quality may be influencing the occupancy level that a stand can achieve. Essentially, the patterns indicate that the greater the site quality, the more trees that a site can accommodate for a given mean tree size, and, hence, a greater level of occupancy is achievable. Similar findings have been reported for self-thinning coastal Douglas fir (Pseudotsuga menziesii var. menziesii (Mirb.) Franco), western hemlock (Tsuga heterophylla (Raef.) Sarg.) and red alder (Alnus rubra Bong.) stands in that the intercept parameter was affected by stand origin (natural-origin versus planted), degree of monospecificity (purity) and site quality [32].

3.1.5. Spacing Percent: Density–Mean Diameter Height Relationship (2:3)

Relative spacing (Rs) is a species, age, and site independent index used to regulate stand densities and develop thinning schedules (e.g., Wilson [33,34]). It is based on the empirically-derived relationship between mean intertree spacing and mean dominant height (Hd) and is expressed as a ratio: R s = ( 10000 / N ) 1 / 2 / H d where N is stand density (stems/ha). The relationship is most applicable to stands with square spatial arrangements. It is also considered conceptually superior to diameter-based indices such as Reineke’s [31] SDI given that mean dominant height is not affected by density treatments and incorporates both site quality and age effects into a single variable. The temporal trend of Rs within even-aged stands is governed by the relationship between mean dominant height increment and mortality. Hence, prior to the initiation of self-thinning, changes in Rs can be attributed to height growth. During the post-crown closure period, however, both the mortality rate and height growth are simultaneously influencing the ratio. Rs is hypothesized to follow a log-linear pattern and is expected to decline rapidly once stands approach the 10%–12% threshold values [14]. For a given stand-type, initial density, and rotation length, the SSDMMs produced density–height trajectories which were reversed-sigmoidal in shape (PImUN; e.g., (2:3) in Figure 1a or negative exponential (PImUM, PNbN, PNbM, PImPNbN and PImLN; e.g., (2:3) in Figure A1a, Figure A2a, Figure A3a, Figure A4a and Figure A5a, respectively). The relationships also tended to inflect at a mean Rs of approximately 10%. Post-thinning trends in Rs within the natural-origin stands were characterized by a negative parabolic pattern of decline, irrespective of initial density, rotation length or thinning response model utilized (e.g., (2:3) in Figure 1b,c and Figure A2b,c, Figure A4b,c, and Figure A5b,c). The pattern of decline in Rs within the plantation stand-types during the post-thinning period were largely negative exponential in form and convergent among site qualities, irrespective of initial density, rotation length or the genetic worth effect model used (e.g., (2:3) in Figure A1b,c and Figure A3b,c).
However, with the exception of the CT plantations, contrary to expectation, the site-specific trajectories exhibited varying degrees of convergence depending on the initial density and stand-type. Specifically, convergence varied directly with increasing initial density levels and by stand-type: PImUN > PNbN ≈ PImUM ≈ PNbM > PImPNbN >> PImLN (c.f., (2:3) in Figure 1a–c and Figure A2a–c, Figure A1a, Figure A3a, Figure A4a–c, and Figure A5a–c, respectively). The trajectories differentiated according to site quality with the more productive sites exhibiting a greater tolerance of density-stress as evident by a shift in the inflection point at which Rs rapidly declined (e.g., moving from a minimum of 7%–8% on the poorest sites to a maximum of 13%–14% on the best sites). The site-dependent final Rs values also increased with increasing site quality. These patterns are generally consistent with those reported for other species: e.g., loblolly (Pinus taeda L.) plantations in the Southern US where the lower asymptotic limit of Rs was found to increase in a linear fashion with increasing site quality [35].

3.1.6. Temporal Production Patterns: Basal Area (3:1), Total Volume (4:1) and Merchantable Volume (5:1)–Age

For the untreated and treated natural-origin stand-types and unthinned plantations, basal area increased with age in a sigmoidal fashion. Although varying by initial density and rotation age, stand basal area development patterns were consistent: attained a maximum asymptotic and then slightly declining (e.g., (3:1) in Figure 1a and Figure A1a, Figure A2a, Figure A3a, Figure A4a and Figure A5a). The rate of increase varied directly with site quality for all stand-types, initial densities and rotation lengths. The asymptotic values attained varied directly with site quality, initial density and rotation length (e.g., (3:1) in Figure 1b,c and Figure A2b,c, Figure A4b,c, and Figure A5b,c). For the CT plantations, a saw-tooth pattern was clearly visible at the time of treatment. The post thinning basal area -age trajectories separated out by site quality class (e.g., (3:1) in Figure A1b,c and Figure A3b,c). However, contrary to the natural-origin stands, the temporal decline in basal area was not as evident as the thinned plantations approached rotation age. Temporary genetic worth effects were notable at the specified selection age for both plantation species (15 and 20 years for black spruce and jack pine, respectively (Table 1)), clearly exhibiting an instantaneous increase in site occupancy. In cases were stand densities fell below the 800 stems/ha threshold at which point, density-dependent mortality was assumed to cease, basal area production increased. However, this effect was restricted to the better site qualities with longer rotation lengths. Similar patterns were observed for the total volume–age relationships although the post-full-occupancy declines were not as dramatic (e.g., (4:1) in Figure 1a–c and Figure A1a–c, Figure A2a–c, Figure A3a–c, Figure A3a–c and Figure A5a–c).
The initiation of the merchantable volume–age relationship exhibited a temporal delay in which the duration varied inversely with site quality irrespective of stand-type, rotation length, thinning treatment, thinning response model or genetic response model (e.g., [3:1] in Figure 1a–c and Figure A1a–c, Figure A2a–c, Figure A3a–c, Figure A4a–c and Figure A5a–c). Only on the highest quality sites and for the longest rotation lengths did merchantable volume exhibite a decline. Although the temporal trends largely mimicked the total volume production patterns, the initiation of the merchantable volume–age relationship was frequently characterized as a jump-like increase from zero to some substantial level of merchantable volume. An infrequently observed departure from expectation occurred for the mixed stand-type during the beginning stages of merchantable volume production. In these cases, the merchantable volume initially started to increase but then ceased for brief period of time and subsequently resumed its expected pattern for the duration of the rotation. These patterns are partially attributed to a modelling-based artifact inherent to the underlying SSDMMs. Specifically, merchantable volume estimation requires the recovery of the diameter distribution from stand-level variables via a parameter prediction equation system [19]. Hence merchantable volume was predicted to be zero when the diameter distribution could not be recovered due either to the lack of the formulation of a density-dependent stand structure or the equation system could not predict the distribution to the level of accuracy required. For example, the quadratic mean diameter calculated from the recovered diameter distribution had to be within 25% of that predicted by the diameter-based competition effect equation (e.g., Equation (A4) in [11]). Consequently, the patterns predicted by the SSDMMs at the start or soon after the first evidence of merchantable volume production occurs, are somewhat contrary to expectation. For example, the merchantable volume-age pattern should be characterized by a continuous smooth trend over the entire rotation. The overall effect of not recovering the diameter distribution is that merchantable volume production may be briefly underestimated during this early phase of stand development.

3.1.7. Yield Interrelationships: Basal Area (3:2), Total Volume (4:2) and Merchantable Volume (5:2)—Quadratic Mean Diameter

The relationship between stand basal area (G) and quadratic mean diameter (Dq) is inherently non-linear and density-dependent: G D q 2 N . Similarly, for a given stage of stand development as defined by Lohey’s mean height (HL), total stand volume (Vt) and merchantable stand volume (Vm) vary directly with Dq and N for a given HL: V t , m G H L D q 2 N H L . For the untreated and treated natural-origin stand-types and unthinned plantations irrespective of initial density, rotation length and thinning model utilized, G, Vt and Vm increased with increasing Dq (e.g., (3:2; 4:2; 5:2) in Figure 1a–c and Figure A1a, Figure A2a–c, Figure A3a, Figure A4a–c, and Figure A5a–c). For a given stand-type, initial density, rotation length, thinning treatment and response model, G, Vt and Vm initially followed identical concave non-linear trajectories until self-thinning commenced after which they diverged according to site quality. The basal area attained at the point of divergence directly varied with site quality. The post-divergence pattern could be characterized as a concave non-linear trend in which the asymptotic basal area attained and that achieved at rotation varied directly with site quality. The G-Dq, Vt-Dq and Vm-Dq relationships for the thinned plantations exhibited similar site-dependent non-linear trajectories as did the natural-origin stand-types (e.g., (3:2; 4:2; 5:2) in Figure A1b,c and Figure A3b,c)). However, there was a higher degree of convergence among site qualities for a given initial density, rotation length, genetic worth effect model and thinning regime. Furthermore, the post-thinning trajectories shared a common developmental pathway where the asymptotic values attained at rotation varied directly with site quality. This convergence is likely attributed to the effect of the CT treatments which reduced stand basal areas by 35% (Table 1) resulting in the absence of self-thinning effects as opposed to that observed for the natural-origin stands and unthinned plantation trajectories.

3.1.8. Eichhorn’s Rule: Basal Area (3:3), Total Volume (4:3) and Merchantable Volume (5:3)–Mean Dominant Height

Eichhorn (1902, as cited in Pretzsch [36]) observed that the total stand volume for a given mean stand height was constant across a range of site classes within Silver Fir (Abies alba Mill) stands in Europe. Supplementary evidence provided for other species (e.g., Norway Spruce (Picea abies (L.) Karst.); Gehrhardt (1923, as cited in Pretzsch [36])), led to the acceptance of this observational-based inference as an axiom of even-aged stand development. However, others have provided evidence that the total stand volume for a given stand height does vary for some species [37]. Consequently, a slightly revised rule has been proposed: for a given yield or site class grouping, total stand volume for a given stand height is approximately constant. Considering the functional interrelationships between total volume, basal area and merchantable volume, Eichhorn’s rule and its derivatives should be applicable to both stand basal area and total stand merchantable volume production. Thus according to the these hypotheses, each of the site-specific G-Hd, Vt-Hd and Vm-Hd trajectories for a given stand-type, initial density, rotation length, thinning regime, and thinning or genetic worth effect response model, should (1) converge and exhibit a single site-independent sigmoidal trajectory (Eichhorn’s rule or equivalently, Assmann’s (1961a, as cited in Pretzsch [36]) common yield level hypothesis); or (2) diverge into multiple sigmoidal trajectories differentiated by broad site quality groupings (Assmann’s, 1961a, as cited in Pretzsch [36]) special yield level hypothesis).
Assessing the resultant trends revealed convergence among site qualities throughout the majority of the rotation for all three relationships for all six stand-types (e.g., (3:3; 4:3; 5:3) in Figure 1a–c and Figure A1a–c, Figure A2a–c, Figure A3a–c, Figure A4a–c and Figure A5a–c). Overall, for a given stand-type, initial density, rotation length, thinning regime, thinning or genetic worth effect response model and relationship, the trajectories for the range of site indices examined could be characterized as follows: a single sigmoidal trajectory which initially exhibited a concave type increase, then a substantial period of linearity followed by a brief period in which the trajectories illustrated either a linear increase or a convex type decline and then slightly diverging from each other. The mean dominant height at the time of divergence varied directly with site quality, as did the maximum level of production attained. The post-thinning CT trajectories exhibited the highest degree of convergence and lacked the convex like declines or the site-dependent differentiation that was observed for the other stand-types. The mixed stand-type exhibited and greatest degree of differentiation at the later stages of development whereas the unthinned plantation stand-types showed the least.
These results are mostly consistent with those predicted by Eichhorn’s rule: stand level production for a given stand height is constant across site qualities. However, the production patterns did depart from expectation at the late stages of stand development and the degree of departure did vary by stand-type, initial density, rotation length, and site quality. Once the natural-origin stands and unthinned plantations achieved an asymptotic level of site occupancy and became over-stocked, the departures and subsequent production declines were more evident. It could be inferred that once stands achieved a state of full site occupancy, further increases in density-stress elicit a production decline through reduced growth rate and accelerated site-dependent self-thinning (sensu Sukatsckew effect), rending the Eichhorn rule inapplicable to this developmental phase (post full occupancy).

3.1.9. Reciprocal Yield Effect Relationships: Basal Area (3:4), Total Volume (4:4) and Merchantable Volume (5:4)—Stand Density

Yield-density effect relationships derived empirically from long-term field experimentation and conceptually supported from population biology and ecology constructs, predict that production patterns within forest stands are asymptotic, site-specific and density-dependent. Thus assessing the site-specific G-N, Vt-N and Vm-N trajectories (right to left along the x-axis) for a given stand-type, initial density, rotation length, thinning regime, and thinning or genetic worth effect response model, revealed similarities: site-dependent linear (lower site qualities) to polymorphic (higher site qualities) increases in production as density declined (e.g., (3:4; 4:4; 5:4) in Figure 1a–c and Figure A1a–c, Figure A2a–c, Figure A3a–c, Figure A4a–c and Figure A5a–c). These declines are attributable to self-thinning and density-independent causal mortality agents. The asymptotic yields achieved varied directly with site quality whereas the final densities surviving at rotation were inversely related to site quality. This latter observation combined with the fact that the trajectories differentiated on the basis of site quality are partially attributed to the Sukatsckew effect (i.e., mortality rates increased with increasing site quality).

3.1.10. Density-dependent Effects on Volumetric Production: Total Volume (4:5) and Merchantable Volume (5:5)–Relative Density Index.

Conceptually, the relationship between volumetric production and density-stress should exhibit non-linearity and site-independence. Specifically, for a given stand-type, initial density, rotation length, thinning regime, and thinning or genetic worth effect response model, the site-specific trajectories should converge into a common relationship and achieve equivalent levels of maximum site occupancy (delineated by the relative density value of unity) when stand densities, site quality and rotation length conditions, allow such maximization to occur. Thereafter the trajectories should follow a pattern consistent with that predicted by the self-thinning rule where relative densities should not deviate from the theoretical maximum value of unity until the site’s carrying capacity is exceeded.
Examining the site-specific relationships between volume production and relative density index (Pr; Vt-Pr and Vm-Pr trajectories) for each stand-type, initial density, rotation length, thinning regime, and thinning or genetic worth effect response model, indicated that the patterns observed for the natural-origin stand-types and the unthinned plantations, were not consistent with expectation (e.g., (5:4; 5:5) in Figure 1a–c), Figure A1a, Figure A2a–c, Figure A3a, Figure A4a–c, and Figure A5a–c)). Specifically, a site-dependent density effect was clearly evident in terms of the maximum level of volumetric production achieved as density-stress increased. Essentially, the inference is that stands on better sites can withstand greater levels of density-stress before incurring production declines and are able to get closer to their biological maximum levels of production than stands on poorer sites. Furthermore, once stands experience their site-dependent maximum level of density-stress, the subsequent trajectories were also contrary to that predicted by self-thinning theory (i.e., relative density indices declined). Although the patterns for the CT plantations exhibit similar trends, the trajectories did not exhibit the same degree of site-dependency as observed for the other stand conditions (e.g., (5:4; 5:5) in Figure A1b,c and Figure A3b,c). Most plausibly because the thinning treatments occurred before stands achieved their site-dependent maximum density-stress levels and hence the asymptotic effects were not fully manifested.
Revisiting the underlying relationship that was used to quantify relative density-stress, in light of these results (i.e., the self-thinning rule), suggest that intercept term of the self-thinning rule may be influenced by site quality. The procedure used to calibrate the relationships employed state-of-the-art data selection protocols and parameterization methods [18]: selecting the maximum mean volume for a given density class from large data sets of stands incurring density-dependent mortality, and subsequently parameterized the self-thinning equation using bisector regression analysis. Thus, if the asymptotic mean volume–density relationship is influence by site quality, then higher site qualities may have been over-represented during the fitting process which may have positively-biased the intercept parameter estimate. The observed patterns of site-dependent asymptotic occupancy levels are in accord with this inference.

3.2. Site-Dependent Occupancy Effects on Productivity

Variance with expectation in which discrepancies between model predictions and accepted ecological constructs are observed, affords an opportunity to revisit the underlying principles in terms of their universal applicability [27]. The results of this study indicated that the SSDMMs predicts that stands on more productive sites can attain higher asymptotic levels of relative site occupancy when compared to stands on less productive sites. This may be partially attributed to a misspecification of the maximum size-density relationships underlying Reineke’s [31] stand density index and Drew and Flewelling’s [2] relative density index for which the parameters are assumed to be site invariant. However, the breakdown of a number of the conceptual relationships observed at asymptotic density-stress levels may reflect a certain degree of broader inapplicability in relation to the site invariance assumption underlying these yield-density relationships.
The simulation results provided evidence of site-dependent effects on Reineke’s [31] SDI, Yoda’s [17] self-thinning rule, Wilson’s [33,34] relative spacing index, and Eichhorn’s rule. Essentially, the patterns derived from the SSDMMs suggest that the greater the site quality, the more trees that a site can accommodate for a given mean tree size, and hence the greater the level of occupancy that can be achieved. Although these departures are contrary to the original formulations of these theoretical constructs, site-dependent effects on asymptotic occupancy levels have been documented for a number of species. Specifically, in reference to the asymptotic quadratic mean diameter (Dq)-density (N) relationship underlying Reineke’s [31] SDI ( N ) = α 1 D q α 2 where α1 is a species-specific constant and α2 is an empirically-determined universal constant equal to −1.6), and the mean volume ( v ¯ ) -density relationship underlying Yoda’s [17] self-thinning rule ( v ¯ ) = β 1 N β 2 here β1 is a species-specific constant and β2 is an empirically-determined universal constant equal to −1.5): (1) Weiskittel [32] reported that the intercept (α1) of the asymptotic Dq-N relationship for self-thinning coastal Douglas fir (Pseudotsuga menziesii var. menziesii (Mirb.) Franco), western hemlock (Tsuga heterophylla (Raef.) Sarg.) and red alder (Alnus rubra Bong.) stands was positively correlated with site quality for all three species; (2) similarly, Zhang [38] found that the intercept (α1) of the asymptotic Dq-N relationship for self-thinning ponderosa pine (Pinus ponderosa Lawson and C. Lawson) stands varied directly with site index; and (3) Bi’s [39] re-analysis of Yoda’s [17] classical experiments which were used to establish the generality of the original self-thinning rule, revealed that the intercept parameter (β1) of the asymptotic v ¯ N relationship increased with increasing site fertility. In relation to the site-dependent nature of the density–mean dominant height (Hd) relationship ( N H d 2 ) underlying Wilson’s [33,34] relative spacing index, Zhao [35] reported the lower asymptotic limit of relative spacing within loblolly (Pinus taeda L.) plantations varied directly with site quality, and hence was similar to the trends observed in this study.
The underlying mathematical relationships associated with Yoda’s [17] self-thinning rule, Reineke’s [31] stand density index and Wilson’s [33,34] relative spacing index can be shown to be interrelated. Specifically, logarithmically transforming Yoda’s [17] self-thinning rule and solving for logeN and assuming that v ¯ = k 1 D q 1.6 [40], yields the approximation: log e N = log e k 1 2 3 log e v ¯ log e k 1 2 3 log e D q 2.4 where k 1 = ( β 1 1 ) 1 / β 2 which, when retransformed to an arithmetic formulation, approximates Reineke’s [31] underlying N-Dq relationship: N k 1 ( D q 2.4 ) 2 / 3 k 1 D q 1.6 . Likewise, assuming the height-diameter allometric relationship for excurrent forest tree species is H d = k 2 D d 0.8 [41] within the context of Wilson’s [33,34] relative spacing underlying relationship N = k 3 H d 2 , yields the approximation, N k 3 ( k 2 D q 0.8 ) 2 k 4 D q 1.6 where k 4 = k 2 2 k 3 . Hence, it is plausible to find similarities among the three indices in terms of their site dependences at asymptotic occupancy levels given the intrinsic functional relationships that exists among them.

3.3. Ecological Integrity of SDMD-Type Models: A Broader Discussion

Based on the evaluation of the resultant patterns generated from 1980 simulations using modified Bakuzis-based graphical matrices, the six stand-type-specific structural stand density management models performed well in terms of the biological reasonableness of their predictions: i.e., most of which were in agreement with known ecological axioms derived from even-aged stand dynamics. Specifically, the mean dominant height–age trajectories were in compliance with response model expectations (e.g., accelerate rates of development for PCT treated stands and genetically-modified plantations), in addition to conforming to site productive axioms applicable to even-aged stand development (e.g., asymptotic-like and polymorphic-shaped site-dependent temporal trajectories). Similarly, site form predictions were consisted with expectation, i.e., dominant height increased with increased quadratic mean diameter converging into a single common relationship. The expected Sukatsckew effect in which the temporal rate of density-dependent mortality or self-thinning increases with site fertility was observed across all stand-types irrespective of initial densities or rotation lengths. Similarly, the majority of the yield–height relationships predicted by Eichhorn’s rule were observed. The temporal production patterns in stand-level yields and their interrelationships were also consistent with expectation.
The notable departure of the prediction patterns from expectation related to possible site quality influences on asymptotic diameter–density relationships with respect to Reineke’s [31] stand density index concept, diameter–height patterns in regards to Wilson’s [33,34] spacing percent concept, reciprocal yield effect relationships, and density-dependent effects on volumetric production. Specifically, the results suggested that stands on better sites could withstand greater levels of density-stress before incurring production declines and hence were able to attain higher levels of production than stands situated on poorer sites. Given that these effects have been previously observed for some species as reported in the literature, suggest that the relationships utilized in the SSDMMs are not necessarily deficient. Conversely, it may be the underlying axiom and their associated assumptions that may require revision. Additional research is warranted in order to re-assess universality of these specific hypotheses.
The scope of the evaluation of the SSDMMs was concentrated on the driving underlying relationships which are the principal determinates affecting temporal patterns of structural change and overall stand dynamics. These primary relationships are common to a wide range of dynamic SDMDs. Consequently, the results may have boarder utility in terms of the biological validity of the overall modelling approach. Jack and Long [12] reviewed the ecological foundation of some of these determinates within the context of SDMDs. They identified three broad ecological concepts which characterize SDMDs: (1) generality of the assumption that the species-specific allometric relationships utilized by the SDMD provide acceptable stand-average predictions of stand structure and yield; (2) site-independence of the asymptotic size-density relationships; and (3) universality of the proposition that site occupancy as quantified by relative density index is unaffected by age, site quality or density differences. They concluded that SDMDs were consistent with ecological expectations with the exception of site-independence assumption underlying the self-thinning rule. This inference is similar to that found in this study and other results reported in the literature, in that, asymptotic site occupancy levels may vary with site quality (e.g., [32,38]).
The SSDMMs along with most SDMDs employ a three-dimensional relative density index to quantify site occupancy (e.g., [2]). Given that relative density index is mathematically derived from the asymptotic size-density relationship (e.g., self-thinning rule), confounding effects may occur. For example, for a given size-density condition, stands on poorer sites which may have a lower asymptotic size-density relationship due to the site quality effects and hence, may be incur greater density-stress effects relative to comparable stands on better site qualities. Analytically, this modeling deficiency may not be too difficult to rectify given that it is principally the location and not the species-specific slope of the asymptotic size-density relationship that may be influenced by site quality. A relativity simple statistical solution for explicitly accounting for site quality effects would be to express the intercept term as a function of site index within these asymptotic relationships.
In summary, based on all the ecological elements assessed combined with confirmatory support from the literature [12,42], and in light of the departure from expectation in regards to site quality influences on asymptotic yield-density relationships, it is concluded that SDMD-based decision-support models in general and SSDMMs in particular have a sound and strong ecological basis in that stand development patterns derived from such models conforms well to globally accepted axioms of even-aged stand dynamics.

4. Conclusions

SSDMMs incorporate a number of individual functional relationships derived from forest production theory and quantitative ecology. However, the ecological integrity of the resultant stand development patterns arising from these relationships when collectively integrated within SSDMMs had not been previously assessed until this study was undertaken. Apart from the observed site quality effect on asymptotic size-density relationships which may be partially attributed to a theoretical-based misspecification of the underlying self-thinning model, the lack of inconsistency between predicted developmental patterns derived from these models and those expected from known ecological axioms derived from even-aged stand dynamics theoretical constructs, firmly solidifies the ecological foundation of the SSDMMs. Furthermore, this study also exemplified the utility of the Bakuzis graphical approach for evaluating the ecological integrity of stand-level forest yield models. Although determination of the precision and accuracy of empirical predictions are also critical elements of the model evaluation process, particularly in relation to operational deployment considerations, determining the ecological integrity of SSDMMs is of equal importance.

Acknowledgments

The author expresses his appreciation to Bharat Pokharel of Nippissing University, North Bay, Ontario, Canada for the preparatory work in regards to the production of the Bakuzis graphical matrices. Fiscal support from the Canadian Wood Fibre Centre is gratefully acknowledged.

Appendix

Figure A1. Bakuzis matrices for genetically-improved unthinned and commercially thinned (CT) upland black spruce (Sb) plantations (P) which were established at an initial densities of 2500 stems/ha and grown on 5 site qualities (SI) over 70 year rotations: (a) Regime 1 represented unthinned plantations in which genetic worth effects were described by the Type 1 response model; (b) Regime 2 was initially identical to Regime 1 and employed the same response model, however, the plantations were subjected to a single CT treatment at a stand age of 45 years in which the basal areas were reduced by 35%; and (c) Regime 3 was identical to Regime 2 but used the Type 2 response model to account for genetic worth effects.
Forests 06 00992 g002aForests 06 00992 g002bForests 06 00992 g002c
Figure A2. Bakuzis matrices for unthinned and precommercially thinned (PCT) jack pine (Pj) stands which were established naturally (N) at an initial densities of 7000 stems/ha and grown on 5 site qualities (SI) over 100 year rotations: (a) Regime 1 represented unthinned control stands; (b) Regime 2 was initially identical to Regime 1 but the stands were subjected to a single PCT treatment at a stand age of 10 years in which stand densities were reduced to 2862 stems/ha and the maximum thinning response model setting was employed; and (c) Regime 3 was identical to Regime 2 but the stands utilized the minimum thinning response model to account for accelerated growth arising from the PCT treatment.
Forests 06 00992 g003aForests 06 00992 g003bForests 06 00992 g003c
Figure A3. Bakuzis matrices for genetically-improved unthinned and commercially thinned (CT) jack pine (Pj) plantations (P) which were established at an initial densities of 2500 stems/ha and grown on 5 site qualities (SI) over 70 year rotations: (a) Regime 1 represented unthinned plantations in which genetic worth effects were described by the Type 1 response model; (b) Regime 2 was initially identical to Regime 1 and employed the same response model, however, the plantations were subjected to a single CT treatment at a stand age of 45 years in which the basal areas were reduced by 35%; and (c) Regime 3 was identical to Regime 2 but used the Type 2 response model to account for genetic worth effects.
Forests 06 00992 g004aForests 06 00992 g004bForests 06 00992 g004c
Figure A4. Bakuzis matrices for unthinned and precommercially thinned (PCT) black spruce and jack pine mixed stands which were established naturally (N) at an initial densities of 7000 stems/ha and grown on 5 site qualities (SI) over 100 year rotations: (a) Regime 1 represented unthinned control stands; (b) Regime 2 was initially identical to Regime 1 but the stands were subjected to a single PCT treatment at a stand age of 10 years in which stand densities were reduced to 2862 stems/ha and the maximum thinning response model setting was employed; and (c) Regime 3 was identical to Regime 2 but the stands utilized the minimum thinning response model to account for accelerated growth arising from the PCT treatment.
Forests 06 00992 g005aForests 06 00992 g005bForests 06 00992 g005c
Figure A5. Bakuzis matrices for unthinned and precommercially thinned (PCT) lowland black spruce (Sb) stands which were established naturally (N) at an initial densities of 7000 stems/ha and grown on 5 site qualities (SI) over 100 year rotations: (a) Regime 1 represented unthinned control stands; (b) Regime 2 was initially identical to Regime 1 but the stands were subjected to a single PCT treatment at a stand age of 10 years in which stand densities were reduced to 2862 stems/ha and the maximum thinning response model setting was employed; and (c) Regime 3 was identical to Regime 2 but the stands utilized the minimum thinning response model to account for accelerated growth arising from the PCT treatment.
Forests 06 00992 g006aForests 06 00992 g006bForests 06 00992 g006c

Conflicts of Interest

The author declares no conflict of interest.

References

  1. Ando, T. Growth analysis on the natural stands of Japanese red pine (Pinus densiflora Sieb. et. Zucc.). II. Analysis of stand density and growth. Government of Japan. Bull. Govern. For. Exp. Stat. 1962, 147, 77. (In Japanese) [Google Scholar]
  2. Drew, T.J.; Flewelling, J.W. Stand density management: An alternative approach and its application to Douglas-fir plantations. For. Sci. 1979, 25, 518–532. [Google Scholar]
  3. Newton, P.F. Stand density management diagrams: Review of their development and utility in stand-level management planning. For. Ecol. Manag. 1997, 98, 251–265. [Google Scholar] [CrossRef]
  4. Porté, A.; Barlelink, H.H. Modelling mixed forest growth: A review of models for forest management. Ecol. Model. 2002, 150, 141–188. [Google Scholar] [CrossRef]
  5. Newton, P.F. Yield prediction errors of a stand density management program for black spruce and consequences for model improvement. Can. J. For. Res. 2003, 33, 490–499. [Google Scholar] [CrossRef]
  6. Barbour, R.J.; Kellogg, R.M. Forest management and end-product quality: A Canadian perspective. Can. J. For. Res. 1990, 20, 405–414. [Google Scholar] [CrossRef]
  7. Emmett, B. Increasing the value of our forest. For. Chron. 2006, 82, 3–4. [Google Scholar] [CrossRef]
  8. Newton, P.F. Development of an integrated decision-support model for density management within jack pine stand-types. Ecol. Model. 2009, 220, 3301–3324. [Google Scholar] [CrossRef]
  9. Newton, P.F. Development and utility of an ecological-based decision-support system for managing mixed coniferous forest stands for multiple objectives. In Ecological Modeling; Zhang, W.-J., Ed.; Nova Science Publishers Inc.: New York, NY, USA, 2012; pp. 100–160. [Google Scholar]
  10. Newton, P.F. A silvicultural decision-support algorithm for density regulation within peatland black spruce stands. Comput. Electron. Agric. 2012, 80, 115–125. [Google Scholar] [CrossRef]
  11. Newton, P.F. A decision-support system for density management within upland black spruce stand-types. Environ. Model. Softw. 2012, 35, 171–187. [Google Scholar] [CrossRef]
  12. Jack, S.B.; Long, J.N. Linkages between silviculture and ecology: An analysis of density management diagrams. For. Ecol. Manag. 1996, 86, 205–220. [Google Scholar] [CrossRef]
  13. Vanclay, J.K.; Henry, N.B. Assessing site productivity of indigenous cypress pine forest in southern Queensland. Commonw. For. Rev. 1988, 67, 53–64. [Google Scholar]
  14. Leary, R.A. Testing models of unthinned red pine plantation dynamics using a modified Bakuzis matrix of stand properties. Ecol. Model. 1997, 98, 35–46. [Google Scholar] [CrossRef]
  15. Kira, T.; Ogawa, H.; Sakazaki, N. Intraspecific competition among higher plants. I. Competition-yield-density interrelationship in regularly dispersed populations. J. Instit. Polytechn. Ser. D 1953, 4, 1–16. [Google Scholar]
  16. Shinozaki, K.; Kira, T. Intraspecific competition among higher plants. VII. Logistic theory of the C-D effect. J. Instit. Polytechn. Ser. 1956, 12, 69–82. [Google Scholar]
  17. Yoda, K.; Kira, T.; Ogawa, H.; Hozumi, K. Self-thinning in overcrowded pure stands under cultivated and natural-origin conditions. J. Biol. 1963, 14, 107–129. [Google Scholar]
  18. Newton, P.F. Asymptotic size–density relationships within self-thinning black spruce and jack pine stand-types: Parameter estimation and model reformulations. For. Ecol. Manag. 2006, 226, 49–59. [Google Scholar] [CrossRef]
  19. Newton, P.F.; Amponsah, I.G. Comparative evaluation of five height–diameter models developed for black spruce and jack pine stand-types in terms of goodness-of-fit, lack-of-fit and predictive ability. For. Ecol. Manag. 2007, 247, 149–166. [Google Scholar] [CrossRef]
  20. Newton, P.F.; Amponsah, I.G. Evaluation of Weibull-based parameter prediction equation systems for black spruce and jack pine stand types within the context of developing structural stand density management diagrams. Can. J. For. Res. 2005, 35, 2996–3010. [Google Scholar] [CrossRef]
  21. Lambeth, C.M. Juvenile-mature correlations in Pincaceae and implications for early selection. For. Sci. 1980, 26, 571–580. [Google Scholar]
  22. Carmean, W.H.; Hazenberg, G.; Deschamps, K.C. Polymorphic site index curves for black spruce and trembling aspen in northwest Ontario. For. Chron. 2006, 82, 231–242. [Google Scholar] [CrossRef]
  23. Carmean, W.H.; Niznowski, G.P.; Hazenberg, G. Polymorphic site index curves for jack pine in Nothern Ontario. For. Chron. 2001, 77, 141–150. [Google Scholar] [CrossRef]
  24. Newton, P.F. Base-age invariant polymorphic height growth and site index equations for peatland black spruce stands. North. J. Appl. For. 2008, 25, 202–210. [Google Scholar]
  25. R-Development Core Team. R: A Language and Environment for Statistical Computing. Available online: http://www.R-project.org/ (accessed on 1 February 2014).
  26. Johnson, G.; Hamlin, D. Bakuzis Matrix Graphing Package. 2007. Available online: http://www.growthmodel.org/papers/followup/followup.htm#Greg_Johnson_12_05 (accessed on 1 September 2013).
  27. Vanclay, J.K.; Skovsgaard, J.P. Evaluating forest growth models. Ecol. Model. 1997, 98, 1–12. [Google Scholar] [CrossRef]
  28. Wang, G.G. Is height of dominant trees at a reference diameter an adequate measure of site quality? For. Ecol. Manag. 1998, 112, 49–54. [Google Scholar] [CrossRef]
  29. Harper, J.L. Population Biology of Plants; Academic Press: London, UK, 1977; p. 892. [Google Scholar]
  30. Khil’mi, G.F. Theoretical Forest Biogeophysics; Academy of Sciences of the USSR (Translated from Russian by the National Science Foundation): Washington, DC, USA, 1957. [Google Scholar]
  31. Reineke, L.H. Perfecting a stand-density index for even-aged forests. J. Agric. Res. 1933, 46, 627–638. [Google Scholar]
  32. Weiskittel, A.; Gound, P.; Temesgen, H. Source of variation in the self-thinning boundary line for three species with varying levels of shade tolerance. For. Sci. 2009, 55, 84–93. [Google Scholar]
  33. Wilson, F.G. Numerical expression of stocking in terms of height. J. For. 1946, 44, 758–761. [Google Scholar]
  34. Wilson, F.G. Thinning as an orderly discipline: A graphic spacing schedule for red pine. J. For. 1979, 77, 483–486. [Google Scholar]
  35. Zhao, D.; Kane, M.; Borders, B.E. Development and applications of the relative spacing model for loblolly pine plantations. For. Ecol. Manag. 2010, 259, 1922–1929. [Google Scholar] [CrossRef]
  36. Pretzsch, H. Forest Dynamics, Growth and Yield; Springer Verlag: Berlin, Germany, 2009; p. 664. [Google Scholar]
  37. Assmann, E. The Principles of Forest Yield Study; Pergamon Press: Oxford, UK; New York, NY, USA, 1970; p. 506. [Google Scholar]
  38. Zhang, J.; Oliver, W.W.; Powers, R.F. Reevaluating the self-thinning boundary line for ponderosa pine (Pinus ponderosa) forests. Can. J. For. Res. 2013, 43, 963–971. [Google Scholar] [CrossRef]
  39. Bi, H. Stochastic frontier analysis of a classic self-thinning experiment. Austr. Ecol. 2004, 29, 408–417. [Google Scholar] [CrossRef]
  40. Bredenkamp, B.V.; Burkhart, H.E. An examination of spacing indices for Eucalyptus grandis. Can. J. For. Res. 1990, 20, 1909–1916. [Google Scholar] [CrossRef]
  41. Curtis, R.O. Stand density measures: An interpretation. For. Sci. 1970, 16, 517–534. [Google Scholar]
  42. Long, J.N.; Vacchiano, G. A comprehensive framework of forest stand property–density relationships: Perspectives for plant population ecology and forest management. Ann. For. Sci. 2014, 71, 325–335. [Google Scholar] [CrossRef]

