
LAI Variability as a Habitat Feature Determining Reptile Occurrence: A Case Study in Large Forest Complexes in Eastern Poland


Abstract
:1. Introduction
2. Data and Methods
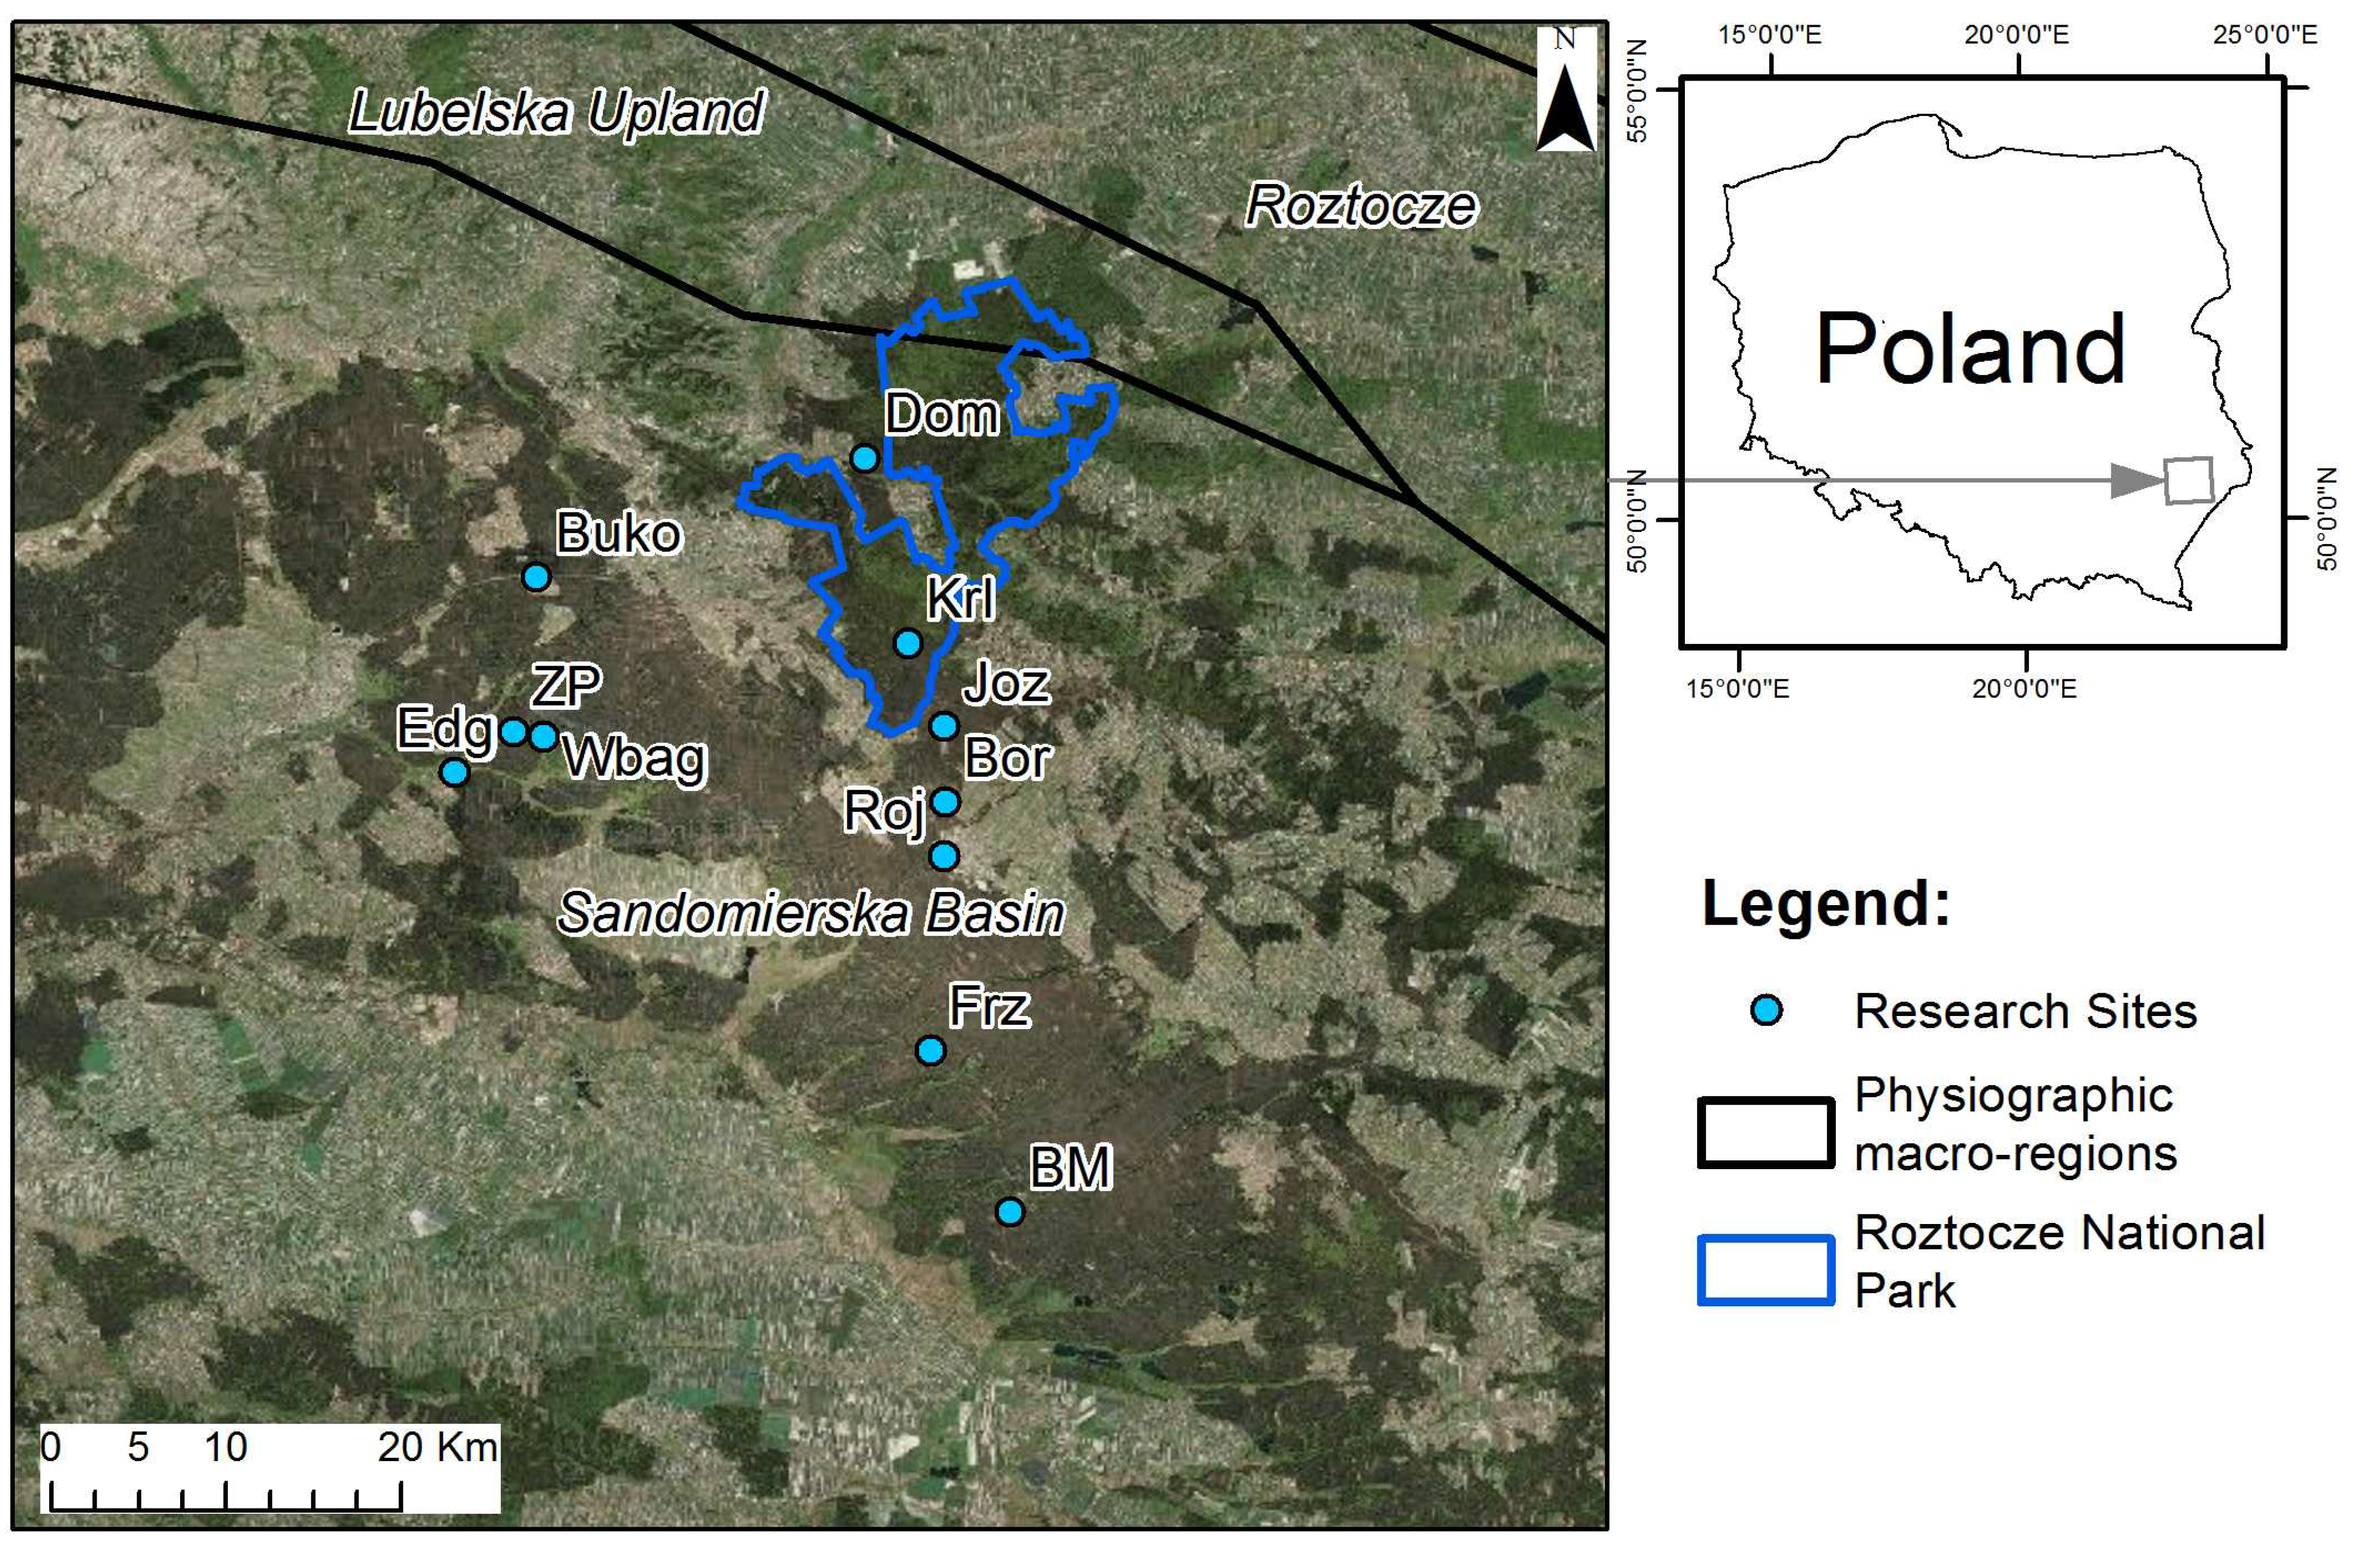
2.1. Research Site

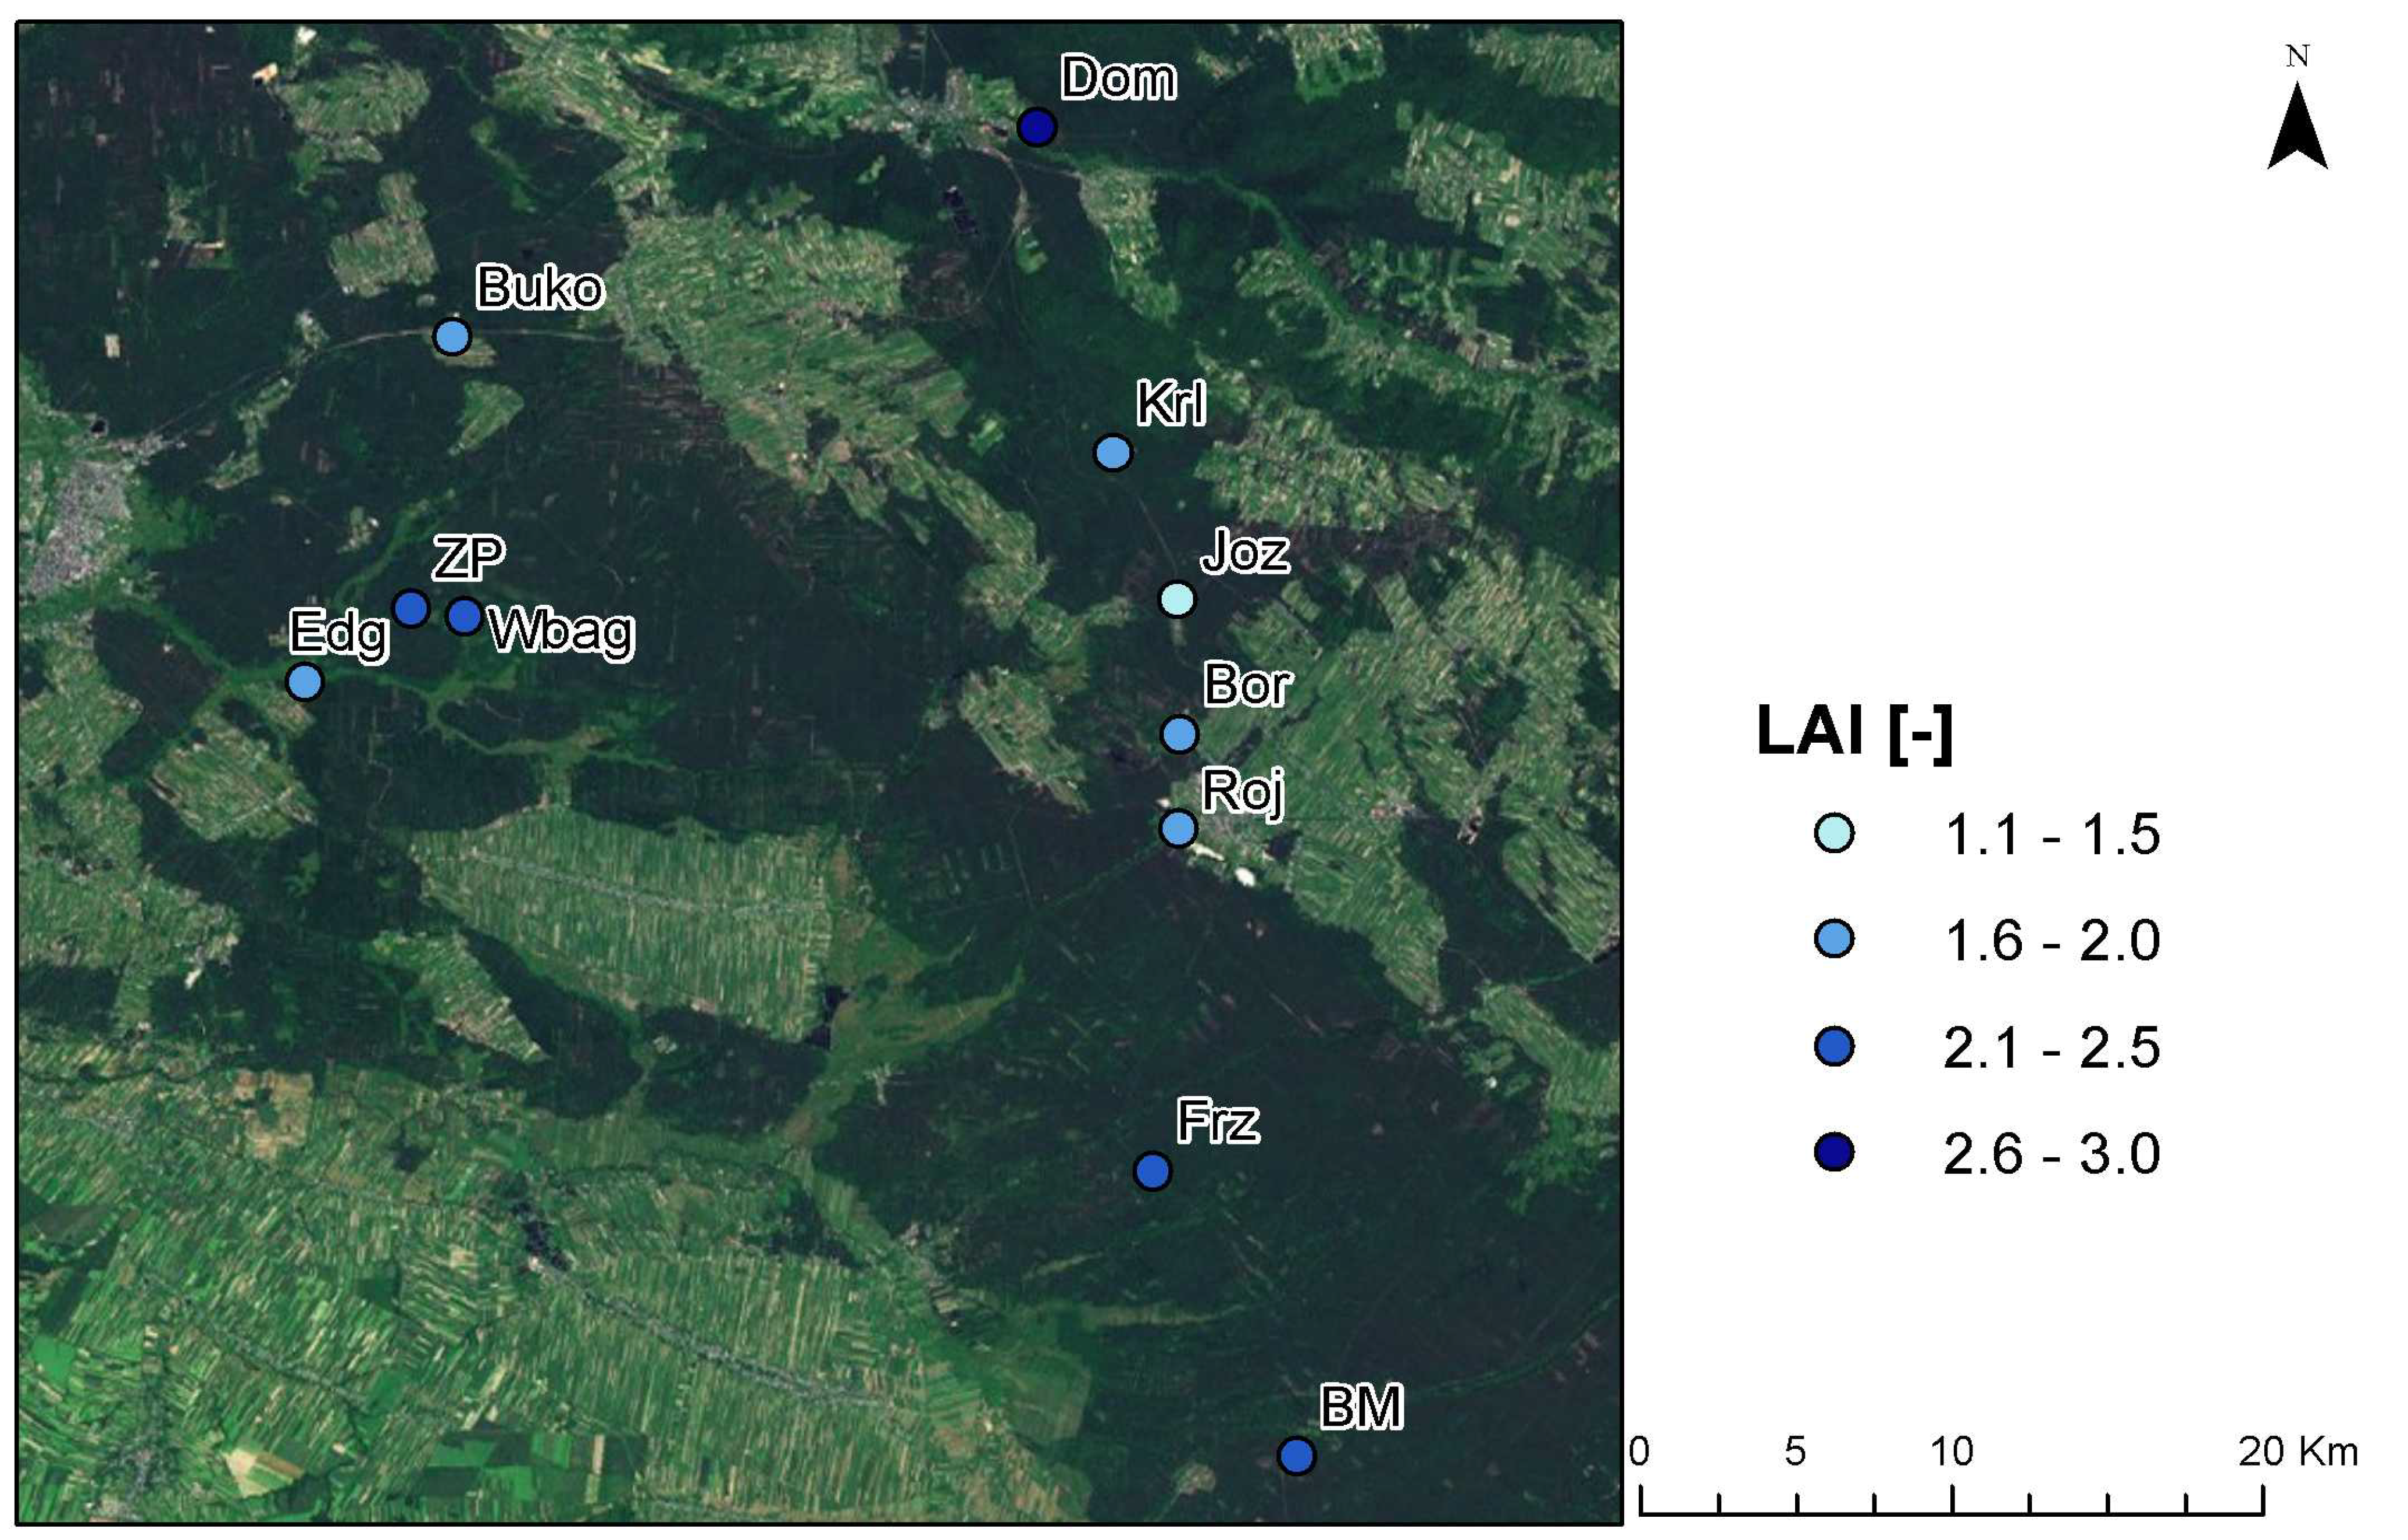
| No. | Research Site | Habitat Characteristics | N. LAI |
|---|---|---|---|
| 1 | Józefów (Joz) | Xerothermic grassland found on carbonaceous rocks. Adjacent to it is dry and moderately moist coniferous forest. | 5 |
| 2 | Wielkie Bagno (Wbag) | Mixed coniferous forest and alder carr coniferous forest. Mixed coniferous forest soil is mainly represented by fine-grained sands located on alluvial sand-dune soil. Water-logged soils are typical for alder carr habitat. | 4 |
| 3 | Zaskrońcowa Polana (ZP) | Moderately moist coniferous forest on mineral deposits in podzolic soil and rusty soil of exceptionally thin layer of acid mor-humus. Groundwater level within the extent of tree root system. | 6 |
| 4 | Zwierzyniec Dom (Dom) | Private timber forests with species resembling moderately moist mixed coniferous forest. Forests strongly degraded by the remains of the owners’ residential buildings. | 8 |
| 5 | Borowe Młyny II (BM) | Marshy coniferous forest on peaty earth soil formed in hollows in the terrain without flow. This area is located within the reach of acid stagnant groundwater. | 6 |
| 6 | Borowina (Bor) | Moderately moist coniferous forest located on mineral deposits on sod-podzolic soil. Habitat present on peat- and peat-earth soils. | 3 |
| 7 | Bukownica (Buko) | Ploughland, isolated by a railway crossing. Each year monocotyledon plants not exceeding 1.5 meters are planted. | 3 |
| 8 | Edwardów Nowy Most (Edg) | Dry soil coniferous forest located in immediate proximity of a brook. Adult tree stand on fine-grained sands. | 3 |
| 9 | Fryszarka (Frz) | Coniferous forests on moderately moist and moist soils. The area situated on podzolic type of soil, predominantly fine-grained sands. Peat or, in places, peaty earth soil is present in depressions. | 4 |
| 10 | Kruglik (Krl) | Mixed coniferous forest on specific podzolic soil formed on the basis of friable or slightly loamy sand. | 3 |
| 11 | Józefow rondo (Roj) | Mixed forest located partly on moderately moist brown soil and, partly, on podzolic soil. Large open areas in close proximity. | 4 |
2.2. LAI Measurements
2.3. Herpetofauna Surveys
2.4. Data Analysis
3. Results and Discussion
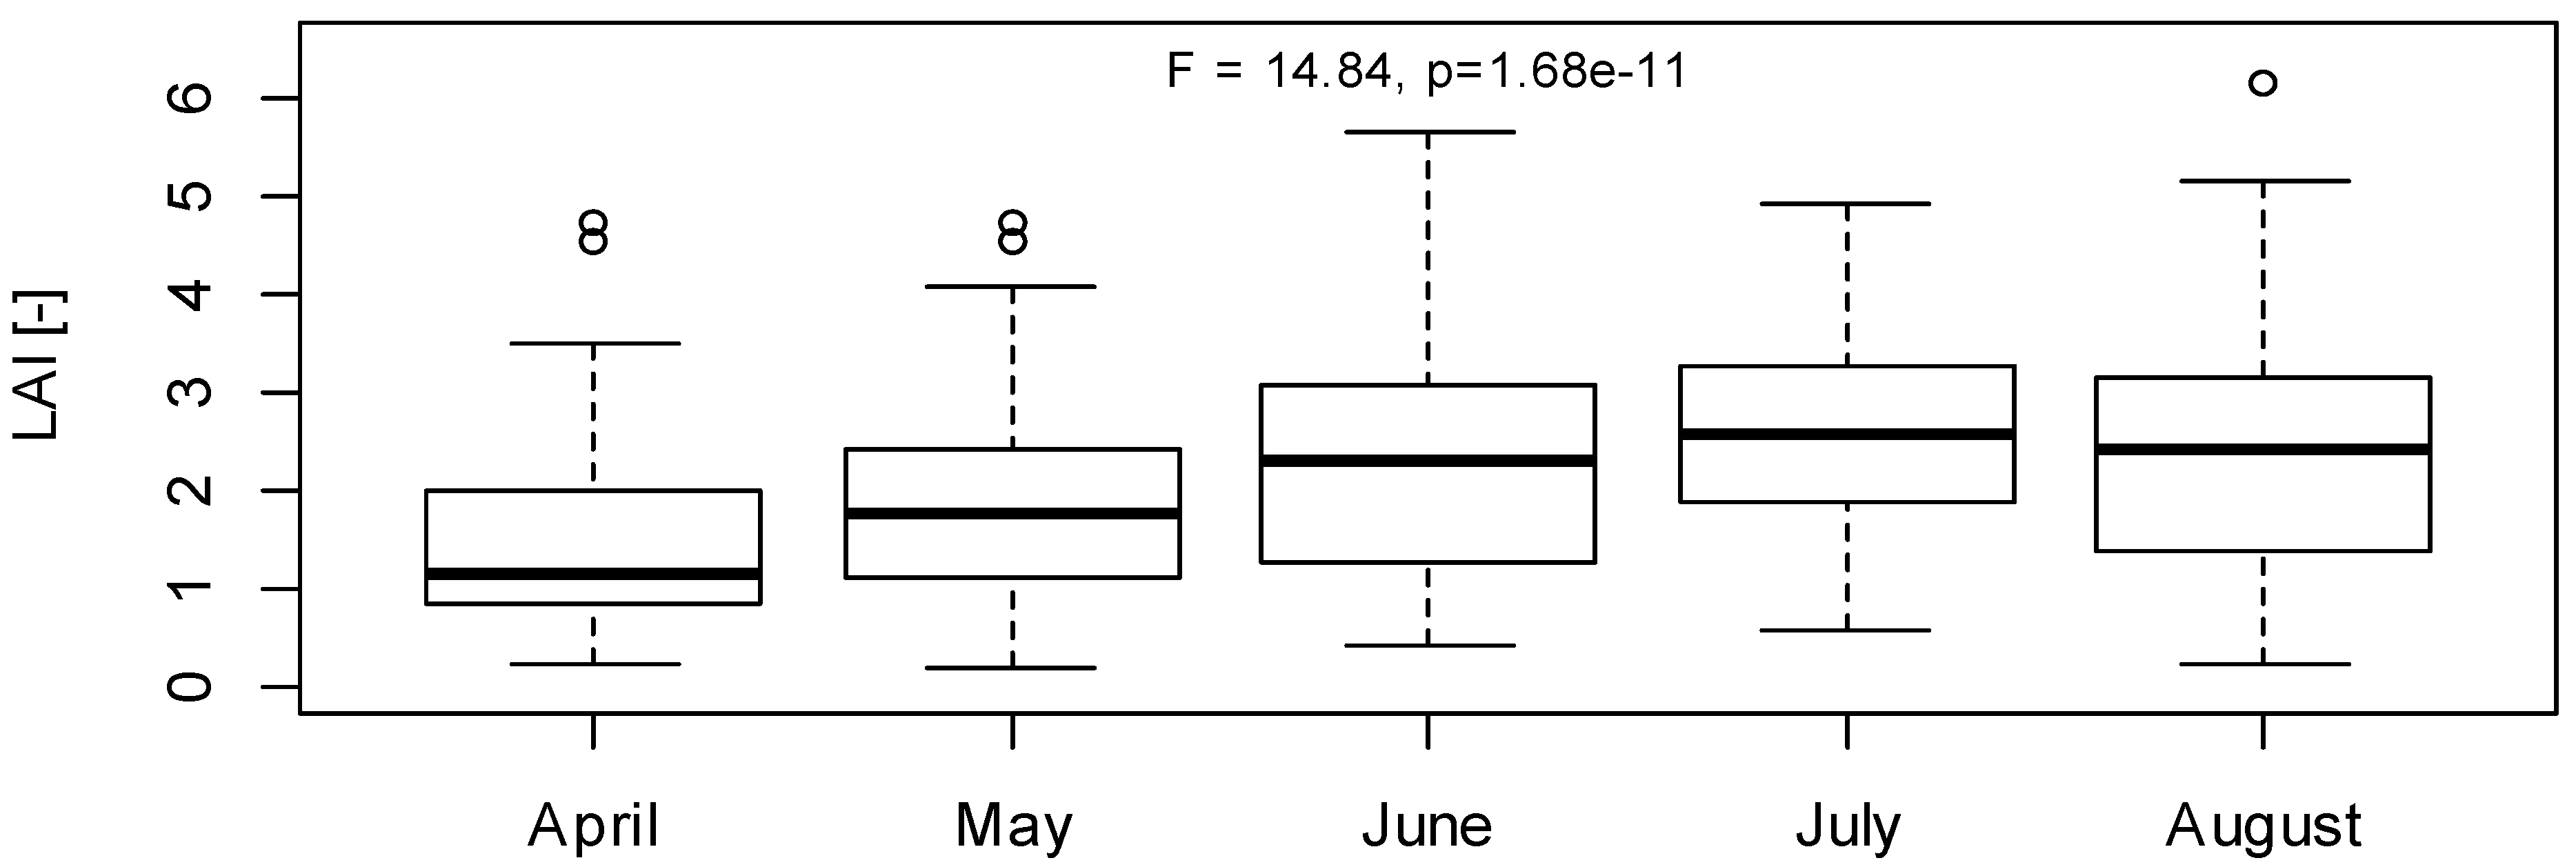
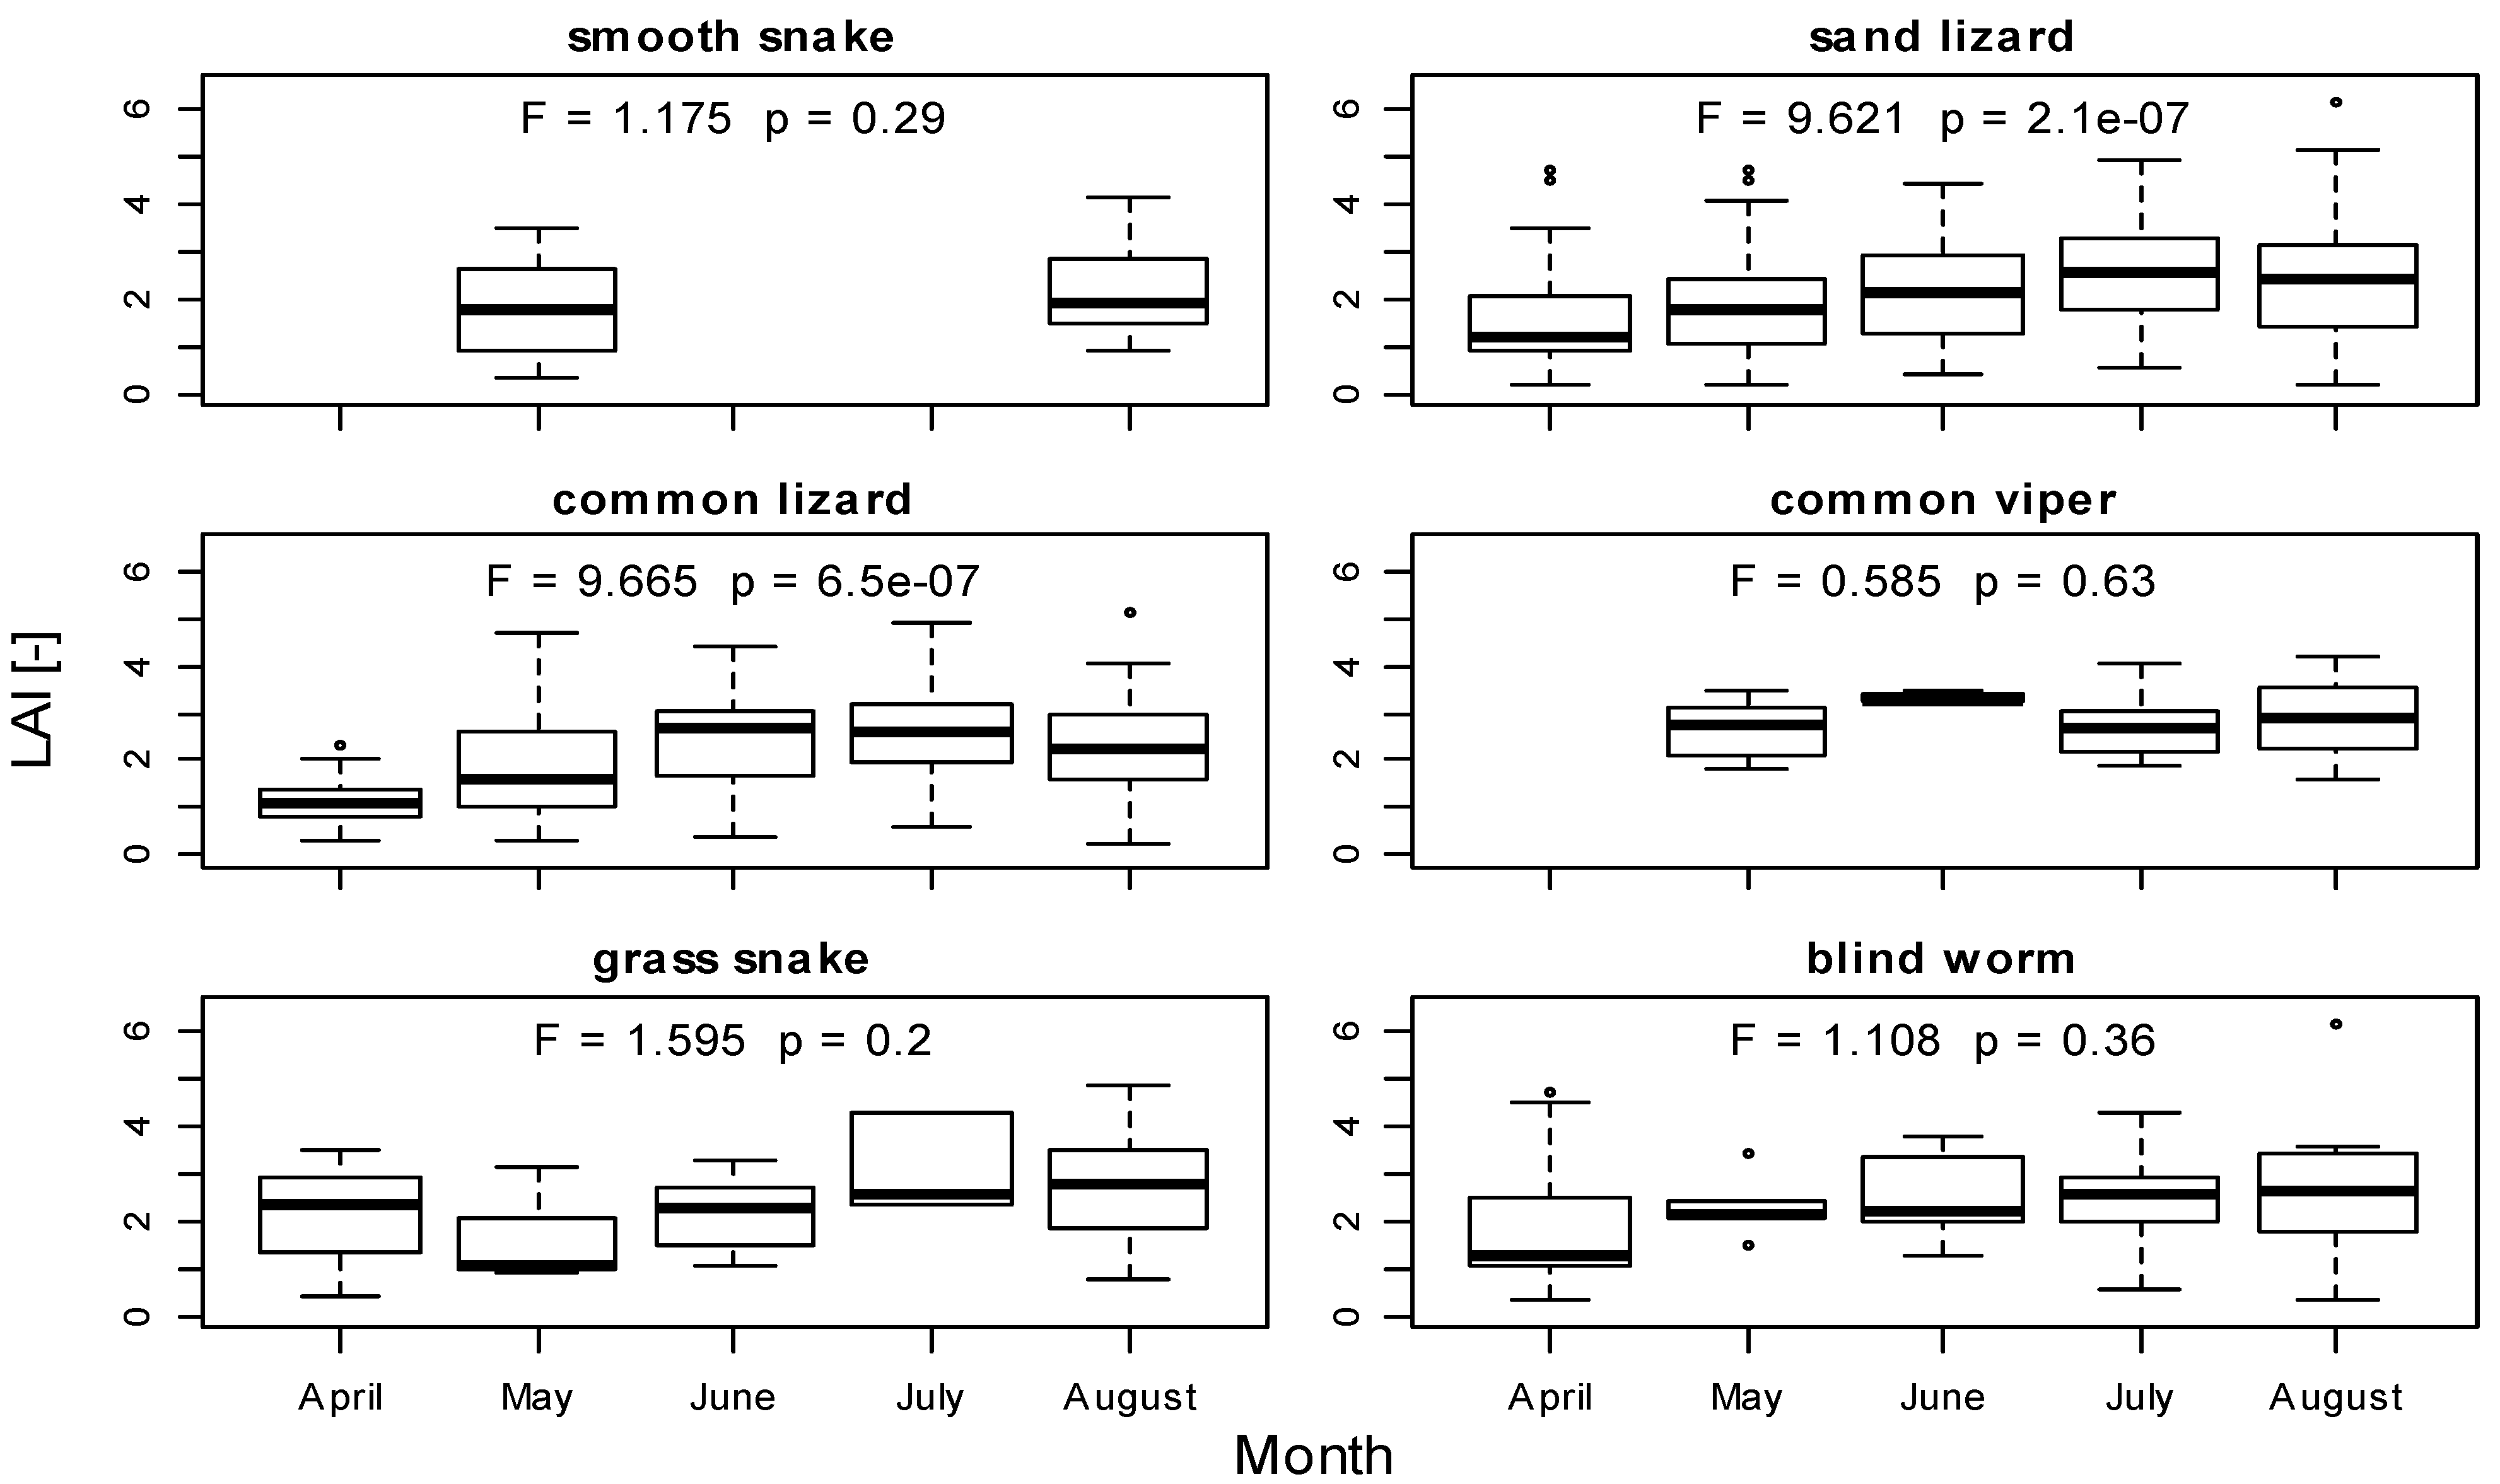
3.1. LAI Measurements

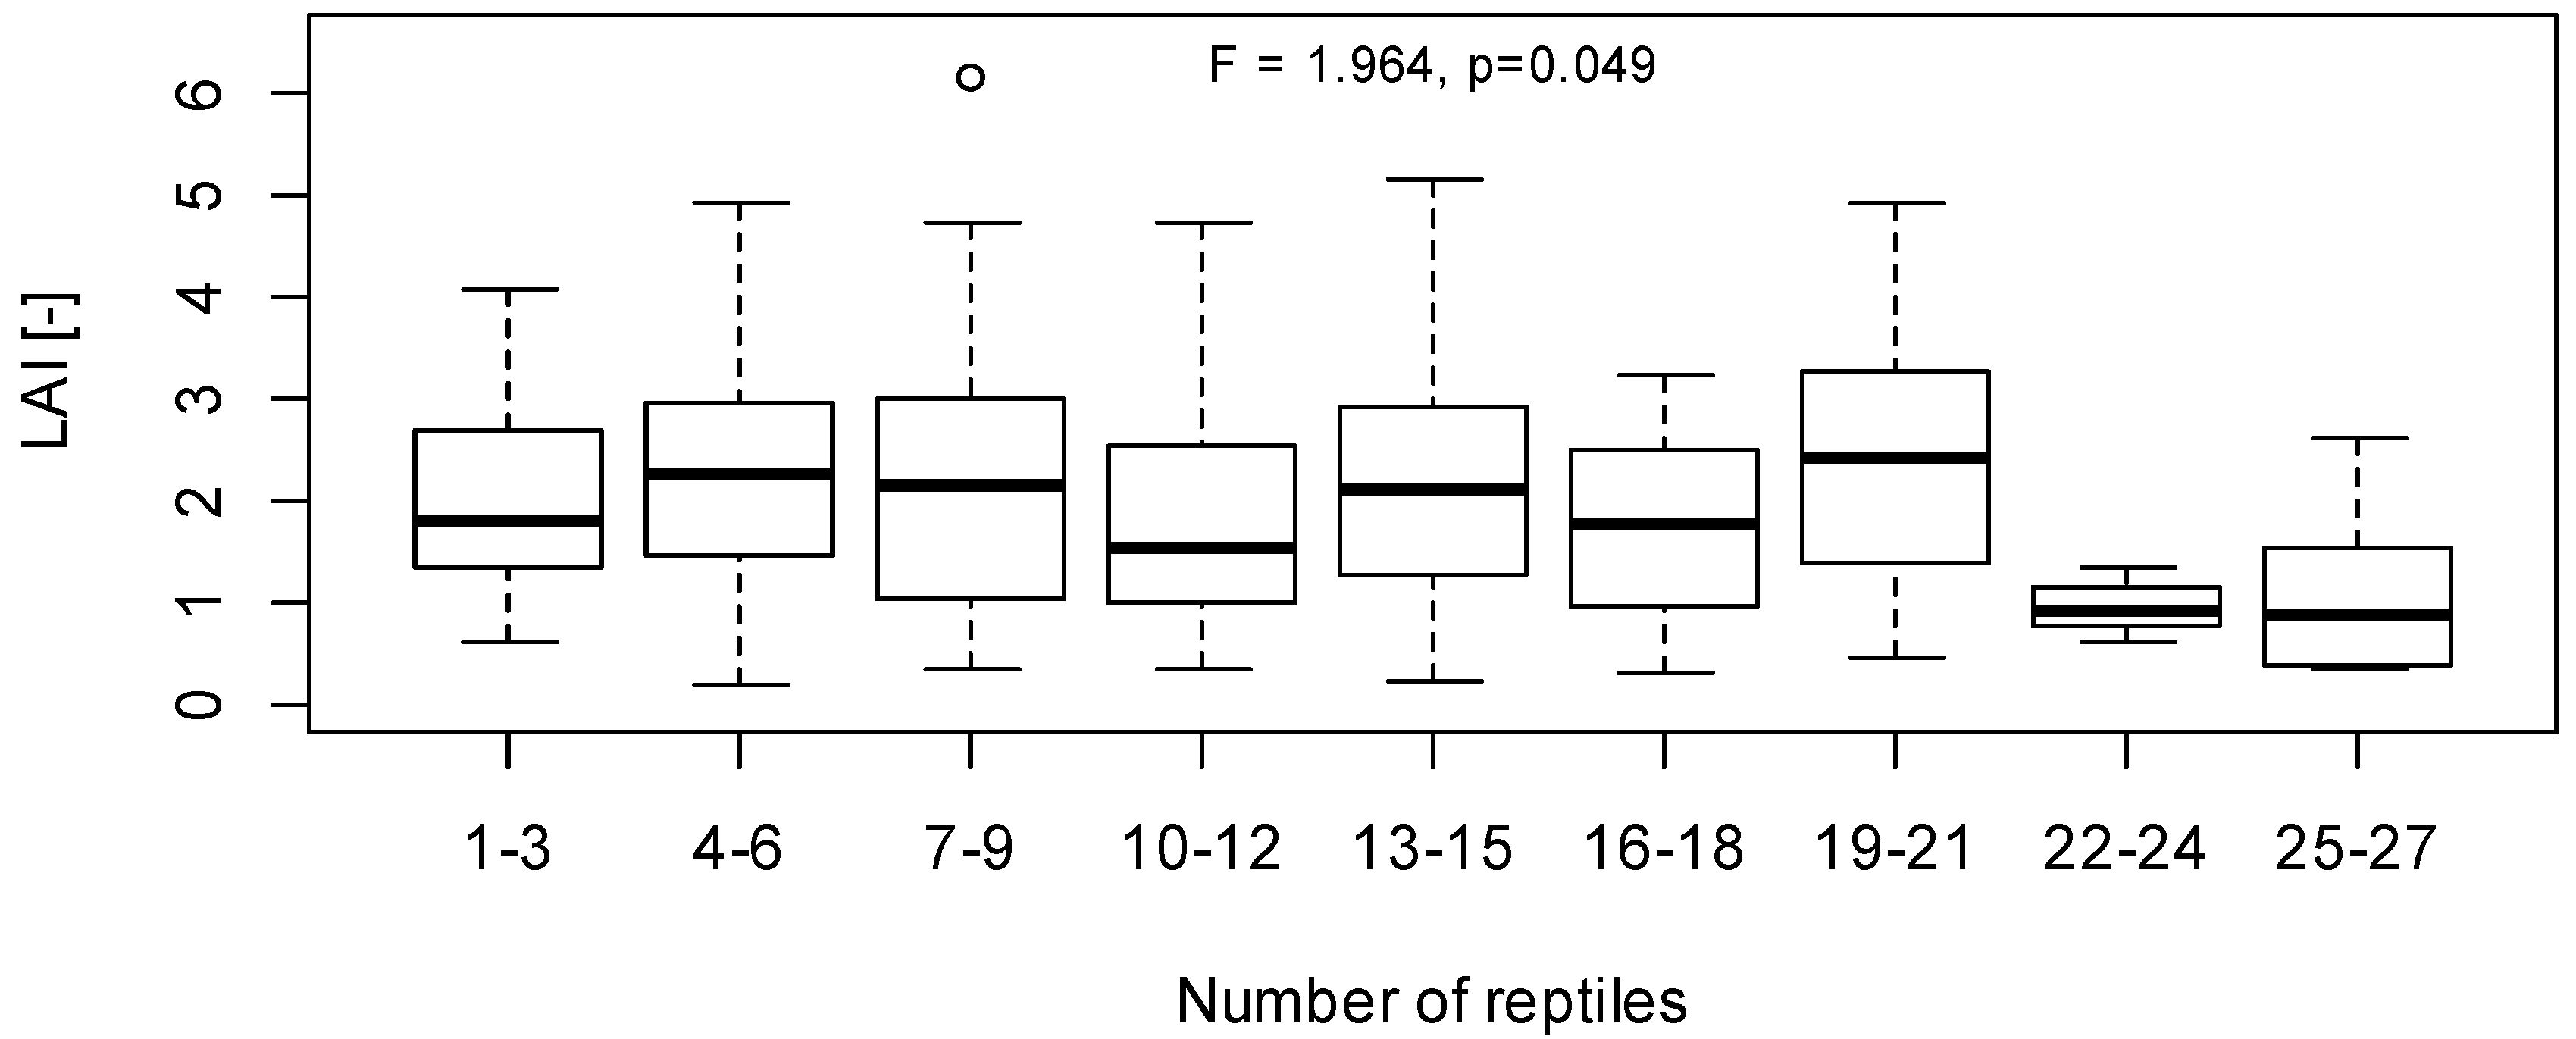
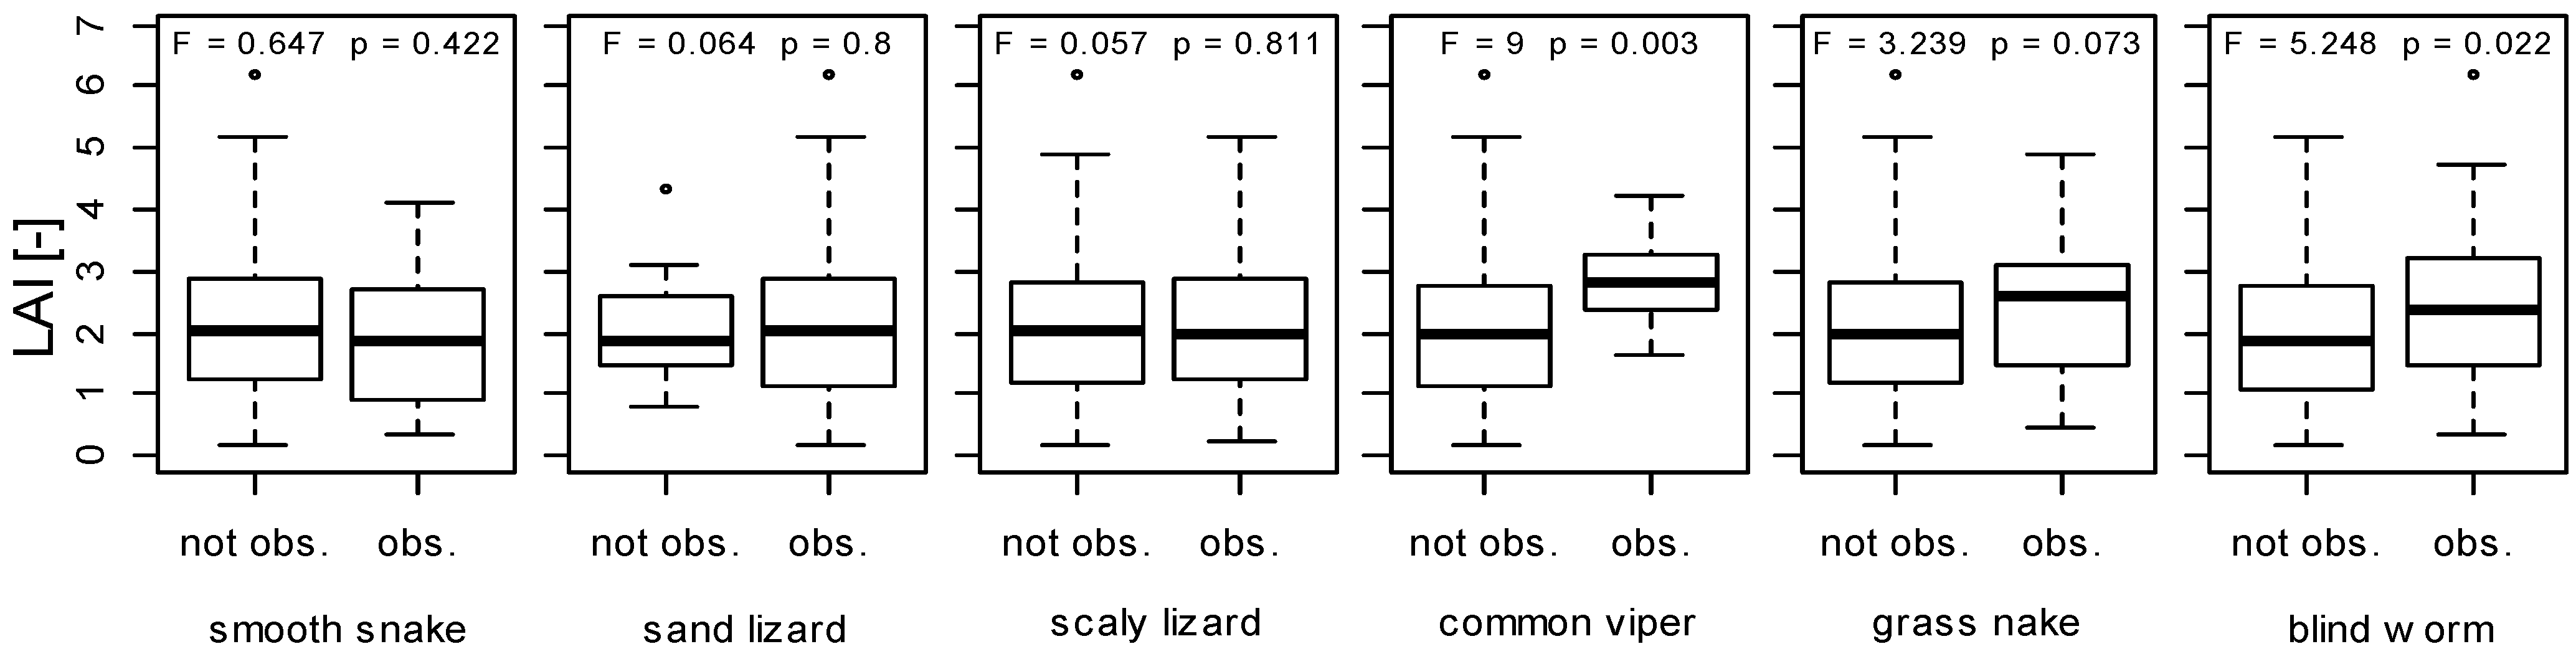
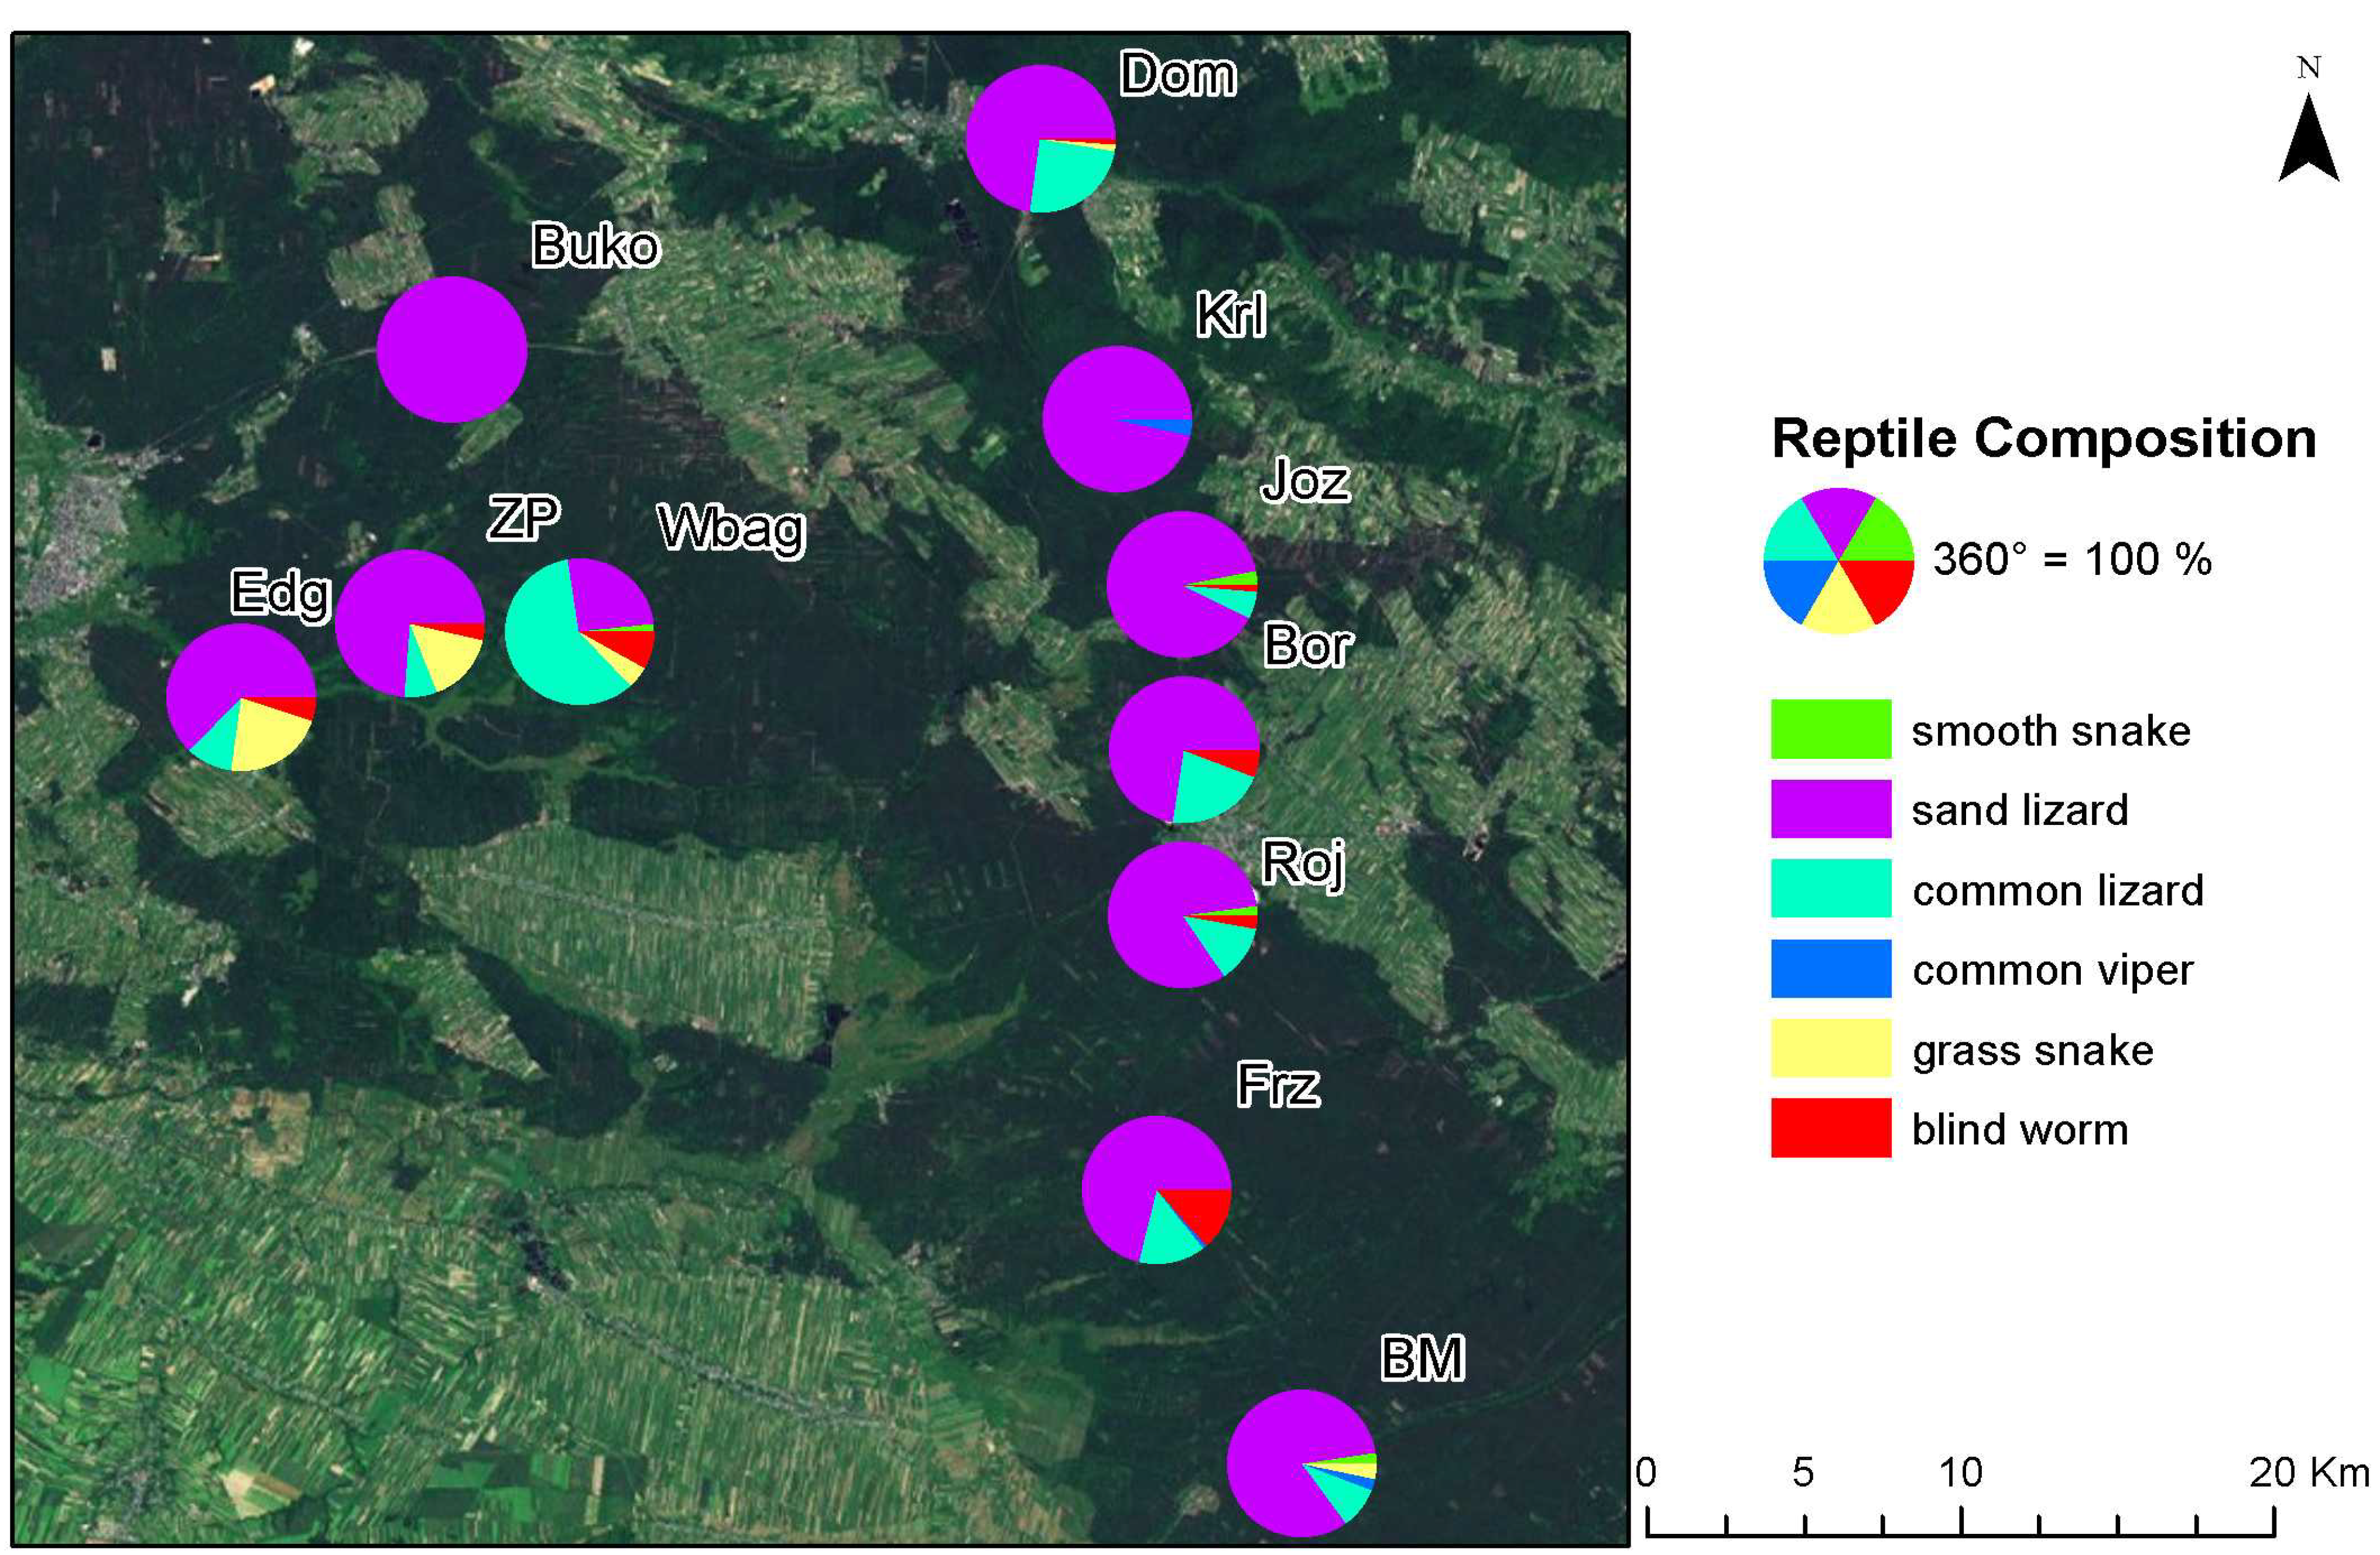
3.2. Herpetofauna Survey
| Research Site | Smooth Snake | Sand Lizard | Common Lizard | Common Viper | Grass Snake | Blind Worm | Total |
|---|---|---|---|---|---|---|---|
| BM | 3 | 99 | 11 | 3 | 4 | 0 | 120 |
| Bor | 1 | 72 | 21 | 1 | 0 | 6 | 101 |
| Buko | 0 | 50 | 0 | 0 | 0 | 0 | 50 |
| Dom | 0 | 56 | 19 | 0 | 1 | 1 | 77 |
| Edg | 0 | 37 | 6 | 0 | 13 | 3 | 59 |
| Frz | 0 | 64 | 13 | 1 | 0 | 12 | 90 |
| Joz | 4 | 121 | 8 | 1 | 0 | 2 | 136 |
| Krl | 0 | 55 | 0 | 2 | 0 | 0 | 57 |
| Roj | 2 | 80 | 12 | 0 | 0 | 3 | 97 |
| Wbag | 1 | 16 | 37 | 0 | 3 | 5 | 62 |
| ZP | 0 | 42 | 4 | 0 | 9 | 2 | 57 |
| Total | 11 | 692 | 131 | 8 | 30 | 34 | 906 |
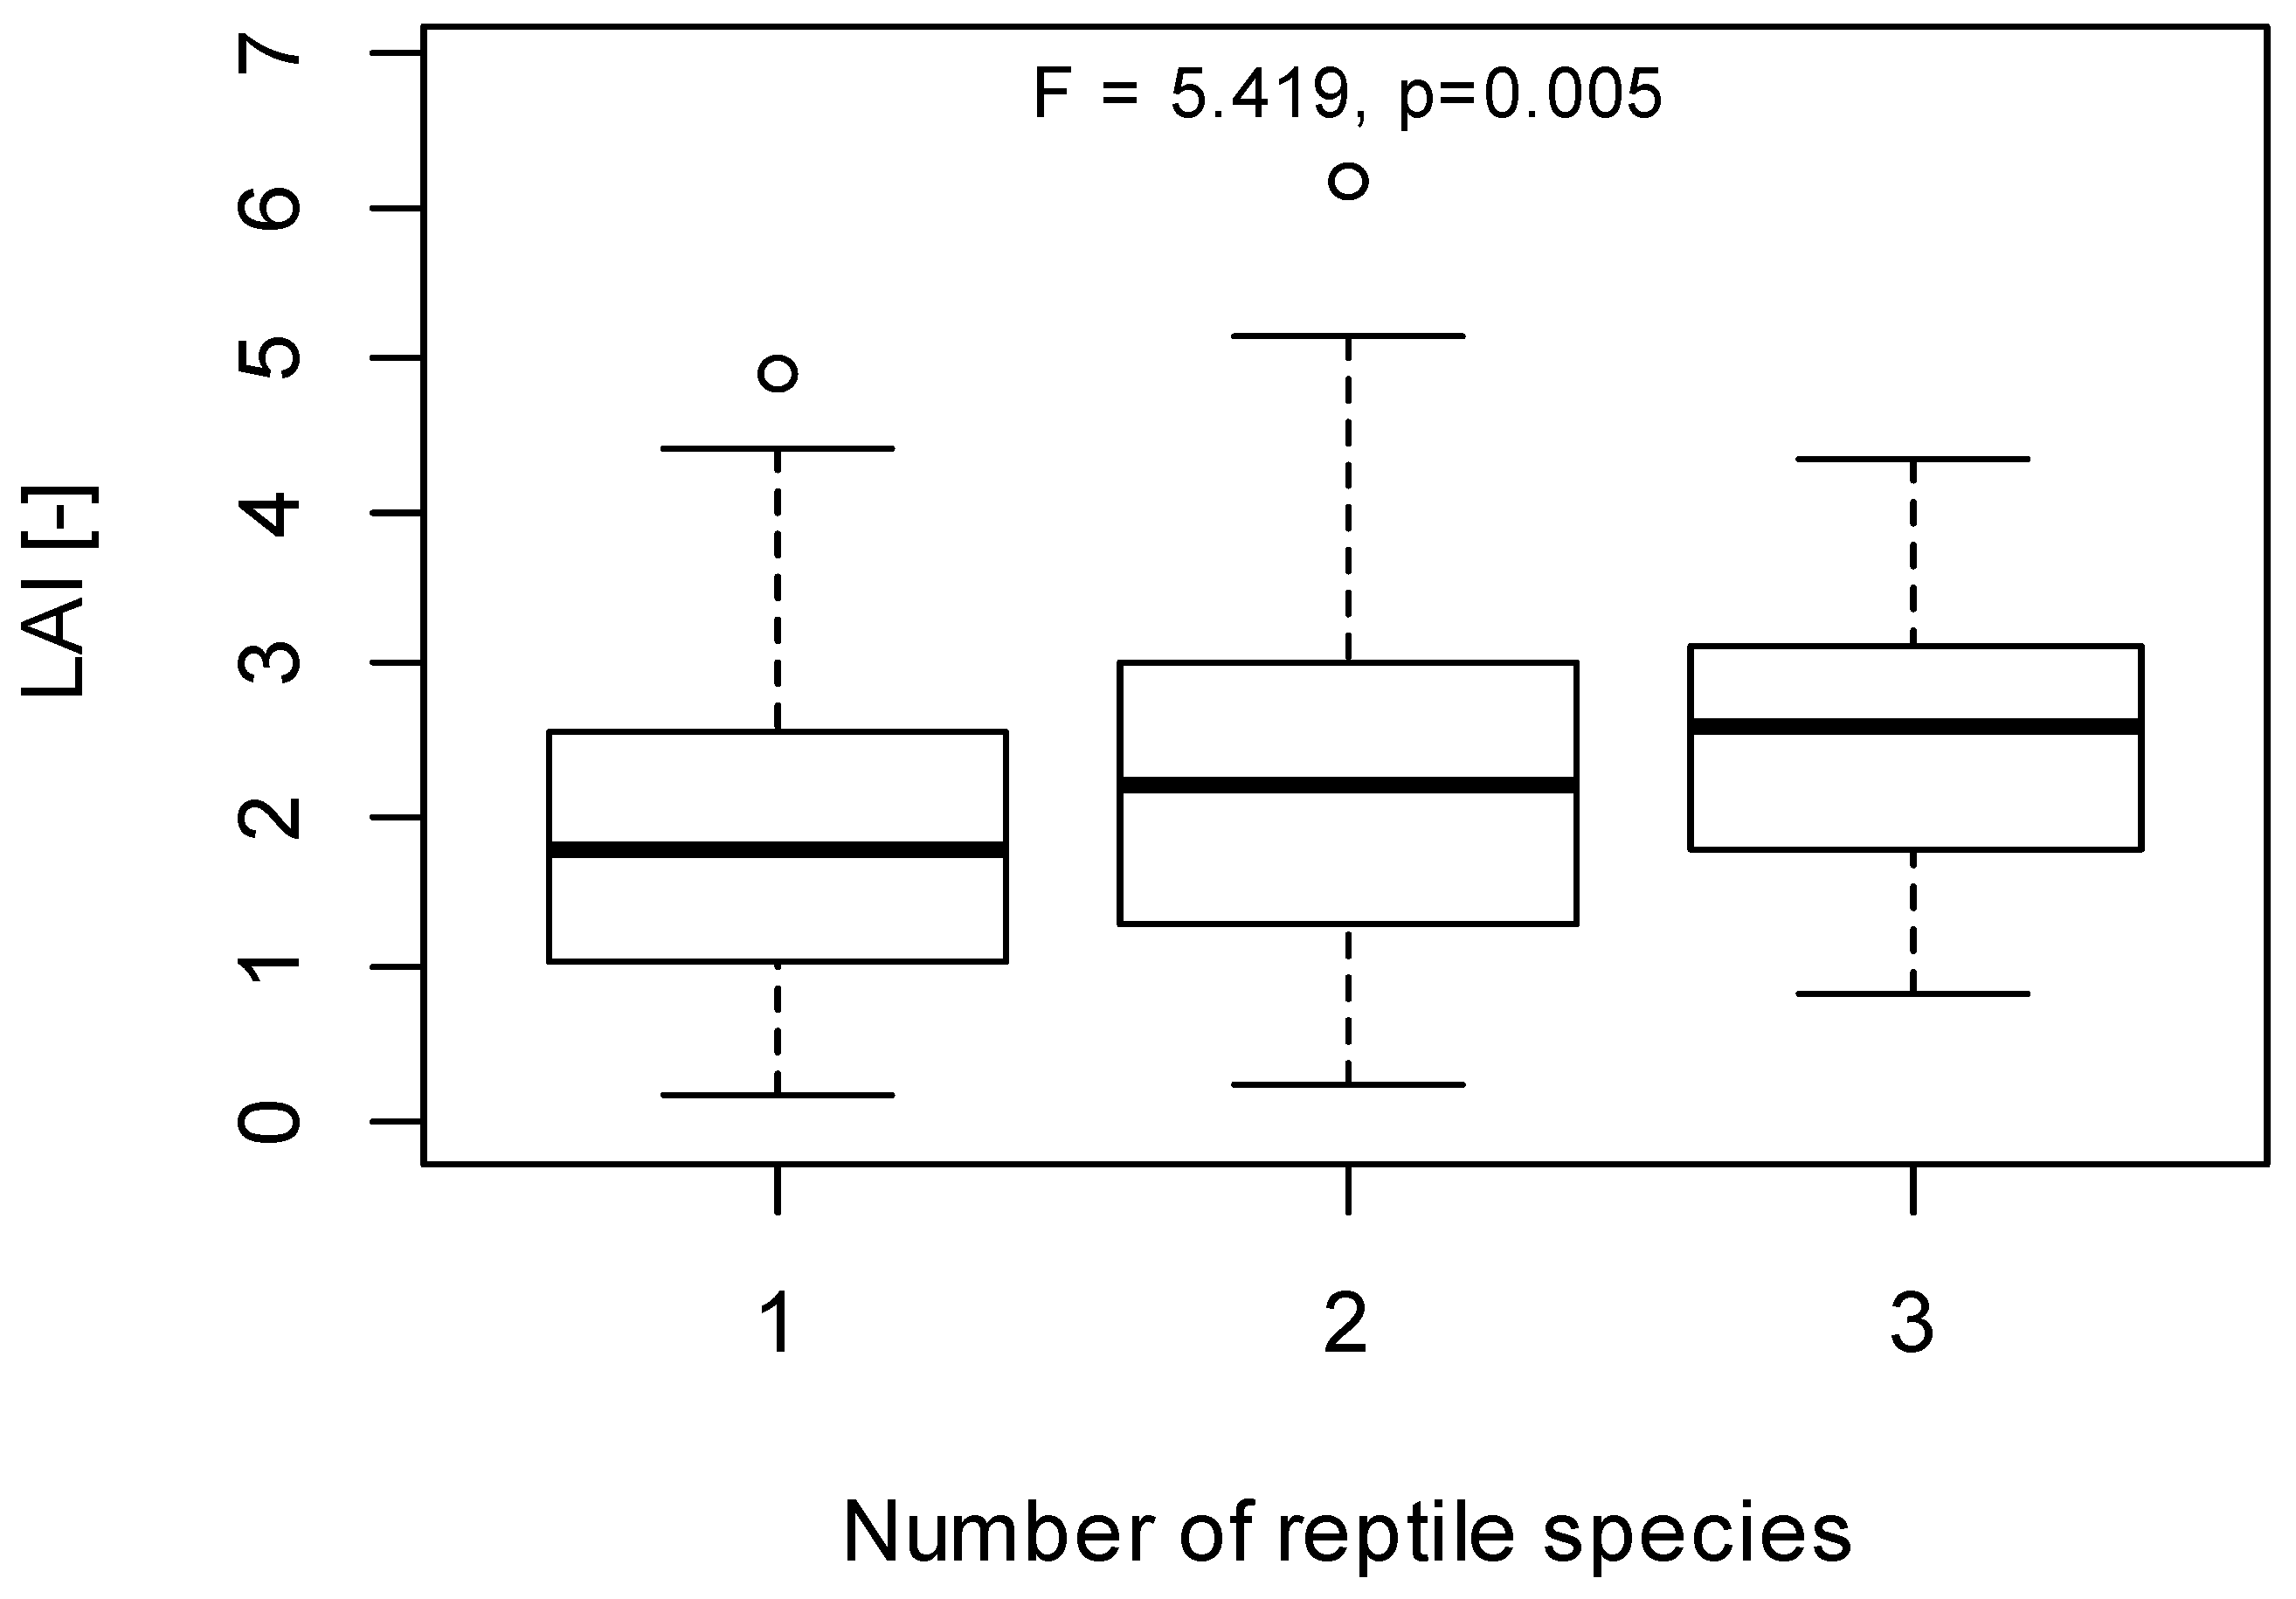
3.3. Implications of LAI as a Habitat Index for Reptiles


4. Conclusions
Acknowledgments
Author Contributions
Conflicts of Interest
References
- Leyequien, E.; Verrelst, J.; Slot, M.; Schaepman-Strub, G.; Heitkönig, I.; Skidmore, A. Capturing the fugitive: Applying remote sensing to terrestrial animal distribution and diversity. Int. J. Appl. Earth Obs. Geoinf. 2007, 9, 1–20. [Google Scholar] [CrossRef]
- Rodríguez, M.Á.; Belmontes, J.A.; Hawkins, B.A. Energy, water and large-scale patterns of reptile and amphibian species richness in Europe. Acta Oecol. 2005, 28, 65–70. [Google Scholar] [CrossRef]
- Mitchell, N.; Hipsey, M.R.; Arnall, S.; McGrath, G.; Tareque, H.B.; Kuchling, G.; Vogwill, R.; Sivapalan, M.; Porter, W.P.; Kearney, M.R. Linking eco-energetics and eco-hydrology to select sites for the assisted colonization of Australia’s rarest reptile. Biology 2013, 2, 1–25. [Google Scholar]
- Sillero, N.; Gonçalves-Seco, L. Spatial structure analysis of a reptile community with airborne LiDAR data. Int. J. Geogr. Inform. Sci. 2014, 28, 1709–1722. [Google Scholar] [CrossRef]
- Skidmore, A.K.; Toxopeus, A.G.; de Bie, K.; Corsi, F.; Venus, V.; Omolo, D.P.; Marquez, J.; Giménezb, R.R. Herpetological species mapping for the Meditteranean. In ISPRS Commission VII Mid Term Symposium on Remote Sensing from Pixel to Processes; ISPRS: Enschede, The Netherlands, 2006. [Google Scholar]
- Said, M.Y.; Skidmore, A.K.; de Leeuw, J.; Aligula, H.M.; Kumar, L.; Prins, H.H.T. Analysis of the relationship between ungulate species richness in East Africa and climatic and remotely sensed productivity indices. In Multiscale Perspectives of Species Richness in East Africa; University of Wageningen: Wageningen, The Netherlands, 2003; pp. 17–38. [Google Scholar]
- Guisan, A.; Hofer, U. Predicting reptile distributions at the mesoscale: Relation to climate and topography. J. Biogeogr. 2003, 30, 1233–1243. [Google Scholar] [CrossRef]
- Coops, N.C.; Wulder, M.A.; Duro, D.C.; Han, T.; Berry, S. The development of a Canadian dynamic habitat index using multi-temporal satellite estimates of canopy light absorbance. Ecol. Indicators 2008, 8, 754–766. [Google Scholar] [CrossRef]
- Coops, N.C.; Wulder, M.A.; Iwanicka, D. Demonstration of a satellite-based index to monitor habitat at continental-scales. Ecol. Indicators 2009, 9, 948–958. [Google Scholar] [CrossRef]
- Powers, R.P.; Coops, N.C.; Morgan, J.L.; Wulder, M.A.; Nelson, T.A.; Drever, C.R.; Cumming, S.G. A remote sensing approach to biodiversity assessment and regionalization of the Canadian boreal forest. Prog. Phys. Geogr. 2013, 37, 36–62. [Google Scholar] [CrossRef]
- Shen, L.; He, Y.; Guo, X. Suitability of the normalized difference vegetation index and the adjusted transformed soil-adjusted vegetation index for spatially characterizing loggerhead shrike habitats in north American mixed prairie. J. Appl. Remote Sens. 2012, 7, 073574. [Google Scholar] [CrossRef]
- Welles, J.M.; Norman, J.M. Instrument for indirect measurement of canopy architecture. Agron. J. 1991, 83, 818–825. [Google Scholar] [CrossRef]
- Dąbrowski, P.; Pawluśkiewicz, B.; Kalaji, H.M.; Baczewska, A.H. The effect of light availability on leaf area index, biomass production and plant species composition of park grasslands in Warsaw. Plant Soil Environ. 2013, 59, 543–548. [Google Scholar]
- Beets, P.N.; Reutebuch, S.; Kimberley, M.O.; Oliver, G.R.; Pearce, S.H.; McGaughey, R.J. Leaf area index, biomass carbon and growth rate of radiata pine genetic types and relationships with LiDAR. Forests 2011, 2, 637–659. [Google Scholar] [CrossRef]
- Portillo-Quintero, C.; Sanchez-Azofeifa, A.; Culvenor, D. Using VEGNET in-situ monitoring LiDAR (IML) to capture dynamics of plant area index, structure and phenology in aspen parkland forests in Alberta, Canada. Forests 2014, 5, 1053–1068. [Google Scholar] [CrossRef]
- Szporak-Wasilewska, S.; Krettek, O.; Berezowski, T.; Ejdys, B.; Sławik, Ł.; Borowski, M.; Chormański, J. Leaf Area Index of forests using ALS, Landsat and ground measurements in Magura National Park (SE Poland). EARSeL eProc. 2014, 13, 103–111. [Google Scholar]
- Dąbrowska-Zielińska, K.; Gruszczyńska, M.; Lewiński, S.; Hościło, A.; Bojanowski, J. Application of remote and in situ information to the management of wetlands in Poland. J. Environ. Manag. 2009, 90, 2261–2269. [Google Scholar] [CrossRef]
- Berezowski, T.; Chormański, J. Wetland leaf area index modelling with field and satellite hyperspectral data. EARSeL eProceedings 2014, 13, 30–35. [Google Scholar]
- Greenberg, C.H. Response of reptile and amphibian communities to canopy gaps created by wind disturbance in the southern Appalachians. For. Ecol. Manag. 2001, 148, 135–144. [Google Scholar] [CrossRef]
- Pike, D.A.; Webb, J.K.; Shine, R. Removing forest canopy cover restores a reptile assemblage. Ecol. Appl. 2011, 21, 274–280. [Google Scholar] [CrossRef] [PubMed]
- Uziak, S.; Turski, R. Natural Environment of Lubelszczyzna; Lubelskie Towarzystwo Naukowe: Lublin, Poland, 2008; In Polish. [Google Scholar]
- Skowera, B.; Kopcińska, J.; Kopeć, B. Changes in thermal and precipitation conditions in Poland in 1971–2010. Ann. Wars. Univ. Life Sci. Land Reclam. 2014, 46, 153–162. [Google Scholar]
- Kośmider, J. Ecological and Geographical Distribution of Smooth Snake Coronella Austrica and Charecteristic Features of Its Habitat in the Area of Solska Forest and Roztocze National Park. Master’s Thesis, Warsaw University of Life Sciences, Warsaw, Poland, 2010. [Google Scholar]
- Juszczyk, W. Domestic Amphibians and Reptiles; Państwowe Wydawnictwo Naukowe: Warsaw, Poland, 1974; In Polish. [Google Scholar]
- Heyer, W.R.; Donnelly, M.A.; McDiarmid, R.W.; Hayek, L.A.C.; Foster, M.S. Measuring and Monitoring Biological Diversity: Standard Methods for Amphibians; Smithsonian Institution Press: Washington, DC, USA, 1994. [Google Scholar]
- Fang, H.; Liang, S.; Townshend, J.R.; Dickinson, R.E. Spatially and temporally continuous LAI data sets based on an integrated filtering method: Examples from North America. Remote Sens. Environ. 2008, 112, 75–93. [Google Scholar] [CrossRef]
- Szporak, S. Remote sensing methods in assessment of evapotranspiration in the Biebrza River Lower Basin. Ph.D. Thesis, Warsaw University of Life Sciences, Warsaw, Poland, 2011. [Google Scholar]
- Spellerberg, I.F.; Phelps, T.E. Biology, general ecology and behaviour of the snake, Coronella austriaca Laurenti. Biol. J. Linnean Soc. 1977, 9, 133–164. [Google Scholar] [CrossRef]
- House, S.M.; Spellerberg, I.F. Ecology and conservation of the sand lizard (Lacerta agilis L.) habitat in Southern England. J. Appl. Ecol. 1983, 20, 417–437. [Google Scholar] [CrossRef]
- Dent, S.; Spellerberg, I.F. Habitats of the lizards Lacerta agilis and Lacerta vivipara on forest ride verges in Britain. Biol. Conserv. 1987, 42, 273–286. [Google Scholar] [CrossRef]
- Reading, C.J.; Buckland, S.T.; McGowan, G.M.; Jayasinghe, G.; Gorzula, S.; Balharry, D. The distribution and status of the adder (Vipera berus L.) in Scotland determined from questionnaire surveys. J. Biogeogr. 1996, 23, 657–667. [Google Scholar] [CrossRef]
- Wisler, C.; Hofer, U.; Arlettaz, R. Snakes and monocultures: Habitat selection and movements of female grass snakes (Natrix natrix L.) in an agricultural landscape. J. Herpetol. 2008, 42, 337–346. [Google Scholar] [CrossRef]
- Stumpel, A.H. Reptile habitat preference in heathland: Implications for heathland management. Herpetol. J. 2012, 22, 179–182. [Google Scholar]
© 2015 by the authors; licensee MDPI, Basel, Switzerland. This article is an open access article distributed under the terms and conditions of the Creative Commons Attribution license (http://creativecommons.org/licenses/by/4.0/).
Share and Cite
Berezowski, T.; Kośmider, J.; Greczuk, M.; Chormański, J. LAI Variability as a Habitat Feature Determining Reptile Occurrence: A Case Study in Large Forest Complexes in Eastern Poland. Forests 2015, 6, 957-972. https://doi.org/10.3390/f6040957
Berezowski T, Kośmider J, Greczuk M, Chormański J. LAI Variability as a Habitat Feature Determining Reptile Occurrence: A Case Study in Large Forest Complexes in Eastern Poland. Forests. 2015; 6(4):957-972. https://doi.org/10.3390/f6040957
Chicago/Turabian StyleBerezowski, Tomasz, Jakub Kośmider, Magdalena Greczuk, and Jarosław Chormański. 2015. "LAI Variability as a Habitat Feature Determining Reptile Occurrence: A Case Study in Large Forest Complexes in Eastern Poland" Forests 6, no. 4: 957-972. https://doi.org/10.3390/f6040957