
Modeling the Potential Distribution of Picea chihuahuana Martínez, an Endangered Species at the Sierra Madre Occidental, Mexico

 , and
, and
Abstract
:1. Introduction
2. Experimental Section
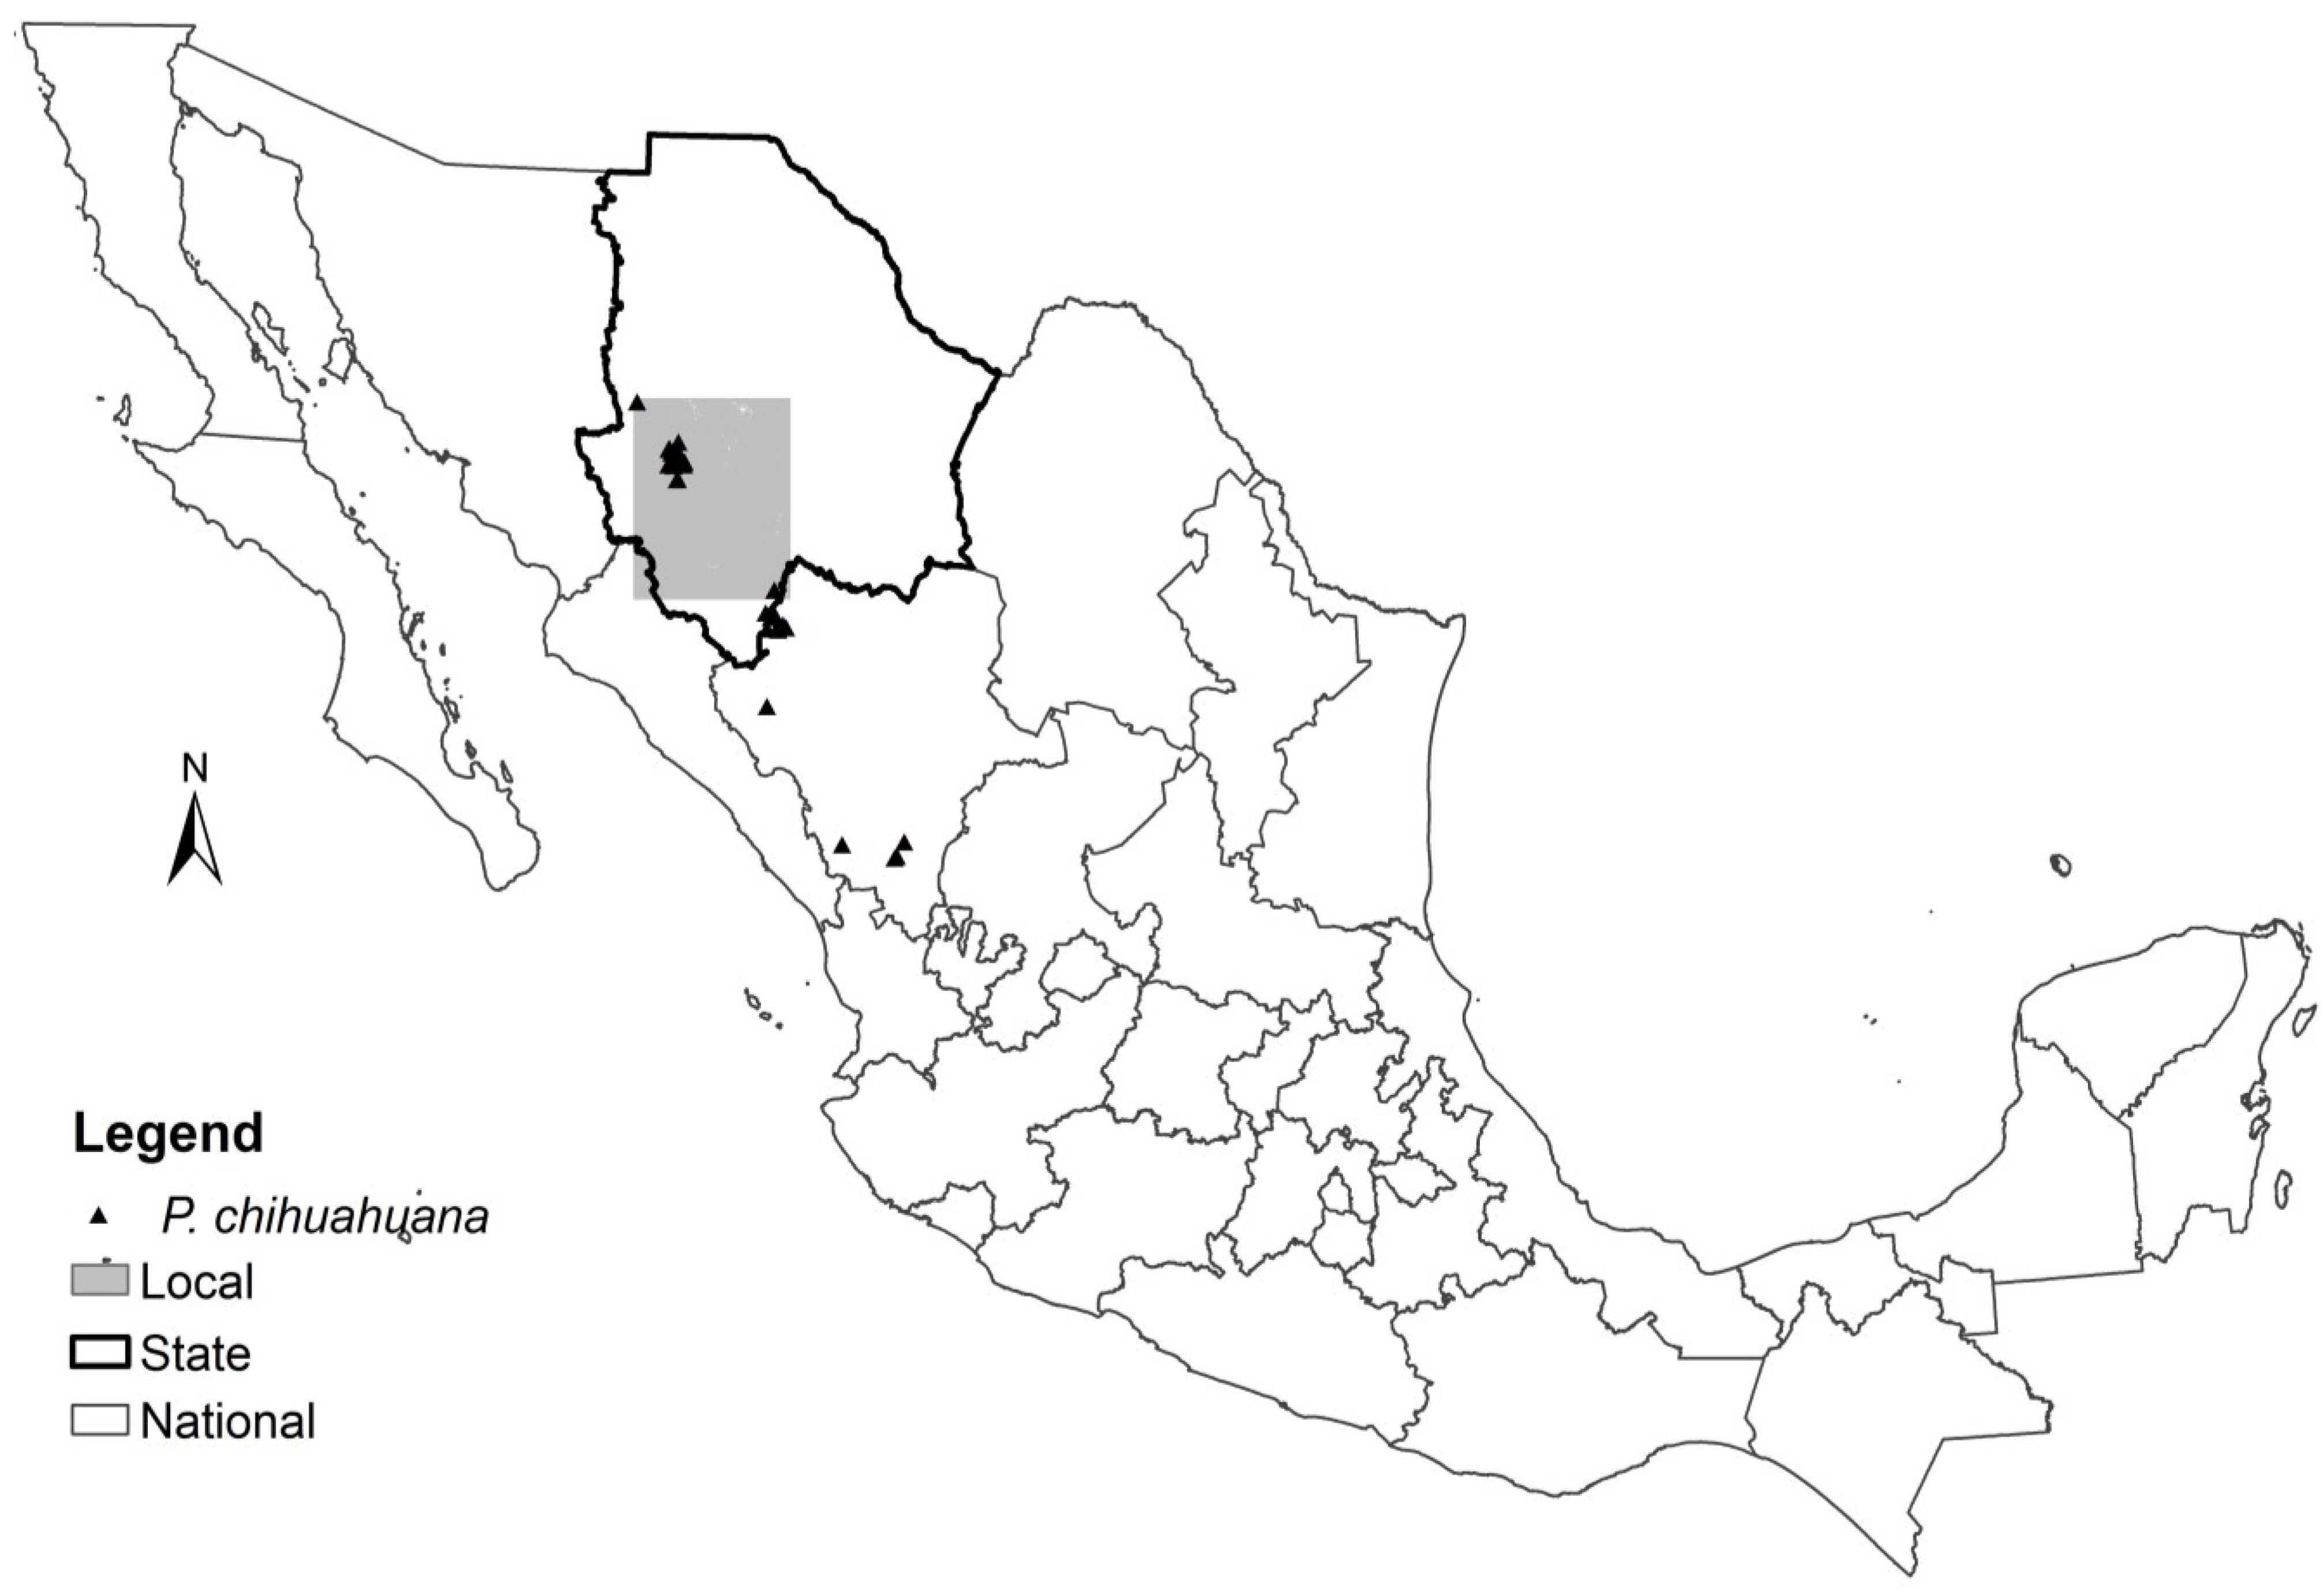
2.1. Data
2.2. Modeling Methods

| Variables | National | State | Local |
|---|---|---|---|
| Climate (WorldClim) * | X | X | |
| NDVI | X | X | |
| Vegetation type | X | X | X |
| Soil type | X | X | X |
| Slope | X | ||
| Altitude | X | ||
| Aspect | X | ||
| Distance to water flows | X | ||
| Precipitation ** | X | ||
| Mean annual temperature ** | X |
2.3. Evaluation of the Distribution Maps
3. Results
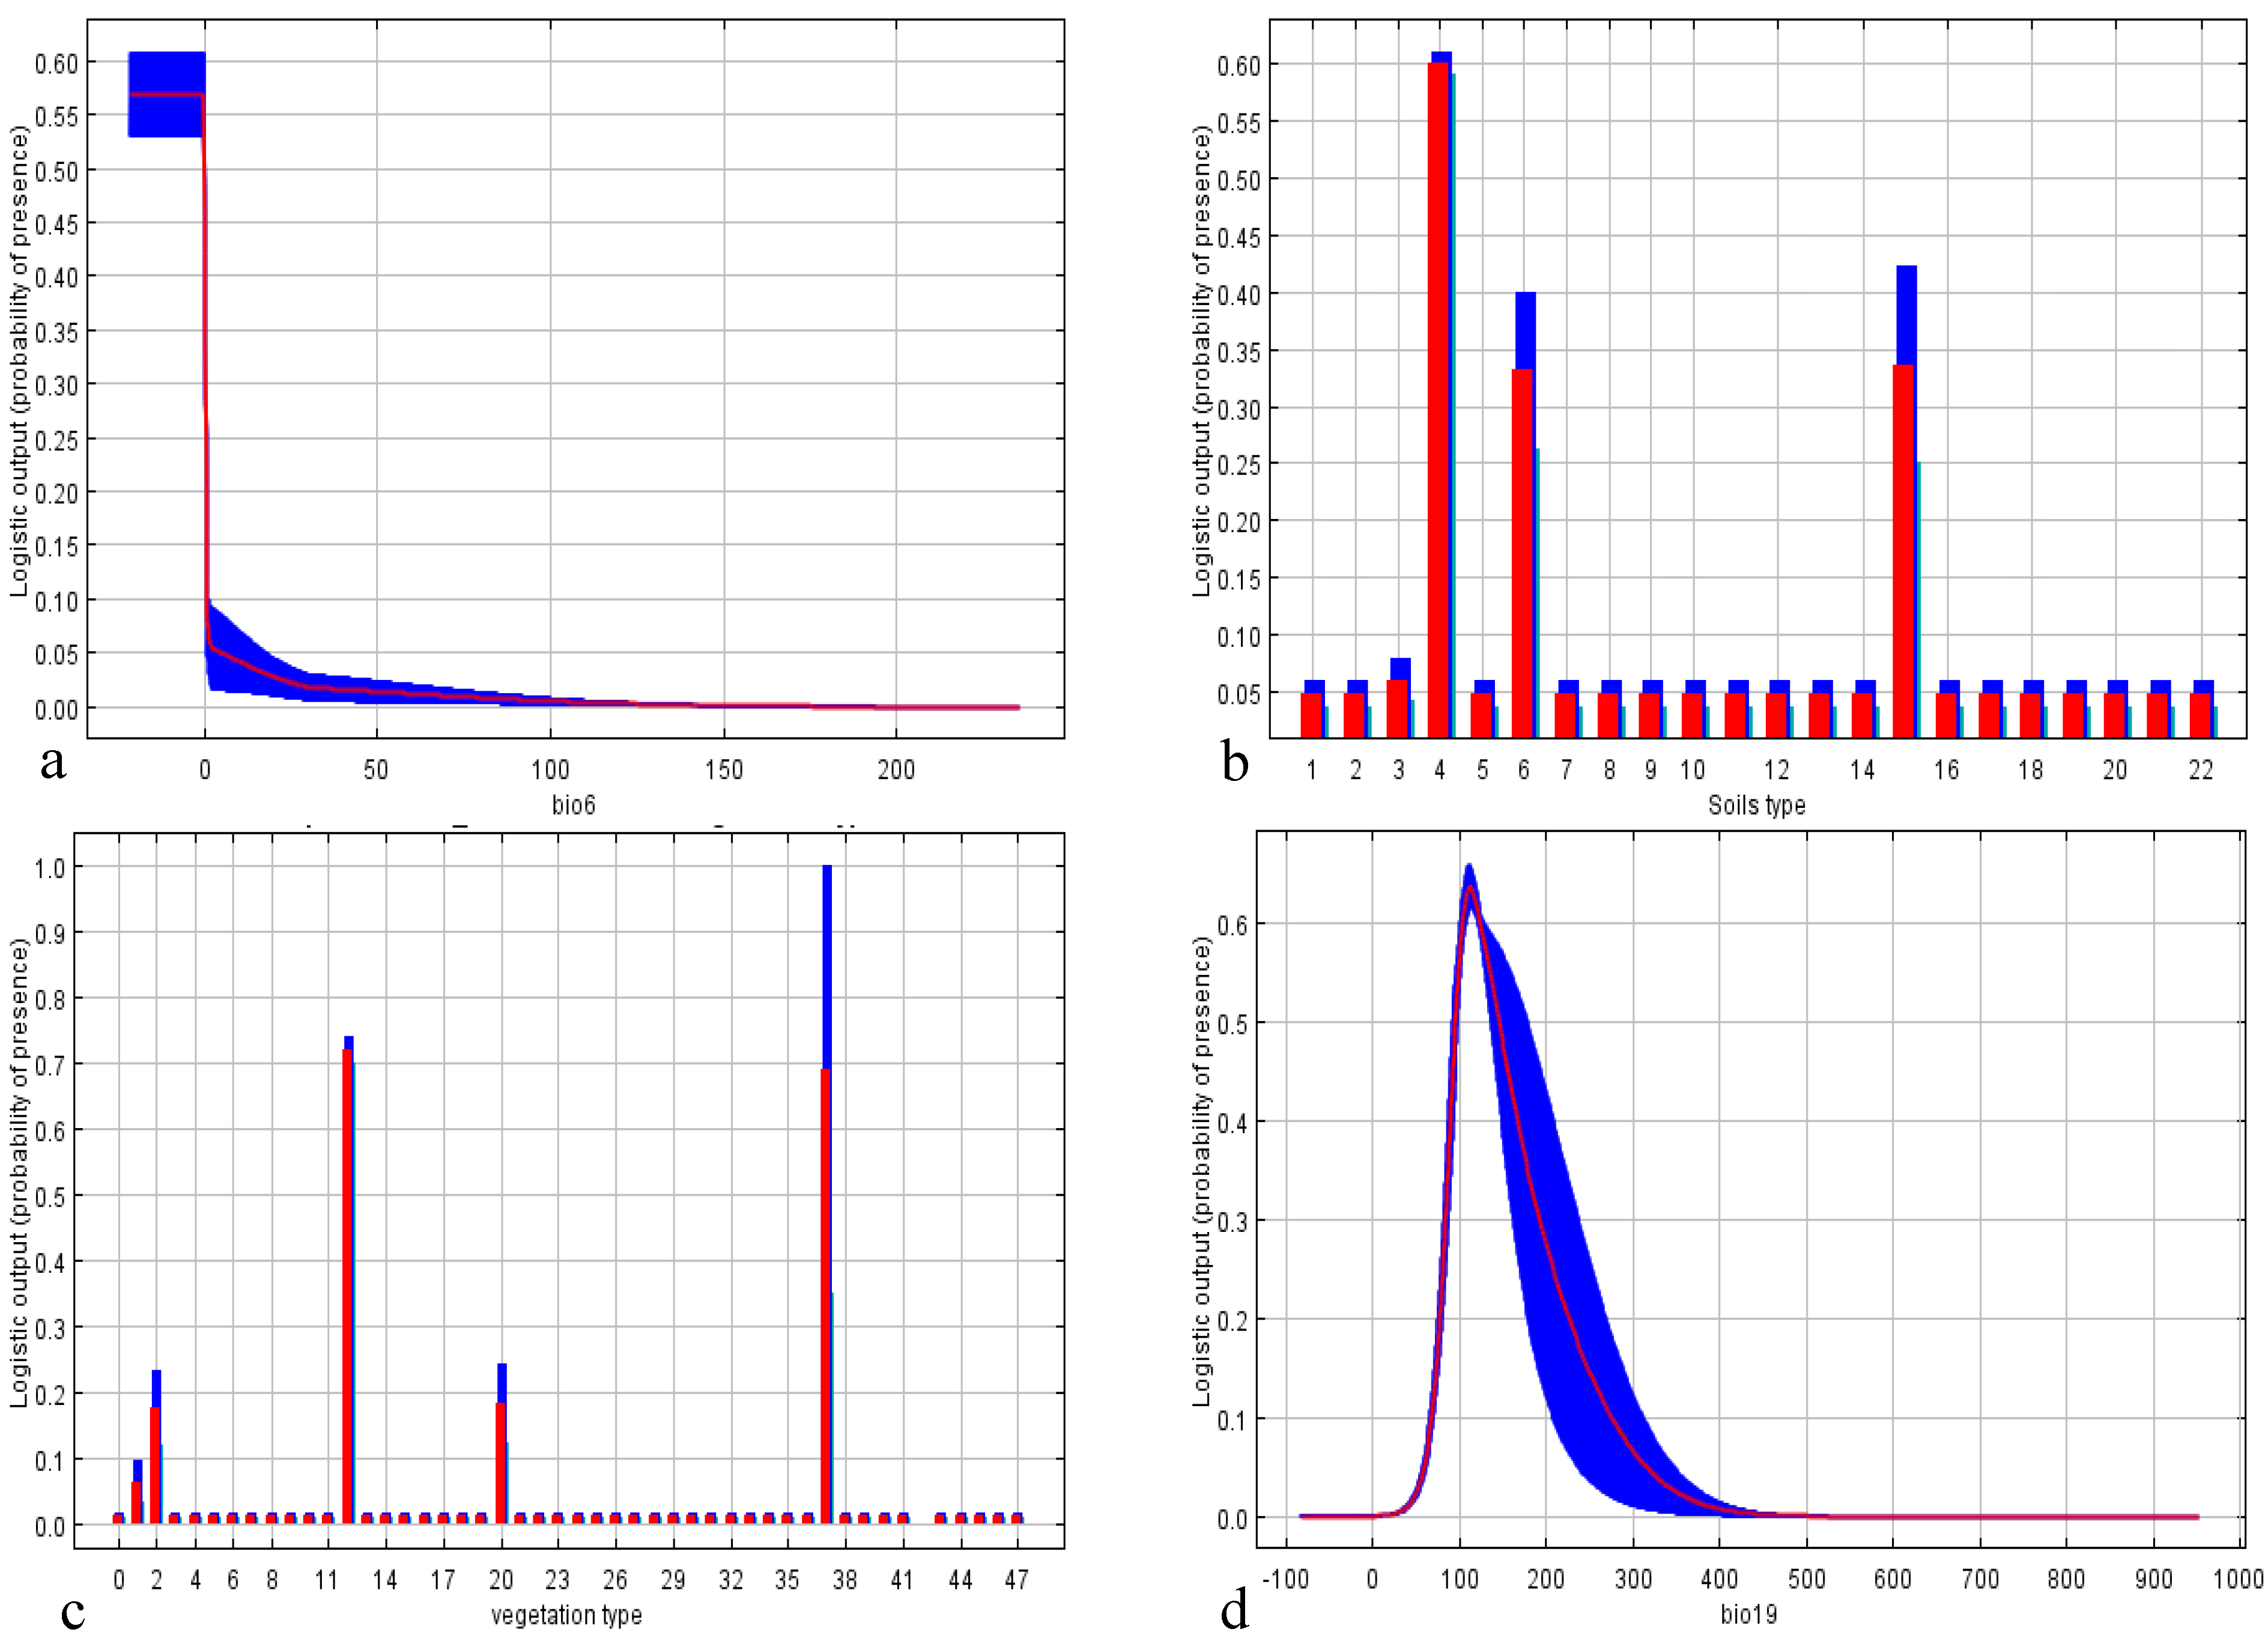
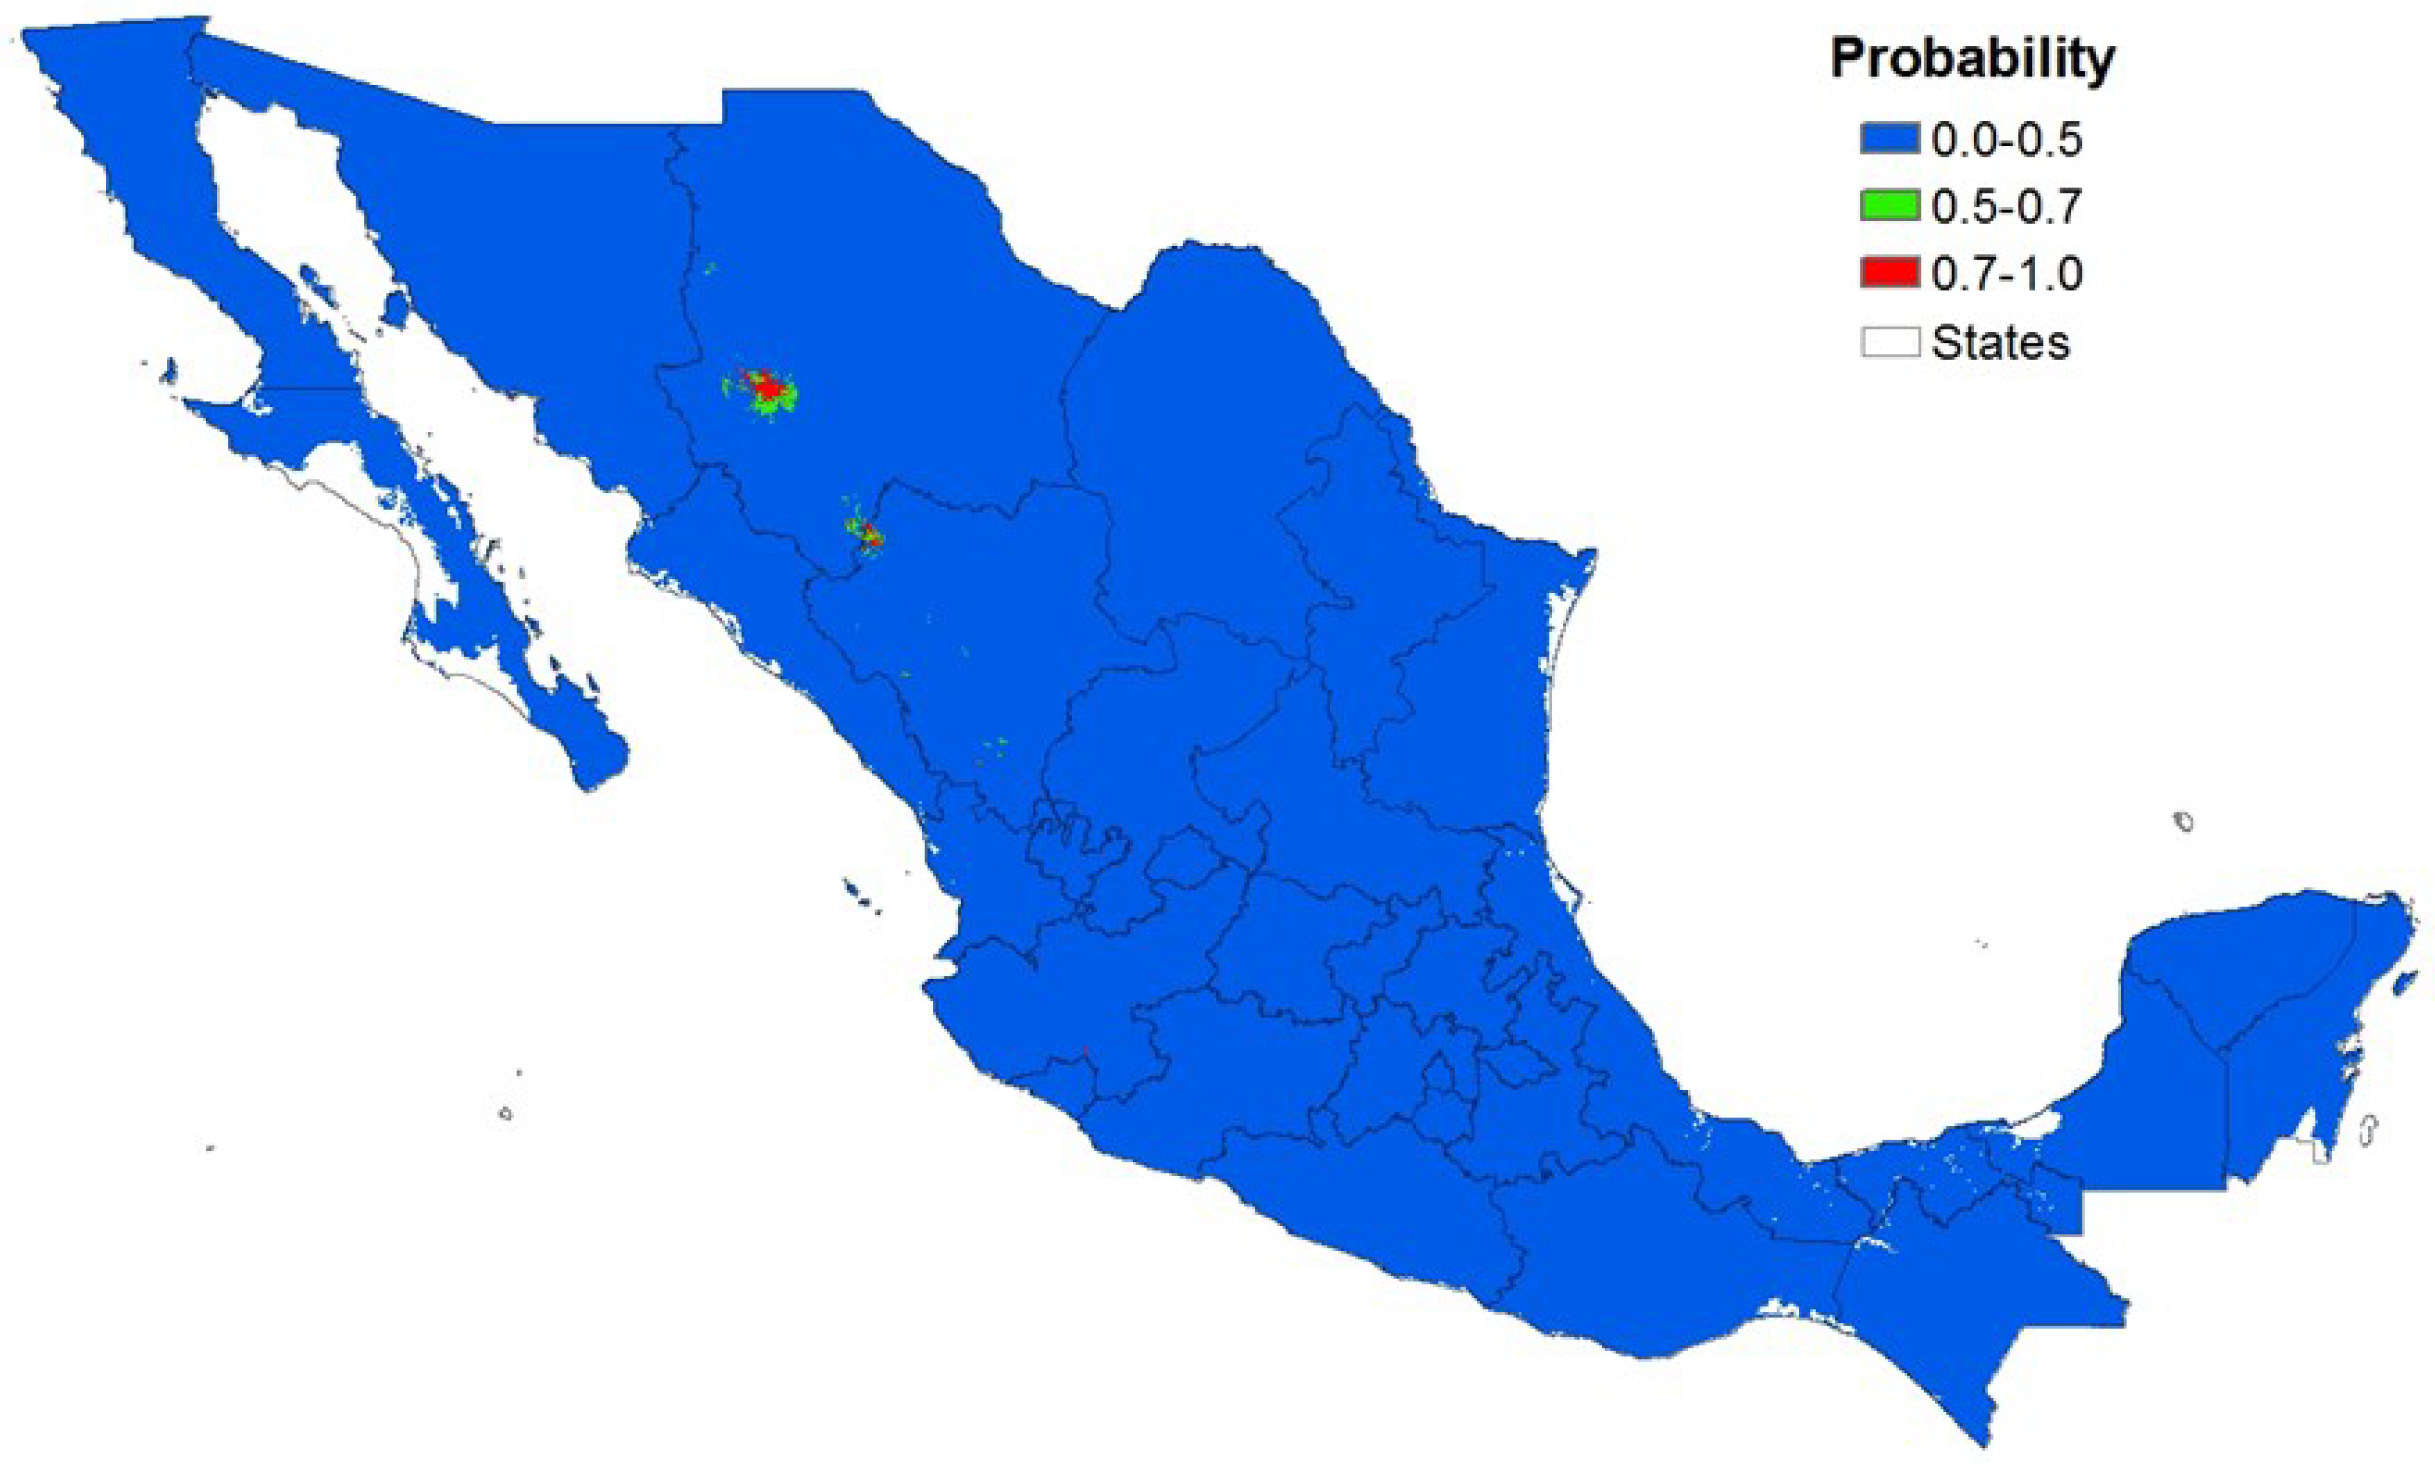
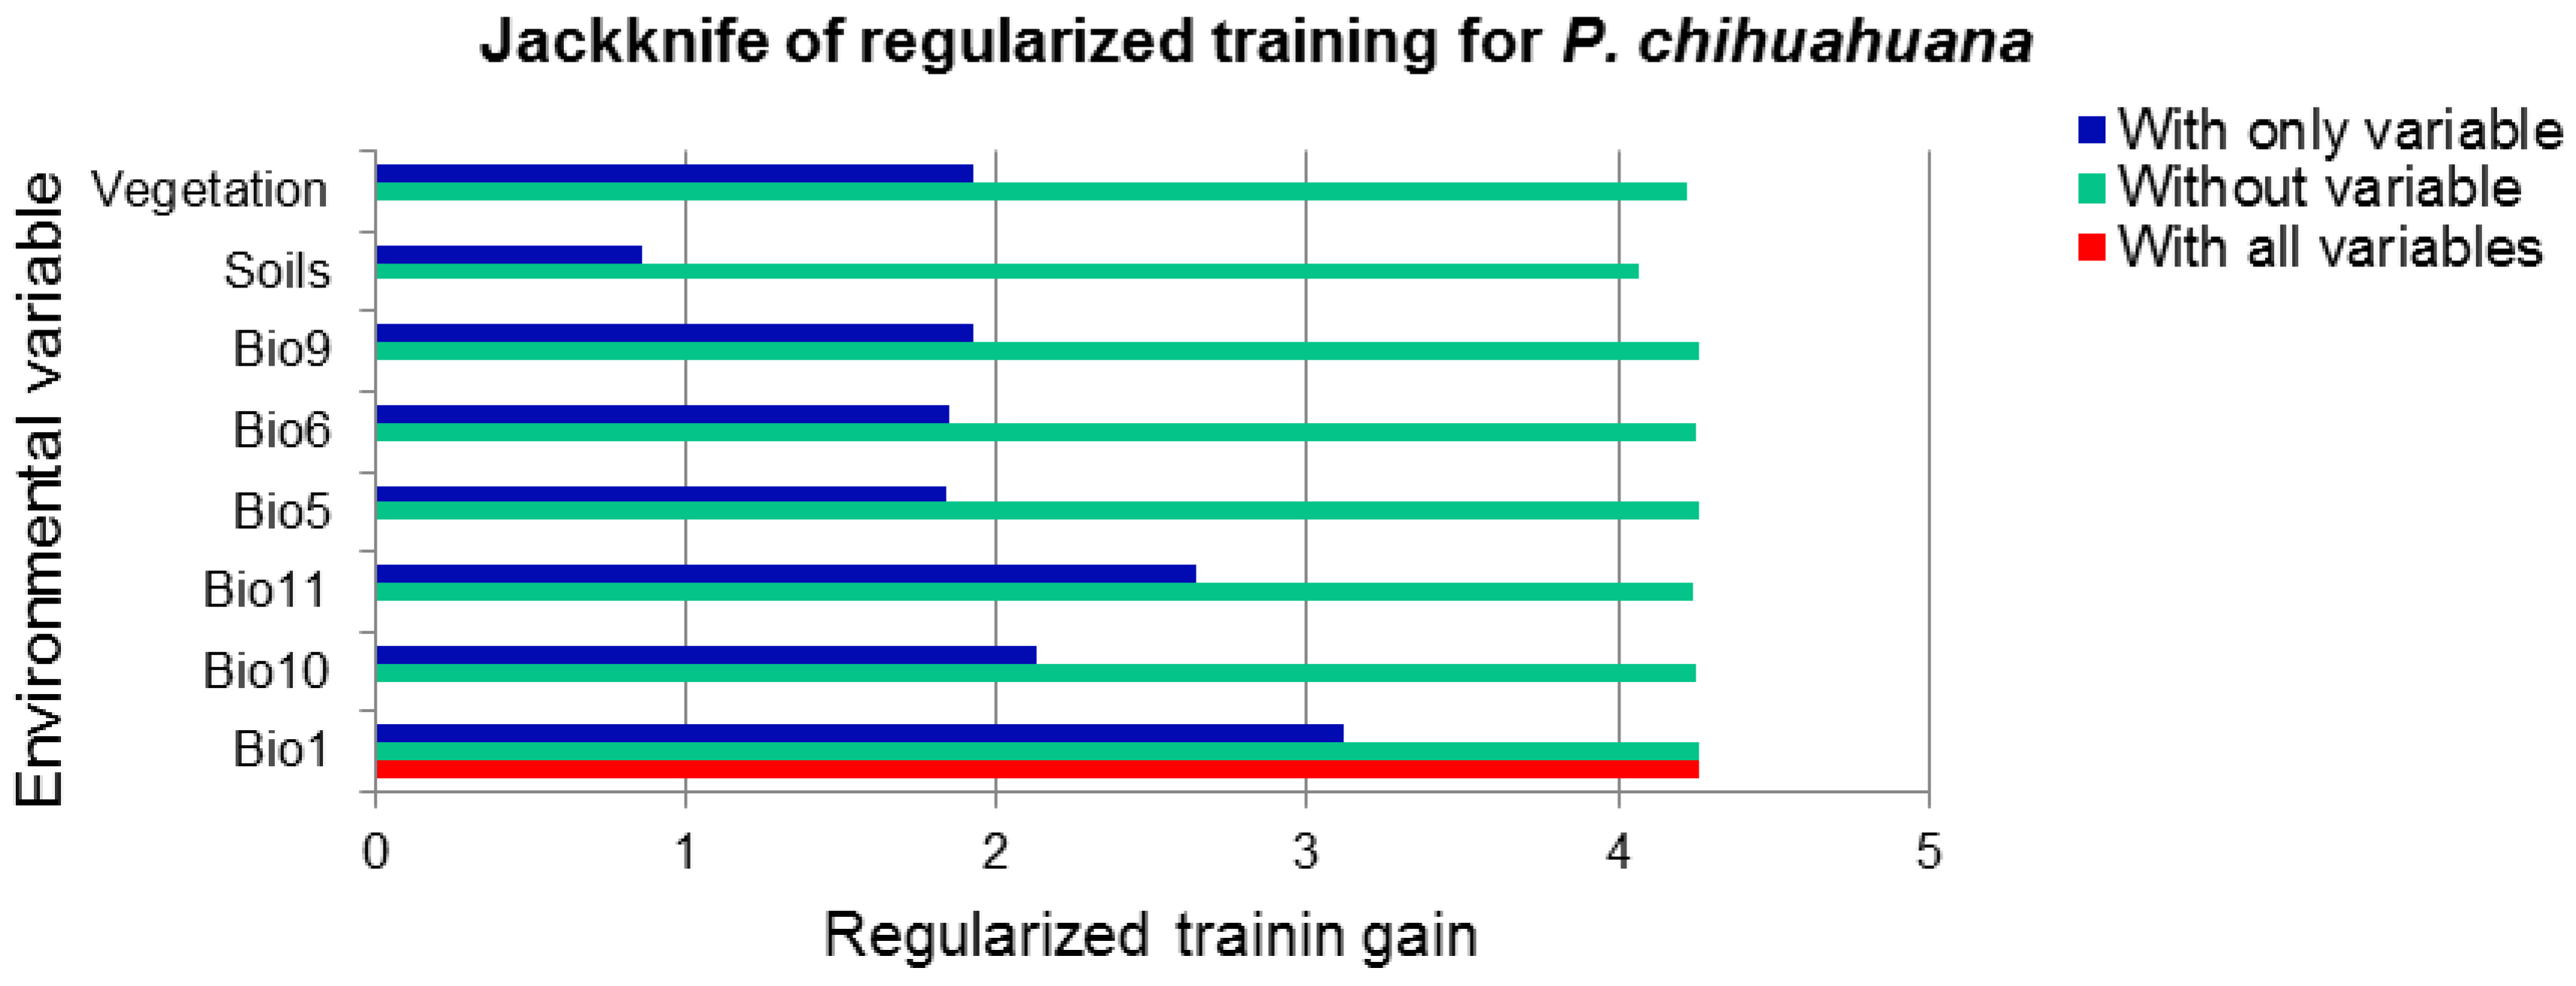
3.1. National Scale
| Variable | Contribution (%) | Permutation Importance |
|---|---|---|
| Minimum temperature of coldest month | 36.4 | 0.9 |
| Vegetation type | 19.8 | 0.1 |
| Soil type | 14.7 | 2.5 |
| Precipitation of coldest quarter | 11.9 | 2.9 |
| Precipitation of driest month | 4.4 | 4.0 |
| Mean temperature of coldest quarter | 3.9 | 35.1 |
| Precipitation of warmest quarter | 3.5 | 1.9 |
| Mean temperature of warmest quarter | 2.7 | 21.3 |
| Mean temperature of driest quarter | 0.9 | 0.0 |
| Mean annual temperature | 0.6 | 0.5 |
| Precipitation of driest quarter | 0.4 | 29.1 |
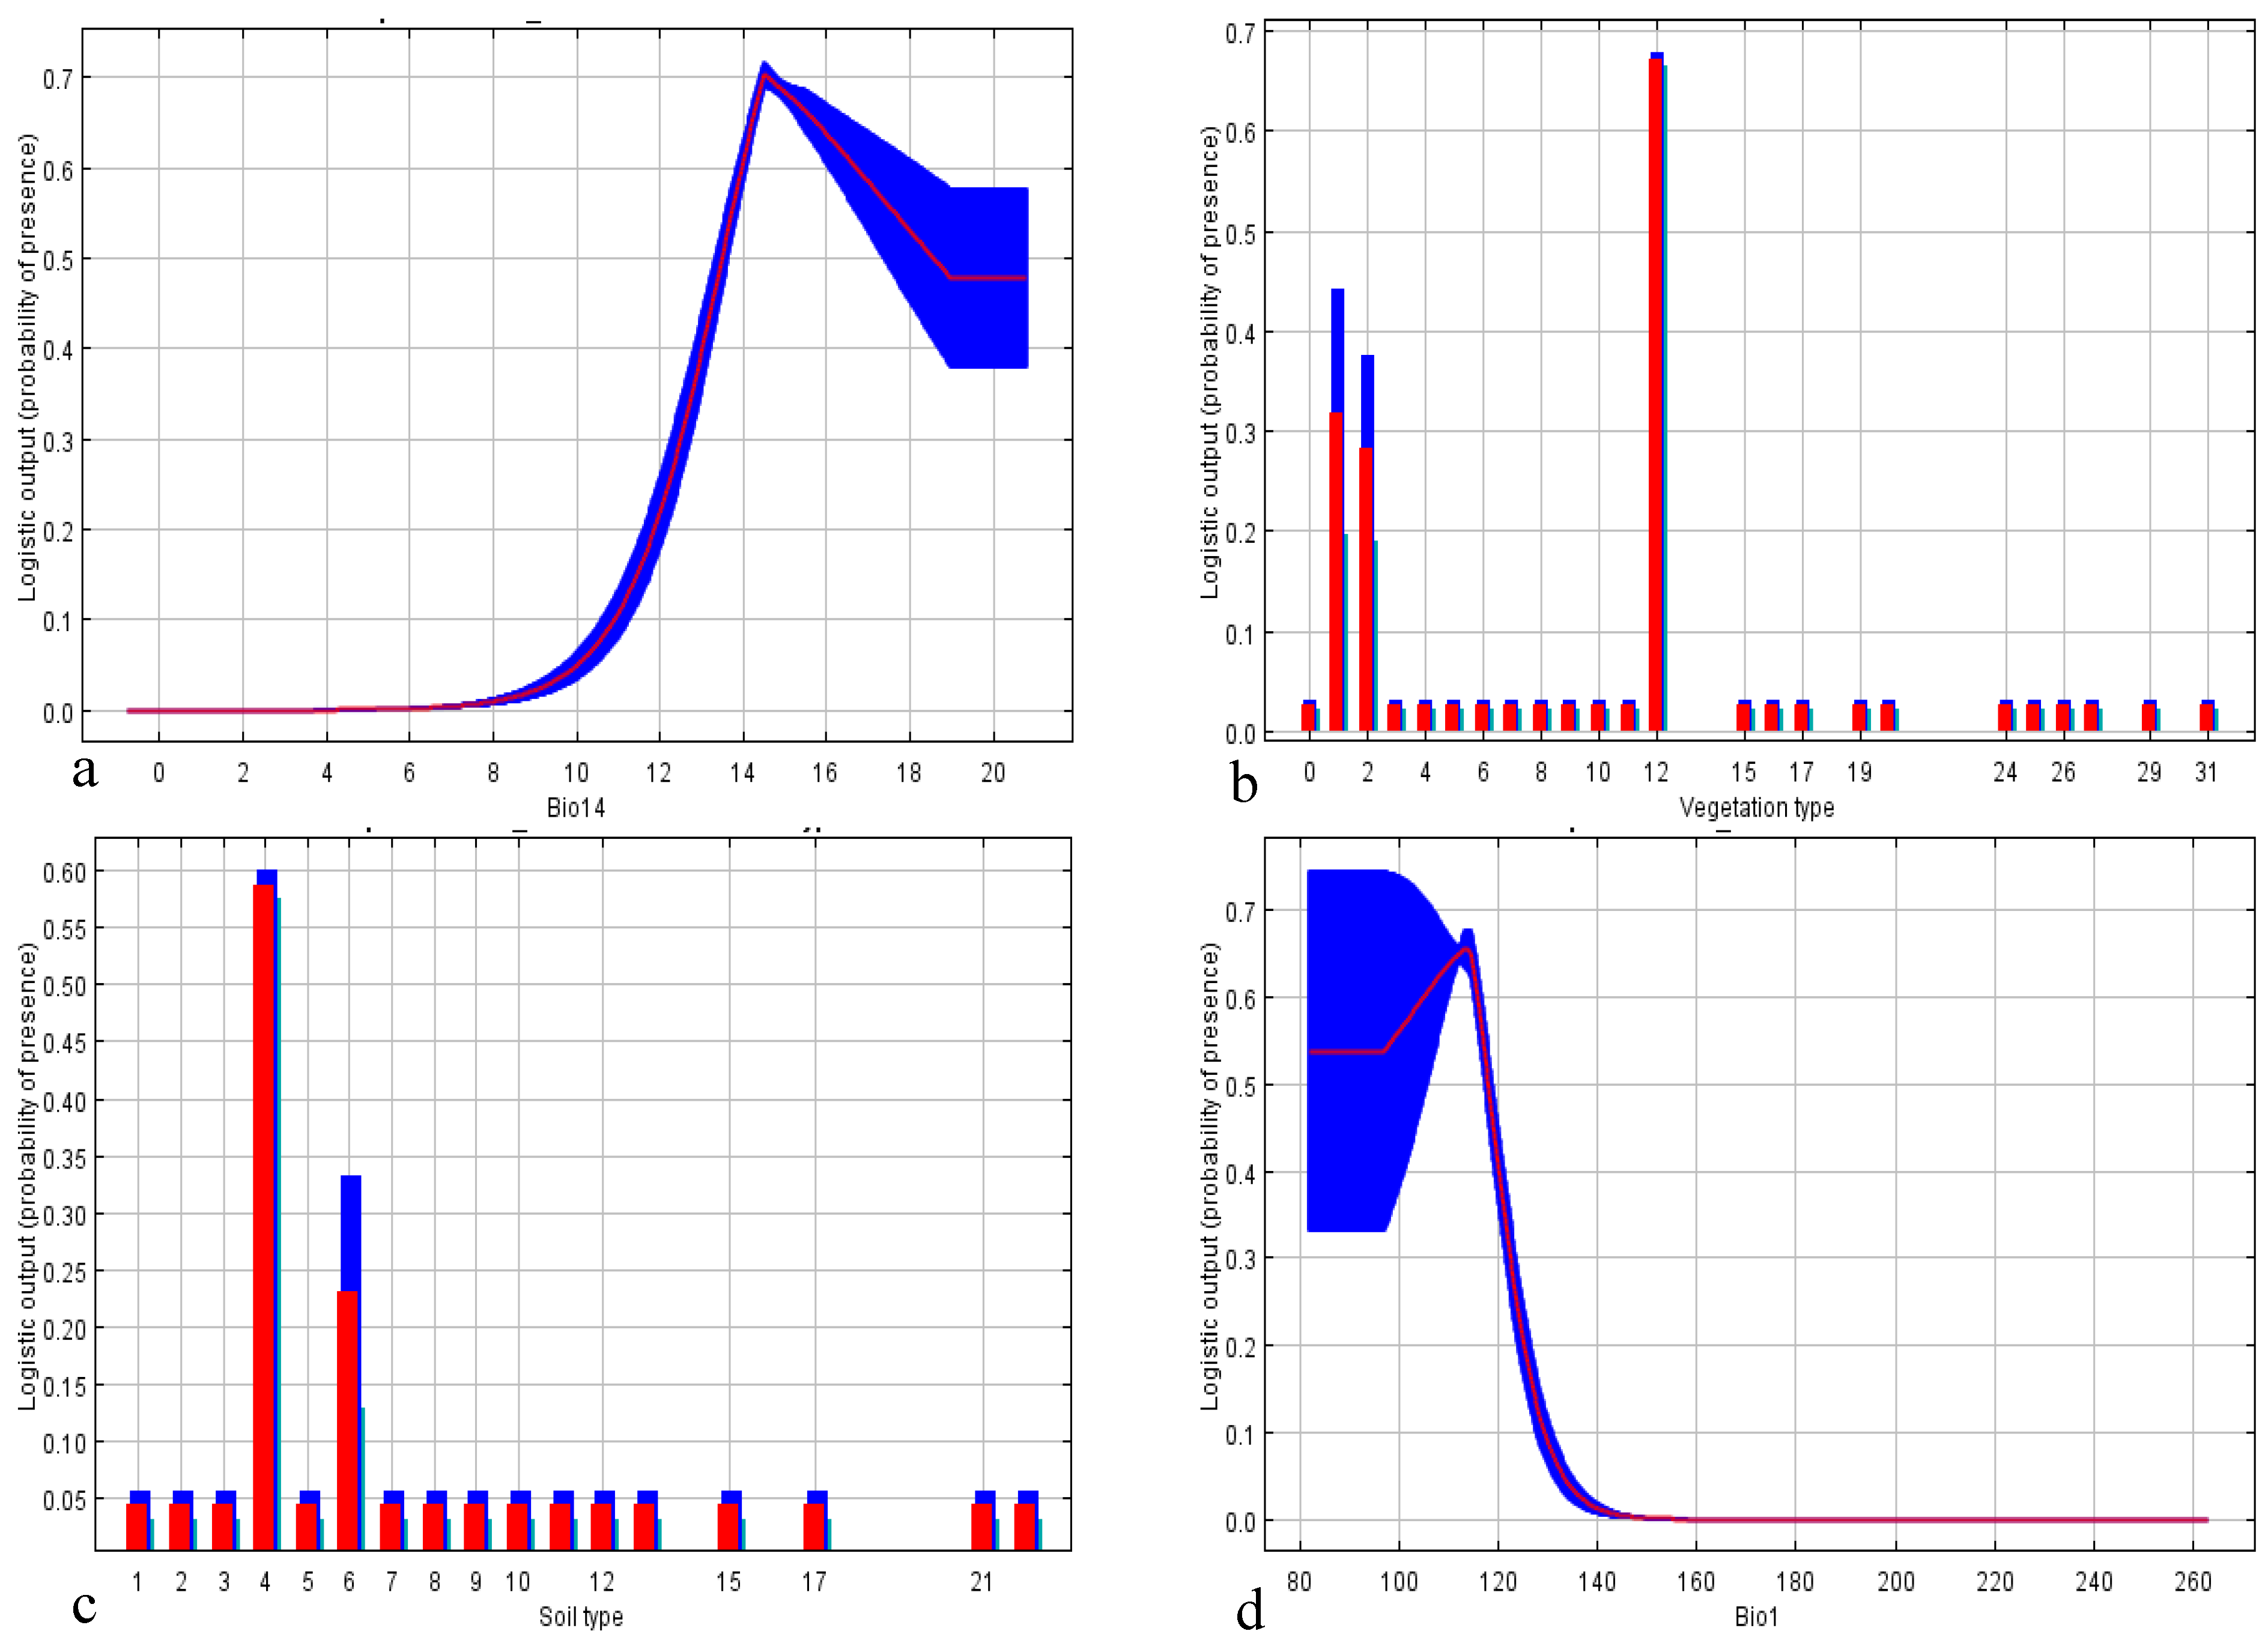
3.2. State Scale
| Variable | Contribution (%) | Permutation Importance |
|---|---|---|
| Precipitation of the driest month | 26.0 | 0.09 |
| Vegetation type | 19.3 | 1.0 |
| Mean annual temperature | 18.3 | 0.4 |
| Soil type | 16.3 | 3.4 |
| Precipitation of the coldest quarter | 5.0 | 13.3 |
| Isothermality | 4.3 | 0.1 |
| Seasonal temperature | 2.5 | 0.4 |
| Diurnal mean range | 1.9 | 18.9 |
| Minimum temperature of the coldest month | 1.6 | 8.4 |
| Mean temperature of the driest quarter | 1.2 | 27.9 |
| Normalized difference vegetation index (NDVI) | 0.9 | 1.0 |
| Mean temperature of the coldest quarter | 0.8 | 20.7 |
| Precipitation of the warmest quarter | 0.6 | 0.02 |


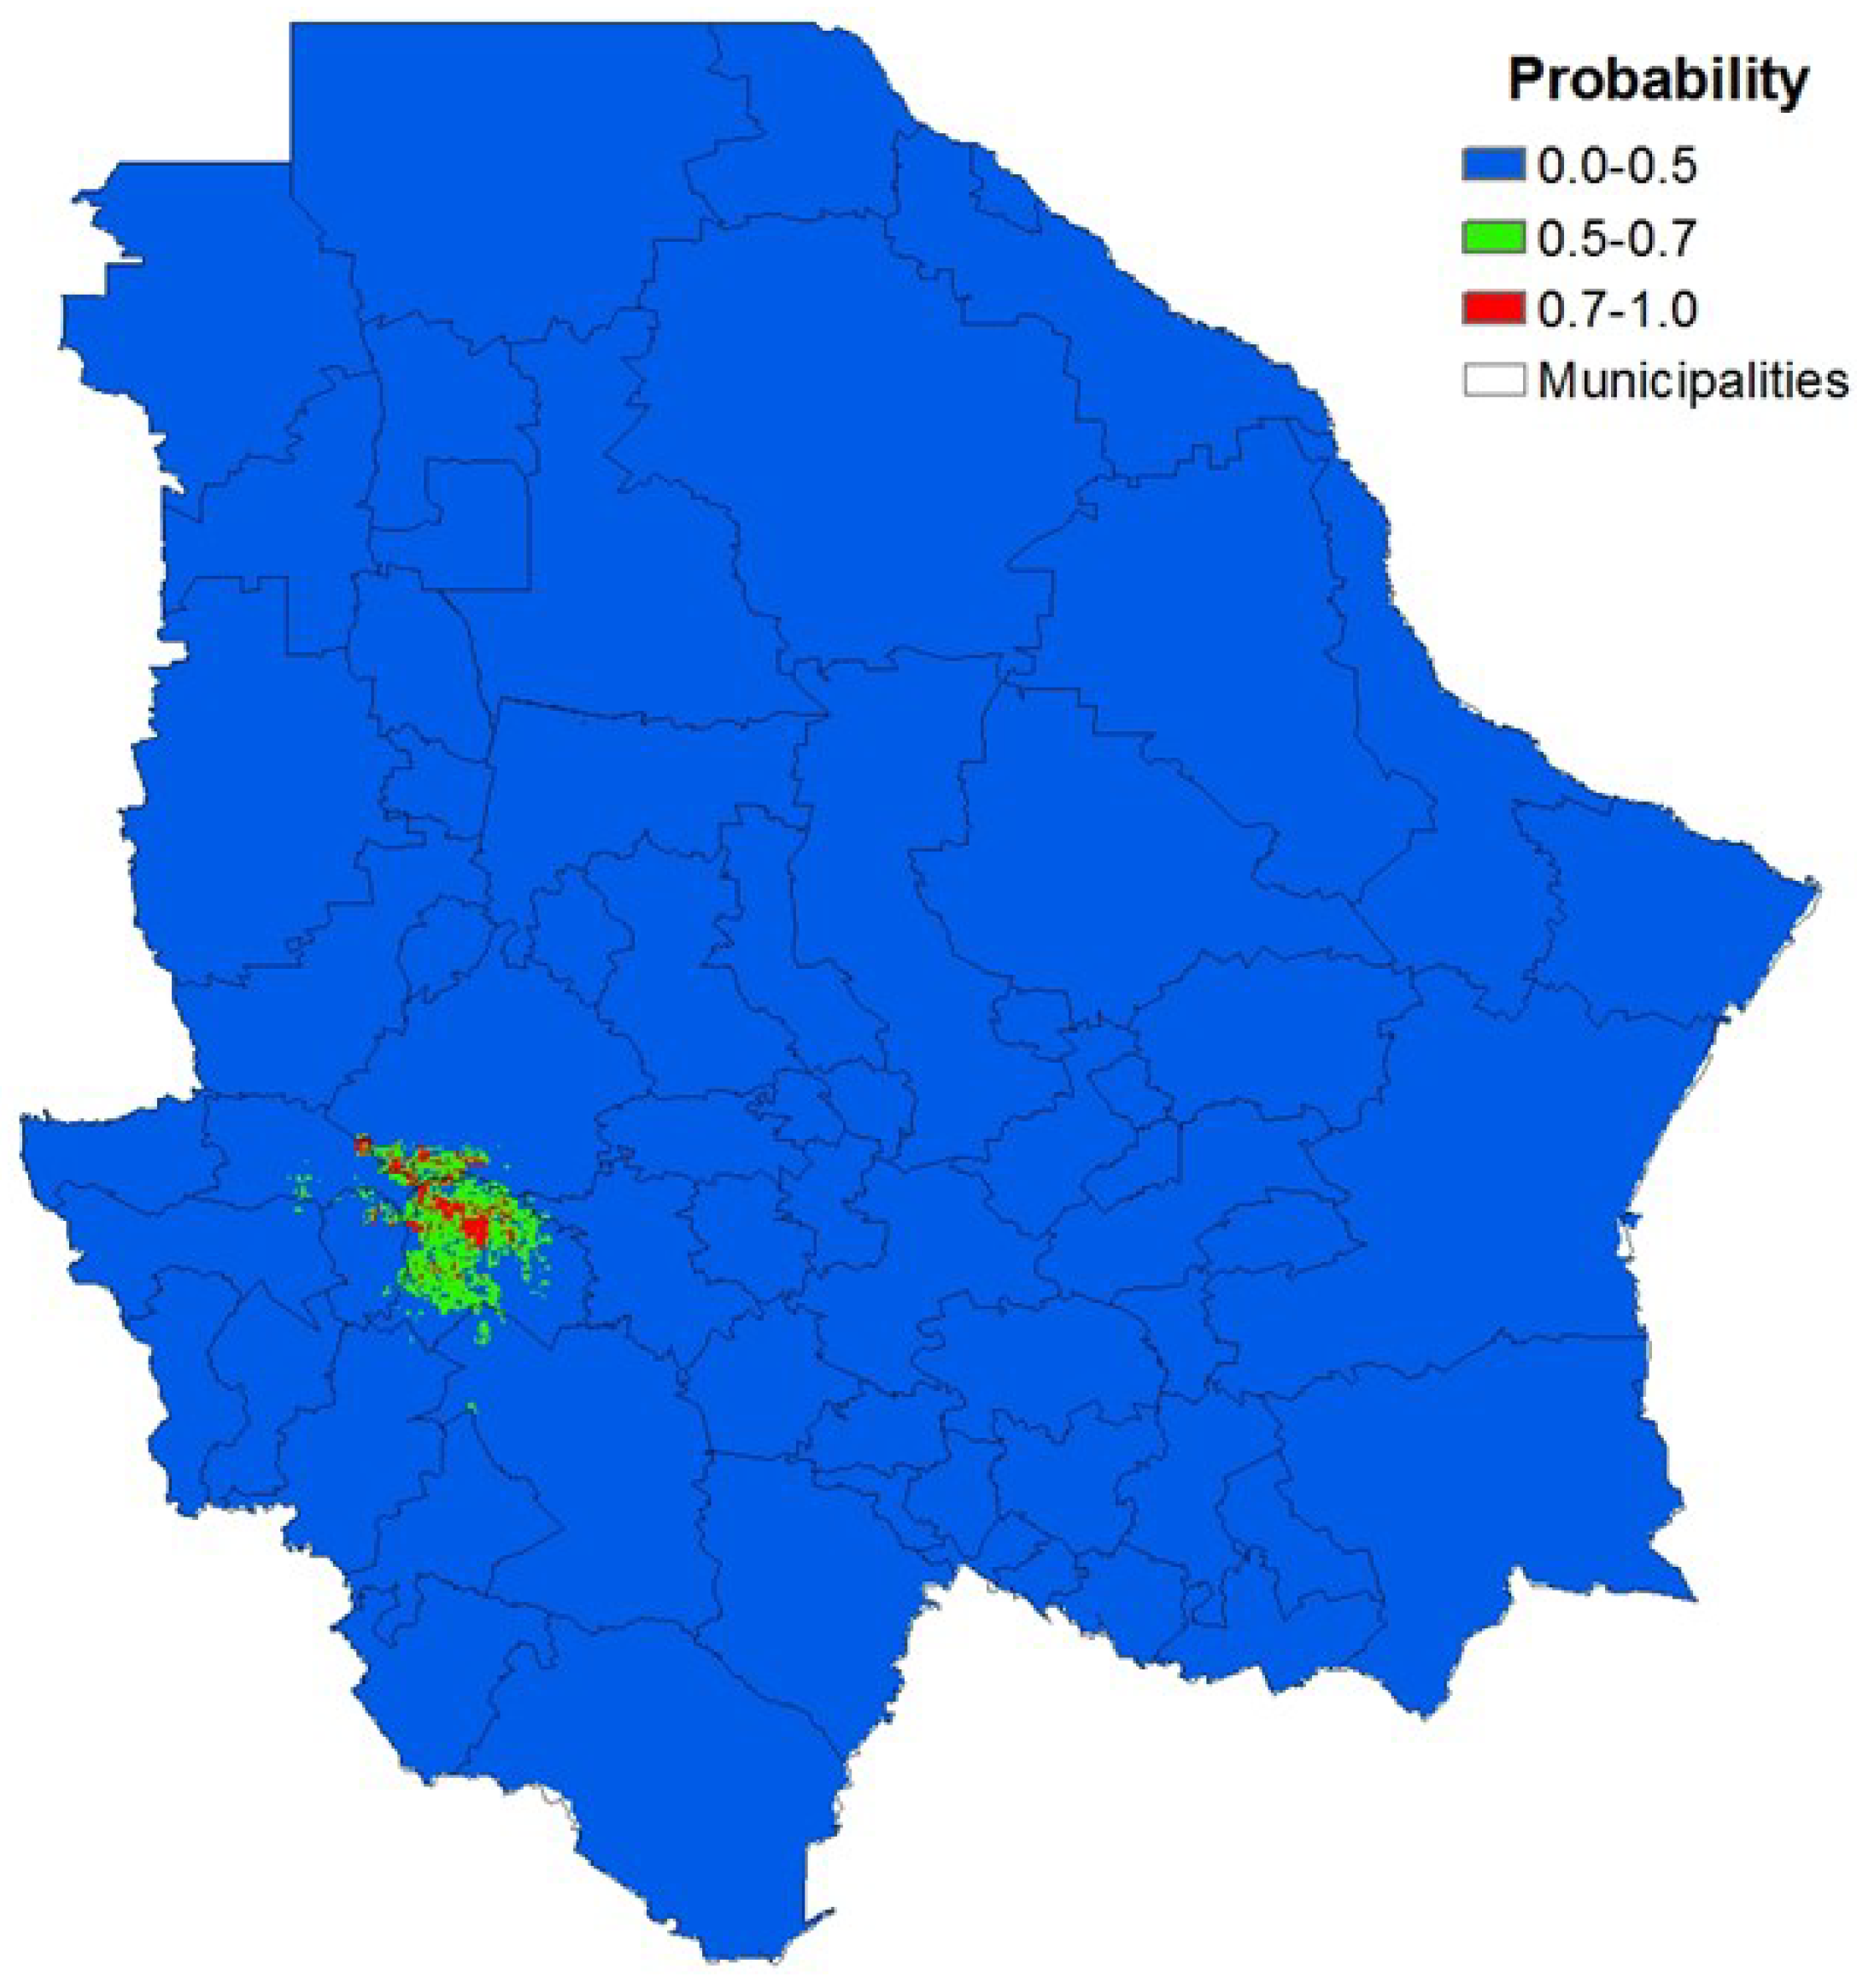
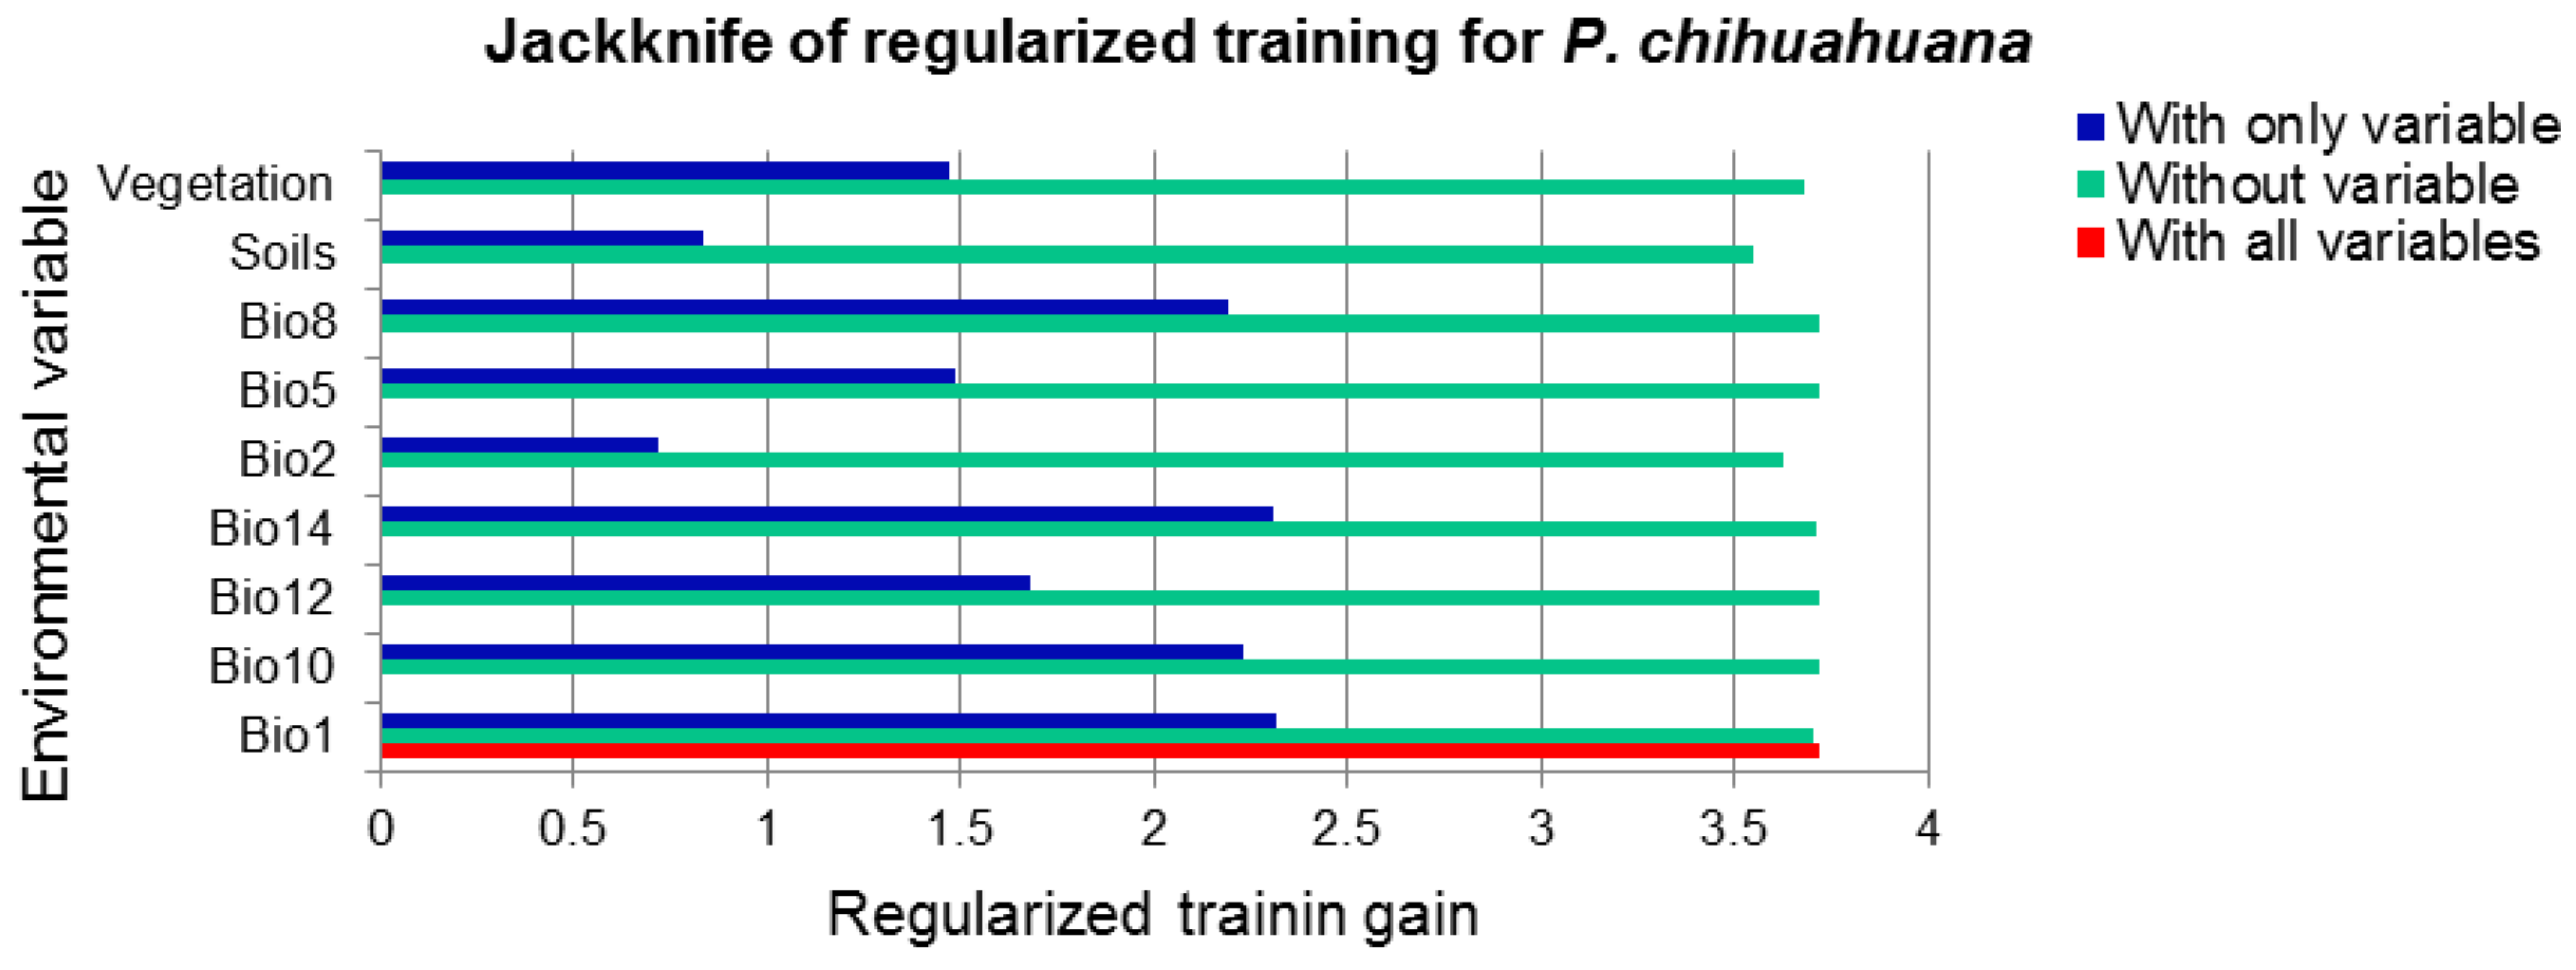
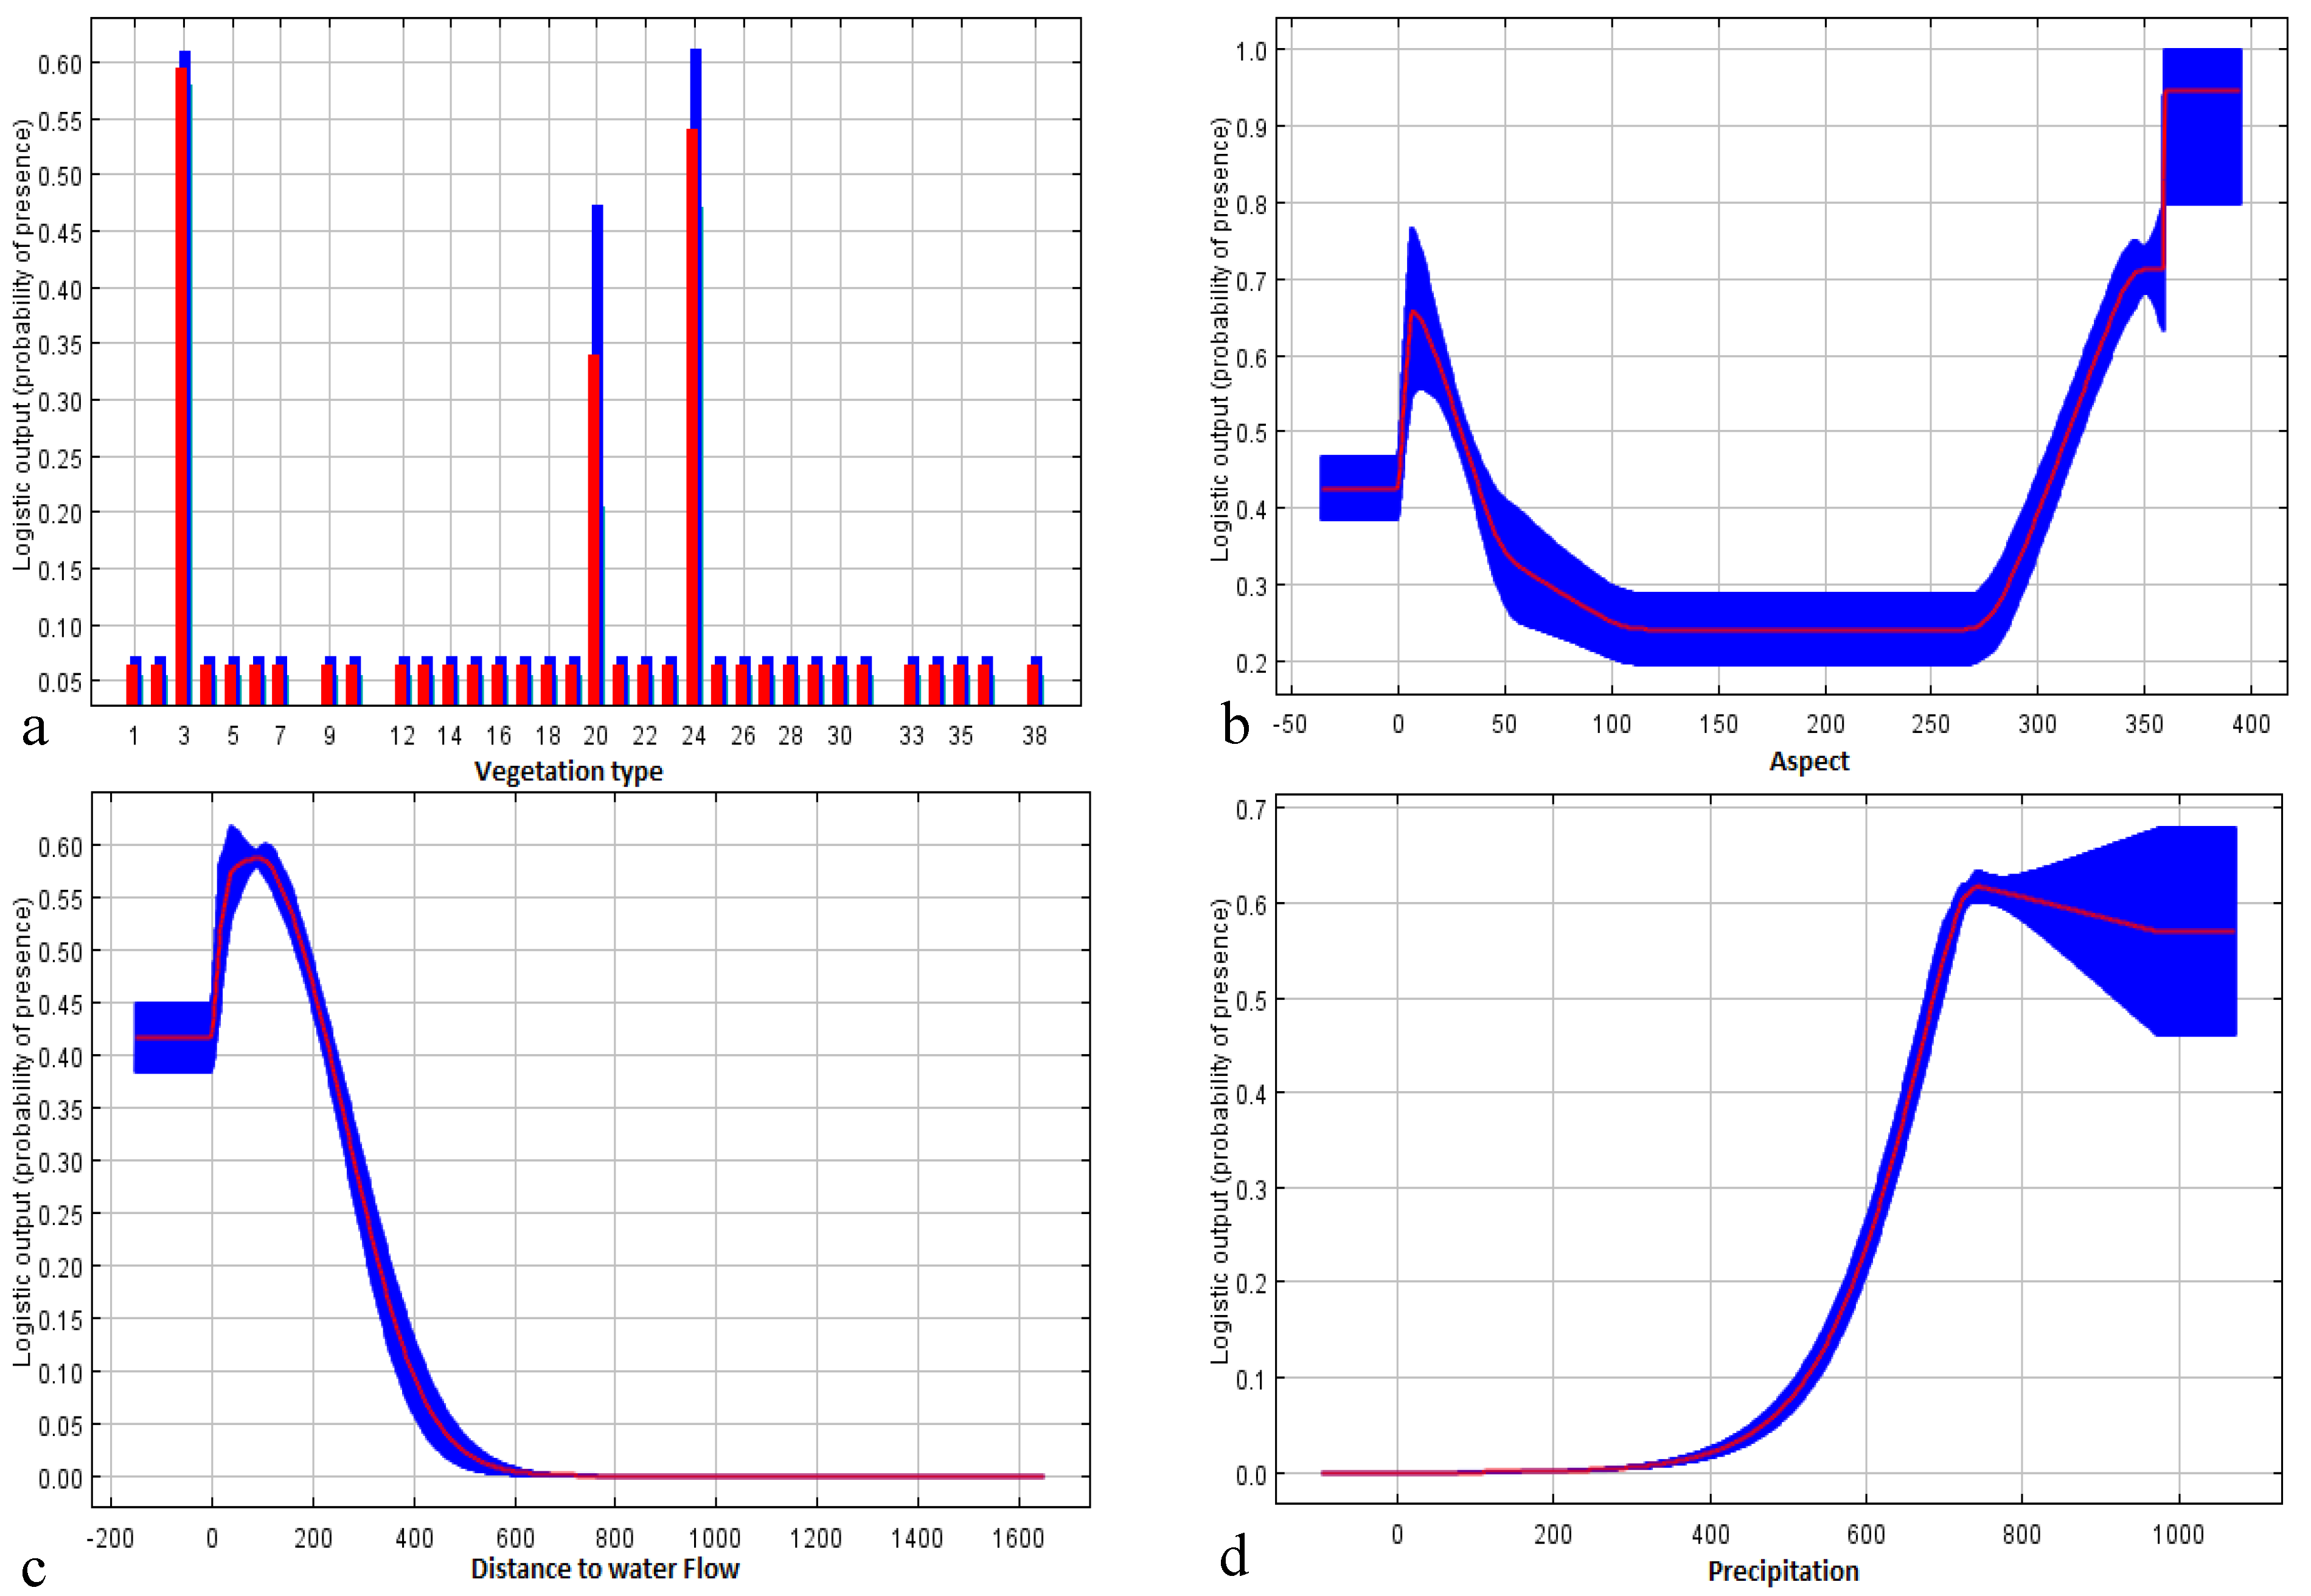
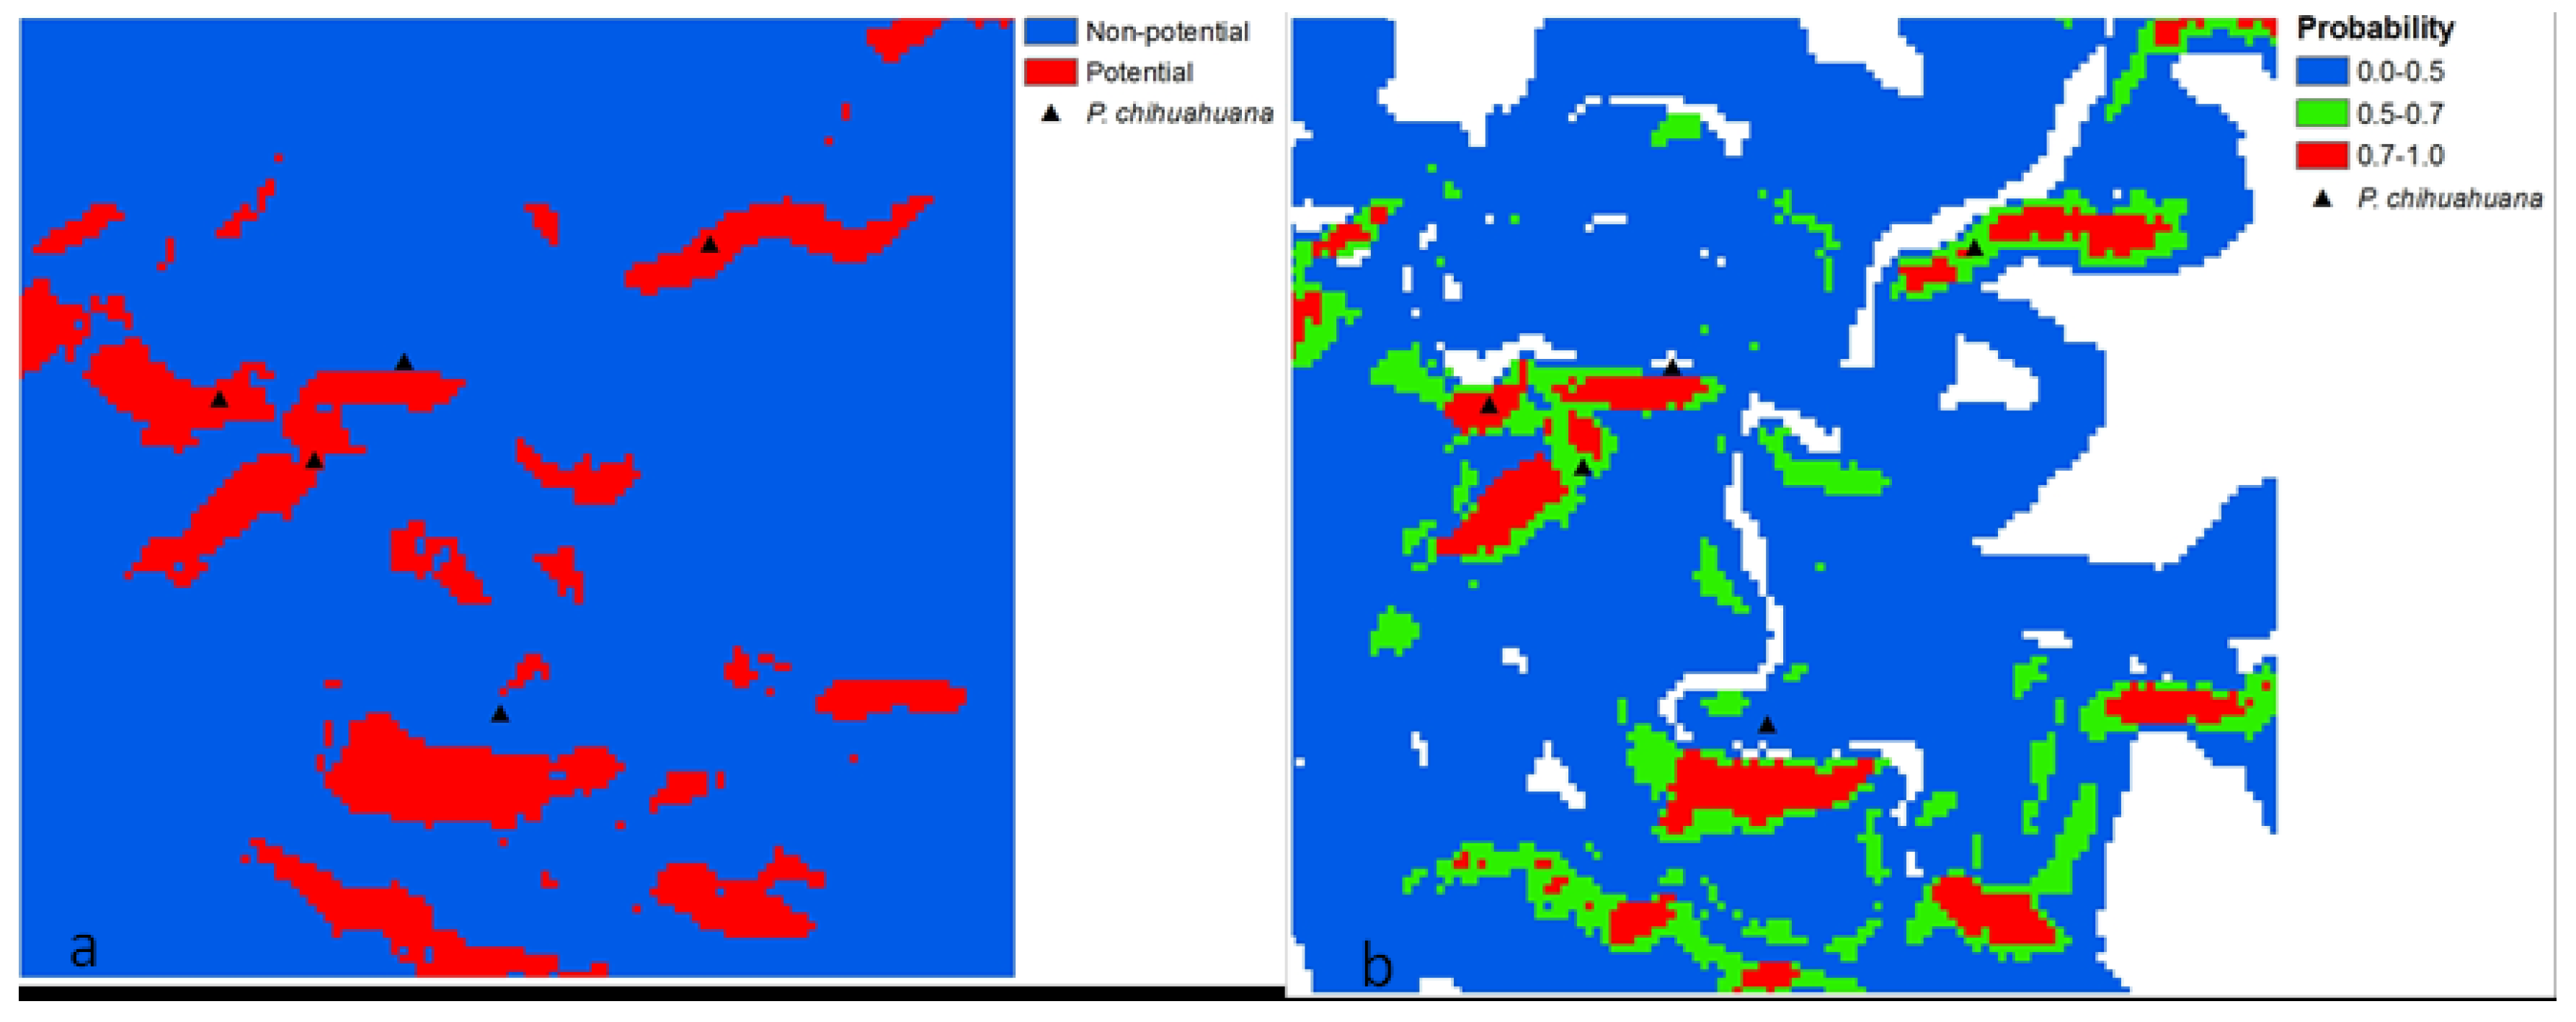
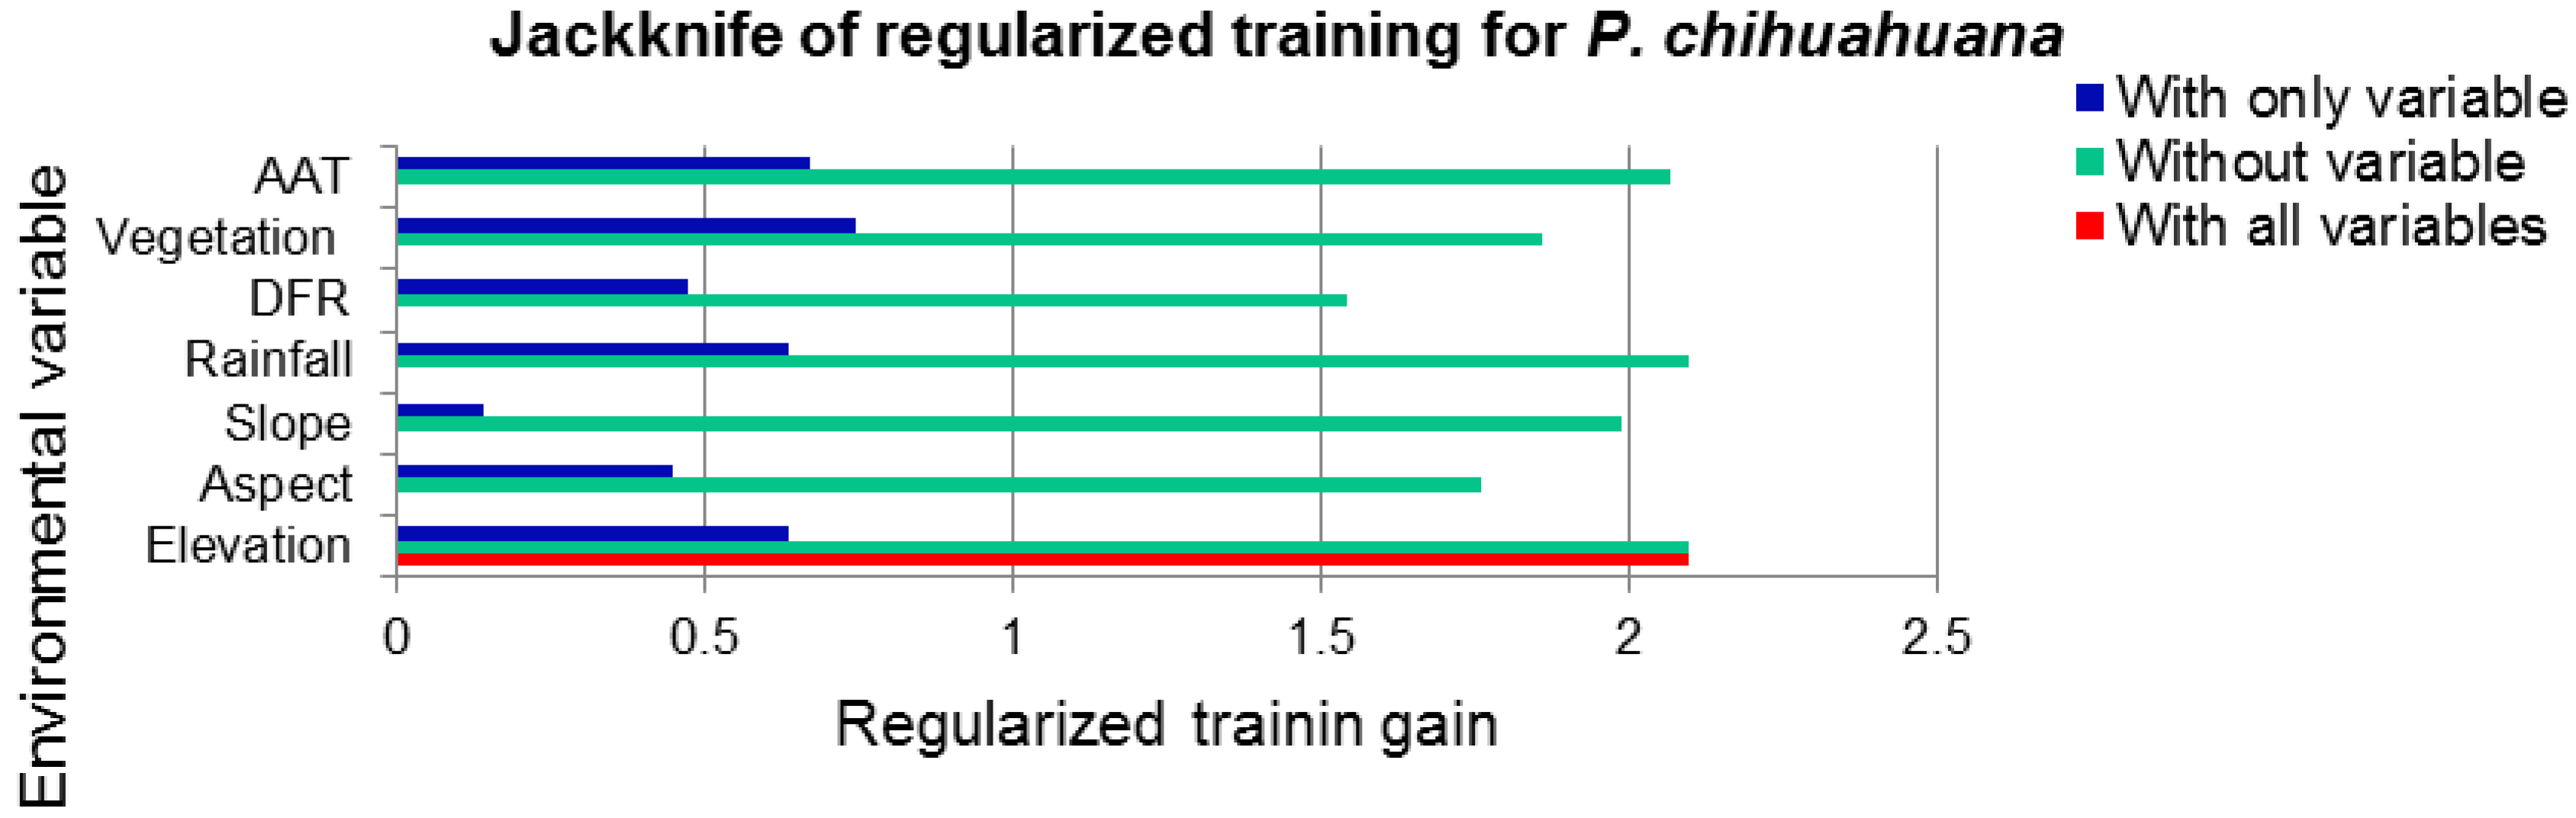
3.3. Local Scale
| Distribution | MaxEnt | Overlay Method | ||
|---|---|---|---|---|
| Area (km2) | Area (%) | Area (km2) | Area (%) | |
| Non-potential | 51,186 | 92.5 | 50,934 | 97.0 |
| Potential | 1,306 | 7.5 | 1,558 | 3.0 |
| Variable | Contribution (%) | Permutation Importance |
|---|---|---|
| Vegetation type | 30.9 | 10.0 |
| Aspect | 21.2 | 6.6 |
| Distance to water flows | 21.0 | 43.0 |
| Precipitation | 19.0 | 0.0 |
| Slope | 5.2 | 2.7 |
| Mean temperature | 1.7 | 36.8 |
| Altitude | 0.9 | 0.9 |

4. Discussion
5. Conclusions
Acknowledgments
Author Contributions
Conflicts of Interest
References
- Funk, V.A.; Richardson, K. Systematic data in biodiversity studies: Use it or lose it. Syst. Biol. 2002, 51, 303–316. [Google Scholar] [CrossRef] [PubMed]
- Rushton, S.P.; Ormerod, S.J.; Kerbyn, G. New paradigms for modelling species distributions? J. Appl. Ecol. 2004, 41, 193–200. [Google Scholar] [CrossRef]
- Ledig, F.T.; Rehfeldt, G.E.; Sáenz-Romero, C.; Flores-López, C. Projections of suitable habitat for rare species under global warming scenarios. Am. J. Bot. 2010, 97, 970–987. [Google Scholar] [CrossRef] [PubMed]
- Ferrier, S.; Guisan, A. Spatial modeling of biodiversity at the community level. J. Appl. Ecol. 2006, 43, 393–404. [Google Scholar] [CrossRef]
- Williams, J.N.; Seo, C.; Thorne, J.; Nelson, J.K.; Erwin, S.; O’Brien, J.M.; Schwartz, M.W. Using species distribution models to predict new occurrences for rare plants. Divers. Distrib. 2009, 15, 565–576. [Google Scholar] [CrossRef]
- Kumar, S.; Stohlgren, T.J. MaxEnt modeling for predicting suitable habitat for threatened and endangered tree Canacomyrica monticola in New Caledonia. J. Ecol. Nat. Environ. 2009, 1, 94–98. Available online: http://www.academicjournals.org/JENE (accessed on 5 November 2014). [Google Scholar]
- Pliscoff, P.; Fuentes-Castillo, T. Modelación de la distribución de especies y ecosistemas en el tiempo y en el espacio: una revisión de las nuevas herramientas y enfoques disponibles (Modeling the distribution of species and ecosystems in time and space: A review of available new tools and approaches). Rev. Geogr. Norte Gd. 2011, 48, 61–79. [Google Scholar] [CrossRef]
- Phillips, S.J.; Anderson, R.P.; Schapire, R.E. Maximum entropy modeling of species geographic distributions. Ecol. Model. 2006, 190, 231–259. [Google Scholar] [CrossRef]
- Elith, J.; Phillips, S.J.; Hastie, T.; Dudik, M.; Chee, Y.; Yates, C.A. Statistical explanation of MaxEnt for ecologists. Divers. Distrib. 2011, 17, 43–57. [Google Scholar] [CrossRef]
- Merow, C.; Smith, M.J.; Silander, J.A.J. A practical guide to MaxEnt for modeling species’ distributions: What it does, and why inputs and settings matter. Ecography 2013, 36, 1058–1069. [Google Scholar] [CrossRef]
- Gordon, A. Ecology of Picea chihuahuana Martínez. Ecology 1968, 49, 880–896. [Google Scholar] [CrossRef]
- Ledig, F.T.; Mapula-Larreta, M.; Bermejo-Velazquez, B.; Reyes-Hernandez, V.; Flores-Lopez, C.; Capo-Arteaga, M.A. Locations of endangered spruce populations in México and the demography of Picea chihuahuana. Madroño 2000, 47, 71–88. Available online: http://www.fs.fed.us/psw/publications/ledig/psw_2000_ledig001.pdf (accessed on 23 November 2014). [Google Scholar]
- SEMARNAT. Norma oficial mexicana NOM-059-SEMARNAT-2010 que determina las especies nativas de México de flora y fauna silvestres–categorías de riesgo y especificaciones para su inclusión, exclusión o cambio–lista de especies en riesgo; Secretaria del Medio Ambiente y Recursos Naturales, Diario Oficial de la Federación, 2nd Section: Distrito Federal, D.F., Mexico, 30 December 2010. [Google Scholar]
- Quiñones-Pérez, C.Z.; Sáenz-Romero, C.; Wehenkel, C. Genetic diversity and conservation of Picea chihuahuana Martínez: A review. Afr. J. Biotechnol. 2014, 13, 2786–2795. [Google Scholar] [CrossRef]
- Sáenz-Romero, C.; Rehfeldt, G.E.; Crookston, N.L.; Duval, P.; St-Amant, R.; Beaulieu, J.; Richardson, B.A. Spline models of contemporary, 2030, 2060 and 2090 climates for Mexico and their use in understanding climate-change impacts on the vegetation. Clim. Chang. 2010, 102, 595–623. [Google Scholar] [CrossRef]
- Narváez, F.R. Contribución al conocimiento de la ecología de Picea chihuahuana. Bachelor Thesis, Universidad Autónoma de Nuevo León, Nuevo León, Mexico, July 1984. [Google Scholar]
- Wehenkel, C.; Sáenz-Romero, C. Estimating genetic erosion using the example of Picea chihuahuana Martínez. Tree Genet. Genomes 2012, 8, 1085–1094. [Google Scholar] [CrossRef]
- Ledig, E.T.; Jacob-Cervantes, V.; Hodgskiss, P.D.; Eguiluz-Piedra, T. Recent evolution and divergence among populations of a rare Mexican endemic, Chihuahua spruce, following Holocene climatic warming. Evolution 1997, 51, 1815–1827. [Google Scholar] [CrossRef]
- Sánchez, C.J.; Narváez, R. Picea chihuahuana Mrtz. Una conífera en peligro de extinción, 1st ed.; Instituto Nacional de Investigaciones Forestales y Agrícolas y Pecuarias (INIFAP): Madera, Chih., Mexico, 1983; pp. 1–17. [Google Scholar]
- Sánchez, M.G. Detección de áreas potenciales para la propagación del pinabete espinoso (Picea chihuahuana Martínez); Instituto Nacional de Investigaciones Forestales Agrícolas y Pecuarias (INIFAP): Madera, Chih., Mexico, 1996; pp. 1–28. [Google Scholar]
- Medina, G.; Diaz, G.; Berzoza, M.; Silva, M.M.; Chavez, A.H.; Baez, A.D. Estadísticas climatológicas básicas del estado de Chihuahua (periodo 1961-2003), 1st ed.; Instituto Nacional de Investigaciones Forestales, Agrícolas y Pecuarias (INIFAP): Chihuahua, Chih., Mexico, 2006; pp. 1–235. [Google Scholar]
- INEGI. Instituto Nacional de Estadistica y Geografia. Available online: http://gaia.inegi.org.mx/NLB/mdm5.wms (accessed on 2 July 2014).
- Loiselle, B.A.; Jørgensen, P.M.; Consiglio, T.; Jiménez, I.; Blake, J.G.; Lohmann, L.G.; Montiel, O.M. Predicting species distributions from herbarium collections: Does climate bias in collection sampling influence model outcomes? J. Biogeogr. 2008, 35, 105–116. [Google Scholar]
- Eastman, J.R. IDRISI Kilimanjaro Guide to GIS and Image Processing; Clark Labs, Clark University: Worcester, MA, USA, 2003; p. 306. [Google Scholar]
- Fielding, A.H. What are the appropriate characteristics of an accuracy measure? In Predicting Species Occurrences: Issues of Accuracy and Scale, 1st ed.; Scott, J.M., Heglund, P., Morrison, M.L., Raven, P.H., Eds.; Island Press: Washington, DC, USA, 2002; pp. 271–280. [Google Scholar]
- Reineking, B.; Schröder, B. Constrain to perform: Regularization of habitat models. Ecol. Model. 2006, 193, 675–690. [Google Scholar] [CrossRef]
- Guisan, A.; Graham, C.H.; Elith, J.; Huettmann, F.; NCEAS Species Distribution Modelling Group. Sensitivity of predictive species distribution models to change in grain size. Divers. Distrib. 2007, 13, 332–340. [Google Scholar] [CrossRef]
- Phillips, S.; Dudík, M.; Elith, J.; Graham, C.; Lehmann, A.; Leathwick, J.; Ferrier, S. Sample selection bias and presence-only distribution models: implications for background and pseudo-absence data. Ecol. Appl. 2009, 19, 181–197. [Google Scholar] [CrossRef] [PubMed]
- Wolmarans, R.; Robertson, M.P.; van Rensburg, B.J. Predicting invasive alien plant distributions: how geographical bias in occurrence records influences model performance. J. Biogeogr. 2010, 9, 1797–1810. [Google Scholar] [CrossRef]
- Rovzar, C.; Gillespie, T.W.; Kawelo, K.; McCain, M.; Riordan, E.C.; Pau, S. Modelling the potential distribution of endangered, endemic Hibiscus brackenridgei on Oahu to assess the impacts of climate change and prioritize conservation efforts. Pac. Conserv. Biol. 2013, 19, 156–168. Available online: http://search.informit.com.au/documentSummary;dn=657858239256885;res=IELNZC (accessed on 25 November 2014). [Google Scholar]
- Wiser, S.K.; Peet, K.; White, P.S. Prediction of rare plant occurrence: A southern appalachian example. Ecol. Appl. 1998, 8, 909–920. [Google Scholar] [CrossRef]
- Rupprecht, F.; Oldeland, J.; Finckh, M. Modelling potential distribution of the threatened tree species Juniperus oxycedrus: How to evaluate the predictions of different modelling approaches? J. Veg. Sci. 2011, 22, 647–659. [Google Scholar] [CrossRef]
- Pearson, R.G.; Dawson, T.P. Predicting the impacts of climate change on the distribution of species: Are bioclimate envelope models useful? Glob. Ecol. Biogeogr. 2003, 12, 361–371. [Google Scholar] [CrossRef]
- Messick, J.A.; Hoagland, B.W. Potential distribution modeling of Penstemon oklahomensis (Plantaginaceae). J. Bot. Res. Inst. Texas 2013, 2, 891–899. Available online: http://connection.ebscohost.com/c/articles/93660005/potential-distribution-modeling-penstemon-oklahomensis-plantaginaceae (accessed on 23 November 2014). [Google Scholar]
- Nakazato, T.; Warren, D.L.; Moyle, L.C. Ecological and geographic modes of species divergence in wild tomatoes. Am. J. Bot. 2010, 97, 680–693. [Google Scholar] [CrossRef] [PubMed]
- Jaramillo-Correa, J.P.; Beaulieu, J.; Ledig, F.T.; Bousquet, J. Decoupled mitochondrial and chloroplast DNA population structure reveals Holocene collapse and population isolation in a threatened Mexican-endemic conifer. Mol. Ecol. 2006, 15, 2787–2800. [Google Scholar] [CrossRef] [PubMed]
- Ledig, F.T. Climate change and conservation. Acta Silvatica et Lignaria Hungarica 2012, 8, 57–74. [Google Scholar] [CrossRef]
- Quiñones-Pérez, C.Z.; Simental-Rodríguez, S.L.; Saenz-Romero, C.; Jaramillo-Correa, J.P.; Wehenkel, C. Spatial genetic structure in the very rare and species-rich Picea chihuahuana tree community (Mexico). Silvae Genet. 2015, in press. [Google Scholar]
© 2015 by the authors; licensee MDPI, Basel, Switzerland. This article is an open access article distributed under the terms and conditions of the Creative Commons Attribution license (http://creativecommons.org/licenses/by/4.0/).
Share and Cite
Aguilar-Soto, V.; Melgoza-Castillo, A.; Villarreal-Guerrero, F.; Wehenkel, C.; Pinedo-Alvarez, C. Modeling the Potential Distribution of Picea chihuahuana Martínez, an Endangered Species at the Sierra Madre Occidental, Mexico. Forests 2015, 6, 692-707. https://doi.org/10.3390/f6030692
Aguilar-Soto V, Melgoza-Castillo A, Villarreal-Guerrero F, Wehenkel C, Pinedo-Alvarez C. Modeling the Potential Distribution of Picea chihuahuana Martínez, an Endangered Species at the Sierra Madre Occidental, Mexico. Forests. 2015; 6(3):692-707. https://doi.org/10.3390/f6030692
Chicago/Turabian StyleAguilar-Soto, Victor, Alicia Melgoza-Castillo, Federico Villarreal-Guerrero, Christian Wehenkel, and Carmelo Pinedo-Alvarez. 2015. "Modeling the Potential Distribution of Picea chihuahuana Martínez, an Endangered Species at the Sierra Madre Occidental, Mexico" Forests 6, no. 3: 692-707. https://doi.org/10.3390/f6030692