Article

Analysis of Unmanned Aerial System-Based CIR Images in Forestry—A New Perspective to Monitor Pest Infestation Levels

by
Jan Rudolf Karl Lehmann
1,*,
Felix Nieberding
1,
Torsten Prinz
2 and
Christian Knoth
2
1
Institute of Landscape Ecology, University of Münster, Heisenbergstr.2, 48149 Münster, Germany
2
Institute of Geoinformatics, University of Münster, Heisenbergstr.2, 48149 Münster, Germany
*
Author to whom correspondence should be addressed.
Forests 2015, 6(3), 594-612; https://doi.org/10.3390/f6030594
Submission received: 3 February 2015 / Accepted: 15 February 2015 / Published: 2 March 2015

Abstract

:
The detection of pest infestation is an important aspect of forest management. In the case of the oak splendour beetle (Agrilus biguttatus) infestation, the affected oaks (Quercus sp.) show high levels of defoliation and altered canopy reflection signature. These critical features can be identified in high-resolution colour infrared (CIR) images of the tree crown and branches level captured by Unmanned Aerial Systems (UAS). In this study, we used a small UAS equipped with a compact digital camera which has been calibrated and modified to record not only the visual but also the near infrared reflection (NIR) of possibly infested oaks. The flight campaigns were realized in August 2013, covering two study sites which are located in a rural area in western Germany. Both locations represent small-scale, privately managed commercial forests in which oaks are economically valuable species. Our workflow includes the CIR/NIR image acquisition, mosaicking, georeferencing and pixel-based image enhancement followed by object-based image classification techniques. A modified Normalized Difference Vegetation Index (NDVImod) derived classification was used to distinguish between five vegetation health classes, i.e., infested, healthy or dead branches, other vegetation and canopy gaps. We achieved an overall Kappa Index of Agreement (KIA) of 0.81 and 0.77 for each study site, respectively. This approach offers a low-cost alternative to private forest owners who pursue a sustainable management strategy.

Graphical Abstract

1. Introduction

It is predicted that climate change will cause an increase in annual temperature across Central Europe, which will cause a rise in the frequency of extreme weather events. These factors are recognised to facilitate the spread of forest diseases, with the main concern being tree pests [1,2]. In Germany, oak forests become frequently infested by populations of the splendour beetle Agrilus biguttatus (Fabricius, 1777) and cuttings of trees suffering damage caused by these beetles caused a significant amount of unplanned harvests in Germany over the recent years [3,4]. Forest owners and managers are anxious about these problems, and are tackling the issues through frequent monitoring of oak forest stands. This provides essential information for early detection of diseased trees and prevention of disease spread. However, traditionally the assessment of pest induced vegetation anomalies in canopy pattern is performed with laborious and time-consuming field sampling methods [5,6]. Additionally it might be hampered in very dense forests due to a difficult access to the canopy.
Consequently, remote sensing techniques are widely applied in the detection and monitoring of pest infestations in forests [7,8,9,10]. Multi-spectral infrared (IR)-imagery derived from high flying aircraft [11,12], commercial satellites, or multi-temporal public datasets like the ASTER or Landsat Thematic Mapper satellite system [13,14,15], has been extensively used for conservation and forest restoration monitoring [16,17]. However, privately owned oak forest stands pose challenges to conventional remote sensing approaches. These forests show limited spatial dimensions, requiring high-resolution but low-cost multispectral remote sensing data and an “ad hoc” acquisition on demand [3,18,19,20]. To address these specific challenges, the application of classic multispectral satellite data or conventional aerial imagery is often restricted due to a high cost per unit area of ground coverage or low-resolution image data [21]. By addressing the limitations of conventional remote sensing approaches in forestry, Unmanned Aerial Systems (UAS) may provide accurate means of monitoring pest infestation at stand and even species level. Several authors have already addressed the benefits of UAS-based remote sensing methods for the assessment of ecologically relevant geospatial data in general, as they represent a new type of low-cost and small remote sensing platform [22,23,24].
Mostly, the primary role of the UAS was to provide current imagery over the area of interest, and to obtain sufficiently high-spatial resolution for visual identification and mapping of vegetation [25]. The first fundamental steps in the direction of semi-automated classification of vegetation patterns based on high-resolution UAS digital imagery were made in the field of precision farming in order to evaluate the spatial dimensions of weed infestation [26]. Studies using high-resolution aerial images with sub-decimeter ground sample distances (GSD) have relied primarily on fixed-wing UAS constructions, zeppelins or balloons [27,28]. Due to recent advances in the miniaturization of electronics, navigation, and global positioning systems (GPS), multicopter UAS with their vertical take-off and landing (VTOL) capabilities provides a promising alternative, especially in areas with limited or inconvenient take-off or landing conditions. Hence they evolved as a potential option for a highly flexible sensor platform to collect very high-resolution (down to 1 cm GSD) image data [29,30].
Vegetation health can be best assessed by the reflectance in the Near Infrared (NIR) wavelength region [31]. Thus, Colour Infrared (CIR) images might be much more promising than true colour (RGB) for automated analysis separating spectral and textural surface patterns in high-resolution images [24]. Particularly, high-resolution imagery paired with object-based classification techniques are considered to be a promising tool for environmental monitoring [32]. A thorough documentation of infestation levels by flexible, non-invasive and low-cost UAS-based remote sensing techniques seem to be appropriate to gather crucial geospatial information regarding the spatial distribution of infested trees. However, the application of these techniques poses specific challenges to the analyst as the resulting classification accuracy can be influenced by site specific factors such as illumination conditions [9,33]. Especially shadows are reported to be possible error sources [34,35] but can often be handled by adopting appropriate measures during image acquisition and image processing. Therefore, the objective of this study was to adapt and apply recent mapping techniques to forestry needs which have proven to be successful in environmental monitoring of restored cutover bogs [36]. The question was whether UAS-acquired CIR-images can provide reliable remote sensing data and deduced pest infection level maps to support private forestry management efforts.

2. Methods

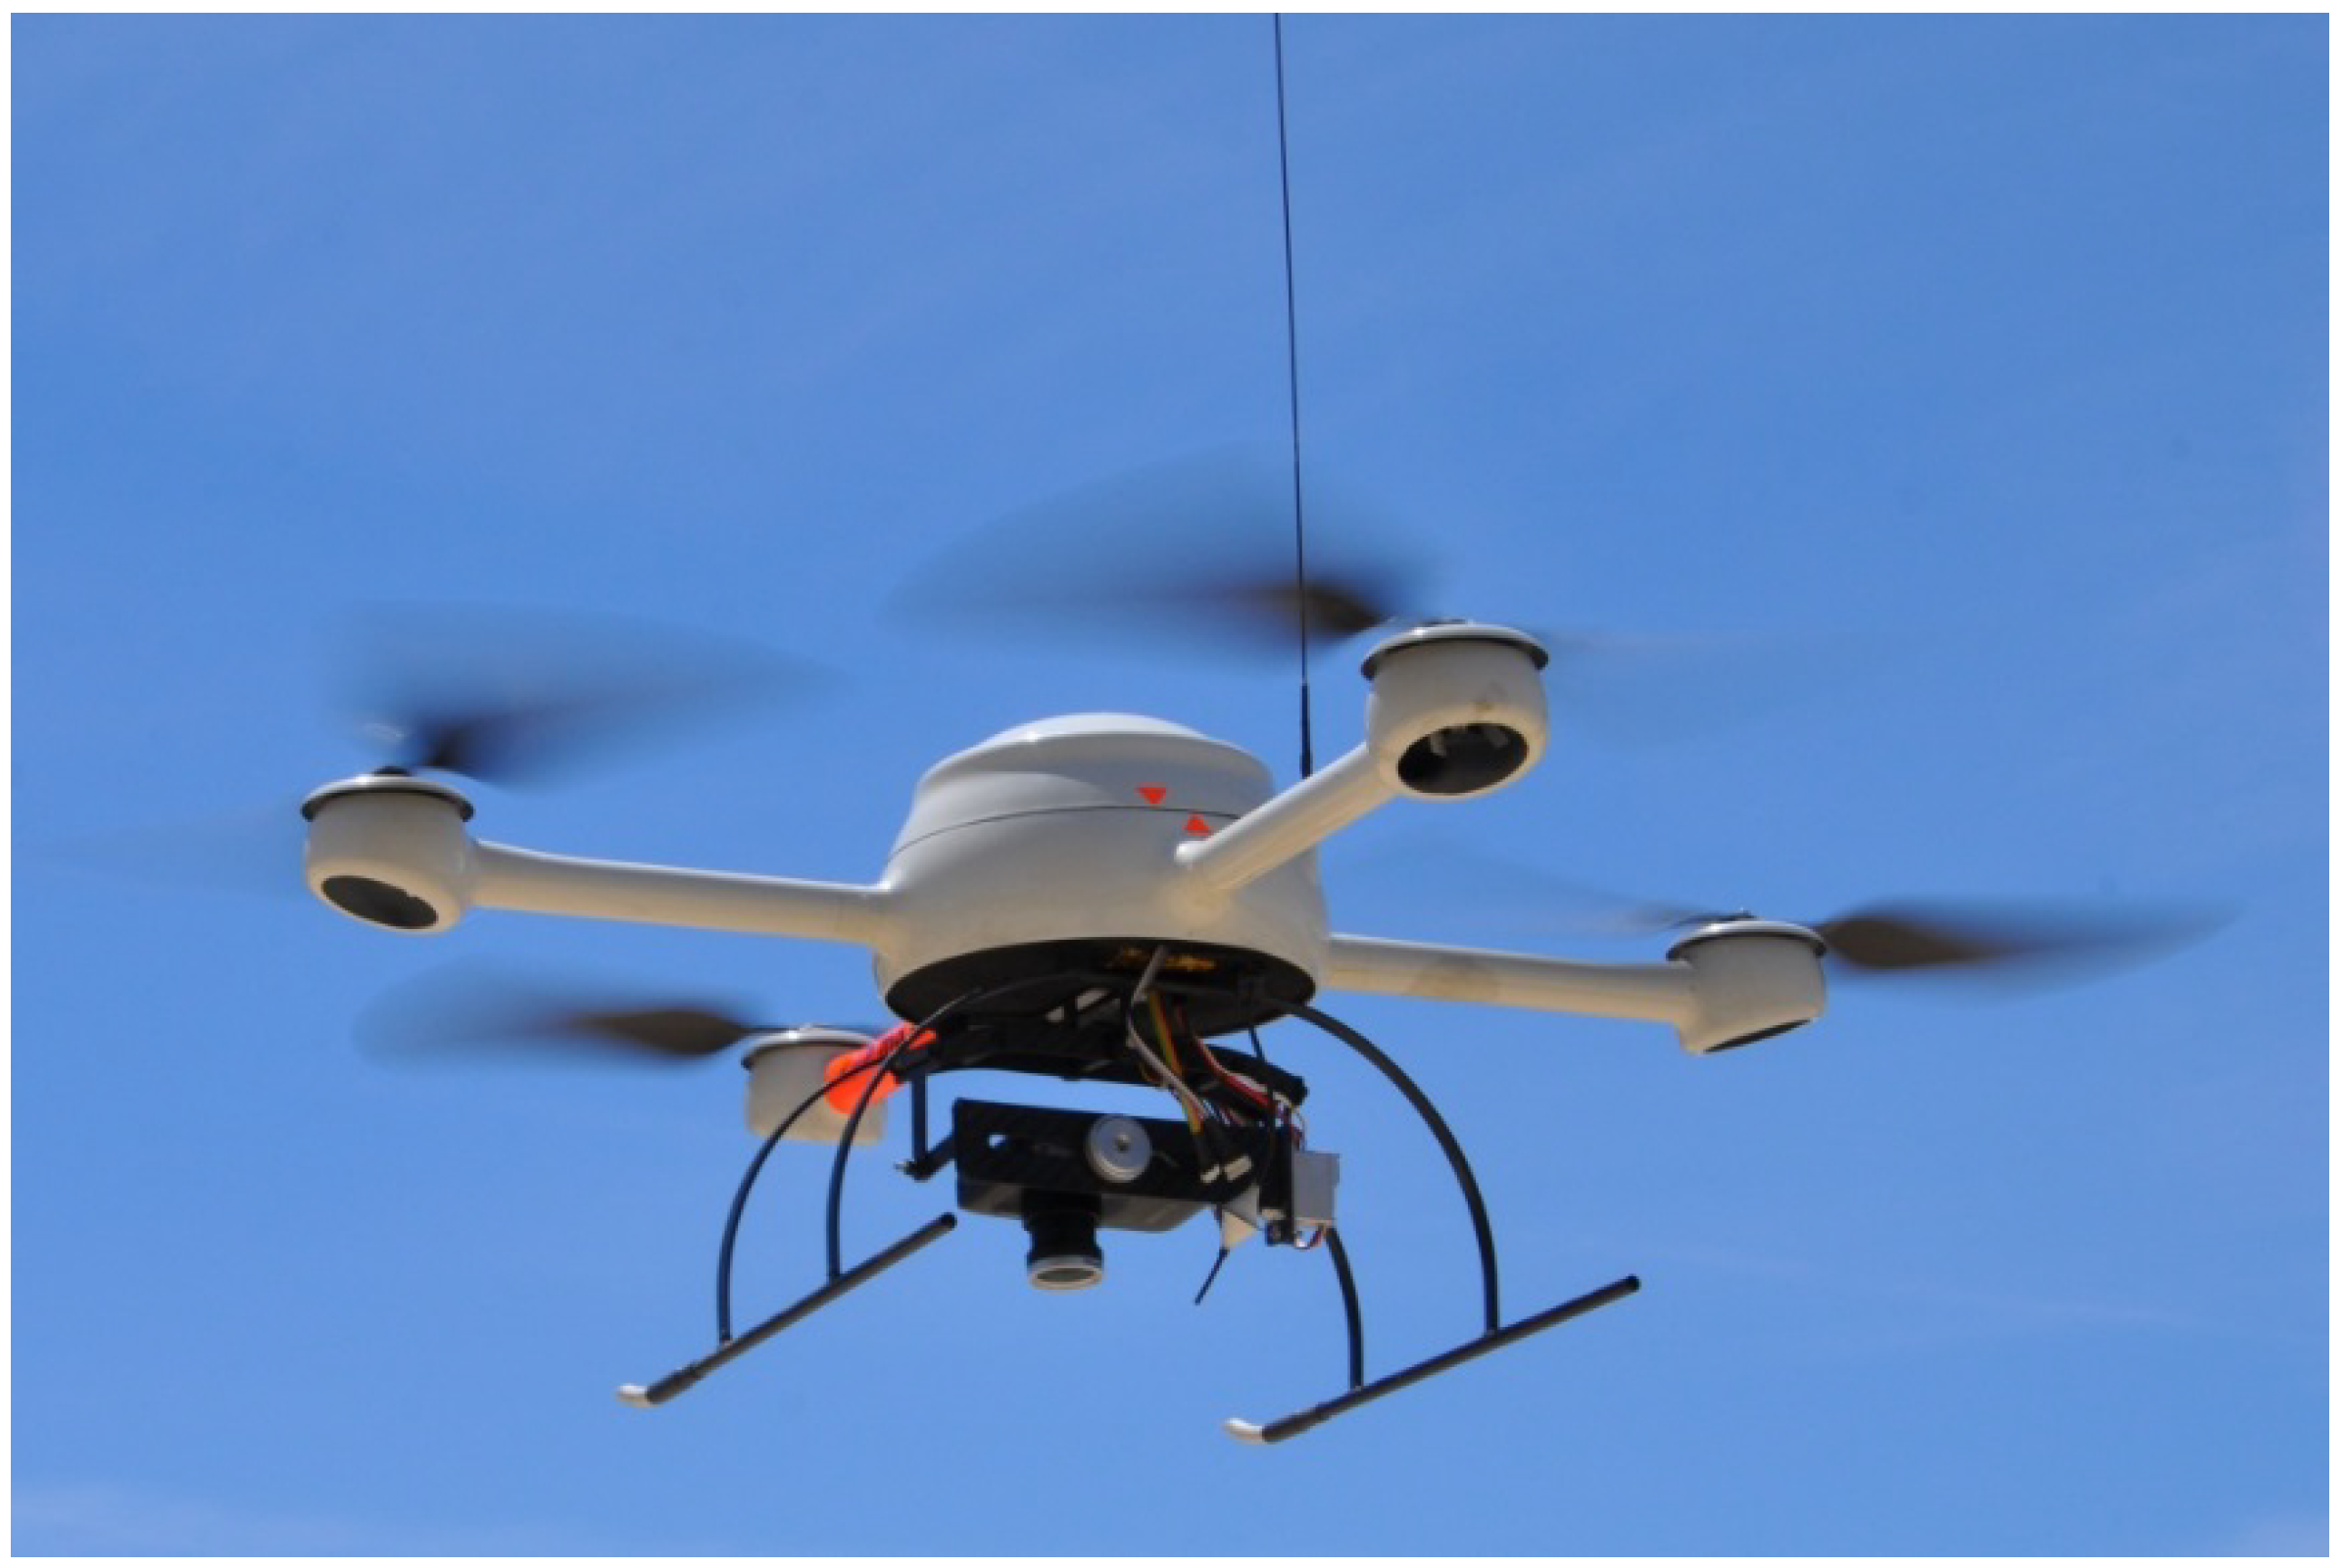
2.1. UAS Sensor Platform

In this study a radio controlled four-propeller powered multicopter (Figure 1) was used as an UAS remote sensing platform. The quadrocopter was a ready-made and commercially available Microdrones MD4-200 and is equipped with a GPS and Inertial Measurement Unit (IMU) for navigation and control. In contrast to most self-built construction kits, it has advantages regarding, usability and reliability as well as flight duration due to its professional airframe construction and high-quality batteries. The UAS had an estimated flight time of approximately 30 min with a sensor-payload of about 200 g at a typical flight altitude between 20 and 80 m above surface depending on the requested ground resolution. The quadrocopter is also able to fly autonomously a waypoint track heading to coordinates on a preset altitude. For an efficient flight planning, we set the required parameters (e.g., coordinates of desired positions for aerial images, flight altitude above surface, camera orientation) in advance using proprietary (Microdrones) software. Additionally, the UAS provided a radio up- and downlink in order to allow the current sensor view and navigation data to be transmitted to a ground control station, enabling direct adjustment of settings during the mission. Technical features of the used UAS are summarized in Table 1.
Figure 1. The commercial “ready-to-use” Microdrones MD 4-200. Payload includes IMU, GPS receiver, downward pointing CIR-modified digital Canon IXUS 100 camera, radio downlink and microprocessor controlled flight control units.
Forests 06 00594 g001
Table 1. Key-features of the used quadrocopter (UAS).
Technical FeatureMicrodrones MD4-200
Payload<200 g
Estimated flight time~30 min
Recommended flight altitude<80 m
GPS autonomy flight modeYes
Radio up-/downlinkYes
Ground controlField control center
Camera system (modified)IXUS 100 IS

2.2. Field Survey

Aerial images analysed in this study were taken in August 2013 at two forest stands (study sites A and B), both of them allocated a few kilometres NW and SE from the rural city of Soest, Northrhine Westfalia in NW-Germany (Figure 2). The forest stands consist mainly of oak (Quercus robur), minor European hornbeam (Carpinus betulus), several understorey shrubs (A) or in case of (B) merely oaks (Quercus robur) and some isolated beech trees (Fagus sylvatica) also understorey shrubs. Both study sites belong to privately managed forests and differ slightly in size (A = 0.85 ha; B = 2.05 ha). Weather conditions were sunny and calm with scattered cloud cover forming during the time of image acquisition. Before each UAS flight campaign was conducted five ground control points (GCPs; 20 × 20 cm white panels) had been laid out in the field and were logged with a high-precision Differential Global Positioning System (DGPS; Trimble Navigation Limited, Sunnyvale, Calif.) for georeferencing purposes in order to support the image processing later on. Additionally, distinctive terrain objects (e.g., path, deerstand) were recorded.
All A. biguttatus infested and dead oaks were mapped using the DGPS with around 3 m accuracy under the forest canopy. The identification of infested or dead oak trees were performed independently by the regional forestry department (Soest-Sauerland), which carried out a conventional terrestrial monitoring of A. biguttatus beetle attack in these oak stands over the last five years. A total of seven oak trees with symptoms of A. biguttatus beetle attack and four dead oak trees were identified and logged. Infested oak trees show typical symptoms such as transparent crowns with foliage on surviving branches. Uninfested oaks exhibited a fully developed canopy of green leafs with a high NIR albedo during time of remote sensing data acquisition.
Figure 2. Location map of the study sites in Northrhine Westfalia near the town Soest (Germany). The investigated study sites are outlined in white.
Forests 06 00594 g002

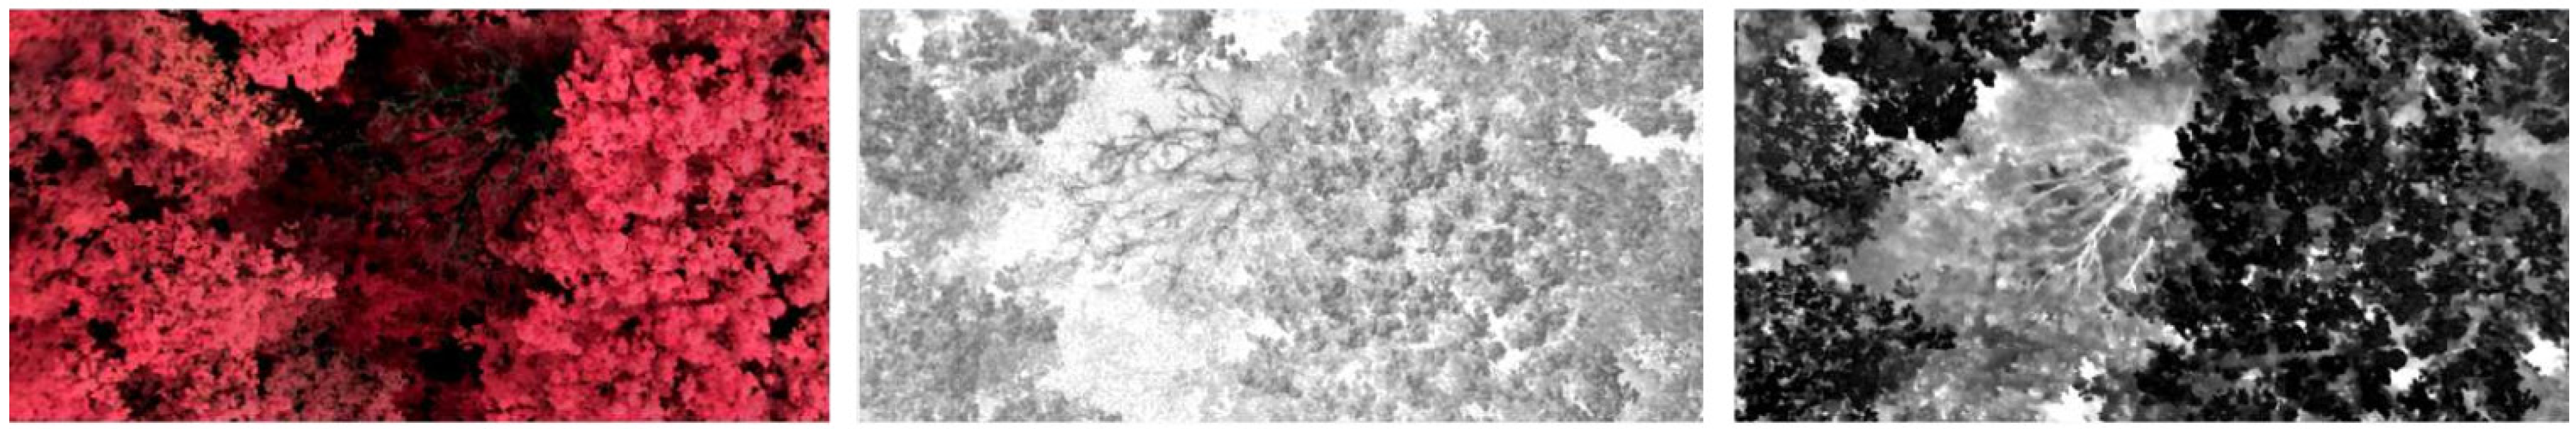
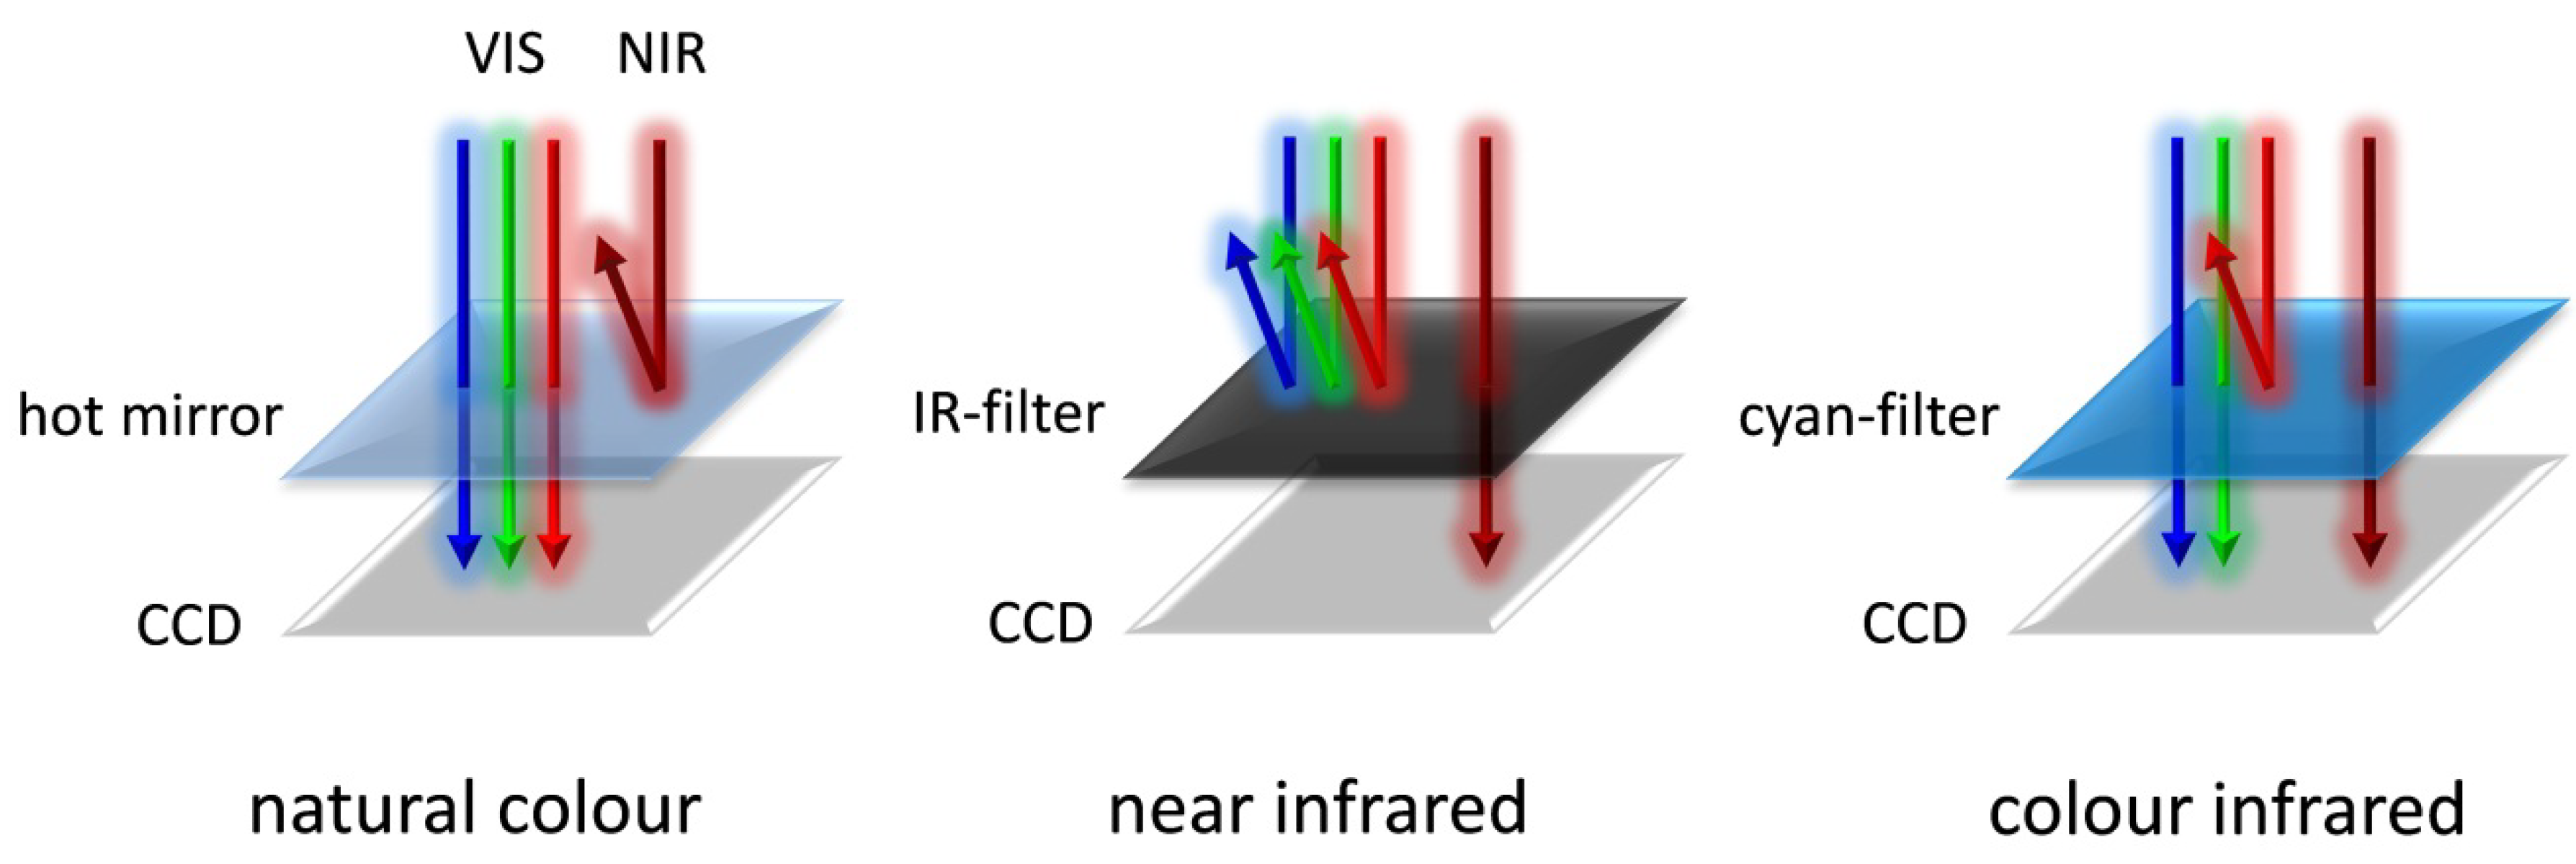
2.3. Sensor Technique and Data Processing

The UAS was equipped with a calibrated Canon IXUS 100 digital camera, in which the “hot mirror” filter in front of the imaging sensor had been removed. In most commercially available cameras, NIR radiation is blocked by such filters to ensure natural colour images without undesired shifts towards the red. As shown by Jensen et al. [37] and Hunt et al. [38] this hot mirror can be removed (or even replaced by other filters) in order to enable the CCD (charge coupled device) sensor of the camera to record also NIR information instead of taking true colour images (Figure 3). A replacement of the hot mirror by a neutral glass filter has the great advantage that external filters or another equipment can be placed in front of the lenses to enable various modes of infrared photography. Consequently a significant increase of modularity can be achieved by this special optical set up and users can decide whether they want to generate natural colour (true colour) or near infrared (NIR) images, depending on the external lens filter sets applied.
Figure 3. The effect of different optical filters to the spectral recording of the cameras charge coupled device (CCD) mounted to the UAS in order to obtain true colour (VIS = visible), near infrared (NIR = infrared) or modified colour infrared (CIR) images. In this study visible red instead of visible blue was blocked by the cyan filter in order to extract the pure NIR albedo and to avoid unspecific tinges of red, since the CCD records the albedo in continuous manner and exhibits no distinct multispectral wavelength bands (see also Knoth et al. [24,36]).
Forests 06 00594 g003
The value of NIR imaging is significantly increased if colour infrared (CIR) images are calculated by acquiring VIS and NIR data simultaneously. However, even modified digital cameras do not have a specific channel for infrared light and thus cannot separate the NIR from VIS in the same shot [39]. Previous case studies testing modified digital cameras for CIR photography used a double-camera approach combining separately captured natural colour and NIR images to generate a four-band CIR image [37]. However, beside additional post-processing efforts, this approach is currently unsuitable for UAS-based remote sensing due to restrictions in payload and flight duration. Consequently, we selected a (cyan) colour filter to block the visible red light while at the same time the NIR radiation (up to about 830 nm) is mainly recorded in the “red”-band due to the internal mosaic colour filter attached to the image sensor of the camera (so called Bayer-filter, [24]).
In doing so, we produced false colour composites capturing visible and near infrared radiation simultaneously. However, in contrast to common CIR images the visible red information was no longer captured. The remaining three bands of Blue, Green and NIR were automatically registered by the camera without any need for additional post-processing. A comparable approach was presented by Hunt et al. [40] in the field of crop monitoring.
After the spectral modifications, the camera was mounted on the UAS using a gimbal-mounted holder to compensate tilt and roll movements enabling the vertical alignment of the optical axis during exposure. A prior photogrammetric calibration of the camera system was done to provide information on its parameters of interior orientation, especially the image distortion, which is considerably larger compared to professional aerial survey cameras. These parameters could be used during the ortho-rectification of the images to increase the spatial accuracy. Multispectral images taken during one mission were usually stored to the internal memory card of the camera.
The image data was adjusted by reducing blurry and under- or over-exposed images. Mosaicking was achieved using Agisoft PhotoScan Professional (v. 0.9.0; Agisoft LLC, St. Petersburg, Russia), a software specially designed to stitch air- or spaceborne images. The software automatically selects a high amount of tie points in every individual image and compares them to all other images, thus selecting and arranging pairs. The software also removes changes in camera angle and altitude that are artefacts collected during the flights. Radiometric distortions, normally caused by atmospheric influences was insignificant because of the very low flight altitudes [36]. The final unified images obtained from the aerial surveys were georeferenced in ArcGIS (v. 10.2; ESRI, Redlands, CA, USA) using the collected ground control points and distinctive terrain objects. Afterwards, the image data were pre-processed using ERDAS Imagine including the Leica Photogrammetry Suite (LPS, version 2011). The multiresolution segmentation and object-based image analysis (OBIA) was performed using eCognition developer (v. 8.64.1; Trimble GeoSpatial, Munich, Germany).

2.4. Image Analysis and Classification

Because the visible red reflectance was not captured, commonly applied indices like the NDVI could not be direct processed. Alternatively, a modified NDVImod ((NIR − visible blue) / (NIR + visible blue)) and principal components (PCs) were calculated to generate additional spectral properties such as the distinct NIR-albedo variation (Figure 4), by re-combining and elaborating standard multispectral image enhancement techniques [41]. An additional advantage of these new datasets is the reduction of illumination effects (e.g., shadows or diffuse refection) due to the inhibition of data redundancy in the original input bands. In the NDVImod dead or strong infested oaks can be distinguished from healthy trees by their extreme low albedo ratio (less/absent biomass = dark pixels) while in the 2nd principal components the same trees are indicated by bright pixels, since this PC indicates the strong uncorrelated albedo-differences between the NIR and visible blue. The images exhibit a high-spatial resolution of about 2 cm which enables the definition of plant-related features through distinct pixel values (colour) at branch level. However, this kind of object-based high-resolution image analysis can be affected by shadows [34,35]. Nevertheless, these calculated datasets represent a promising base for the following multiresolution segmentation and subsequent object-based classification (OBIA).
Figure 4. Subsets of the UAS derived CIR mosaics from the oak forest stands site (left) and the corresponding NDVImod (center) and 2nd PC (right). Infested oaks are indicated by low or high grey values due to low biomass (NDVImod) and strong uncorrelated NIR/visible variations (2nd PC).
Forests 06 00594 g004
We applied a multiresolution segmentation which generated objects by merging several pixels together, based on relative homogeneity criteria [42]. This criterion is defined by setting thresholds for the scale, shape/colour and compactness [32]. In this study the segmentations were performed with a scale parameter of 150 resulting in 3482 individual objects for the study site A and 6763 individual objects for the study site B, respectively. As the vegetation health can be best assessed by the reflectance in the NIR-wavelength region, the colour feature appeared as a more promising distinctive feature than shape related characteristics. Thus, after iterative testing of the parameter levels, a ratio of 0.1/0.9 for shape/colour was selected (0.1 = lowest influence/0.9 = highest influence on the classification model). The level of compactness has a comparatively small influence on the output objects if the shape level is low. Hence, we used the pre-set value of 0.5 for the compactness threshold. No negligible changes were observed when this threshold was adjusted [43].
The subsequent object-based classification (nearest neighbour algorithm) was realized by selecting thresholds of class specific image features. The thresholds of these features (Table 2) were automatic registered by selecting manually class specific samples via an on-screen interpretation and additional field inspection data (DGPS points of infected or dead oaks). Overall, five classes were defined: infested, healthy or dead branches, other vegetation and canopy gaps.
Table 2. Object features used during object-based image classification with eCognition.
Customized
NDVImod: ([Mean nir] − [Mean blue])/([Mean nir] + [Mean blue])
Layer Values
HSI Transformation Intensity (R = nir, G = green, B = blue)
HSI Transformation Hue (R = nir, G = green, B = blue)
HSI Transformation Saturation (R = nir, G = green, B = blue)
Mean NIR
Mean Green
Mean Blue
Mean Brightness
Standard Deviation NIR
Standard Deviation Green
Standard Deviation Blue
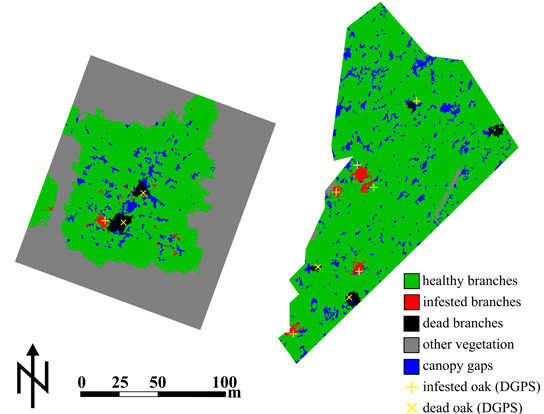
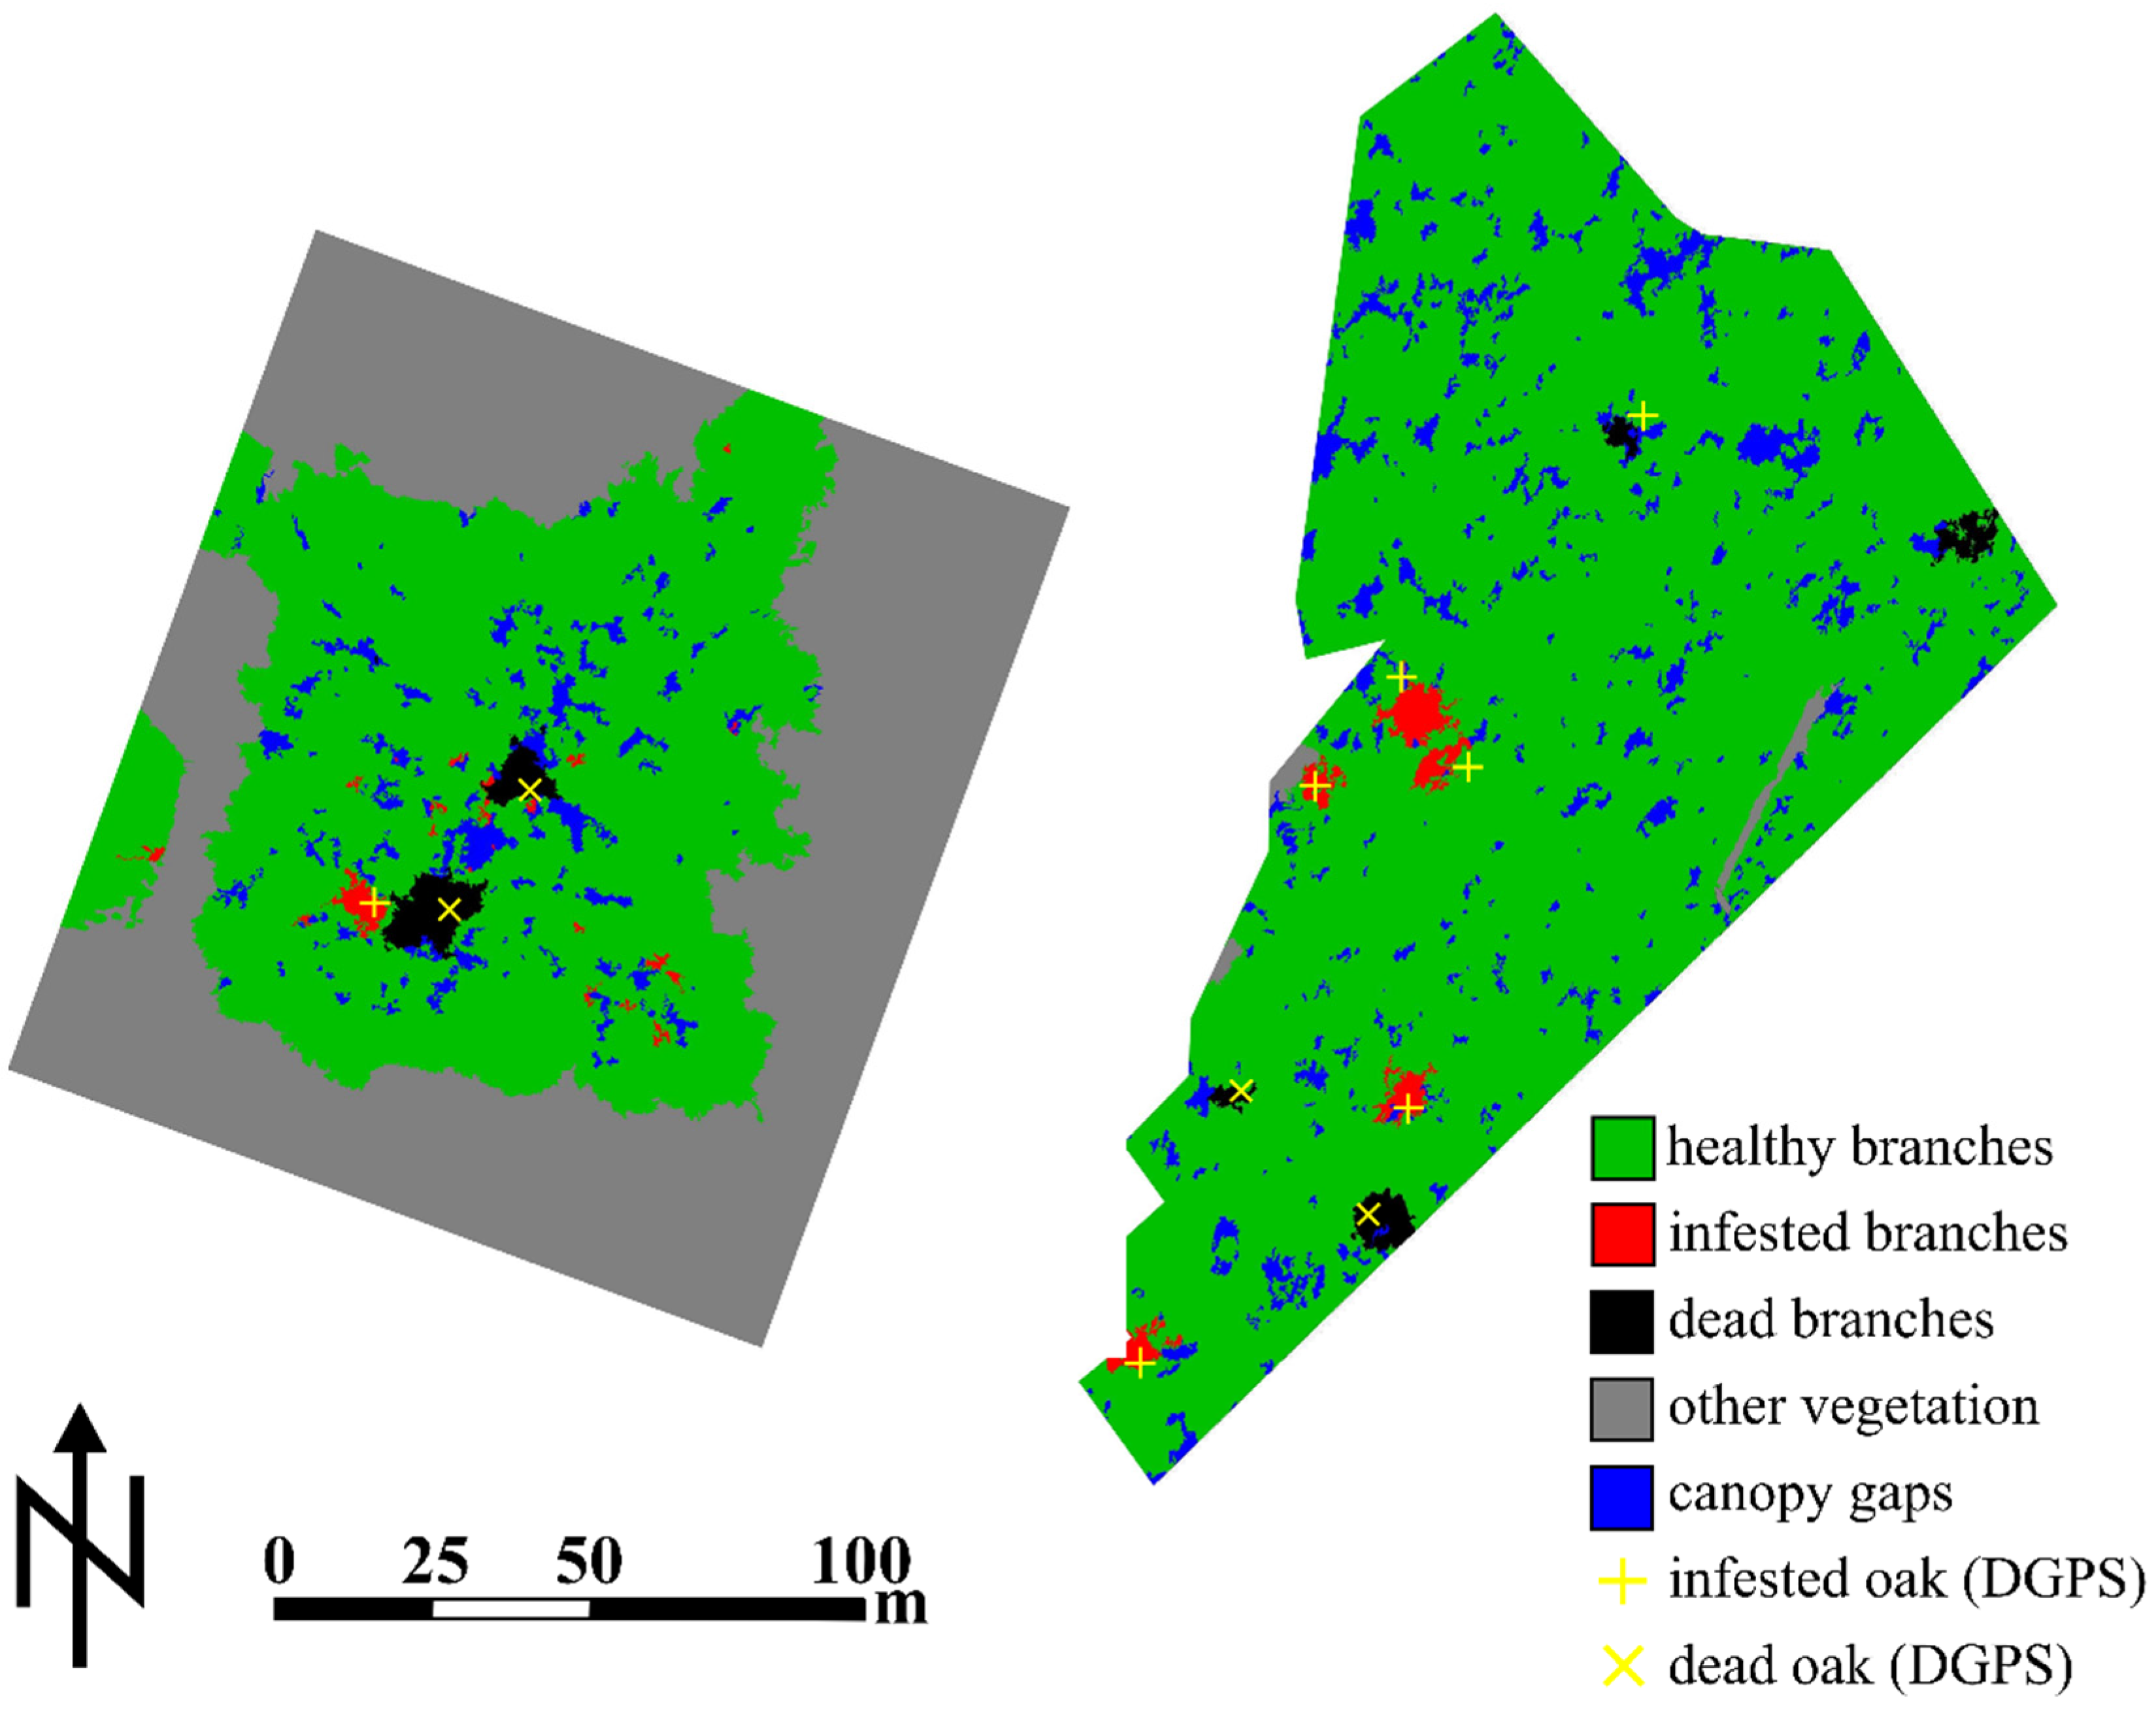
Finally, a confusion matrix was calculated to evaluate the accuracy of the final classifications including: (1) the producer’s accuracy, which is defined as proportion of correctly classified objects to the reference samples of a class; (2) the user’s accuracy, which is defined as the proportion of correctly classified objects within the total number of samples classified; (3) the overall accuracy, which is defined as the proportion of all correctly classified objects and the total sample size; (4) the Kappa Index of Agreement (KIA), which is defined as the agreement of the classification results with the corresponding reference data [44]. The interpretation of the Kappa statistics were based on the categories proposed by Landis and Koch [45]. Hence, a classification accuracy of Kappa < 0.20 is poor, 0.21 < kappa < 0.40 fair, 0.41 < kappa < 0.60 moderate, 0.61 < kappa < 0.80 good, and 0.81 < kappa < 1 very good.

3. Results

A final unified high-resolution CIR-image of the study site A is displayed in Figure 5. The resulting classification maps of both study sites are presented in the Figure 6 and the associated accuracy values in Table 3. The semi-automatic object-based classification distinguished between the five classes at an overall accuracy level of 85% for the study site A and 82.5% for the study site B, respectively. The overall KIA statistic reached 0.81 (A) and 0.78 (B). Thus, according to the categories suggested by Landis & Koch (1977) [46] the overall accuracies of the classifications are categorised as “very good” for the study site A and “good” for the study site B, respectively.
The results of the KIA per class statistic for the study site A showed that canopy gaps is the most distinguishable class with a coefficient of 0.97, followed by other vegetation (0.87), healthy branches (0.79), infested branches (0.67) and dead branches (0.66). In comparison, for the study site B the best class-specific KIA statistics were reached for other vegetation (0.96), healthy branches (0.84) and infested branches (0.81). The classes dead branches and canopy gaps achieved 0.73 and 0.65, respectively. The class-specific producer’s accuracies for the study site A were 97.8% for canopy gaps, 89.8% for other vegetation, 85.5% for healthy branches, 71.4% for dead branches and 68.8% for infested branches. For the study site B the producer’s accuracies reached 96.6% for other vegetation, 89.1% for healthy branches, 83.3% for infested branches, 78.6% for dead branches and 71.2% for canopy gaps. Further, the class-specific user’s accuracies achieved for other vegetation 97.8% and 93.3% (for study site A and B, respectively), dead branches 96.8% and 89.8%, infested branches 91.7% and 90.9%, canopy gaps 77.2% and 90.2% and healthy branches 75.8% and 65.3%.
Figure 5. Resulting high-resolution colour-infrared mosaic of the study site A constructed from 44 overlapping photos.
Forests 06 00594 g005
Figure 6. Classification maps of study site A (left) and B (right) obtained by multi-resolution segmentation and subsequent object-based classification. Infested and dead oaks (yellow cross and X) were identified by the regional forestry department (Soest-Sauerland) and recorded with a Differential Global Positioning System (DGPS).
Forests 06 00594 g006
Table 3. Confusion matrix and accuracy results of the object-based image analysis (OBIA). Producer’s accuracy: ratio between correctly classified objects and reference samples within a class. User’s accuracy: ratio between correctly classified objects and the total number of samples assigned to a class. Overall accuracy: ratio between the number of all correctly classified objects and the total number of samples. Kappa Index of Agreement (KIA): measure of the proportion of agreement after removing random effects.
Study Site AHealthyInfestedDeadOther VegetationCanopy GapsSum
healthy47545162
infested11100012
dead100300031
other vegetation10044045
canopy gaps50804457
unclassified000000
Sum6416424945
Producer’s accuracy85.568.871.489.897.8
User’s accuracy75.891.796.897.877.2
Overall Accuracy85.0
KIA per class0.790.670.660.870.97
KIA0.81
Study Site BHealthyInfestedDeadOther VegetationCanopy GapsSum
healthy496811175
infested33000033
dead10440449
other vegetation10128030
canopy gaps10303741
unclassified000000
Sum5536562952
Producer’s accuracy89.183.378.696.671.2
User’s accuracy65.390.989.893.390.2
Overall Accuracy82.5
KIA per class0.840.810.730.960.65
KIA0.78

4. Discussion

This methodological study explored the capabilities of UAS-acquired high-resolution CIR-images for the detection of pest infestation levels in small oak forest stands caused by A. biguttatus applying object-based remote sensing techniques. As the beetle infestation can be detected physically from a transparent crown with few foliage on surviving branches, accompanied by a decrease in infrared reflectance of leaves caused by stress conditions [2,3] these characteristics can be identified using CIR-imagery [46,47,48].
Due to the very high-spatial resolution of the UAS-acquired images (~2 cm), infestation levels were identified based on specific object features at branch level. This is important, as individual oak trees can have healthy, infested and dead branches at the same time depending on the infestation progress [49,50]. Hence, in comparison to satellite imagery studies realized on local, regional or landscape scale [10,51,52,53] a more precise assessment of infestation was possible. However, for comparable large scale studies (e.g., regional scale) the application of current used and publicly available small UAS platforms is still limited due short operation times and flight range. Future generations of micro UAS will tackle this issue by offering a continually increasing flight time [54].
The use of UAS-acquired image data resulted in a “very good” (study site A) and “good” (study site B) overall KIA statistic, respectively. However, the classes infested and dead branches performed comparable poor (KIA per class 0.67 and 0.66) for the study site A. The main problem encountered here was that smaller objects below 6 cm were often not clearly distinguishable due to similar object feature properties in the applied descriptors compared to the surroundings. This resulted in misclassifications between the individual classes, especially between healthy and infested branches. In addition, light effects (over- or under exposed areas) had a negative impact on the classification accuracies. As the flight over the study site A was conducted in the early forenoon, light conditions were not optimal. These illumination issues (e.g., canopy shadows) could not be completely reduced using the modified NDVI and 2nd principal component images. Therefore, some misclassifications of infested and dead branches were probably related to this issue. One way to minimize this problem is to perform the UAS flights at local solar noon (sunny weather conditions) or during a closed cloud cover. Variable light conditions during the image acquisition, however, should be avoided. Further, due to the extraordinary thin shape and albedo characteristics the class dead branches were often misclassified as canopy gaps and healthy branches. This problem could probably have been prevented by focusing on texture-based discriminators (e.g., grey level co-occurrence matrix (GLCM) homogeneity texture) [55]. However, due to the high heterogeneity of the branch texture within and between single tree crowns, this method seemed only partially suitable to discriminate individual classes. A more promising approach to distinguish between the classes canopy gap and dead branches could be the use of additional data such as elevation point clouds [56]. It has to be tested if Ground Sample Distance (GSD) is sufficient for classification at branches level and if high-resolution digital elevation model (DEM) data could be generated adapted to the needs of infestation management applications.
The producer’s accuracies of the class healthy branches showed quite good results (85.5% for site A and 89.1% for site B, respectively), but the user’s accuracies of this class failed with only 75.8% (A) and 65.3% (B). This indicates that this class was over-classified. The same over-classification issue occurred for the class canopy gaps (study site A) and slightly for other vegetation (study site B). On the other hand, the classes infested and dead branches are characterized by higher user’s than producer’s accuracies for both study sites. Thus, the probability that objects classified as belonging to infested or dead branches indeed belong to that class is more likely. Overall, the producer’s and user’s accuracy values indicate a relatively good discrimination of infested branches versus all other classes except healthy branches. It is highly likely that an increase of the spectral resolution would be beneficial for the discrimination between this two classes. For example, Lucieer et al. [57] successfully applied a small hyperspectral sensor on a multirotor UAS. Such high-spectral resolution sensors enable a precise quantification of biochemical and biophysical properties of vegetation and therefore a more detailed identification of vegetation stress [58,59]. However, suitable hyperspectral sensors are costly and comparable heavy in weight which leads to significantly decreased flight times of multirotor UAS platforms [57].
The achieved results for a non-professional, low-priced digital CIR-camera were promising. Particularly for the study site B the classification of infested branches achieved suitable results (KIA per class 0.81). Therefore, using UAS acquired CIR imagery could be a helpful tool for forest management and private forest owners. As presented in this paper, the identification of infested or dead oak branches is generally possible and allows a first assessment of the dimension of infestation in the forest stand. Remote sensing techniques using NIR spectral bands enable the detection and evaluation of tree stress [60,61,62]. Nevertheless, it is not a diagnostic tool providing information on the cause of stress. In the case of oak, multifactorial processes are related to oak decline [2,3]. Besides abiotic factors such as climatic extremes [63], soil chemical parameters [64] or air pollution [65], several biotic factors are implicated in oak declines all over the world. For example, infection by pathogenic fungi or microorganisms can also facilitate oak tree dieback [66]. In this study, the infestation of A. biguttatus was recognized as the main reason for defoliation and altered canopy reflection signature of the examined oaks. However, numerous of other bark or wood boring insects can be involved in the damage of oak forest stands [2]. Thus, a differential identification of the cause of stress just based on UAV-acquired image data is limited since as one or more factors as mentioned above may result in similar object features. Although this limitation exists, the used methodology can support visual ground surveys in potentially infested forest stands. Due to the obscurity of A. biguttatus these field surveys can be very costly and time-consuming [49]. Caused by the tunneling behavior of the larvae, they are well protected and difficult to detect at an early infestation stage by ground monitoring. Therefore, oaks which are identified as possible infested in the UAV-acquired image data could be specifically investigated by a subsequent ground survey. In addition, the proposed methodology can facilitate the management purposes of other forest pests on oak (e.g., oak processionary moth) or even for other insect herbivores such as bark beetles on coniferous trees [67]. However, canopy branches of infested trees needs to show symptoms like defoliation and altered canopy reflection signatures.
In perspective, new high spatial resolution UAS images and their software elaboration might be suitable to improve remote sensing analysis of forests. Still, CIR imagery is not the only tool needed for this type of investigation. There are many variables which need to be considered, and this method has its limitations. Throughout the investigation of CIR images, some limitations of the camera modifications and the custom-made colour filters became obvious, mainly regarding the image sharpness, the exclusion of the visible red light, and the distinction of NIR radiation in one channel of the CIR images. Technical information from typical CCD sensors showed that the infrared radiation of longer wavelengths (> 850 nm) was dispersed among the channels of Red, Green and Blue. Because the overall recording of NIR in the red channel is clearly overbalancing, vegetation can be well identified and distinguished (Figure 4). However, improved distinction of the NIR radiation in CIR images can be attained by means of a professional, purpose-built and commercially available colour infrared sensor. These sensors were specifically designed for application in agricultural and forestry research. Nevertheless, such specialized equipment is costly, with cameras worth over 2500 €, whereas images recorded with a modified digital camera (~300 €) provide a good value alternative as image characteristics are considered to be satisfactory for a wide spectrum of (ecological) applications.
Another factor is the limited accessibility of a study area (through overgrown vegetation or as a result of legislation) which results in possible absence of ground-based GCPs. Subsequently, a direct georeferencing method without the need of GCPs would be required. In this case a digital elevation model (DEM) and very precise focal positioning of the sensor is crucial to calculate the exterior orientation of the obtained images. This information can be acquired by the joint use of the GPS receiver and the IMU onboard the sensor platform [68]. Currently the majority of micro UASs are equipped with GPS receivers, which enable a positional accuracy of about 2 to 15 m, which is too inaccurate for the direct processing of the exterior image orientation [69]. Research on improving the positioning of micro UAS systems by use of enhanced differential GPS (DGPS) is in progress [70]. This may allow for direct georeferencing of images in the future. As another option, a tachymetric observation and tracking of the UAS during the flight mission could give the necessary positioning data. Once these obstacles are overcome, small scale forest stand monitoring (of privately owned areas), would benefit highly from UAS-based remote sensing techniques.
In future, resulting infestation maps could be disseminated via an image web mapping service (WMS) according to open geospatial consortium (OGC) standards for interoperability reasons to support local GIS users in forestry. Consequently potential users can easily combine these maps with their own existing, conventional forestry geodata in their GIS to provide a multi-temporal perspective on the study areas. This study focuses on UAS raster data and since this remote sensing data is commonly geocoded it can be exported in a GeoTiff format to enable a GIS-compatible publishing applying functionalities of ArcGIS server (ESRI 2014) and GEO server (OGC 2014).

5. Conclusions

This study demonstrate the potential of Unmanned Aerial System (UAS)-based near infrared remote sensing techniques for forest stand observation and pest infestation monitoring. The capability to adjust the captured imagery by applying different filter combinations enables a highly flexible adaption of the camera setup to specific use cases and study areas. Consequently the relative easy, rapid and cost effective acquisition of near infrared (NIR) image data, its analysis and reliable classification with respect to indicator trees offers a promising tool that will facilitate the forest management in the future.
In case of our privately owned test forest sites one can also state that the presented methodology has a strong positive economic impact on the traditionally applied ground based pest detection workflow for small and medium sized stands, since we would estimate the total saving of time and financial cost by more than 50% (in case of nearly inaccessible forested areas considerably higher, even one takes the moderate pre-investment for the UAS equipment into account). The overall reliability of the UAS-based colour infrared (CIR) image pest classifications (OA > 80%, KIA from 0.78 to 0.81), the flexibility in acquisition and the immediate GIS-compatibility of the calculated pest data will certainly encourage private forest managers to adopt such pest detection and monitoring strategies in general since this approach can be applied in modified ways to related forest pests on oak or other forest tree species if infested canopy branches show symptoms like defoliation and altered leaf reflection signatures.
In addition our strategy to apply specific object related spectral features to the classification of UAS-based CIR data in terms of pest infestation levels (here triggered by Agrilus biguttatus) can easily be modified to meet the various requirements of further tests regarding the general suitability of the presented techniques for other pest related use cases in sustainable forestry. One promising approach might be the spectral combination of more sophisticated optical filters to extract stress indicator in canopy reflectance, like “red-edge” anomalies of the reflected NIR.

Acknowledgments

We thank the ifgicopter group (http://ifgicopter.uni-muenster.de) for providing the UAS, technical and also personal support. Christoph Hentschel from the Regional Forest Board NRW (Soest) provided assistance and helpful comments during the field work—We are grateful for this helpful cooperation. We also acknowledge support by Deutsche Forschungsgemeinschaft (DFG) and Open Access Publication Fund of University of Muenster.

Author Contributions

The paper was mainly written by Jan Rudolf Karl Lehmann. He was responsible for the research design, data collection, interpretation of results and preparation and editing of the manuscript. Felix Nieberding assisted with the analysis and interpretation of the image data, especially for the study site B. Christian Knoth was involved in interpretations and discussions of the manuscript. Torsten Prinz supervised and supported the research project as the head of the ifgi-Copter research group.

Conflicts of Interest

The authors declare no conflict of interest.

References

  1. Lindner, M.; Maroschek, M.; Netherer, S.; Kremer, A.; Barbati, A.; Garcia, J.; Seidl, R.; Delzon, S.; Corona, P.; Kolström, M.; et al. Climate change impacts, adaptive capacity, and vulnerability of European forest ecosystems. Forest Ecol. Manag. 2010, 259, 698–709. [Google Scholar] [CrossRef]
  2. Sallé, A.; Nageleisen, L.-M.; Lieutier, F. Bark and wood boring insects involved in oak declines in Europe: Current knowledge and future prospects in a context of climate change. Forest Ecol. Manag. 2014, 328, 79–93. [Google Scholar] [CrossRef]
  3. Thomas, F.M.; Blank, R.; Hartmann, G. Abiotic and biotic factors and their interactions as causes of oak decline in Central Europe. Forest Pathol. 2002, 32, 4–5. [Google Scholar] [CrossRef]
  4. Vansteenkiste, D.; Tirry, L.; Van Acker, J.; Stevens, M. Predispositions and symptoms of Agrilus borer attack in declining oak trees. Ann. Forest Sci. 2004, 61, 815–823. [Google Scholar] [CrossRef]
  5. Lavoie, C.; Saint-Louis, A.; Lachance, D. Vegetation dynamics on an abandoned vacuum-mined peatland: 5 years of monitoring. Wetlands Ecol. Manag. 2005, 13, 621–633. [Google Scholar] [CrossRef]
  6. Pellerin, S.; Mercure, M.; Desaulniers, A.S.; Lavoie, C. Changes in plant communities over three decades on two disturbed bogs in southeastern Québec. Appl. Veg. Sci. 2008, 12, 107–118. [Google Scholar] [CrossRef]
  7. Skakun, R.S.; Wulder, M.A.; Franklin, S.E. Sensitivity of the thematic mapper enhanced wetness difference index to detect mountain pine beetle red-attack damage. Remote Sens. Environ. 2003, 86, 433–443. [Google Scholar] [CrossRef]
  8. Coops, N.C.; Johnson, M.; Wulder, M.A.; White, J.C. Assessment of QuickBird high spatial resolution imagery to detect red attack damage due to mountain pine beetle infestation. Remote Sens. Environ. 2006, 103, 67–80. [Google Scholar] [CrossRef]
  9. Heurich, M.; Ochs, T.; Andresen, T.; Schneider, T. Object-orientated image analysis for the semi-automatic detection of dead trees following a spruce bark beetle (Ips. typographus) outbreak. Eur. J. Forest Res. 2010, 129, 313–324. [Google Scholar] [CrossRef]
  10. Ortiz, S.M.; Breidenbach, J.; Kändler, G. Early detection of bark beetle green attack using Terrasar-X and RapidEye data. Remote Sens. 2013, 5, 1912–1931. [Google Scholar] [CrossRef]
  11. Medlin, C.; Shaw, D.; Gerard, P.; LaMastus, F. Using remote sensing to detect weed infestations in glycine max. Weed Sci. 2000, 48, 393–398. [Google Scholar] [CrossRef]
  12. Yu, Q.; Gong, P.; Clinton, N.; Biging, G.; Kelly, M.; Schirokauer, D. Object-based detailed vegetation classification with airbourne high spatial resolution remote sensing imagery. Photogramm. Eng. Remote Sens. 2006, 72, 799–811. [Google Scholar] [CrossRef]
  13. Lawes, R.; Wallace, J. Monitoring an invasive perennial at the landscape scale with remote sensing. Ecol. Manag. Restor. 2008, 9, 53–58. [Google Scholar] [CrossRef]
  14. Franklin, S.E.; Wulder, M.A.; Skakun, R.S.; Carroll, A.L. Mountain pine beetle red-attack forest damage classification using stratified Landsat TM data in British Columbia, Canada. Photogramm. Eng. Remote Sens. 2003, 69, 283–288, Germany. [Google Scholar] [CrossRef]
  15. Hais, M.; Jonášová, M.; Langhammer, J.; Kučera, T. Comparison of two types of forest disturbance using multitemporal Landsat TM/ETM+ imagery and field vegetation data. Remote Sens. Environ. 2009, 113, 835–845. [Google Scholar] [CrossRef]
  16. Milton, E.J.; Hughes, P.D.; Anderson, K.; Schulz, J.; Lindsay, R.; Kelday, S.B.; Hill, C.T. Remote Sensing of Bog Surfaces; Joint Nature Conservation Committee: Peterborough, UK, 2005. [Google Scholar]
  17. Ecker, K.; Küchler, M.; Feldmeyer-Christe, E.; Graf, U.; Waser, L.T. Predictive mapping of floristic site conditions across mire habitats: Evaluating data requirements. Community Ecol. 2008, 9, 133–146. [Google Scholar] [CrossRef]
  18. Shuman, C.S.; Ambrose, R.F. A comparison of remote sensing and ground-based methods for monitoring wetland restoration success. Restor. Ecol. 2003, 11, 325–333. [Google Scholar] [CrossRef]
  19. Brown, E.; Aitkenhead, M.; Wright, R; Aalders, I.H. Mapping and classification of peatland on the Isle of Lewis using Landsat ETM. Scott. Geogr. J. 2007, 123, 173–192. [Google Scholar] [CrossRef]
  20. Eitel, J.U.H.; Vierling, L.A.; Litvak, M.E.; Long, D.S.; Schulthess, U.; Ager, A.A.; Krofcheck, D.J.; Stoscheck, L. Broadband, red-edge information from satellites improves early stress detection in a New Mexico conifer woodland. Remote Sens. Environ. 2011, 115, 3640–3646. [Google Scholar] [CrossRef]
  21. Chambers, J.Q.; Asner, G.P.; Morton, D.C.; Morton, D.C.; Anderson, L.O.; Saatchi, S.S.; Espírito-Santo, F.D.B.; Souza, M.P.C., Jr. Regional ecosystem structure and function: Ecological insights from remote sensing of tropical forests. Trends Ecol. Evol. 2007, 22, 414–423. [Google Scholar] [CrossRef] [PubMed]
  22. Rango, A.; Laliberte, A.; Steele, C.; Herrick, K.; Bestelmeyer, B.; Schmugge, T.; Roanhorse, A.; Jenkins, V. Using unmanned aerial vehicles for rangelands: Current applications and future potentials. J. Environ. Practice 2006, 8, 159–168. [Google Scholar]
  23. Grenzdörffer, G.; Engel, A. A Comparative Study of Two Micro-UAV’s—Perspectives for the Current and Economic Geo-Information Extraction. Available online: http://www.wichmann-verlag.de/gis-fachzeitschriften/artikelarchiv/2008/gis-ausgabe-01-2008/eine-vergleichende-untersuchung-von-zwei-micro-uavs-perspektiven-fuer-die-aktuelle-und-kostenguenstige-geoinformationsgewinnung.html (accessed on 3 February 2015).
  24. Knoth, C.; Prinz, T.; Loef, P. Microcopter-based Color Infrared (CIR) close range remote sensing as a subsidiary tool for precision farming. In Proceedings of the Workshop on Remote Sensing Methods for Change Detection and Process Modelling, Cologne, DE, USA, 18–19 November 2010.
  25. Ishihama, F.; Watabe, Y.; Oguma, H. Validation of a high-resolution, remotely operated aerial remote-sensing system for the identification of herbaceous plant species. Appl. Veg. Sci. 2012, 15, 383–389. [Google Scholar] [CrossRef]
  26. Ye, X.; Sakai, K.; Asada, S.-I.; Sasao, A. Use of airborne multispectral imagery to discriminate and map weed infestations in a citrus orchard. Weed Biol. Manag. 2007, 7, 23–30. [Google Scholar] [CrossRef]
  27. Laliberte, A.S.; Rango, A. Texture and scale in object-based analysis of subdecimeter resolution Unmanned Aerial Vehicle (UAV) imagery. IEEE Trans. Geosci. Remote Sens. 2009, 47, 761–770. [Google Scholar] [CrossRef]
  28. Rango, A.; Laliberte, A.; Herrick, J.E.; Winters, C.; Havstad, K.; Steele, C.; Browning, D. Unmanned aerial vehicle-based remote sensing for rangeland assessment, monitoring, and management. J. Appl. Remote Sens. 2009, 3. [Google Scholar] [CrossRef]
  29. Eisenbeiss, H.; Sauerbier, M. Investigation of UAV systems and flight modes for photogrammetric applications. Photogramm. Recor. 2010, 26, 400–421. [Google Scholar] [CrossRef]
  30. Breckenridge, R.P.; Dakins, M.; Bunting, S.; Harbour, J.L.; White, S. Comparison of unmanned aerial vehicle platforms for assessing vegetation cover in sagebrush steppe ecosystems. Rangeland Ecol. Manag. 2011, 64, 521–532. [Google Scholar] [CrossRef]
  31. Roberts, D.A.; Smith, M.O.; Adams, J.B. Green vegetation, nonphotosynthetic vegetation, and soils in AVIRIS data. Remote Sens. Environ. 1993, 44, 255–269. [Google Scholar] [CrossRef]
  32. Blaschke, T. Object based image analysis for remote sensing. ISPRS J. Photogramm. Remote Sens. 2010, 6, 2–16. [Google Scholar] [CrossRef]
  33. Michel, P.; Mathieu, R.; Mark, A.F. Spatial analysis of oblique photo-point images for quantifying spatio-temporal changes in plant communities. Appl. Veg. Sci. 2010, 13, 173–182. [Google Scholar] [CrossRef]
  34. Laliberte, A.S.; Rango, A.; Herrick, J.E.; Fredrickson, E.L.; Burkett, L. An object-based image analysis approach for determining fractional cover of senescent and green vegetation with digital plot photography. J. Arid Environ. 2007, 69, 1–14. [Google Scholar] [CrossRef]
  35. Chen, Z.; Chen, W.; Leblanc, S.G.; Henry, G.H.R. Digital photograph analysis for measuring percent plant cover in the arctic. Arctic 2010, 63, 315–326. [Google Scholar] [CrossRef]
  36. Knoth, C.; Klein, B.; Prinz, T.; Kleinebecker, T. Unmanned aerial vehicles as innovative remote sensing platforms for high-resolution infrared imagery to support restoration monitoring in cut-over bogs. Appl. Veg. Sci. 2013, 16, 509–517. [Google Scholar] [CrossRef]
  37. Jensen, T.; Apan, A.; Young, F.; Zeller, L. Detecting the attributes of a wheat crop using digital imagery acquired from a low-altitude platform. Comput. Electron. Agr. 2007, 59, 66–77. [Google Scholar] [CrossRef] [Green Version]
  38. Hunt, E.R.; Hively, W.D.; Daughtry, C.S.T.; McCarty, G.W.; Fujikawa, S.J.; Ng, T.L.; Tranchitella, M.; Linden, D.S.; Yoel, D.W. Remote sensing of crop leaf area index using unmanned airborne vehicles. In Proceedings of the 17th William T. Pecora. Memorial Remote Sensing Symposium, Denver, CO, USA, 16–20 November 2008.
  39. Aber, J.S.; Marzolff, I.; Ries, J.B. Small-format aerial photography. Photogramm. Recor. 2011, 26. [Google Scholar] [CrossRef]
  40. Hunt, E.R.; Hively, W.D.; Fujikawa, S.J.; Linden, D.S.; Daughtry, C.S.T.; McCarty, G.W. Acquisition of NIR-green-blue digital photographs from unmanned aircraft for crop monitoring. Remote Sens. 2010, 2, 290–305. [Google Scholar] [CrossRef]
  41. Soloviov, O. Geospatial Assessment of Pest-Induced Forest Damage through the Use of UAV-based NIR Imaging and GI-Technology. Available online: http://run.unl.pt/bitstream/10362/11545/1/TGEO115.pdf (accessed on 3 February 2015).
  42. Benz, U.; Hofmann, P.; Willhauck, G.; Lingenfelder, I.; Heynen, M. Multi-resolution, object-oriented fuzzy analysis of remote sensing data for GIS-ready information. ISPRS J. Photogramm. Remote Sens. 2004, 58, 239–258. [Google Scholar] [CrossRef]
  43. Pasher, J.; J. King, D. Mapping dead wood distribution in a temperate hardwood forest using high resolution airborne imagery. Forest Ecol. Manag. 2009, 258, 1536–1548. [Google Scholar] [CrossRef]
  44. Foody, G. On the compensation for chance agreement in image classification accuracy assessment. Photogramm. Eng. Remote Sens. 1992, 58, 1459–1460. [Google Scholar]
  45. Landis, J.; Koch, G. The measurement of observer agreement for categorical data. Biometrics 1977, 33, 159–174. [Google Scholar] [CrossRef] [PubMed]
  46. Knipling, E.B. Physical and physiological basis for the reflectance of visible and near-infrared radiation from vegetation. Remote Sens. Environ. 1970, 1, 155–159. [Google Scholar] [CrossRef]
  47. Ambrosini, I.; Gherardi, L.; Viti, M.L.; Maresi, G.; Turchetti, T. Monitoring diseases of chestnut stands by small format aerial photography. Geocarto. Int. 1997, 12, 41–46. [Google Scholar] [CrossRef]
  48. Yang, Z.; Rao, M.N.; Kindler, S.D.; Elliott, N.C. Remote sensing to detect plant stress, with particular reference to stress caused by the greenbug: A review. Southwest. Entomol. 2004, 29, 227–236. [Google Scholar]
  49. Thomas, F.M. Recent Advances in Cause-Effect Research on Oak Decline in Europe. Available online: http://www.researchgate.net/publication/236200532_Recent_advances_in_cause-effect_research_on_oak_decline_in_Europe (accessed on 3 February 2015).
  50. Moraal, L.G.; Hilszczanski, J. The oak buprestid beetle, Agrilus. biguttatus (F.) (Col., Buprestidae), a recent factor in oak decline in Europe. J. Pest. Sci. 2009, 73, 134–138. [Google Scholar]
  51. Coppin, P.R.; Bauer, M.E. Digital change detection in forest ecosystems with remote sensing imagery. Remote Sens. Rev. 1996, 13, 207–234. [Google Scholar] [CrossRef]
  52. Everitt, J.H.; Escobar, D.E.; Appel, D.N.; Riggs, W.G.; Davis, M.R. Using airborne digital imagery for detecting oak wilt disease. Plant Dis. 1999, 83, 502–505. [Google Scholar] [CrossRef]
  53. Wang, C.; Lu, Z.; Haithcoat, T.L. Using Landsat images to detect oak decline in the Mark Twain National Forest, Ozark Highlands. Forest Ecol. Manag. 2007, 240, 70–78. [Google Scholar] [CrossRef]
  54. Liebold, J.E.; Peter, A.M.; McCay, M. A study of multi-copter power source selection: From lithium polymers to fuel cells. AUVSI Unmanned Syst. 2014, 1, 132–147. [Google Scholar]
  55. Moskal, L.M.; Franklin, S.E. Multi-layer forest stand discrimination with spatial co-occurrence texture analysis of high spatial detail airborne imagery. Geocarto. Int. 2002, 17, 55–68. [Google Scholar] [CrossRef]
  56. Tiede, D.; Lang, S.; Hoffmann, C. Domain-specific class modelling for one-level representation of single trees. In Object-based Image Analysis—Spatial Concepts for Knowledge-driven Remote Sensing Applications; Springer Berlin Heidelberg: New York, NY, USA, 2008; pp. 133–151. [Google Scholar]
  57. Lucieer, A.; Malenovsky, Z.; Veness, T.; Wallace, L. HyperUAS—Imaging spectroscopy from a multi-rotor unmanned aircraft system. J. Field Robot. 2014, 31, 571–590. [Google Scholar] [CrossRef]
  58. Kokaly, R.F.; Asner, G.P.; Ollinger, S.V.; Martin, M.E.; Wessman, C.A. Characterizing canopy biochemistry from imaging spectroscopy and its application to ecosystem studies. Remote Sens. Environ. 2009, 113, 78–91. [Google Scholar] [CrossRef]
  59. Hernández-Clemente, R.; Navarro-Cerrillo, R.M.; Suárez, L.; Morales, F.; Zarco-Tejada, P.J. Assessing structural effects on PRI for stress detection in conifer forests. Remote Sens. Environ. 2011, 115, 2360–2375. [Google Scholar] [CrossRef]
  60. Hunt, E.R., Jr.; Rock, B.N. Detection of changes in leaf water content using Near- and Middle-Infrared reflectances. Remote Sens. Environ. 1989, 30, 43–54. [Google Scholar] [CrossRef]
  61. Zarco-Tejada, P.J.; Berni, J.A.J.; Suárez, L.; Sepulcre-Cantó, G.; Morales, F.; Miller, J.R. Imaging chlorophyll fluorescence with an airborne narrow-band multispectral camera for vegetation stress detection. Remote Sens. Environ. 2009, 113, 1262–1275. [Google Scholar] [CrossRef]
  62. Zuzana, L.; Lukáš, B.; Lucie, K.; Veronika, K.; Markéta, P.; Jan, M.; Aleš, K.; Monika, K.; Jana, A. Detection of multiple stresses in Scots pine growing at post-mining sites using visible to near-infrared spectroscopy. Environ. Sci. Process. Impacts 2013, 15, 2004–2015. [Google Scholar] [CrossRef] [PubMed]
  63. Askeyev, O.V.; Tischin, D.; Sparks, T.H.; Askeyev, I.V. The effect of climate on the phenology, acorn crop and radial increment of pedunculate oak (Quercus. robur) in the middle Volga region, Tatarstan, Russia. Int. J. Biometeorol. 2005, 49, 262–266. [Google Scholar] [CrossRef] [PubMed]
  64. Gaertig, T.; Schack-Kirchner, H.; Hildebrand, E.E.; von Wilpert, K. The impact of soil aeration on oak decline in south-western Germany. Forest Ecol. Manag. 2002, 159, 15–25. [Google Scholar] [CrossRef]
  65. Vrbek, B.; Pilas, I.; Dubravac, T.; Novotny, V.; Dekanić, S. Effect of deposition substances on the quality of throughfall and soil solution of pedunculate oak and common hornbeam forest. Period. Biol. 2008, 110, 269–275. [Google Scholar]
  66. Ito, S.; Kubono, T.; Sahashi, N.; Yamada, T. Associated fungi with the mass mortality of oak trees. J. Japanese Forest. Soc. 1998, 80, 170–175. [Google Scholar]
  67. Latifi, H.; Schumann, B.; Kautz, M.; Dech, S. Spatial characterization of bark beetle infestations by a multidate synergy of SPOT and Landsat imagery. Environ. Monit. Assess. 2014, 186, 441–456. [Google Scholar] [CrossRef] [PubMed]
  68. Woodman, O.J. An Introduction to Inertial Navigation. Available online: http://www.cl.cam.ac.uk/techreports/UCAM-CL-TR-696.pdf (accessed on 3 February 2015).
  69. Rieke, M.; Foerster, T.; Bröring, A. Unmanned Aerial Vehicles as mobile multi-sensor platforms. In Proceedings of the 14th AGILE International Conference on Geographic Information Science, Utrecht, NL, USA, 18–21 April 2011.
  70. Geipel, J.; Knoth, C.; Elsässer, O.; Prinz, T. DGPS- and INS-based orthophotogrammetry on micro UAV platforms for precision farming services. In Proceedings of the Geoinformatik, Muenster, Germany, 15–17 June 2011.

