
Stand Dynamics, Humus Type and Water Balance Explain Aspen Long Term Productivity across Canada

Abstract
:1. Introduction
2. Methodology
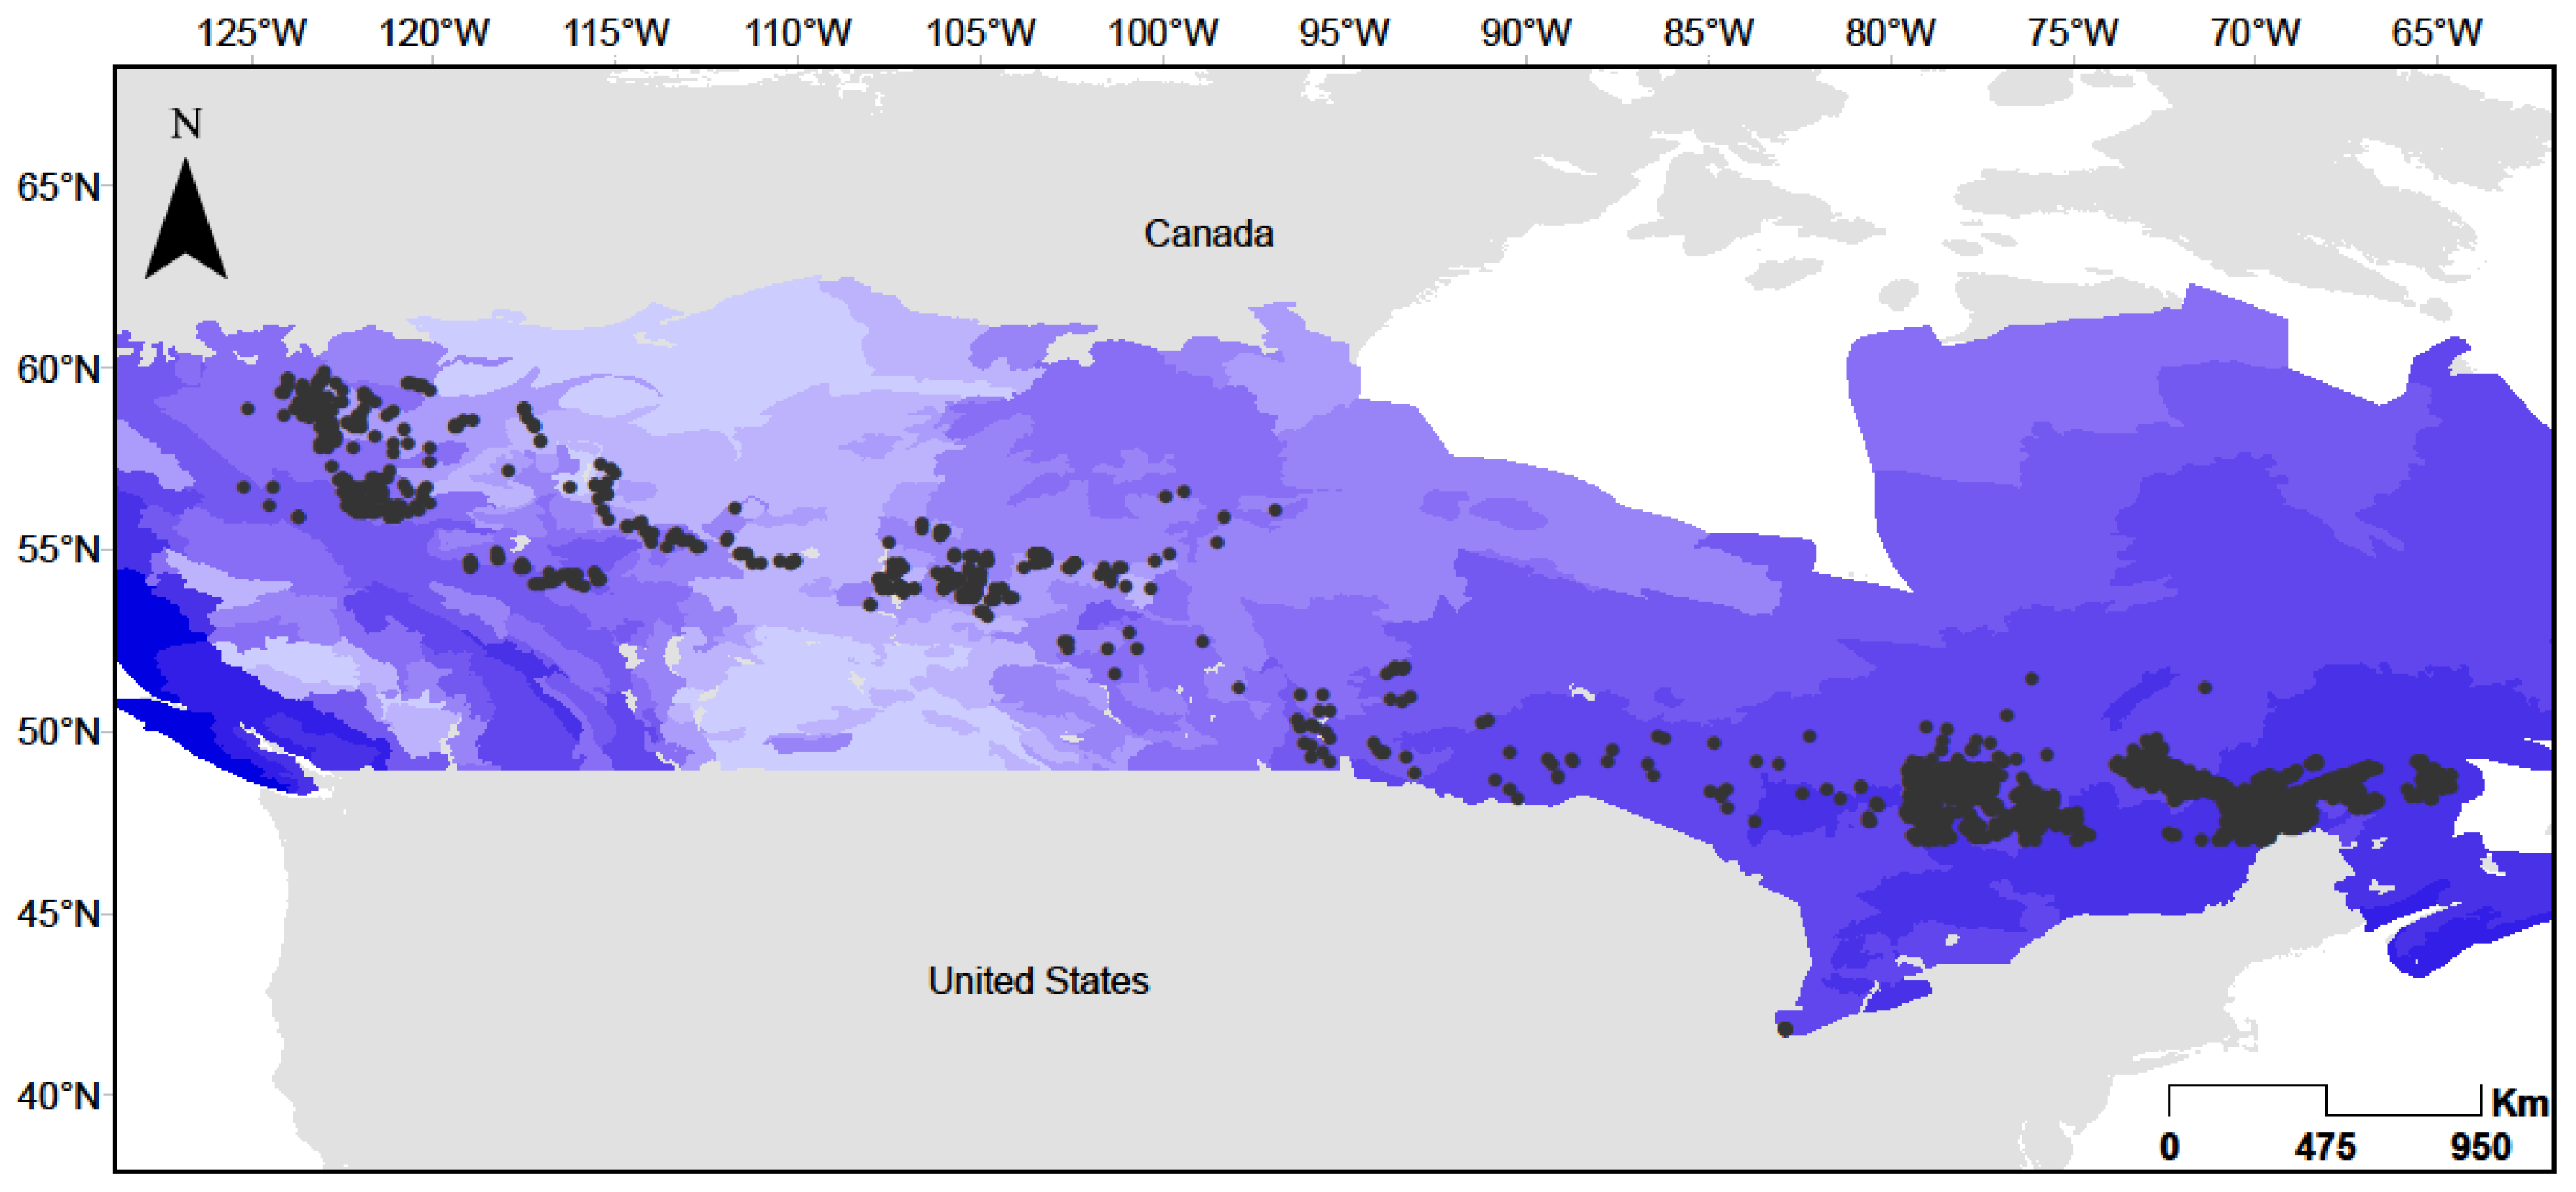
2.1. Study Area

2.2. Tree Measurement Data
2.3. Factors Potentially Linked to Productivity
2.3.1. Climate Data
2.3.2. Soil Data
2.3.3. Stand Attributes
2.4. Modeling Productivity
2.4.1. Model Selection
2.4.2. Estimating Site Index
2.4.3. Modeling Approach
3. Results
3.1. Variability in SI

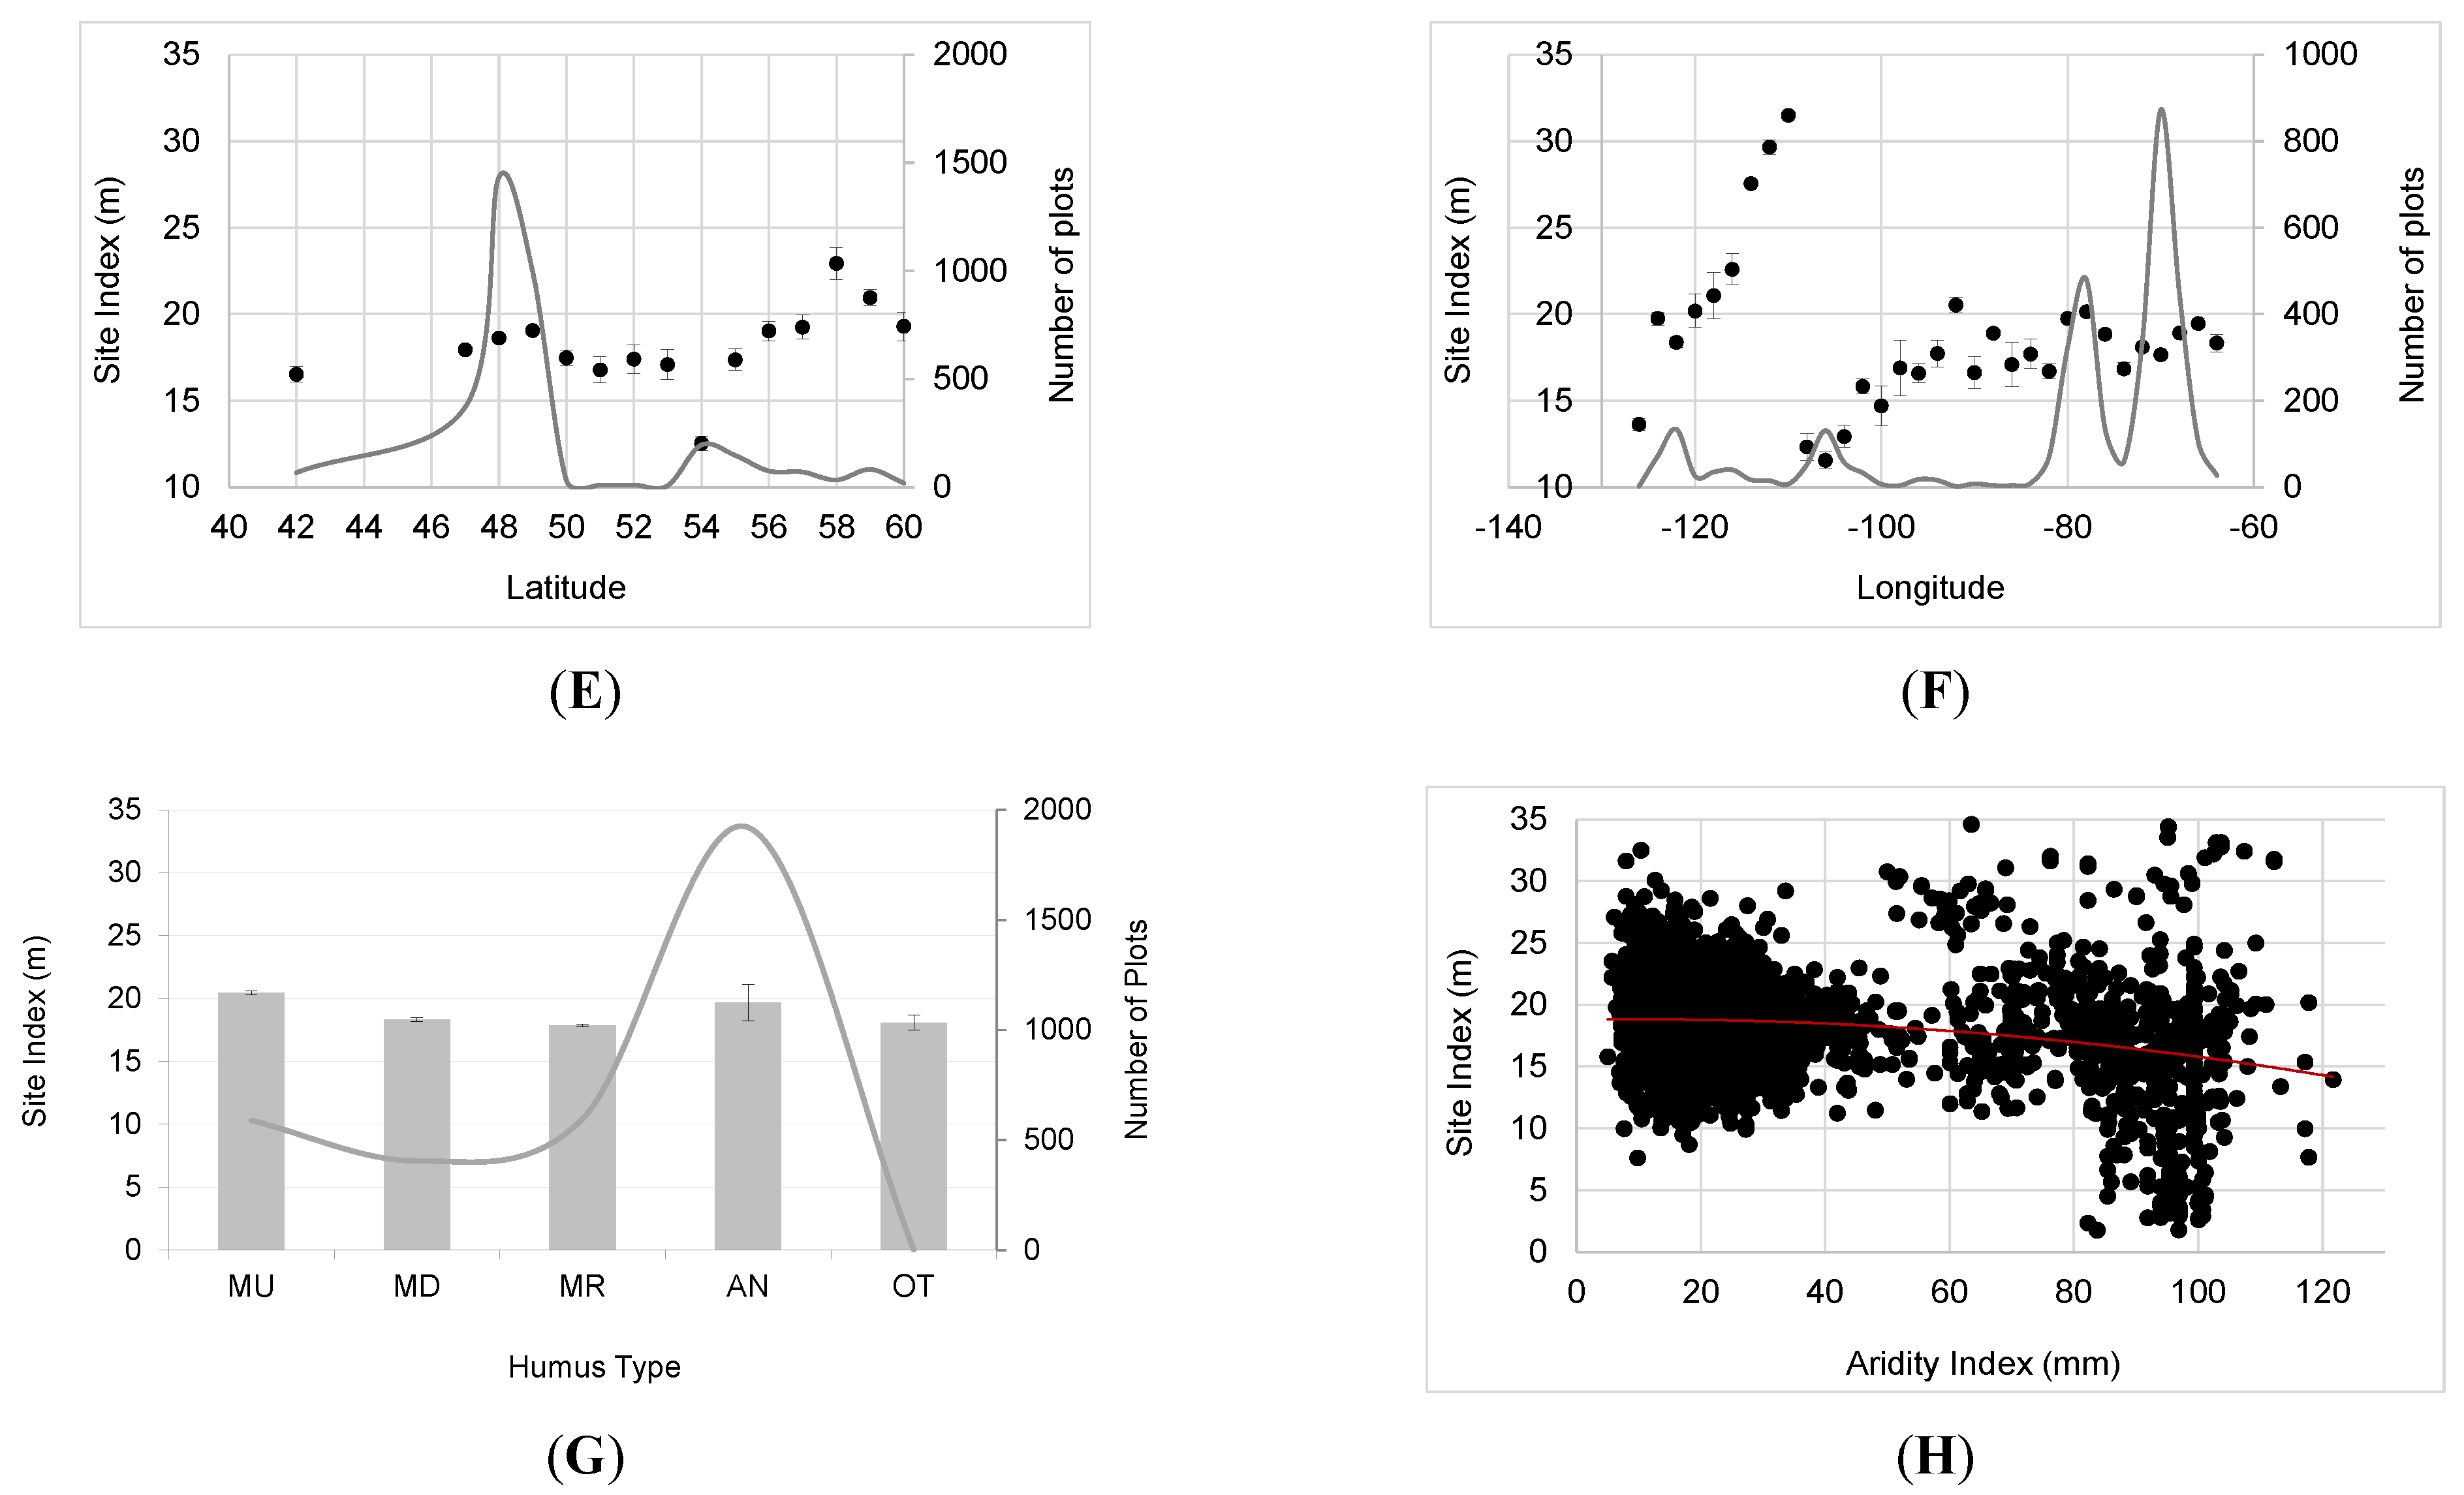
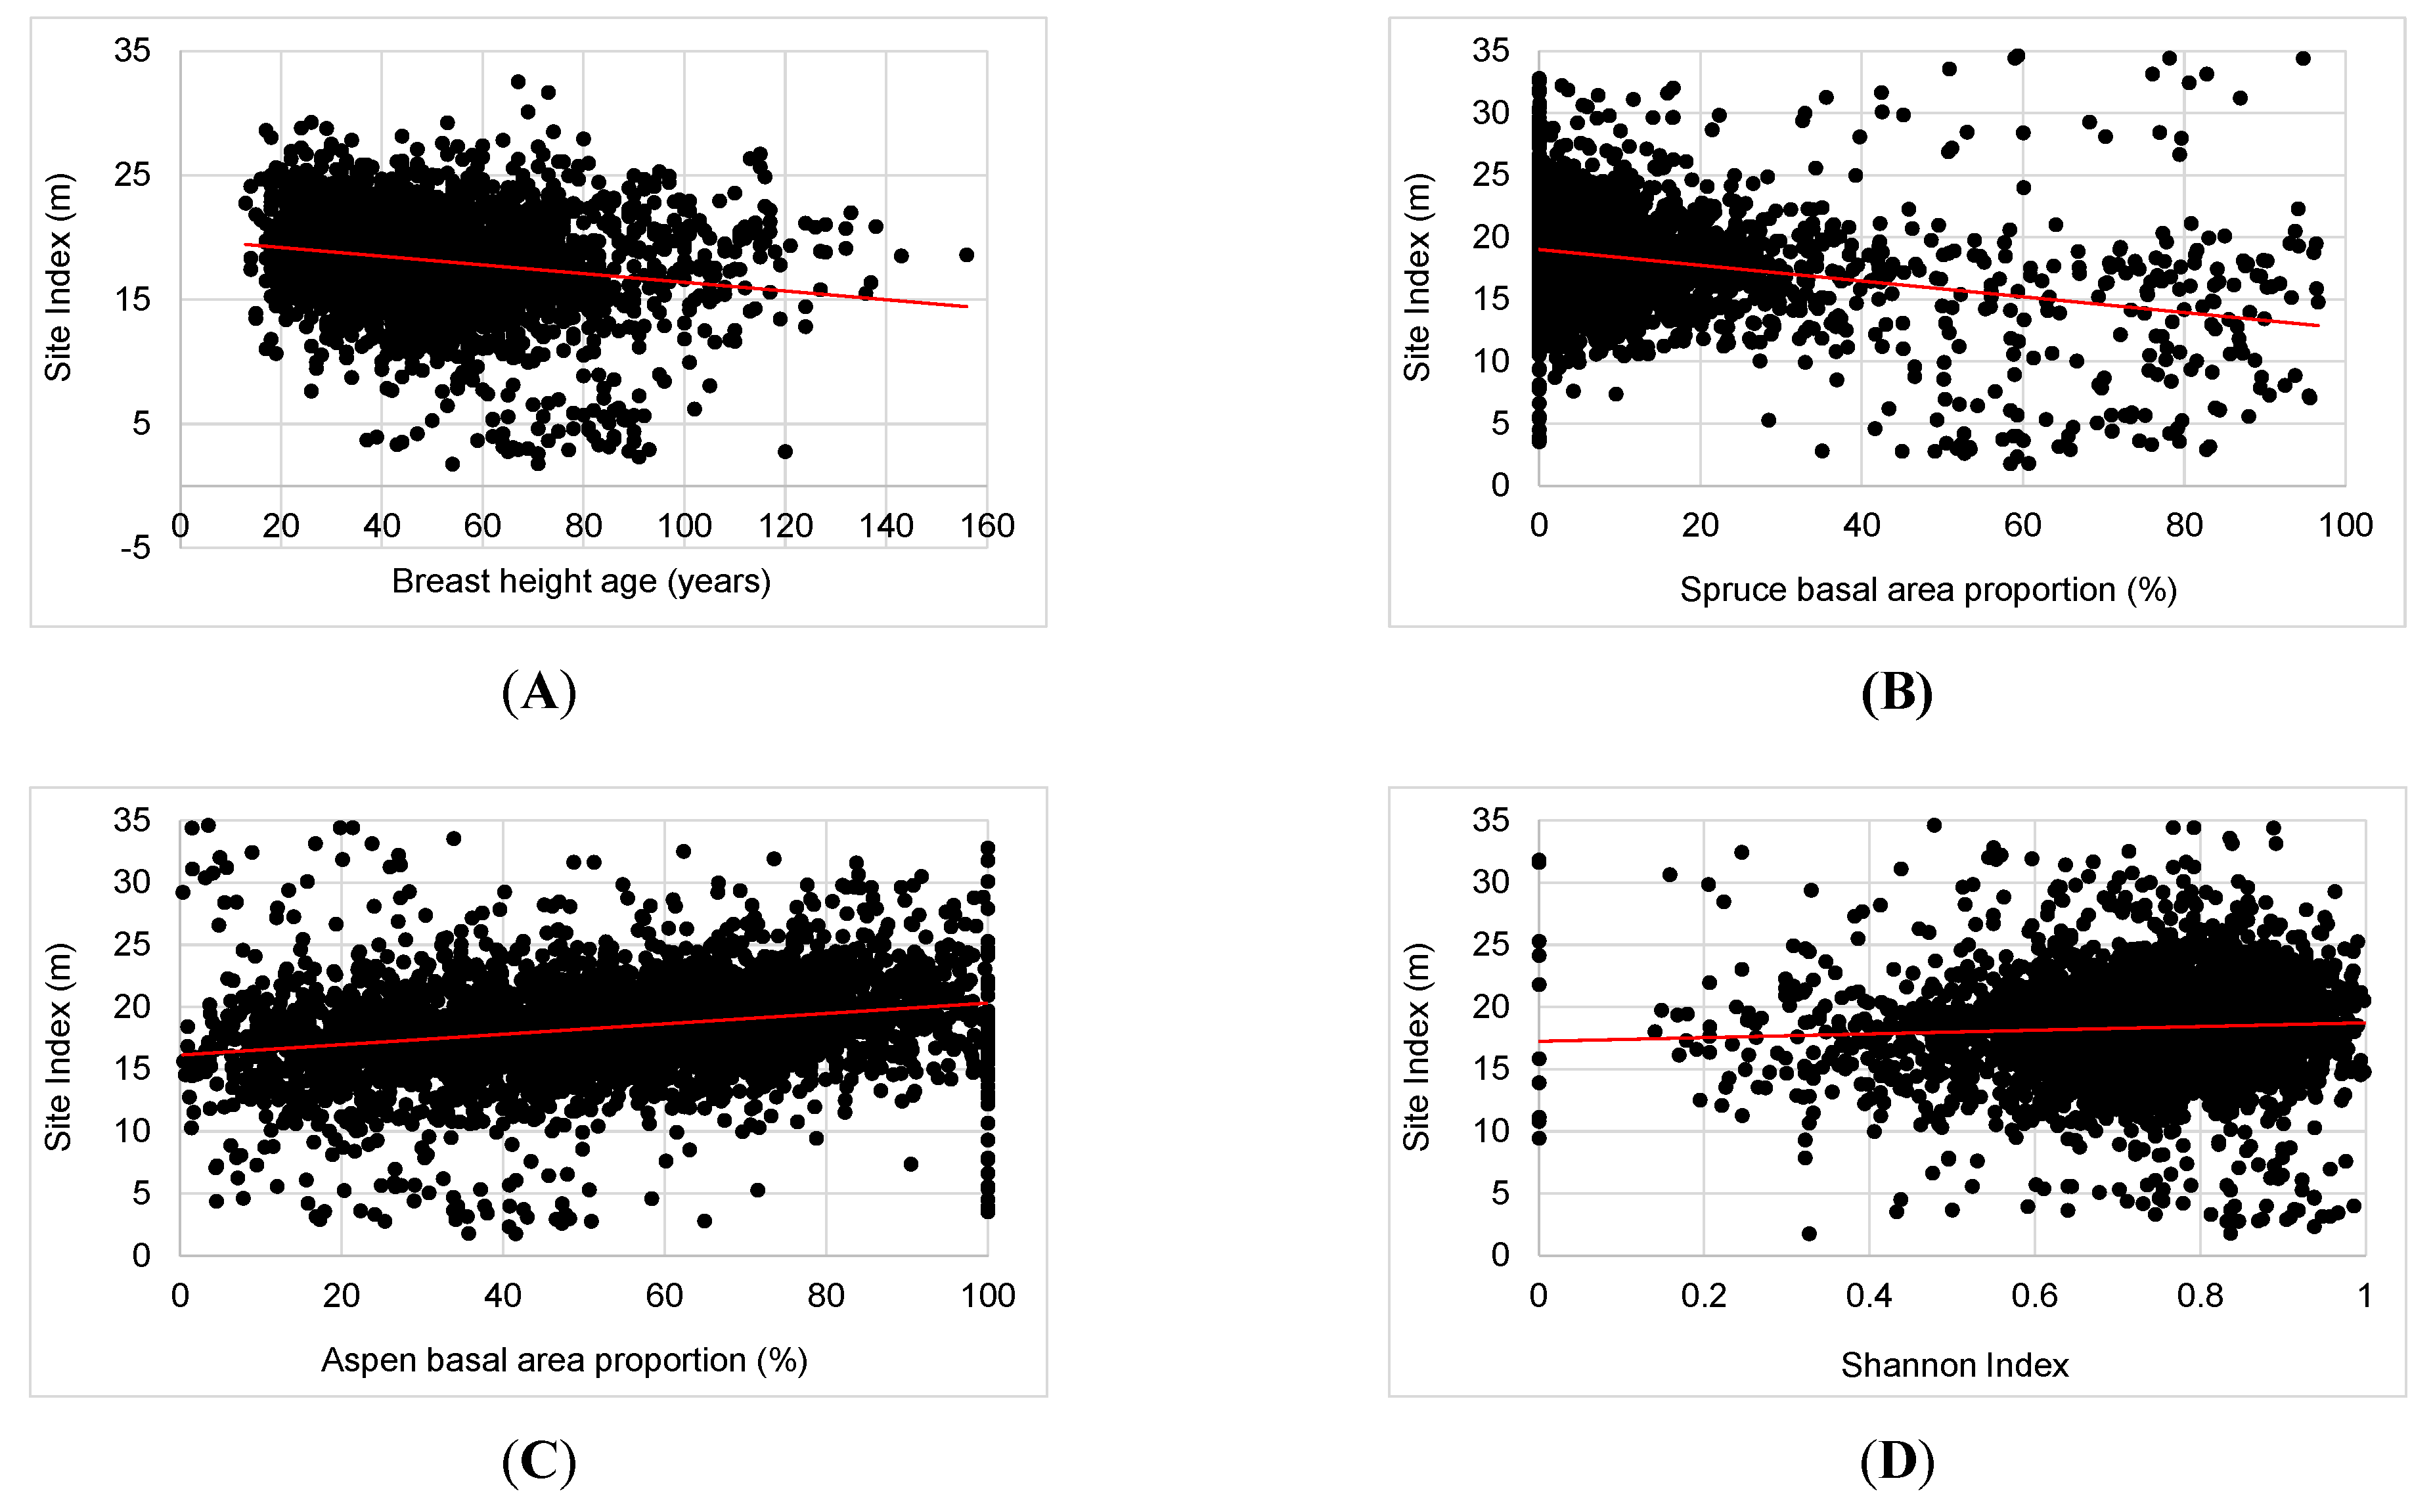
3.2. Major Drivers of SI

| Variable | Parameter | Estimate | Standard Error | P-value |
|---|---|---|---|---|
| Soil humus type | −2.289 | 0.484 | <0.0001 | |
| −2.263 | 0.473 | <0.0001 | ||
| −1.736 | 0.491 | 0.000 | ||
| −2.395 | 1.581 | 0.132 | ||
| −2.228 | 0.640 | 0.000 | ||
| Aspen basal area proportion | 0.079 | 0.006 | <0.0001 | |
| Stand age | −0.512 | 0.011 | <0.0001 | |
| 0.294 | 0.012 | <0.0001 | ||
| Shannon index | 0.437 | 0.019 | <0.0001 | |
| 0.275 | 0.036 | <0.0001 | ||
| Aridity index | −0.031 | 0.009 | 0.012 | |
| 0.014 | 0.007 | 0.002 | ||
| Mean Site Index | 18.628 | 0.468 | <0.0001 |
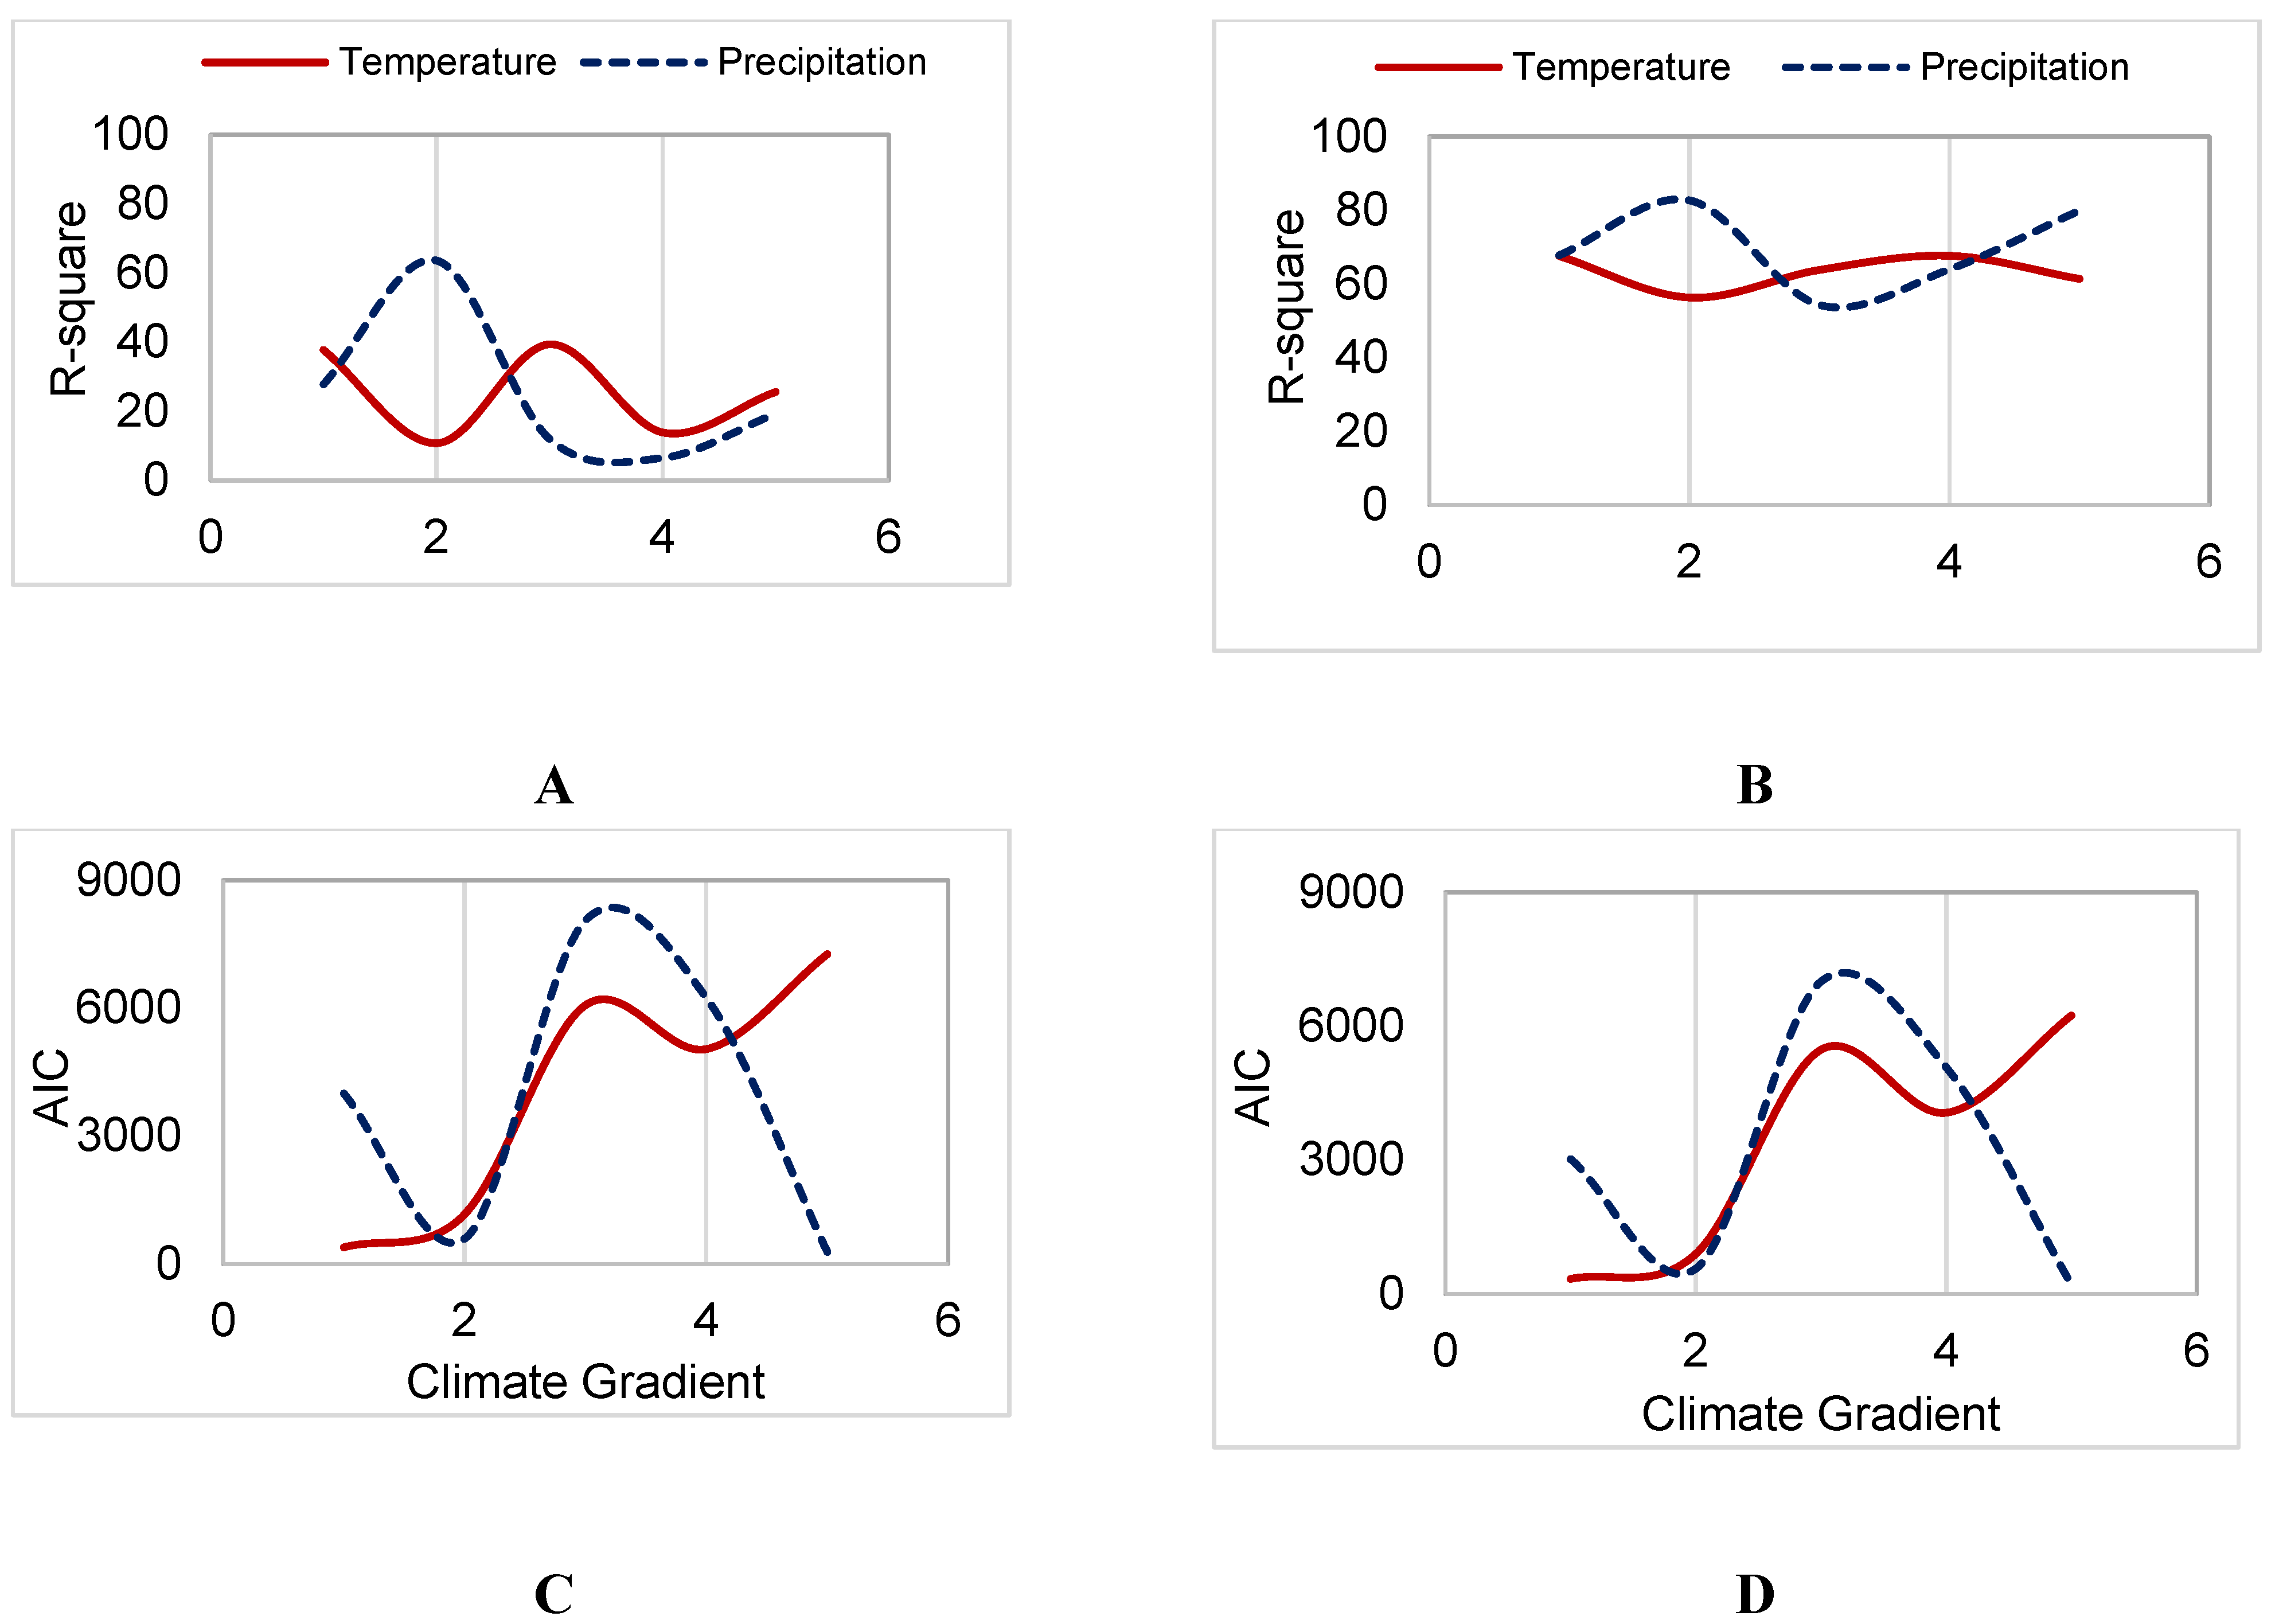
3.3. Sensitivity to Climate

4. Discussion
4.1. Stand Development Explains Long-Term Productivity
4.2. Aspen Forests in Cooler, Drier Environments are Most Sensitive to Productivity Drivers
4.3. Implications within the Context of Global Changes
5. Conclusions
Acknowledgments
Author Contributions
Conflicts of Interest
References
- Kimmins, J.P. Importance of soil and role of ecosystem disturbance for sustained productivity of cool temperate and boreal forests. Soil Sci. Soc. Am. J. 1996, 60, 1643–1654. [Google Scholar] [CrossRef]
- Van der Heijden, M.G.A.; Bardgett, R.D.; van Straalen, N.M. The unseen majority: Soil microbes as drivers of plant diversity and productivity in terrestrial ecosystems. Ecol. Lett. 2008, 11, 296–310. [Google Scholar]
- Prescott, C.E.; Zabek, L.M.; Staley, C.L.; Kabzems, R. Decomposition of broadleaf and needle litter in forests of British Columbia: Influences of litter type, forest type, and litter mixtures. Can. J. For. Res. 2000, 30, 1742–1750. [Google Scholar] [CrossRef]
- Hart, S.A.; Chen, H.Y.H. Fire, logging and overstory affect understory abundance, diversity and composition in boreal forest. Ecol. Monogr. 2008, 78, 123–140. [Google Scholar] [CrossRef]
- Rohne, B.; Bigler, C.; Wunder, J.; Brang, P.; Bugmann, H. Fifty years of natural succession in Swiss forest reserves: Changes in stand structure and mortality rates of oak and beech. J. Veg. Sci. 2012, 23, 892–905. [Google Scholar] [CrossRef]
- St.-Clair, S.B.; Cavard, X.; Bergeron, Y. The role of facilitation and competition in the development and resilience of aspen forests. For. Ecol. Manag. 2013, 299, 91–99. [Google Scholar] [CrossRef]
- Bouchard, M.; Pothier, D.; Gauthier, S. Fire return intervals and tree species development in the North Shore region of eastern Quebec. Can. J. For. Res. 2008, 38, 1621–1633. [Google Scholar] [CrossRef]
- Grant, R.F.; Margolis, H.A.; Barr, A.G.; Black, T.A.; Dunn, A.L.; Bernier, P.Y.; Bergeron, O. Changes in net ecosystem productivity of boreal black spruce stands in response to changes in temperature at diurnal and season time scales. Tree Physiol. 2008, 29, 1–17. [Google Scholar] [CrossRef] [PubMed]
- IPCC. Summary for Policymakers. In Climate Change 2013: The Physical Science Basis. Contribution of Working Group I to the Fifth Assessment Report of the Intergovernmental Panel on Climate Change; Stocker, T.F., Qin, D., Plattner, G.-K., Tignor, M., Allen, S.K., Boschung, J., Nauels, A., Xia, Y., Bex, V., Midgley, P.M., Eds.; Cambridge University Press: Cambridge, UK, 2013. [Google Scholar]
- Tang, G.; Beckage, B.; Smith, B. The potential transient dynamics of forests in New England under historical and projected future climate change. Clim. Chang. 2012, 114, 357–377. [Google Scholar] [CrossRef]
- Kelly, R.; Chipman, M.L.; Higuera, P.E.; Stefanova, I.; Brubaker, L.B.; Hu, F.S. Recent burning of boreal forests exceeds fire regime limits of the past 10,000 years. PNAS 2013. [Google Scholar] [CrossRef]
- Peterson, E.B.; Peterson, N.M. Ecology, Management and Use of Aspen and Balsam Poplar in the Prairie Provinces, Canada; Special Report; Forestry Canada, Northwest Region Northern Forestry Centre: Edmonton, Alberta, Canada, 1992; Volume 1, p. 252. [Google Scholar]
- Ondro, W.J. Utilization and Market Potential of Poplar in Alberta; Information Report; Forestry Canada, Northern Forestry Centre: Edmonton, Alberta, Canada, 1989; p. 72. [Google Scholar]
- Christersson, L. Wood production potential in poplar plantations in Sweden. Biomass Bioenergy 2010, 34, 1289–1299. [Google Scholar] [CrossRef]
- Hogg, E.H. Climate and the southern limit of the western Canadian boreal forest. Can. J. For. Res. 1994, 24, 1835–1845. [Google Scholar] [CrossRef]
- Hogg, E.H.; Barr, A.G.; Black, T.A. A simple soil moisture index for representing multi-year drought impacts on aspen productivity in the western Canadian interior. Agric. For. Meteorol. 2013, 178–179, 173–182. [Google Scholar] [CrossRef]
- Worrall, J.J.; Gerald, E.R.; Hamann, A.; Hogg, E.H.; Marchetti, S.B.; Michaelian, M.; Gray, L.K. Recent declines of Populus tremuloides in North America linked to climate. For. Ecol. Manag. 2013, 299, 35–51. [Google Scholar] [CrossRef]
- Lapointe-Garant, M.-P.; Huang, J.-G.; Gea-izquierdo, G.; Raulier, F.; Bernier, P.Y.; Berninger, F. Use of tree rings to study the effect of climate change on trembling aspen in Québec. Glob. Chang. Biol. 2010, 16, 2039–2051. [Google Scholar] [CrossRef]
- Anyomi, K.A.; Raulier, F.; Bergeron, Y.; Mailly, D. The predominance of stand composition and structure over direct climatic and site effects in explaining aspen (Populus tremuloides Michaux) site index within boreal and temperate forests of western Quebec, Canada. For. Ecol. Manag. 2013, 302, 390–403. [Google Scholar] [CrossRef]
- Lorenzetti, F.; Université du Québec en Outaouais, Ripon, Canada. Unpublished work. 2015.
- Skovsgard, J.P.; Vanclay, J.K. Forest site productivity: A review of the evolution of dendrometric concepts for even-aged stands. Institute of chartered foresters. Forestry 2007, 81. [Google Scholar] [CrossRef]
- Paré, D.; Bergeron, Y.; Longpré, M.-H. Potential productivity of aspen cohorts originating from fire, harvesting and tree-fall gaps on two deposit types in northwestern Quebec. Can. J. For. Res. 2001, 31, 1067–1073. [Google Scholar] [CrossRef]
- Régnière, J.; Saint-Amant, R. BioSIM 9-Manuel de l’Utilisateur. Ressources Naturelles Canada, Service Canadien des Forêts; Centre de Foresterie des Laurentides: Quebec, Canada, 2008; p. 81. [Google Scholar]
- Ponge, J.-F.; Jabiol, B.; Gégout, J.-C. Geology and climate conditions affect more humus forms than forest canopies at large scale in temperate forests. Geoderma 2011, 162, 187–195. [Google Scholar] [CrossRef]
- Boucher, D.; Gauthier, S.; de Grandpré, L. Structural changes in coniferous stands along a chronosequence and a productivity gradient in the northeastern boreal forest of Québec. Ecoscience 2006, 13, 172–180. [Google Scholar] [CrossRef]
- Pothier, D.; Savard, F. Actualisation des Tables de Production Pour les Principales Espèces Forestières du Québec; Direction de la Recherche Forestière; Ministère des Ressources Naturelles du Québec: Quéebec, QC, Canada, 1998; p. 183. [Google Scholar]
- Plonski, W.L. Introduction to Plonski’s Normal Yield Tables. Available online: http://flash.lakeheadu.ca/~fluckai/pow.html (accessed on 3 February 2015).
- Payandeh, B. Metric site index formulae for major Canadian timber species. Dept. Fish. Environ. Can. For. Serv. 1977, 33, 37–39. [Google Scholar]
- Huang, S.; Meng, S.X.; Yang, Y. A Growth and Yield Projection System (GYPSY) for Natural and Post-Harvest Stands in Alberta; Forestry Division, Alberta Sustainable Resource Development; Technical Report Publications: Edmonton, Canada, 2009; p. 25. [Google Scholar]
- Garcia, O. Building a dynamic growth model for trembling aspen in western Canada without age data. Can. J. For. Res. 2013, 43, 256–265. [Google Scholar]
- Nigh, G.D.; Krestov, P.V.; Klinka, K. Trembling aspen height-age models for British Columbia. Northwest Sci. 2002, 76, 202–212. [Google Scholar]
- Nigh, G.D.; Love, B.W. A model for estimating juvenile height of lodgepole pine. For. Ecol. Manag. 1999, 123, 157–166. [Google Scholar] [CrossRef]
- Mailly, D.; Gaudreault, M. Modèles de croissance internodale pour l’épinette noire, le pin gris et le sapin baumier au Québec. For. Chron. 2005, 81, 114–124. [Google Scholar] [CrossRef]
- Anyomi, K.A.; Raulier, F.; Mailly, D.; Girardin, M.; Bergeron, Y. Using height growth to model local and regional response of trembling aspen (Populus tremuloides Michx.) to climate within the boreal forest of western Québec. Ecol. Model. 2012, 243, 123–132. [Google Scholar] [CrossRef]
- Bates, D.M.; Watts, D.G. Non-Linear Regression Analysis and Its Applications; John Wiley and Sons: New York, NY, USA, 1988; p. 359. [Google Scholar]
- Johnstone, J.F.; Hollingsworth, T.N.; Chapin, F.S.; Mack, M.C. Changes in fire regime break the legacy lock on developmental trajectories in Alaskan boreal forest. Global Chang. Biol. 2010, 16, 1281–1295. [Google Scholar] [CrossRef]
- Bond, B.J. Age-related changes in photosynthesis of woody plants. Trends Plant Sci. 2000, 5, 349–353. [Google Scholar] [CrossRef] [PubMed]
- Perrette, G.; Lorenzetti, F.; Moulinier, J.; Bergeron, Y. Site factors contribute to aspen decline and stand vulnerability following a forest tent caterpillar outbreak in the Canadian Clay Belt. For. Ecol. Manag. 2014, 323, 126–137. [Google Scholar] [CrossRef]
- Trap, J.; Hättenschwiler, S.; Gattin, I.; Aubert, M. Forest ageing: An unexpected driver of beech leaf litter quality variability in European forests with strong consequences on soil processes. For. Ecol. Manag. 2013, 302, 338–345. [Google Scholar] [CrossRef]
- Raulier, F.; Lambert, M.-C.; Pothier, P.; Ung, C.-H. Impact of dominant tree dynamics on site index curves. For. Ecol. Manag. 2003, 184, 65–78. [Google Scholar] [CrossRef]
- Stocks, B.J.; Mason, J.A.; Todd, J.B.; Bosch, E.M.; Wotton, B.M.; Amiro, B.D.; Flannigan, M.D.; Hirsch, K.G.; Logan, K.A.; Martell, D.L.; et al. Large forest fires in Canada, 1959–1997. J. Geophys. Res. 2003, 107, FFR5.1–FFR5.12. [Google Scholar]
- Bond-Lamberty, B.; Peckham, S.D.; Ah, D.E.; Gower, S.T. Fire as the dominant driver of central Canadian boreal forest carbon balance. Nature 2007, 450, 89–92. [Google Scholar] [CrossRef] [PubMed]
- Pan, Y.; Chen, J.M.; Birdsey, R.; McCullough, K.; He, L.; Deng, F. Age structure and disturbance legacy of North American forests. Biogeosciences 2011, 8, 715–732. [Google Scholar] [CrossRef]
- Laquerre, S.; Harvey, B.D.; Leduc, A. Spatial analysis of response of trembling aspen patches to clear-cutting in black spruce-dominated stands. For. Chron. 2011, 87, 77–85. [Google Scholar] [CrossRef]
© 2015 by the authors; licensee MDPI, Basel, Switzerland. This article is an open access article distributed under the terms and conditions of the Creative Commons Attribution license (http://creativecommons.org/licenses/by/4.0/).
Share and Cite
Anyomi, K.A.; Lorenzetti, F.; Bergeron, Y.; Leduc, A. Stand Dynamics, Humus Type and Water Balance Explain Aspen Long Term Productivity across Canada. Forests 2015, 6, 416-432. https://doi.org/10.3390/f6020416
Anyomi KA, Lorenzetti F, Bergeron Y, Leduc A. Stand Dynamics, Humus Type and Water Balance Explain Aspen Long Term Productivity across Canada. Forests. 2015; 6(2):416-432. https://doi.org/10.3390/f6020416
Chicago/Turabian StyleAnyomi, Kenneth A., François Lorenzetti, Yves Bergeron, and Alain Leduc. 2015. "Stand Dynamics, Humus Type and Water Balance Explain Aspen Long Term Productivity across Canada" Forests 6, no. 2: 416-432. https://doi.org/10.3390/f6020416