Article

Designing Strategies for Epidemic Control in a Tree Nursery: the Case of Ash Dieback in the UK

by
Vasthi Alonso Chavez
1,*,
Stephen Parnell
1,2 and
Frank Van den Bosch
1
1
Department of Computational and Systems Biology, Rothamsted Research, Harpenden, AL5 2JQ, UK
2
School of Environment and Life Sciences, University of Salford, Manchester, M5 4WT, UK
*
Author to whom correspondence should be addressed.
Forests 2015, 6(11), 4135-4145; https://doi.org/10.3390/f6114135
Submission received: 25 September 2015 / Revised: 6 November 2015 / Accepted: 6 November 2015 / Published: 18 November 2015

Abstract

:
Ash dieback is a fungal disease (causal agent Hymenoscyphus fraxineus) infecting Common ash (Fraxinus excelsior) throughout temperate Europe. The disease was first discovered in the UK in 2012 in a nursery in Southern England, in plants which had been imported from the Netherlands. After sampling other recently planted sites across England, more infected trees were found. Tree trade from outside and across the UK may have facilitated the spread of invasive diseases which threaten the sustainability of forestry business, ecological niches and amenity landscapes. Detecting a disease in a nursery at an early stage and knowing how likely it is for the disease to have spread further in the plant trade network, can help control an epidemic. Here, we test two simple sampling rules that 1) inform monitoring strategies to detect a disease at an early stage, and 2) inform the decision of tracking forward the disease after its detection. We apply these expressions to the case of ash dieback in the UK and test them in different scenarios after disease introduction. Our results are useful to inform policy makers’ decisions on monitoring for the control and spread of tree diseases through the nursery trade.

1. Introduction

Common ash is an iconic tree across temperate Europe, being widespread in broadleaved woodlands. It has a natural range that extends from Southern Scandinavia to Northern Spain and the Balkans, and from Ireland in the west to continental Russia in the east [1]. Common ash is usually found in mixed woodland communities with trees, such as beech, oak, alder, and sycamore [1,2], and accounts for 14% of the total broadleaved standing volume in the UK, making it the fourth most common broadleaved tree [3]. Ash is an important species for the functioning and conservation of forest ecosystems throughout Europe and the UK and is also an economically important species, having a valuable and high in demand timber because of its physical properties [2].
Ash dieback (causal agent Hymenoscyphus fraxineus) is a fungal disease which affects several species of the Fraxinus genus including European or common ash (Fraxinus excelsior), which is the most affected [4]. It was first observed in Poland in the early 1990s, but the disease has continued its spread across Europe, reaching a large proportion of countries including the UK with the first ash dieback observation in a tree nursery in Buckinghamshire in February 2012 [5].
Although ash dieback had been observed since the early 1990s, the anamorph (asexual stage) of the causal organism (Chalara fraxinea) was named only in 2006 [6]. By 2009, C. fraxinea was wrongly considered to be the anamorph of Hymenoscyphus albidus, a species considered to be non-pathogenic, native and widespread in Europe [7]. In 2010, it was found that the sexual stage of C. fraxinea was Hymenoscyphus pseudoalbidus [8], morphologically similar to, but genetically distinct from H. albidus. It was only in 2014 that the correct scientific name Hymenoscyphus fraxineus was given for the fungus causing ash dieback in Europe [9]. This meant that before 2012, the pathogen was not designated as an organism of statutory concern under the EU Plant Health Directive. Thus, ash trade was allowed to continue to spread in the UK and other European countries, despite concerns and attempts to ban ash imports into the UK from the Horticultural Trades Association (HTA) in 2009 [10] due to the spread of the disease across Europe.
Once the disease was detected in the UK, a rapid assessment of the disease was undertaken by Forest Research to determine the status of the pathogen [11] followed by a pest risk analysis [5] and a Chalara (ash dieback) management plan [12]. These assessments determined that the disease was not only found in several nurseries but was also discovered in the wider environment. “Tracing forward” from infected nurseries in order to determine sites with recently planted trees was one of the measures taken to reduce the rate of epidemic spread [12]. Finding the disease in nurseries also triggered the assessment of the disease in the wider environment, allowing the detection and the development of a plan to slow the disease spread [12].
It has become clear that one of the possible paths for ash dieback spread is through trade. Nurseries are strategic points for the distribution of trees and the potential spread of disease. Therefore, understanding the processes of disease-monitoring within a nursery, and plant sales from a nursery can help developing sampling and tracking strategies to slow and control the spread of diseases introduced in nurseries via trade.
In the UK, plant health inspections are undertaken by the Department for Environment, Food and Rural Affairs (Defra) and the Forestry Commission with the aim of keeping non-native species that may affect crops, trees and wild plants out of the country [13]. In the case of the hard nursery stock sector, the Plant Health and Seeds Inspectorate (PHSI) sets policy and enforces controls and restrictions on the import, movement and keeping of certain plants, plant pests and other materials such as soil.
Developing tools that can help inspectors and business owners detect and control a disease before it becomes widespread are needed. In the UK nursery inspections usually happen from July–September since this time of the year is when disease expression is clearer. Official inspections for nurseries can happen between two and four times per year, depending on the business’s risk to plant health [14].
If a diseased tree shows no symptoms during inspection, the disease may continue spreading to other hosts or even moved to other areas if sold. Therefore, here we present a method that accounts for disease asymptomatic periods that play an important role for the epidemic development.
We describe a simple monitoring method for a single nursery in order to (1) detect a disease at an early stage, considering that the disease has an asymptomatic period, and (2) determine the need of tracking forward the disease depending on the probability of having sold or moved diseased plants to other places. We apply this method to the case of ash dieback and consider different control scenarios to understand the best strategies to slow the disease spread.

2. Model and Methods

In this section, we describe the monitoring method developed in two parts. The first part of the method determines sampling strategies that help detecting ash dieback in a nursery at an early epidemic stage. The second helps understanding what strategies would have been needed to reduce the probability that infected plants were moved to other points in the tree trade network, such as recently planted sites, when an epidemic is first discovered.

2.1. Epidemic Dynamics

We assume that the disease arrives to a nursery at time t0 affecting the tree population with an initial incidence (q0) (the initial proportion of affected trees), assumed to be small in comparison with the total number of trees. If we aim to detect the epidemic at an early stage, we can assume that the epidemic follows logistic growth so that the epidemic incidence over time is given by:
q ( t )   =   q 0 exp ( r ( t     t 0   +   λ ) ) 1     q 0   +   q 0 exp ( r ( t     t 0   +   λ ) )  
where the incidence q(t) is the proportion of individuals infected (symptomatic and asymptomatic) at time t from the total host population [15], r is the epidemic growth rate, λ the epidemic asymptomatic period and q0 the initial incidence at the time t0, when the disease arrives to the nursery.

2.2. Monitoring Plan in the Nursery

We assume that a monitoring scheme for nurseries is already in place before the epidemic starts. In this monitoring scheme, N hosts are randomly sampled every fixed period of time Δt. We also assume that only symptomatic hosts can be identified through visual inspection. We then assume that the probability of detecting at least one infected individual at t1 given that epidemic started at t0 follows a binomial distribution and it is given by:
P ( t 1 | t 0 )   =   1     ( 1     q s ( t 1 ) ) N .
The probability of not being able to detect any infected hosts throughout all sampling rounds previous to t1 is:
i   =   1 k ( 1     q s ( t 1     i Δ t ) ) N ,
where k is the total number of sampling rounds between t0 and t1. Using these assumptions Alonso Chavez et al. [16] found a rule of thumb to determine the expected incidence of the disease at first detection, q*:
E ( q * )     r   Δ t N e r λ ,
where λ is the disease’s asymptomatic period [16]. This approximation is a simple method to determine a sampling strategy that enables early detection of a disease.
Equation (4) has been tested in practical situations and has been found to give accurate predictions under conditions where the asymptomatic period is absent (or where asymptomatic infection can be detected by the detection method, e.g., PCR) [17,18]. It says that the expected discovery incidence depends on the epidemic growth rate, the sampling rate and the length of the asymptomatic period. If we know the epidemic growth and the asymptomatic period of a disease, it is possible to design a sampling strategy to detect a disease below a designated expected incidence E(q*).

2.3. Selling Trees from the Nursery

When a nursery is infected (either by buying one or more infected trees or by inoculum being blown into the nursery) an epidemic will develop and there is a risk that infected trees are sold onwards before the epidemic is detected.
To understand how tree sales affect the probability of having moved or sold infected trees from one place to another, we assume that a nursery has a strategy where M trees are sold every Δτ period of time. We overlay this strategy on the monitoring program described in Section 2.2. We then calculate the probability that no infected hosts were sold during any selling round previous to, and including t2; the last selling time before disease detection at t1.
The probability that no infected hosts were sold at t2 given that epidemic started at t0 and that disease was detected at t1 > t2 is given by:
P ( no infected sales before detection )   =   [ 1 ( 1 q ( t 1 ) ) N ] i   =   1 k ( 1 q ( t 1   i Δ t ) ) N j   =   0 l ( 1     q ( t 2 j Δ τ + λ ) ) M  
where q(t1) is the disease incidence at discovery time, q(t2) is the incidence at the last selling time before discovery, λ is the asymptomatic period, N and M are the sampling and selling host numbers respectively, Δt and Δτ are the sampling and selling interval periods, k is the total number of sampling rounds between t0 and t1, and l is the total number of selling rounds between t0 and t2.
If we sum all possible discovery times t1 Equation (5) can be simplified to find the approximate solution [16]:
P ( no infected sales before detection ) N Δ t N Δ t + M Δ τ e r λ  
Equation (6) notes that the probability of having sold infected hosts depends on the sampling rate, the selling rate, the epidemic growth rate and the asymptomatic period of the disease. Notice that if we are looking for the probability that no infected hosts were sold to be large, the sampling rate has to be much larger that the term related to the selling rate.

2.4. Asymptomatic Period for Ash Dieback

The incubation period of H. fraxineus after ascospore inoculation has been found to be 10–14 days, with hosts showing initial symptoms, such as necrotic lesions in leaf tissue after 2 weeks of ascospore exposure [19,20]. However, visible symptoms at plant scale can appear after several months and up to a year. It has been observed that apparently disease-free seedlings that show no symptoms during the late autumn, show ash dieback symptoms by the beginning of the following year’s spring [4]. Moreover, if a seedling is infected in the spring or summer of year 1, visible symptoms may either appear during the late summer or autumn of the same year, or even in the spring of the next year [5]. This means that an infected host can be asymptomatic for up to one year. This, up to one-year-long asymptomatic period, can be identified with shoot symptoms (bark lesions) that usually arise during the dormancy period of the host, after leaf shed, when symptoms cannot be easily identified through visual inspection. Under these premises, we assume that the asymptomatic period of ash dieback is between 14 days–1 year since sampling is usually done at a plant scale.

2.5. Epidemic Growth Rate for Ash Dieback

Studies in experimental plots recorded the temporal development of ash dieback. In south-western Germany an ash field trial was established in 2005 [21]. Following a temporal development of the disease, 3-year-old ash trees were surveyed in replicated blocks or 36 plants. The development of proportion of classes of disease severity over time was recorded. We assume that the incidence in 2005, when the field trial was established is q = 0, while, for 2006, we assume very low incidence (q = 0.01). For the years 2007–2012 we used the data shown in [21] and recorded the percentage of total infected trees belonging to all severity classes. From this information, we calculated the epidemic growth rate of the disease using the least-squared method, assuming that the epidemic followed logistic growth. The epidemic growth rate obtained for the period 2005–2012 was r = 0.0026/day (Figure 1).
Figure 1. Ash dieback incidence is fitted to a logistic curve using least-squares method. The dots denote the experimental data recorded by Enderle et al. [21]. The solid line corresponds to the disease fitted curve.
Forests 06 04135 g001
The logistic epidemic growth assumed to obtain the epidemic growth rate is a time-scale approximation that does not take into account seasonality of the disease spread, which is important for symptoms appearance and disease development [22]. Nonetheless, it has been shown that in cases such as Citrus canker where epidemic can increase in bursts whenever there is a storm, this approximation is robust despite this temporal variability in epidemic spread [18,23].

3. Results and Discussion

In this section we apply the sampling expressions shown in Equations (4) and (6) to ash dieback for the epidemic growth rate and asymptomatic period shown in Section 2.2 and Section 2.3. We determine sampling and selling strategies that would help detecting the disease at low incidence and that would prevent its spread to other points in the plant trade-network.
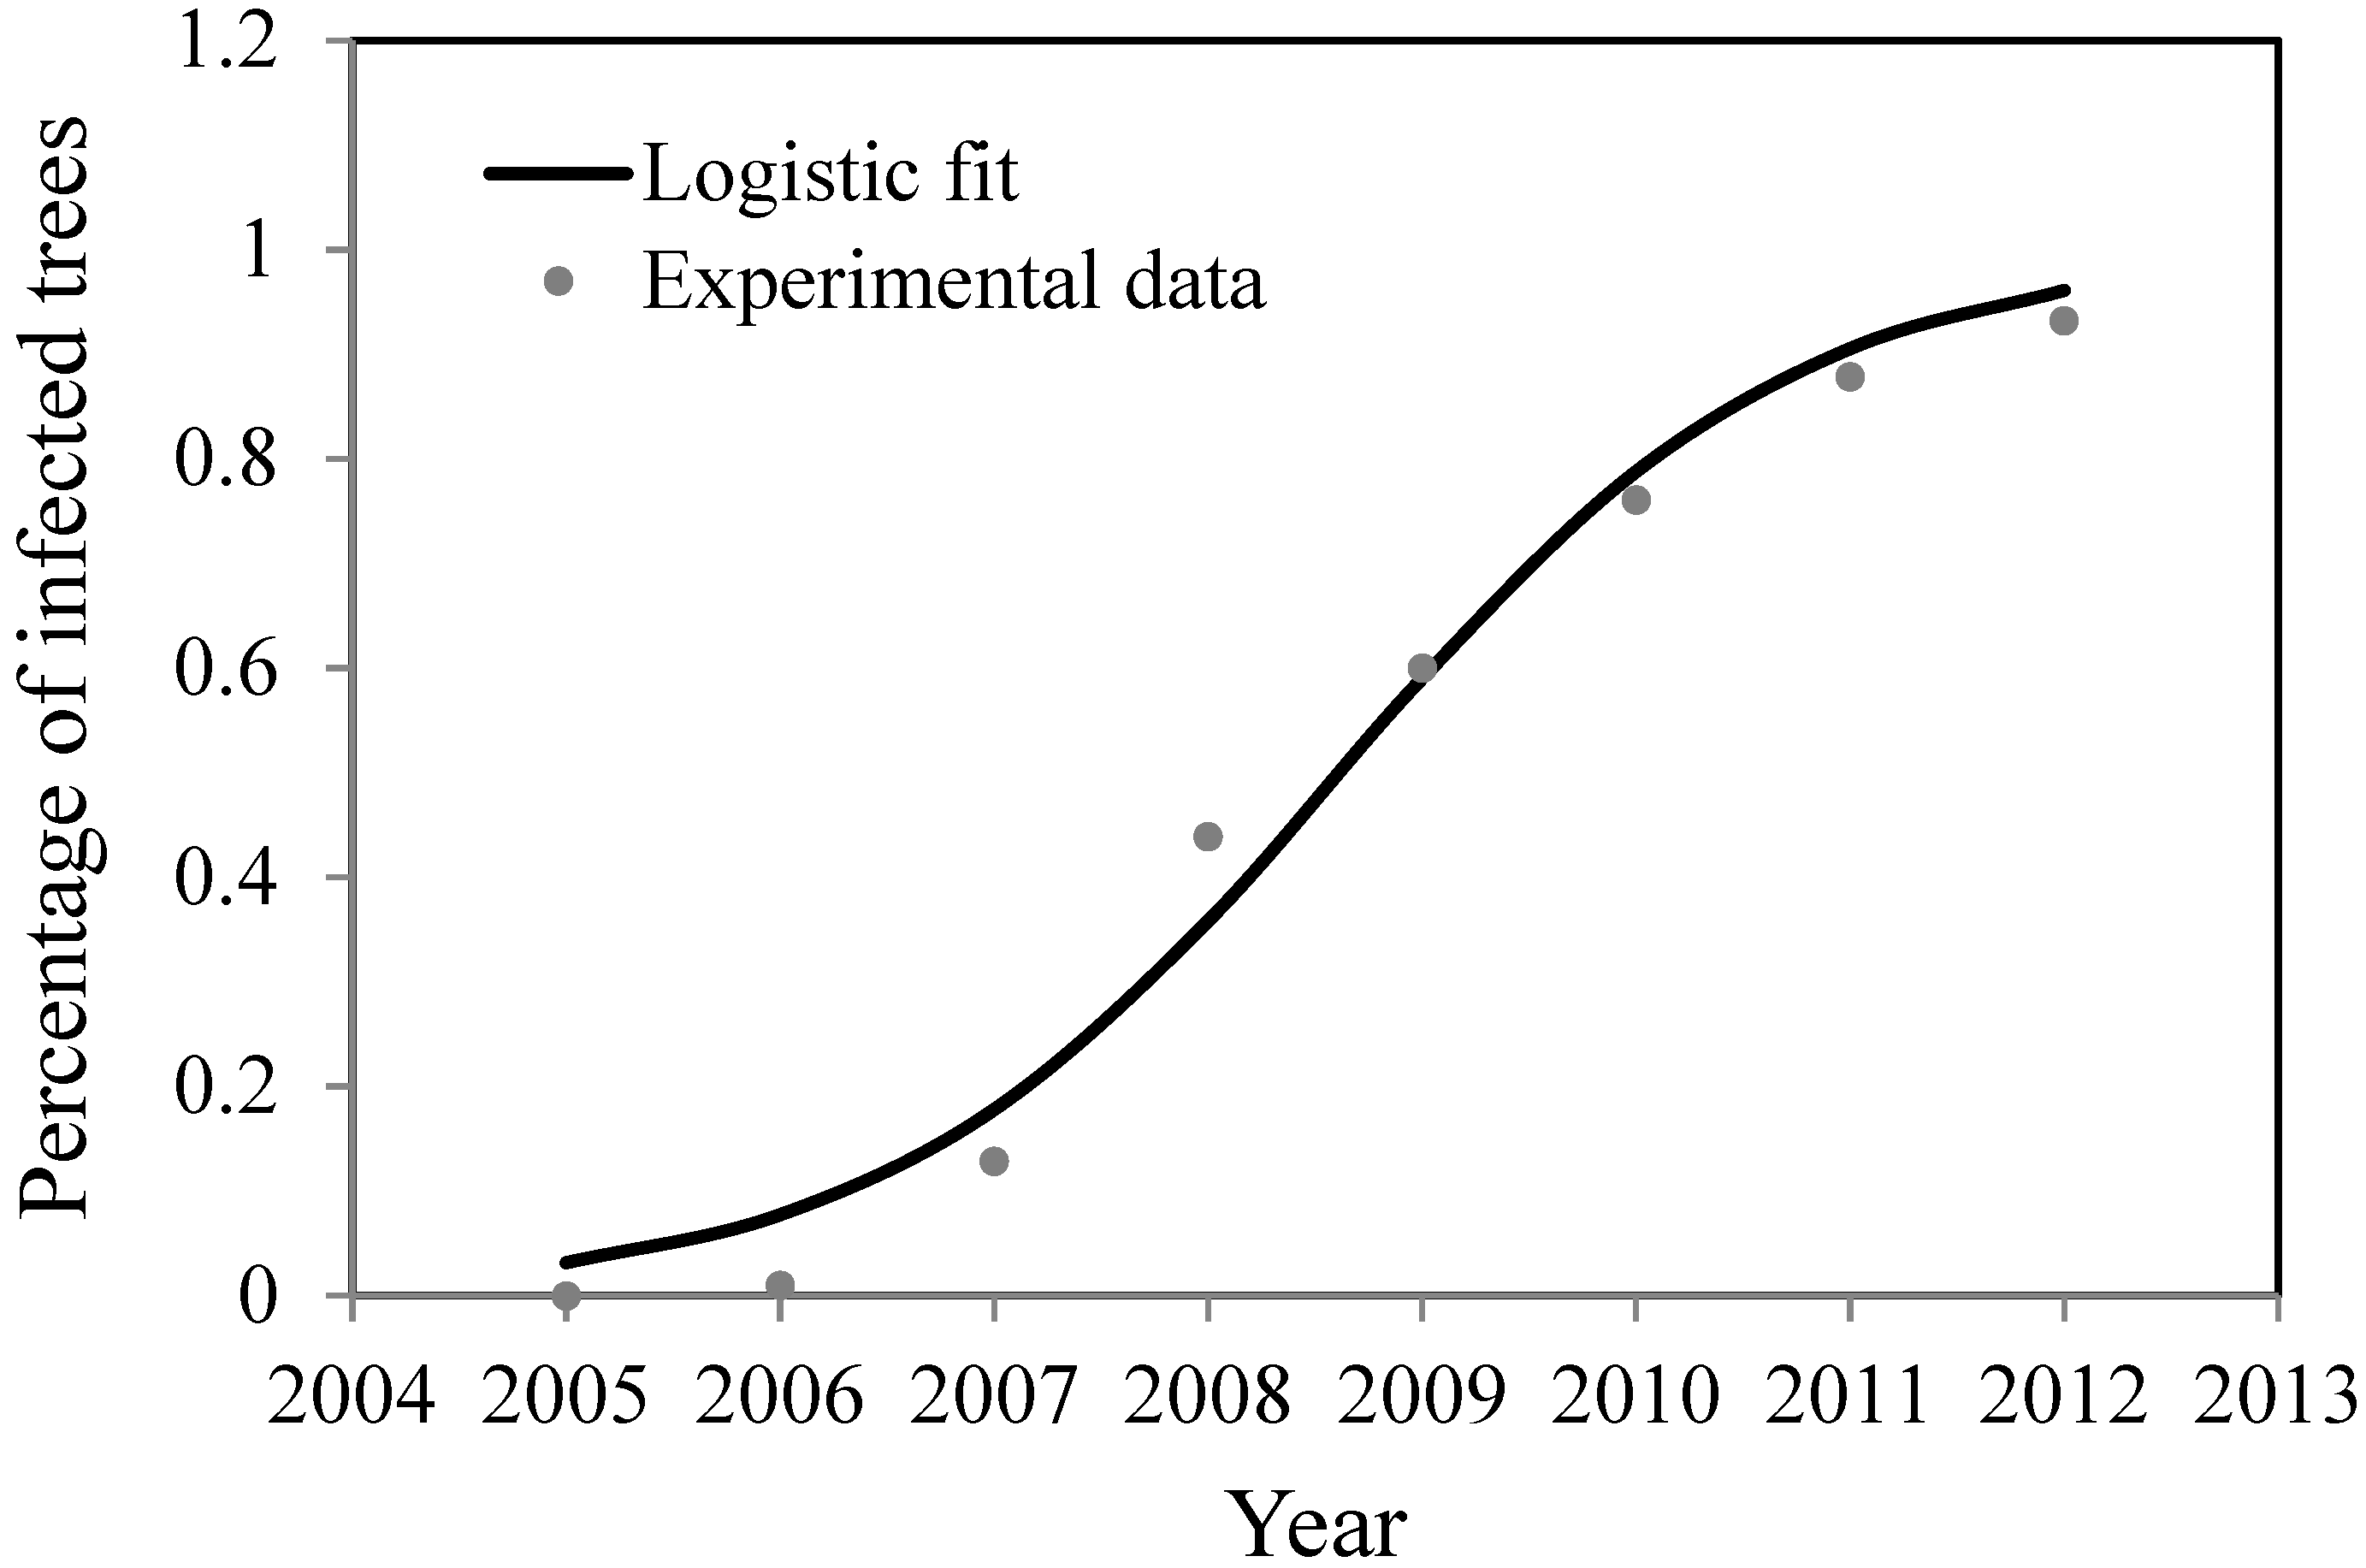
We assume that the growth rate of the epidemic is r = 0.0026 and that the asymptomatic period is approximately 150 days (five months). We take this asymptomatic period based on the information from [4] where it is observed that it is common to see that after a host is infected during late summer or early autumn, it starts showing symptoms in early spring.
Before the discovery of ash dieback in the UK in 2012, a large nursery could produce between 500,000–1,000,000 trees per year, selling up to ~300,000 trees in one month. Inspections would occur between two and four times per year, but as common ash was not a regulated species, only casual inspections for diseases in ash would take place.
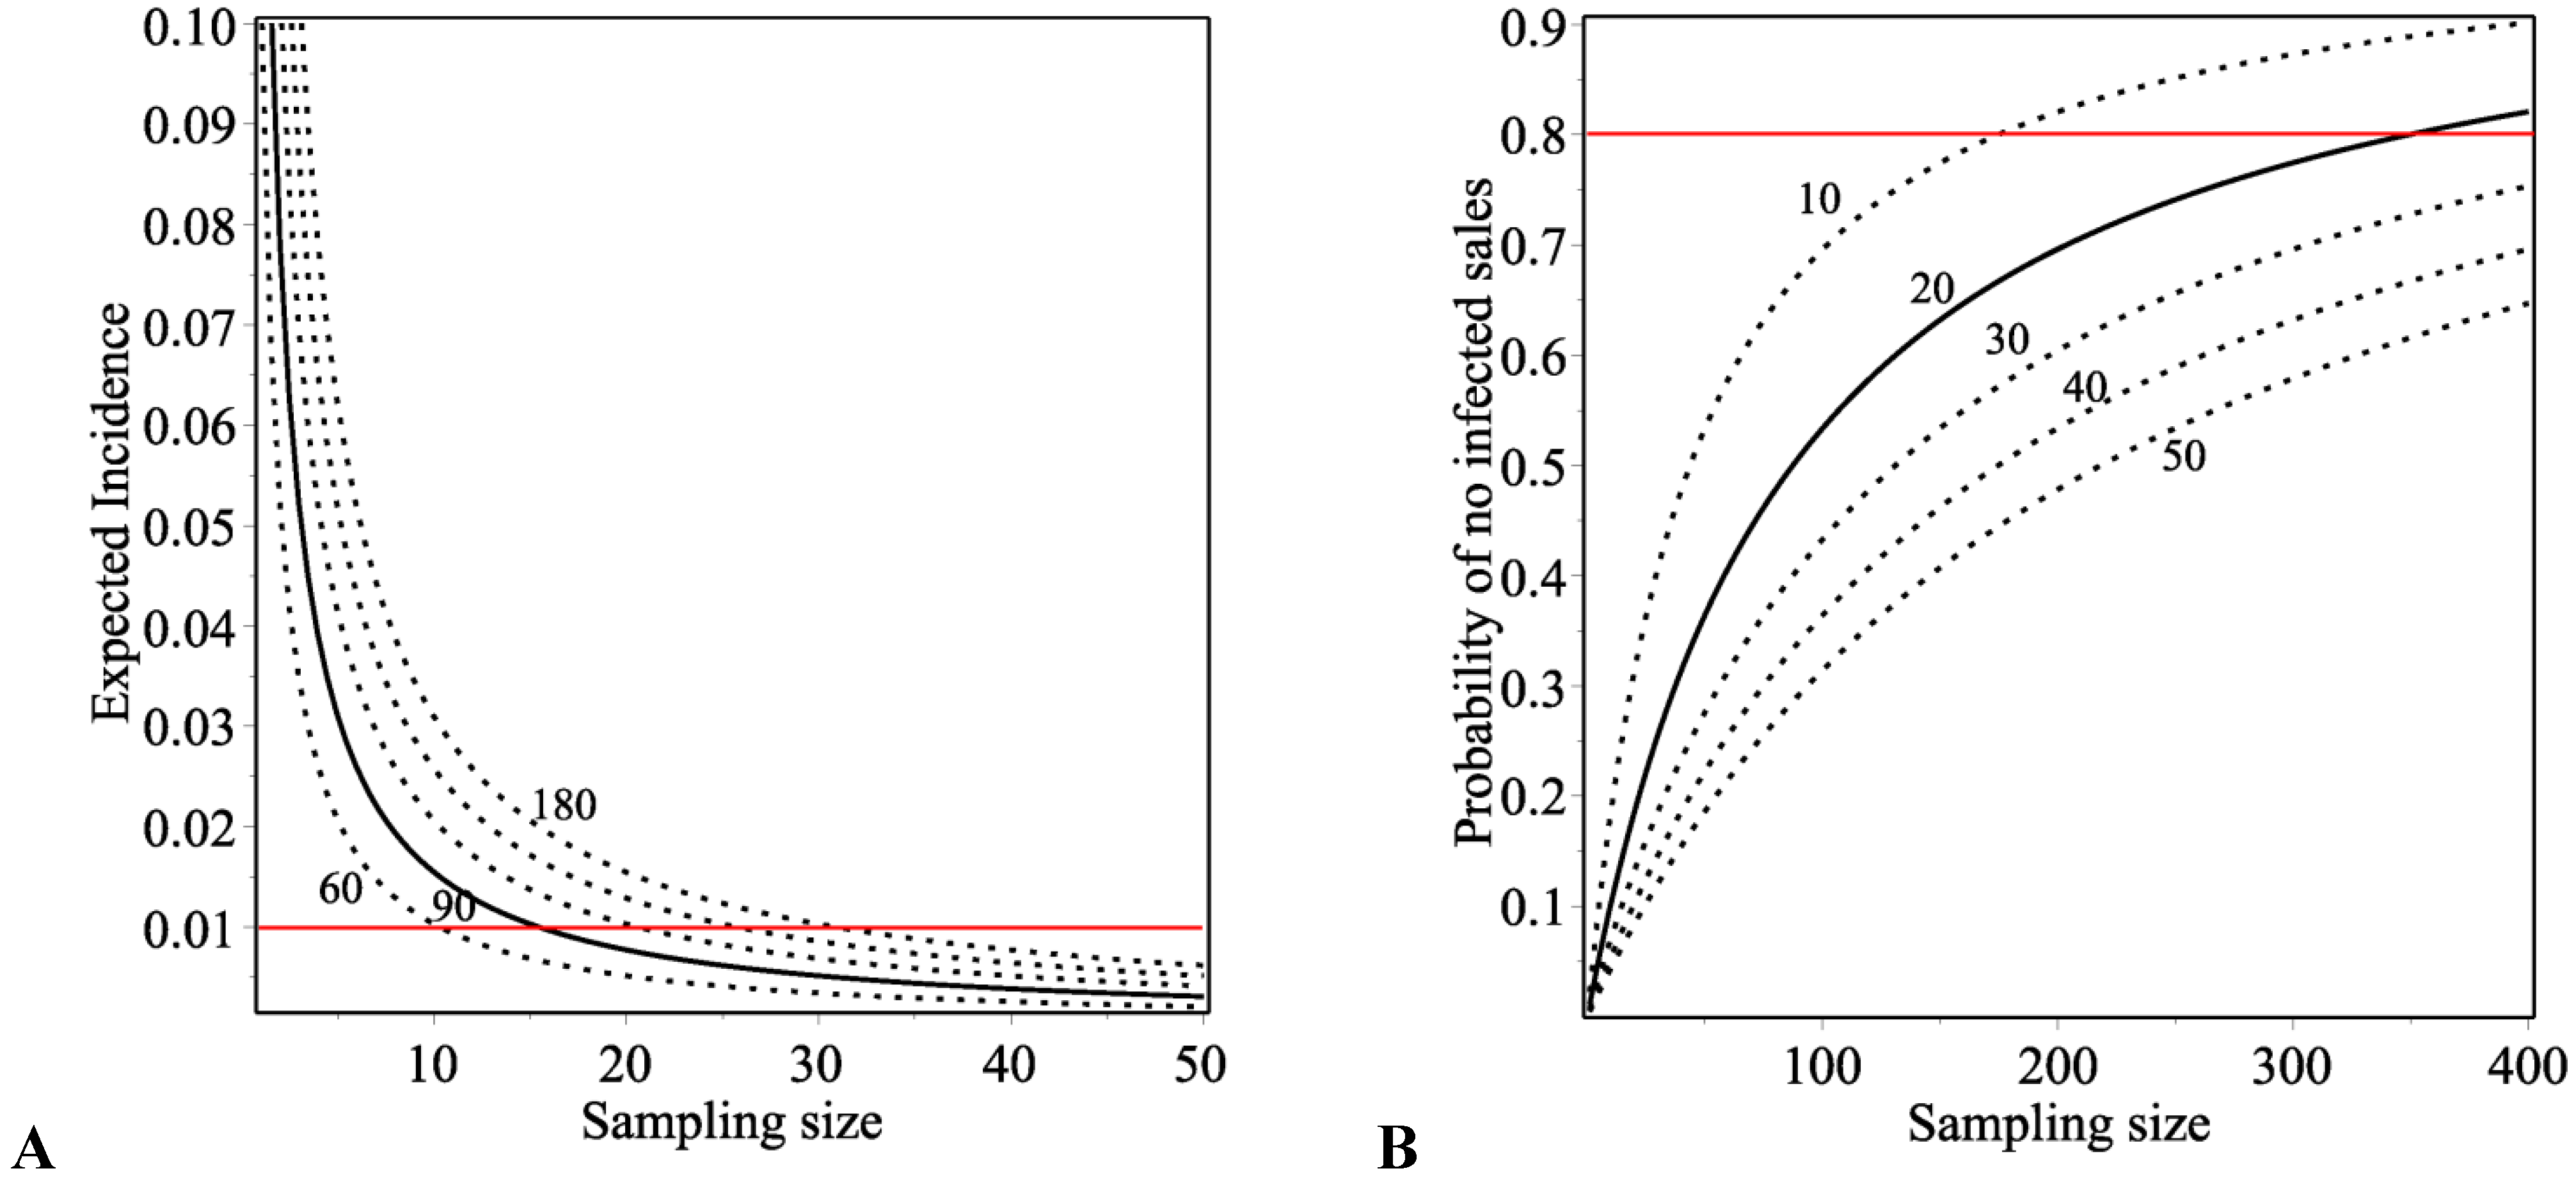
Figure 2A shows how the expected incidence at discovery depends on the sampling size N for different monitoring periods (Δt = 60, 90, 120, 180 days). The expected incidence decreases as the sampling size increases and as the sampling interval decreases, the detected expected incidence decreases as well. Figure 2A also shows that in order to detect the disease at an expected incidence below 1%, an inspector would have to sample between 10 and 40 hosts, depending on the sampling interval. For example, if an inspector were to monitor a nursery every three months (solid line), sampling at least 16 hosts will allow detecting the disease at an expected incidence of 1%.
Figure 2. (A) The expected incidence for a number of sampling intervals (60, 90, 120, 150, and 180 days) depends on the sampling size for ash dieback. The solid line shows a typical sampling interval time between inspections (90 days). In order to detect the disease at incidences below 0.01 there are a number of sampling strategies which can be adopted. If the sampling size is over approximately 35 individuals, the detection incidence stays below 0.01. (B) The probability that no infected individuals were sold before disease detection, depends on the sampling size. For this example we take a sampling interval of Δt = 90 days and a selling interval of Δτ = 30 days. Solid and dotted lines show number of plants sold (10, 20, 30, 40, 50) dependent on the sampling size. To ascertain that the probability that no infected sales taking place before detection stays above 0.8, the sampling size has to be much larger than the selling size. The solid line shows that if the nursery sells 20 trees per month, a monitoring strategy that samples ~350 plants every three months is needed to maintain this probability.
Forests 06 04135 g002
In summary, Figure 2A shows that it is possible to design sampling strategies to detect ash dieback at low incidence. This means that if the already established monitoring process before 2012 had considered ash dieback as a threat before its discovery, the probability of detecting the disease at low incidence would have been a real possibility.
It is important to note that, an ideal monitoring situation would be one where the sampling strategy could detect the pathogen in the early asymptomatic growth phase, using, for example, a sensitive molecular diagnostic assay. In such a scenario, the asymptomatic period λ can be neglected. However, a common monitoring strategy is to perform visual inspection to detect symptomatic plants. Once a symptomatic host is discovered, PCR is used to confirm if the suspected disease exists. Including the asymptomatic period allows us to assess the real disease incidence when detected, considering symptomatic and asymptomatic hosts, when visual inspection is the principal monitoring tool. This reduces the probability of underestimating the disease incidence by neglecting the asymptomatic period of the disease. This also gives us a better estimate of the probability of disease spread to other points of the trade network, informing better strategies for disease tracking.
Figure 2B shows how the probability that no infected trees were sold before detection depends on the sampling size N for different number of trees sold (M = 10, 20, 30, 40, 50). In this example we assume that the sampling interval is Δ t   =   90 and the selling interval is   Δ τ   =   30 . The probability that no infected trees were sold before detection increases as the number of sold trees decreases and as the sampling size increases. However, we note that the sampling rate has to be much larger compared with the selling rate in order to ensure that the probability that no infected plants were sold stays large enough (p (no infected sales) > 0.8). For example, the solid line in Figure 2B shows that for a selling plan of 20 trees/30 days, a sampling strategy of 350 trees/90 days is needed to ensure that at least 80% of ash trees sold or moved are disease free. This sampling strategy does not stop the potential movement of infected material since the current selling dynamics of a big nursery involves the regular movement of large numbers of trees. This result implies that, even if ash dieback can be detected at low incidence, a tracking plan to identify recently planted sites with ash coming from nurseries were infected individuals are found, is necessary.

4. Conclusions

We conclude that quantitative estimates of the performance of a sampling plan for incoming diseases such as ash dieback are possible and can be used to allocate sampling efforts appropriately. The presented method provides a simple strategy to detect diseases at low incidence, and thus control the spread of potential incoming diseases. Here we show that with the monitoring methods tested in this manuscript, a sampling strategy involving the inspection of a low number of trees every three months, would have been sufficient to detect ash dieback (and other diseases with similar epidemic growth rates and asymptomatic periods) at incidences below 1% within an infected nursery. The monitoring method presented here has been tested against detailed simulation models and real data and has shown to be robust [18], providing great insight to develop monitoring strategies through a simple rule. However, it is important to note that increased accuracy can be obtained by including seasonality in symptom expression and transmission, and should be evaluated in future work.
We also show that given the UK existing monitoring strategies, the probability that once a disease has entered into a nursery, the disease is moved to other points is high. The expression given in Equation (8) shows that the sampling rate in a nursery has to be much bigger than the selling rate, in order to ensure the containment of the disease in the nursery. We show that in the case of ash dieback, the probability of not having sold or moved infected trees was higher than 0.8 only when the sampling rate was around 6 times the selling rate. Given that, in general the nursery businesses sell large volumes of trees, a well standardised and regulated regime able to declare any tree provenance and destination may help reducing tracking costs and disease spread.
The structure of the plant trade network in the UK and the EU in general, allows nursery owners and producers to trade with each other and with other type of businesses under certain well established rules. The methods presented here show that monitoring strategies can be designed in order to detect diseases at low incidence and track infected host from individual nurseries. However, the introduction and tracking of a disease into a single nursery are intrinsically linked to plant trade at larger scales. The methods presented here constitute a first step to develop broader strategies that can include a larger number and different types of stakeholders. Strategies that quantify the implications of monitoring strategies at national and international levels should be investigated further.

Acknowledgments

Authors thank two anonymous reviewers for their helpful comments. Many thanks to J. Knight, D. McCann, D. Brown, K. Sacre, J. Dewhurst, M. Hommel, M. Robinson, B. Fraser, S. Ashworth, C. Carpenter, N. Darcy and P. Rochford for providing insight about the nursery industry in the UK. Rothamsted Research receives support from the Biotechnology and Biological Sciences Research Council (BBSRC).

Author Contributions

Frank van den Bosch supervised the project; Vasthi Alonso Chavez, Stephen Parnell and Frank van den Bosch designed the study, developed the methodology and reviewed the manuscript. Vasthi Alonso Chavez performed the analysis and wrote the manuscript. All authors discussed the results and implications and commented on the manuscript at all stages.

Conflicts of Interest

The authors declare no conflict of interest. The founding sponsors had no role in the design of the study; in the collection, analyses, or interpretation of data; in the writing of the manuscript, and in the decision to publish the results.

References

  1. Beatty, G.E.; Brown, J.A.; Cassidy, E.M.; Finlay, C.M.V.; McKendrick, L.; Montgomery, W.I.; Reid, N.; Tosh, D.G.; Provan, J. Lack of genetic structure and evidence for long-distance dispersal in ash (Fraxinus excelsior) populations under threat from an emergent fungal pathogen: Implications for restorative planting. Tree Genet. Genomes 2015, 11, 1614–2942. [Google Scholar] [CrossRef]
  2. Pautasso, M.; Aas, G.; Queloz, V.; Holdenrieder, O. European ash (Fraxinus excelsior) dieback—A conservation biology challenge. Biol. Conserv. 2013, 158, 37–49. [Google Scholar] [CrossRef]
  3. National Forest Inventory, F.C. NFI Preliminary Estimates of Quantities of Broadleaved Species in British Woodlands, with Special Focus on Ash; Forestry Commission: Edinburgh, UK, 2013.
  4. Kirisits, T.; Kritsch, P.; Kräutler, K.; Matlakova, M. Ash dieback associated with Hymenoscyphus pseudoalbidus in forest nurseries in Austria. J. Agric. Ext. Rural Dev. 2012, 4, 230–235. [Google Scholar] [CrossRef]
  5. Sansford, C.E. Pest Risk Analysis for Hymenoscyphus pseudoalbidus for the UK and the Republic of Ireland. For. Comm. 2013, 1–128. [Google Scholar]
  6. Kowalski, T. Chalara fraxinea sp. nov. associated with dieback of ash (Fraxinus excelsior) in Poland. For. Pathol. 2006, 36, 264–270. [Google Scholar] [CrossRef]
  7. Kowalski, T.; Holdenrieder, O. The teleomorph of Chalara fraxinea, the causal agent of ash dieback. For. Pathol. 2009, 39, 304–308. [Google Scholar] [CrossRef]
  8. Queloz, V.; Grünig, C.R.; Berndt, R.; Kowalski, T.; Sieber, T.N.; Holdenrieder, O. Cryptic speciation in Hymenoscyphus albidus. For. Pathol. 2011, 41, 133–142. [Google Scholar] [CrossRef]
  9. Baral, H.-O.; Queloz, V.; Hosoya, T. Hymenoscyphus fraxineus, the correct scientific name for the fungus causing ash dieback in Europe. Int. Mycol. Assoc. Fungus 2014, 5, 79–80. [Google Scholar] [CrossRef] [PubMed]
  10. Ash Dieback. Available online: http://www.the-hta.org.uk/page.php?pageid=1001 (accessed on 22 September 2015).
  11. Webber, J.; Hendry, S. Rapid Assessment of the Need for A Detailed Pest Risk Analysis for Chalara Fraxinea; Forest Research: Edinburgh, UK, 2012. [Google Scholar]
  12. DEFRA. Chalara Management Plan; DEFRA: London, UK, 2013.
  13. Williams, F.; Eschen, R.; Harris, A.; Djeddour, D.; Pratt, C.; Shaw, R.S.; Varia, S.; Lamontagne-Godwin, J.; Thomas, S.E.; Murphy, S.T. The Economic Cost of Invasive Non-Native Species on Great Britain; CABI: Wallingford, UK, 2010. [Google Scholar]
  14. Issuing plant passports to trade plants in the EU. Available online: https://www.gov.uk/issuing-plant-passports-to-trade-plants-in-the-eu (accessed on 21 August 2015).
  15. Madden, L.V.; Hughes, G.; van den Bosch, F. The Study of Plant Disease Epidemics; American Phytopathological Society: St. Paul, MN, USA, 2007. [Google Scholar]
  16. Alonso Chavez, V.; Parnell, S.; van den Bosch, F. Monitoring Invasive Pathogens in Plant Nurseries for Early-Detection and to Minimise the Probability of Escape. J. Theor. Biol. 2015. submitted for publication. [Google Scholar]
  17. Parnell, S.; Gottwald, T.R.; Gilks, W.R.; van den Bosch, F. Estimating the incidence of an epidemic when it is first discovered and the design of early detection monitoring. J. Theor. Biol. 2012, 305, 30–36. [Google Scholar] [CrossRef] [PubMed]
  18. Parnell, S.; Gottwald, T.R.; Cunniffe, N.J.; Alonso Chavez, V.; van den Bosch, F. Early-detection surveillance for an emerging plant pathogen: A rule of thumb to predict prevalence at first discovery. Proc. R. Soc. B. 2015, 282, 20151478. [Google Scholar] [CrossRef] [PubMed]
  19. Gross, A.; Holdenrieder, O.; Pautasso, M.; Queloz, V.; Sieber, T.N. Hymenoscyphus pseudoalbidus, the causal agent of European ash dieback. Mol. Plant Pathol. 2014, 15, 5–21. [Google Scholar] [CrossRef] [PubMed]
  20. Kirisits, T. Ash dieback caused by Hymenoscyphus pseudoalbidus in a seed plantation of Fraxinus excelsior in Austria. J. Agric. Ext. Rural Dev. 2012, 4, 184–191. [Google Scholar] [CrossRef]
  21. Enderle, R.; Peters, F.; Nakou, A.; Metzler, B. Temporal development of ash dieback symptoms and spatial distribution of collar rots in a provenance trial of Fraxinus excelsior. Eur. J. For. Res. 2013, 132, 865–876. [Google Scholar] [CrossRef]
  22. Bengtsson, S.B.K.; Barklund, P.; von Brömssen, C.; Stenlid, J. Seasonal pattern of lesion development in diseased Fraxinus excelsior infected by Hymenoscyphus pseudoalbidus. PLoS ONE 2014, 9, 1–9. [Google Scholar] [CrossRef] [PubMed]
  23. Gottwald, T.R.; Schubert, T.S.; Graham, J.H. Citrus Canker : The Pathogen and its impact. Plant Heal. Prog. 2002, 1993. [Google Scholar] [CrossRef]

