Article

Using Plant Temperature to Evaluate the Response of Stomatal Conductance to Soil Moisture Deficit

1
Yanchi Research Station, School of Soil and Water Conservation, Beijing Forestry University, Beijing 100083, China
2
Key Laboratory of Soil & Water Conservation and Desertification Combating, Ministry of Education, Beijing Forestry University, Beijing 100083, China
3
School of Technology, Beijing Forestry University, Beijing 100083, China
*
Author to whom correspondence should be addressed.
Forests 2015, 6(10), 3748-3762; https://doi.org/10.3390/f6103748
Submission received: 10 August 2015 / Revised: 17 September 2015 / Accepted: 25 September 2015 / Published: 16 October 2015

Abstract

:
Plant temperature is an indicator of stomatal conductance, which reflects soil moisture stresses. We explored the relationship between plant temperature and soil moisture to optimize irrigation schedules in a water-stress experiment using Firmiana platanifolia (L. f.) Marsili in an incubator. Canopy temperature, leaf temperature, and stomatal conductance were measured using thermal imaging and a porometer. The results indicated that (1) stomatal conductance decreased with declines in soil moisture, and reflected average canopy temperature; (2) the variation of the leaf temperature distribution was a reliable indicator of soil moisture stress, and the temperature distribution in severely water-stressed leaves exhibited greater spatial variation than that in the presence of sufficient irrigation; (3) thermal indices (Ig) and crop water stress index (CWSI) were theoretically proportional to stomatal conductance (gs), Ig was certified to have linearity relationship with gs and CWSI have a logarithmic relationship with gs, and both of the two indices can be used to estimate soil moisture; and (4) thermal imaging data can reflect water status irrespective of long-term water scarcity or lack of sudden rainfall. This study applied thermal imaging methods to monitor plants and develop adaptable irrigation scheduling, which are important for the formulation of effective and economical agriculture and forestry policy.

1. Introduction

Increases in the frequency, duration, and/or severity of drought and heat stress associated with climate change can fundamentally alter plants’ physiological status and development in the short term, as well as long-term ecological system security [1]. Independently from climate change, there is also particular concern regarding the potential for damage to vegetation during ecological water shortages [2]; an increased occurrence of water shortages necessitates enhanced irrigation management, such as precise irrigation schedules, to make best use of limited water capacity.
Irrigation management has been the focus of several recent studies [3,4]. It is critical to apply appropriate management to control soil water content in a limited range using species-specific management plans. The traditional methods for determining moisture content are the oven-drying method and TDR (Time-Domain Reflectometry) instrument measurement [5]; although these methods are reliable, frequent performance of the oven-drying method is inconvenient, and the TDR method is expensive and performed only at designated locations in the field.
Increased interest in evaluation of plants’ reactions to stress has led to development of new methods for vegetation management [6]. Photosynthesis and evapotranspiration rates have been widely adopted for determining plant stress [7], as have SPAC (soil-plant-air continuum) systems for monitoring soil water stress and water uptake, which result in stomatal closures and a low transpiration rate [8]. Stomatal condition can reflect water status or water stress in plants and may be used to indicate the degree of drought stress and drought-tolerance capacity. Stomatal conductance is a direct index of stomatal opening and closing [9], and is usually measured using a porometer. However, the entire plant and plant community cannot be measured simultaneously, and measurement of stomatal conductance is labor-intensive and difficult to automate.
Another potential plant-based measure of water stress is canopy temperature. The temperatures of leaves or canopies can be used as indicators of stomatal closure in response to soil water stress [10,11]. As stomata close, water loss induced by transpiration decreases, with accompanying heat loss; this results in leaf temperature increases. As such, changes in canopy temperature can be an index of stomatal conductance.
Thermal methods for canopy temperature measurement are particularly well-suited for phenotyping of stomatal behavior because they can be used to study large numbers of leaves, and even whole plant communities. The development of thermal imaging and associated image analysis software has overcome the problems associated with infrared thermometry; i.e., the low precision and difficulty of separating leaf and non-leaf [12]. It is possible to use infrared thermometry for estimation of stomatal conductance to facilitate irrigation scheduling [13].
In recent years, various papers have been published on the practical use of infrared thermometry and thermal imaging to estimate leaf stomatal resistance [14]. These studies are based on the physical relationships between stomatal resistance and corresponding leaf temperature, and comparisons to reference leaves (dry and wet), which have similar reflectivity. For example, Jones proposed an index, Ig, based on this theory to estimate stomatal conductance directly [15]; using stomatal data measured from experiments and modeling, repeated parameter verification can produce a reasonable coefficient for estimating stomatal conductance to guide irrigation scheduling [16].
Although this theory is plausible, it has not been subjected to verification using different types of plants. In this study we used Firmiana platanifolia (L. f.) Marsili (F. platanifolia) grown in an incubator to develop a better understanding of the relationship between canopy temperature and stomatal conditions at various water stress levels. F. platanifolia is a typical species in China, and is sensitive to environmental changes due to its large, thin leaves. The purposes of this study were to use thermal imaging to establish the relationship between stomatal conductance and canopy temperatures, and to optimize the thermal imaging parameters for determination of the degree of water stress.

2. Experimental Section

2.1. Plant Material and Treatment

F. platanifolia was used in this study. Following seed sterilization in hot water (55 °C) for 20 min, soaking and sprouting, the seeds were sown in a mixed medium of peat, perlite and vermiculite in plastic flowerpots (upper diameter, 16 cm; lower diameter, 10 cm; height, 12 cm). Forty flowerpots containing the same mass of medium were arranged, and were placed into an incubator and watered once per day. The daily photoperiod in the incubator was 12 h (there was 12 h in light and 12 h in darkness a day); during the first photoperiod, light intensity was 85%, air temperature was 28 °C, and air humidity was 65%. During the second photoperiod, light intensity was 0%, air temperature was 18 °C, and air humidity was 80%. Conditions were set according to the natural environment in Northern China.
Twenty well-developed plants at the four-leaf stage were selected for the gradient water stress treatment. The twenty selected seedlings were subjected to the following drought treatments: block (fully irrigated) (CK), 30% soil moisture (A); 40% soil moisture (B); 50% soil moisture (C); and 70% soil moisture (D). Each treatment was replicated four times and arranged in a randomized, complete block design. After 15 days of drought treatment, the seedlings were measured using a porometer and thermal imaging.
Six well-developed seedlings at the four-leaf stage were selected for the consistent water stress treatment. All selected seedlings were fully watered at first, and half were subjected to consistent drought treatments on days (T), while the other three were watered once every 2 days to maintain sufficient water (CG). During the experiment, leaf stomatal conductance of each seedling was measured daily using a porometer and thermal imaging in the middle of the first photoperiod.

2.2. Measurement of Related Characteristics

Soil moisture was measured daily by weighing each pot repeatedly. Leaf stomatal conductance (gs) was measured using an AP4 porometer apparatus (Delta-T Devices, Burwell, Cambridge, UK) with three repetitions (three leaves) for each pot during each sampling.
All thermal images were obtained using a thermal imager (Ti55, Fluke, Washington, D.C., USA) that operates in the waveband at 8–12 µm, has a thermal resolution of 0.1 °C, and produces images with a spatial resolution of 320 × 240 pixels. Images were obtained 1 and 0.5 m from the canopies and leaves, respectively.
When individual leaves were measured, dry and wet reference materials were used to mimic leaves with fully closed and fully open stomata, respectively. These reference materials were F. platanifolia leaves, cut from the canopy prior to measurements and placed in the same background where the experimental plants were measured. Wet reference leaves were sprayed with water on both sides regularly to maintain their moisture levels. Dry reference leaves were coated with petroleum jelly (Vaseline) on both sides. The temperatures of these references were determined (Tdry and Twet) and used in conjunction with leaf temperatures to obtain thermal indices.

2.3. Data Analyses and Statistics

Images were analyzed using the SmartView 3.2 software (Infrared Solutions) (Fluke Corporation: Plymouth, UK) for data extraction and image visual.
Images of canopies in SmartView 3.2 were exported to Microsoft Excel to determine the temperature of all pixels in the image. Background data were eliminated and canopies were outlined, and the frequency distributions of the temperatures of pixels in these areas were calculated, together with the mean temperature, variance, skewness (deviation of the distribution from symmetry), and kurtosis (deviation of the distribution from the normal peak) [17].
Images were further processed by using the temperatures of reference surfaces within the image to eliminate extraneous surfaces, such as soil or air; the temperature of wet and dry leaves or any pixels in the image that were outside the dry-wet threshold range were excluded from the analysis.
Based on the temperature differences between the experimental plant and the dry and wet references, the following thermal indices were calculated and used for comparison with the measured stomatal conductance: where Tplant, Tdry, and Twet are the mean temperatures of the leaf area of the experimental plant, the dry references, and the wet references, respectively [18].
Ig = (TdryTplant)/(TplantTwet)
Based on the variation caused by differences in air vapor pressure in different watered plots, the crop water stress index (CWSI) index (range 0 to 1) was then calculated as follows [19,20]:
CWSI = (TplantTwet)/(TdryTwet)
Leaf conductance (gs) and soil moisture were measured repeatedly and data were tested for normality and homogeneity of variance using Kolmogorov-Smirnov and Levene’s tests, respectively, in SPSS. The significance of relationships between Ig and gs was tested by Pearson-product or Spearman correlations. The effects of different soil moisture levels on gs or Tplant were subjected to analysis of variance (ANOVA), with the factors being treatment and block.

3. Results

3.1. Effects of Gradient Water Stress on Leaf Temperature and Stomatal Conductance

After selecting areas of interest, portions of images were analyzed to determine either mean temperatures or the frequency distribution of temperatures over the selected area; such analysis was conducted for each treatment group.
For comparative of canopy mean temperature, each level of water stress exerted marked effects on Tc (Figure 1). Compared to blocked seedlings, drought markedly increased the plant temperature in canopies, which was directly related to the degree of stress. There was a significant difference between each group (p < 0.05) (Table 1), and the most stressed group (A) exhibited a 0.6 °C increase in canopy mean temperature compared to the full irrigation treatment.
Figure 1. Leaf temperature under different water stress shows gradient variances. The peak temperatures of both groups C and D were approximately 21.1 °C. The soil moisture differences of each group can be reflected in peak value of canopy temperature.
Forests 06 03748 g001
Table 1. Analysis of the differences in canopy temperature within and between treatments.
Mean TemperatureANOVA
Sum of Squaresdf (degree of freedom)Mean SquareFSig. (Significance)
Between Groups0.65940.16516.1370.000
Within Groups0.153150.010
Total0.81319
ANOVA: analysis of variance
These data illustrate the difference in the temperature distributions of the block and stressed canopies, with stressed canopies displaying a wider range of temperature variation. Typical results for canopy temperature are shown in Table 2 and Figure 2, which demonstrates that the dependence of canopy temperature variability as a function of soil moisture increases with water stress.
Figure 2. Canopy temperature distributions of the water-stressed and block groups. The pixels numbers of temperature in each level are calculated, and colors distinguish the soil moisture value.
Forests 06 03748 g002
Table 2. Dependence of temperature variability (expressed as the standard deviations) as a function of soil moisture for a range of canopies.
CanopyMean Temperature (°C)Standard Deviation (sd) (°C)
A21.40.085
B21.40.083
C21.20.074
D21.10.061
CK21.00.016
Stomatal conductance was measured simultaneously with collection of thermal data (Figure 3). Leaf stomatal conductance had a negative correlation with soil water content, and the difference in conductance between each water grade was significant (Table 3). There was also a significant difference (p < 0.05) between the block and water-stressed plants in terms of the average gs value of leaves.
Table 3. Analysis of the differences in canopy stomatal conductance within and between treatments.
Leaf ConductanceANOVA
Sum of SquaresdfMean SquareFSig.
Between Groups1.12140.28026.5860.000
Within Groups0.158150.011
Total1.27919
Figure 3. Leaf stomatal conductance under different water stress conditions showing gradient variances.
Forests 06 03748 g003

3.2. Canopy Characteristics under Consistent Water Stress

During the stress procedure, the soil water content decreased from 97.6% to 14.5% and leaf temperature increased with time; this was reflected in leaf thermal images (Figure 4), in which leaf mean temperature was about 1 °C higher than that during the initial phase of the experiment. During the experiment, air temperature was kept constant so as not to influence leaf temperature in addition to soil water moisture.
For certain leaves, the temperature frequency distributions showed that the peak temperature was initially 21.0 °C and increased to 21.5 °C after 10 days of water stress (Figure 5). These data illustrate the difference in the temperature distributions of initial and stressed leaves, with stressed leaves displaying a wider range of temperature variation (sw = 0.086) than initial leaves (sw = 0.013) (Table 4).
Figure 4. Individual leaf thermal temperature dynamics during consistent water deficit. (a) Four days are selected to indicate the change of the same leaf during the experimental period. (b) The mean leaf temperature dynamic during the experiment with soil moisture decreasing; the temperature of a non-water stressed leaf is also presented for comparison.
Forests 06 03748 g004
Table 4. Dependence of temperature variability on soil moisture.
CanopyMean Temperature (°C)Standard Deviation, sw (°C)
Initial21.00.013
Stressed21.50.086
Figure 5. Leaf temperature distributions before and after water deficit treatment.
Forests 06 03748 g005
Decreased rates of stomatal conductance occurred mainly during the water-stressed phase of leaf stomatal closures (Figure 6). Stomatal conductance was basically constant during the first 4 days of the experiment, and began to decrease on day 5, when the soil moisture content was approximately 60%. The reduced soil water content following day 5 resulted in the collapse of stomatal conductance. On day 8, soil moisture decreased to below 20% and stomatal conductance became consistently low. Significant differences in stomatal conductance between initial and stressed plants were observed.
Figure 6. Leaf stomatal conductance variance during water stress.
Forests 06 03748 g006

3.3. Relationships among Temperature, Water Status, Stress Indices, and Stomatal Conductances

Table 5 summarizes the averages of four replicate images of the seedlings under treatment or block, and their corresponding errors. These data offer raw information and calculated indices that facilitate an approximate error analysis of the indices calculated using thermal data. The temperatures of wet and dry references were approximately 18.8 °C and 25.0 °C when that of the surroundings was 22 °C.
Table 5. Average temperatures of leaf (Tleaf), stomatal conductance (gs) and stress indices (Ig and CWSI) for canopies subjected to different treatments, and the error (σ) calculated from the square root of the residual mean square from ANOVAs of all treatments.
GroupsTleafgsIgCWSI
Mean (°C)ErrorMean (cm·s−1)ErrorMeanErrorMeanError
A21.430.0850.100.041.360.060.420.013
B21.410.0830.210.061.380.050.420.009
C21.150.0740.280.061.640.110.380.015
D21.120.0610.570.111.670.060.370.010
CK20.950.0160.740.181.890.190.350.022
Table 5 shows the effects of the various treatments on leaf temperatures; result showed that stressed, treatment had a highly significant effect on Tleaf which, for the most severely stressed leaves, was 0.48 °C higher than that of the block leaves. Similarly, the Ig and CWSI indices showed significant differences between the stressed and block treatments. The linear correlation between conductance and Ig and the non-linear relationship between conductance and CWSI were in accordance with theory (Equations (1) and (2)) (Figure 7), which indicated that individual seedlings with low leaf temperatures showed high gs, and vice versa.
Figure 7. The relationship between the measured stomatal conductance (gs) and the calculated linear thermal index Ig and non-linear thermal index CWSI. The results were calculated using the method based on wet and dry reference temperatures.
Forests 06 03748 g007

4. Discussion

This paper presents a method of determining drought stress through its relationship with stomatal conductance, which is based on the use of thermal images to measure the temperature variation of individual leaves and plant canopies. Thermal imaging is a non-invasive approach and should be the subject of further research. The image-processing methods described here have been developed for, and are widely used in, remote sensing [21,22], but rarely in small-scale ecological studies [23,24].

4.1. Temperature Variation within Images

Discarding redundant background data is key for calculation of accurate mean values and variances of thermal images. Overlaying of thermal and visible images, and classification of the visible images, are key steps in this process. To improve classification, it is necessary to select background materials that have thermal properties different from those of the canopy or leaves of interest. In this study, background data (wet clay soil with 50% water content) were lower than those of leaves due to high heat capacity; thus, we can discard background data by selecting data which are lower than the lowest leaf temperature and deleting them.
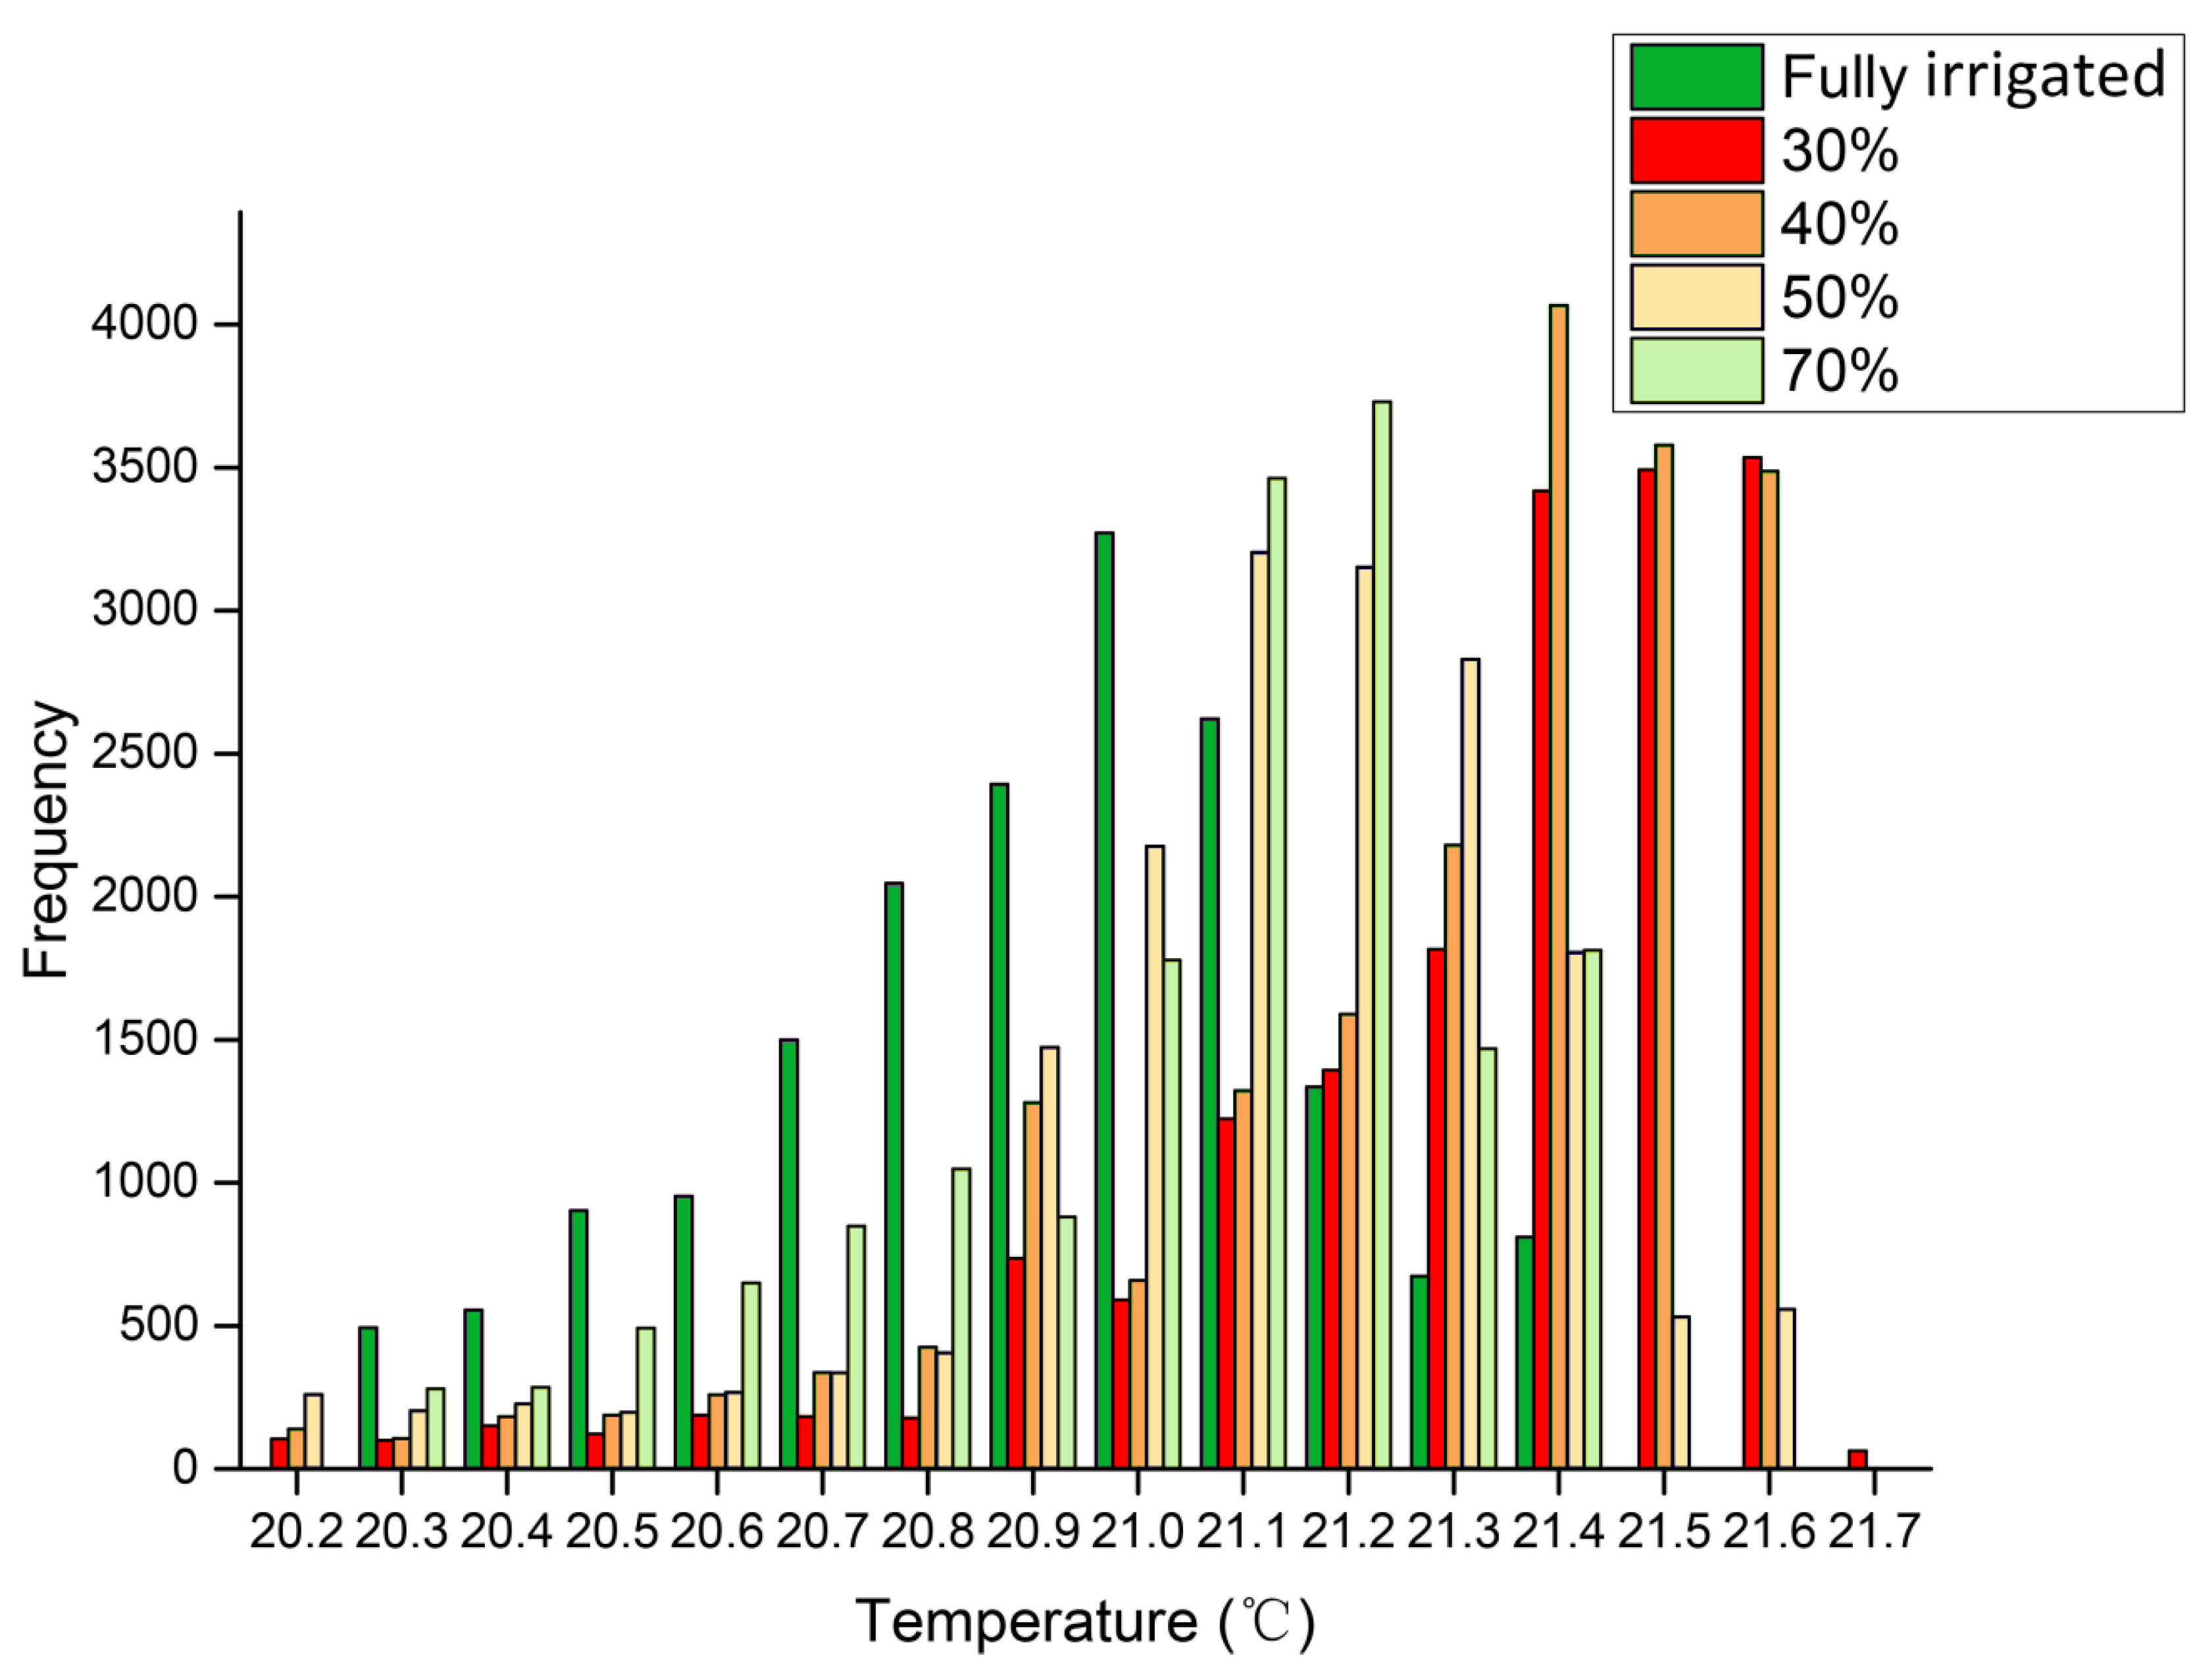
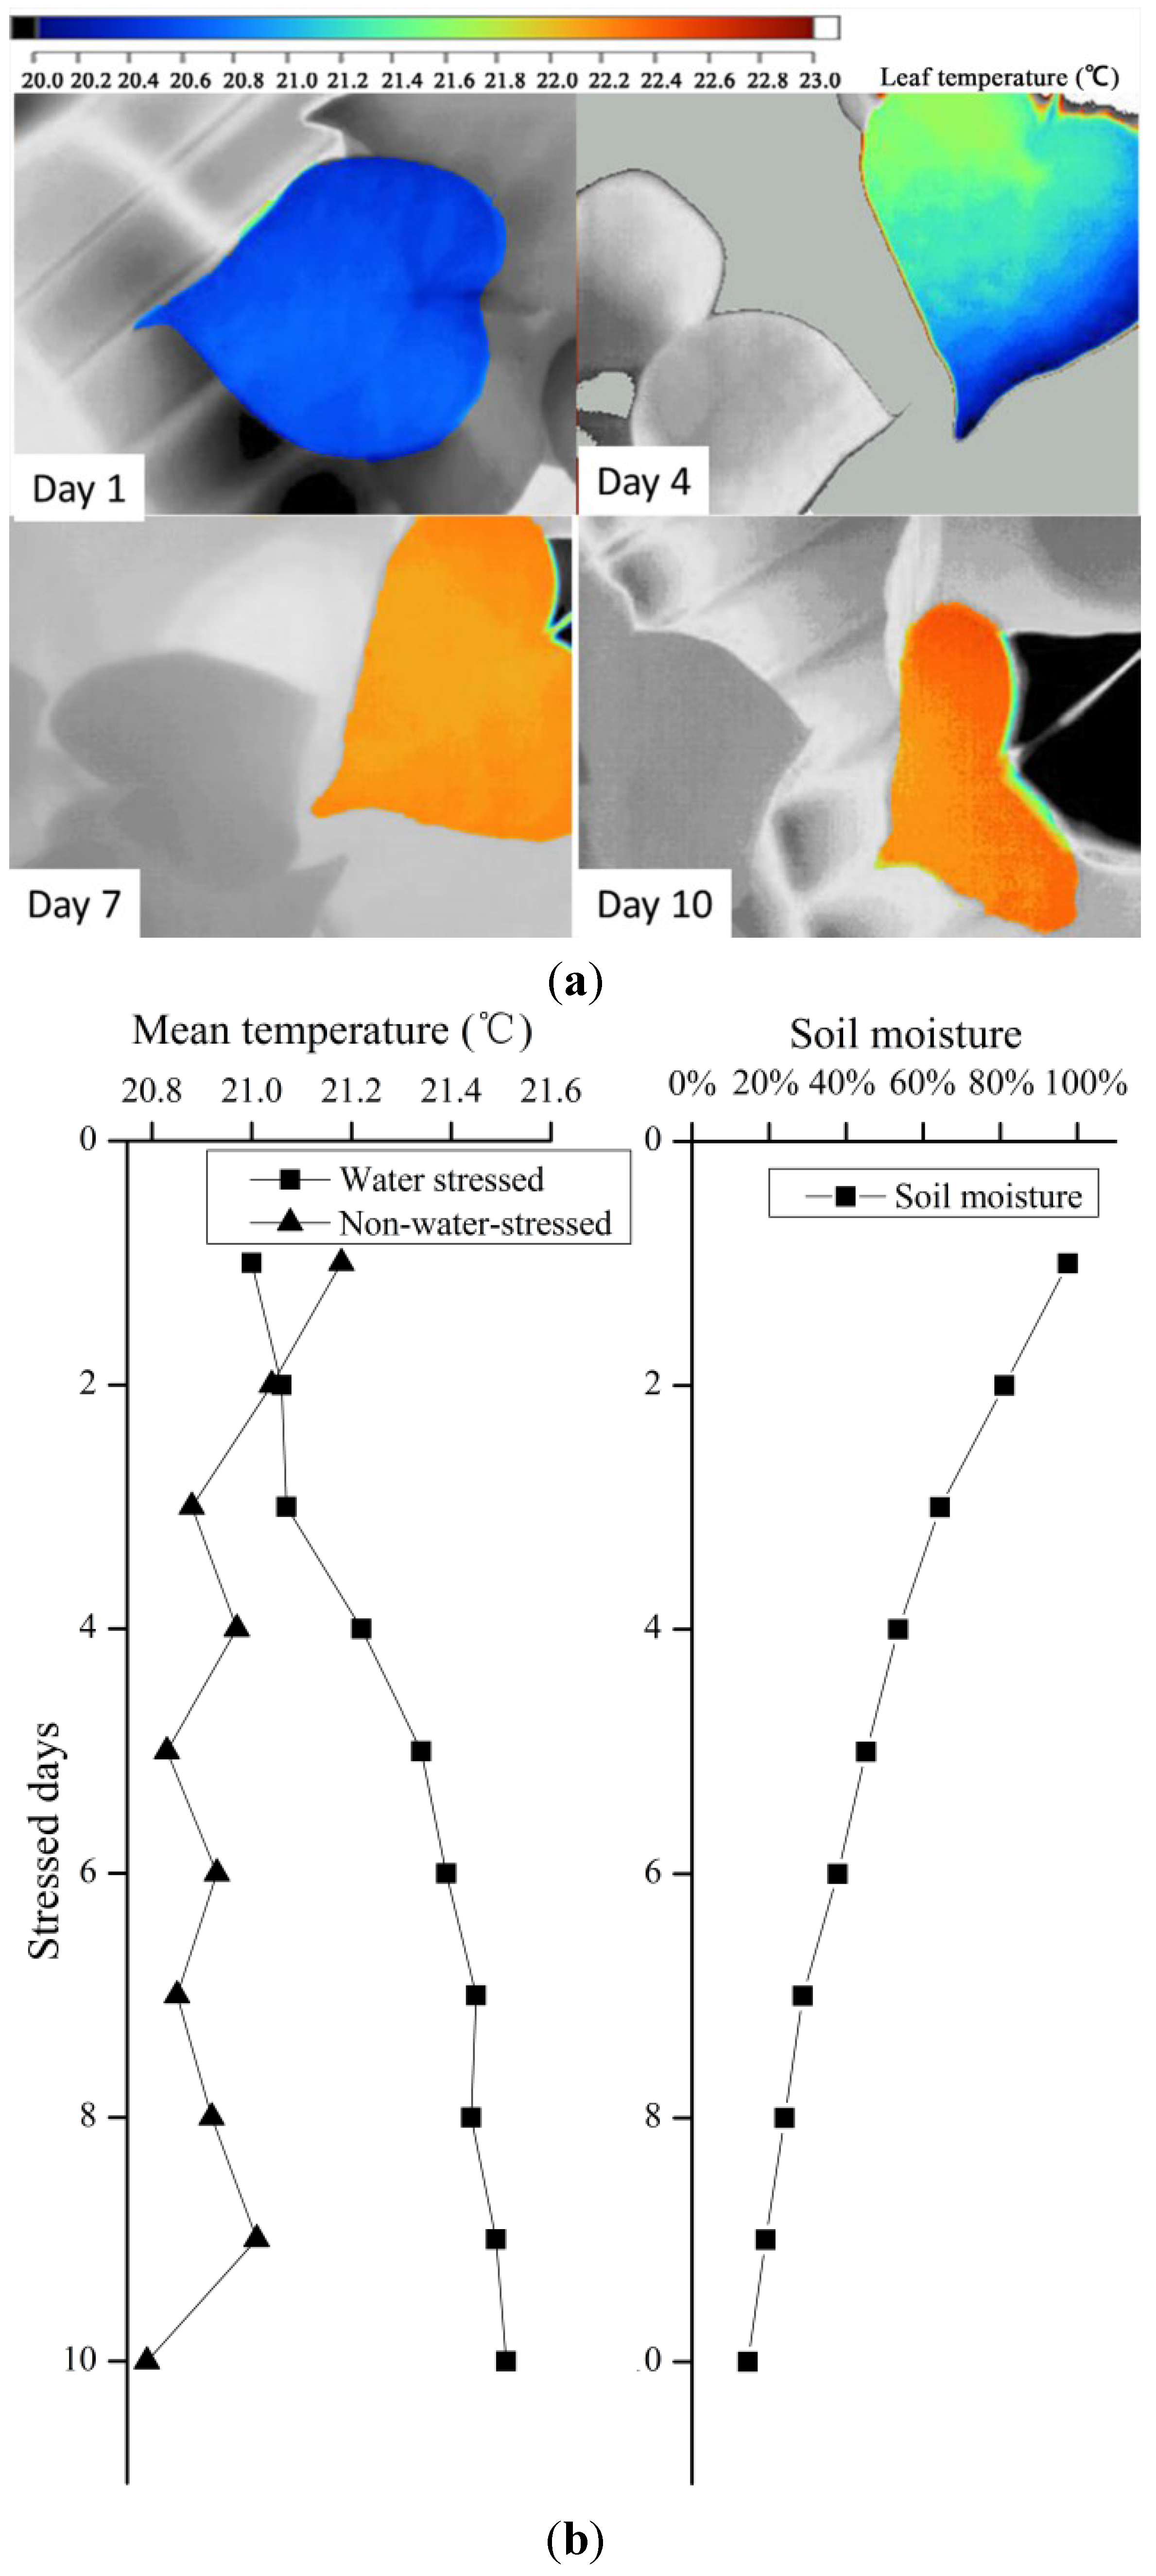
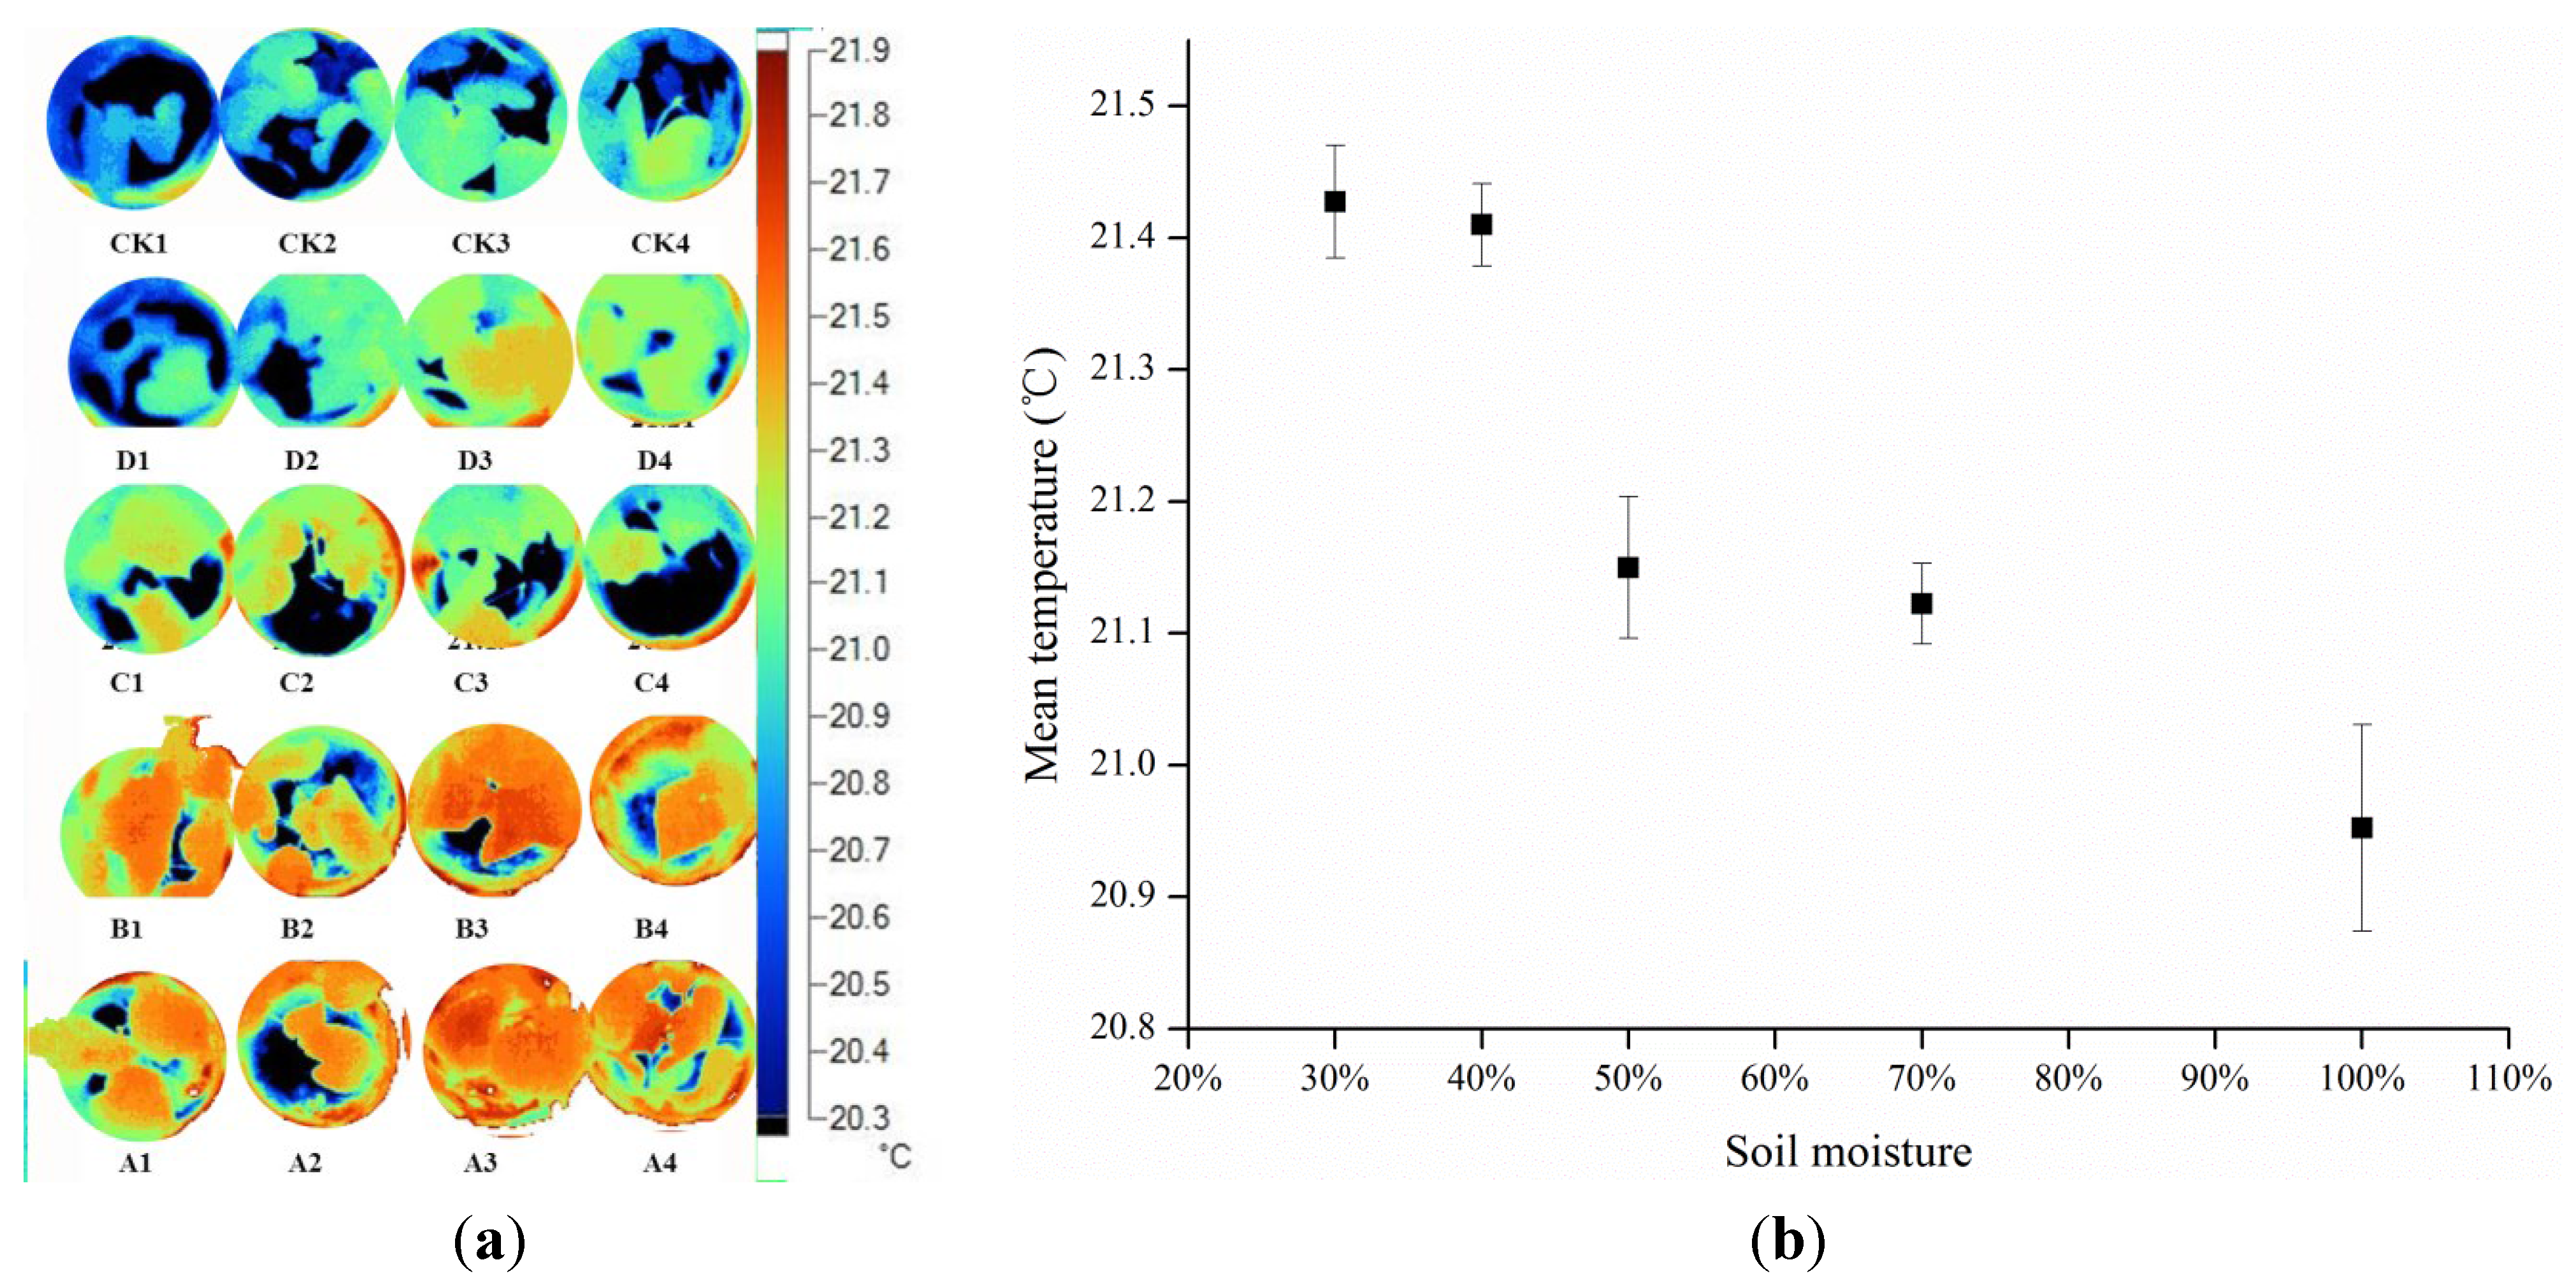
A key aim of this study was to analyze the differences in mean values and variances within thermal images. Surprisingly, the frequencies of canopy and leaves showed statistically significant differences among the treatment groups. The water status of each treatment was identified using both mean temperature data and standard deviations in this study. The temperature variance of stressed leaves was higher than that of the block leaves, with lower temperature at the periphery and higher temperature in the center of the leaf. The phenomenon that variance of the temperature in an individual leaf may be related to two factors: (1) the temperature of the canopy and leaf is not random (Figure 2 and Figure 5), and may be determined by drought stress; and (2) the stomata in the center part of the leaf are partly closed to defend against drought, leading to temperature increases and thus increasing the variance of the temperature in individual leaves.
The results of this study are consistent with Fuchs’s idea that temperature increases as stomata close [25]. In this study there was a clear tendency for temperature variance to be greater for drought stress than full irrigation treatments. This was because stomata in center of leaf partly closes to reduce transpiration, and may in part explain why leaves dry from the edge inwards.
Further empirical data are required to verify these results, but it is possible that the temperature variation, in addition to the absolute temperature, may become a useful index for the estimation of stomatal conductance and reflects the responses of plants to drought stress.

4.2. Relationships among Temperature, Water Status, Stress Indices, and Stomatal Conductance

Leaf temperature, stomatal conductance and stress indices differed significantly between the treatment and block groups, and among the various treatment levels. Stomatal conductance decreased with mean canopy temperature in both the constant and gradient drought stress treatments. Changes in the two calculated stress indices, Ig and CWSI, were significantly associated with changes in water status.
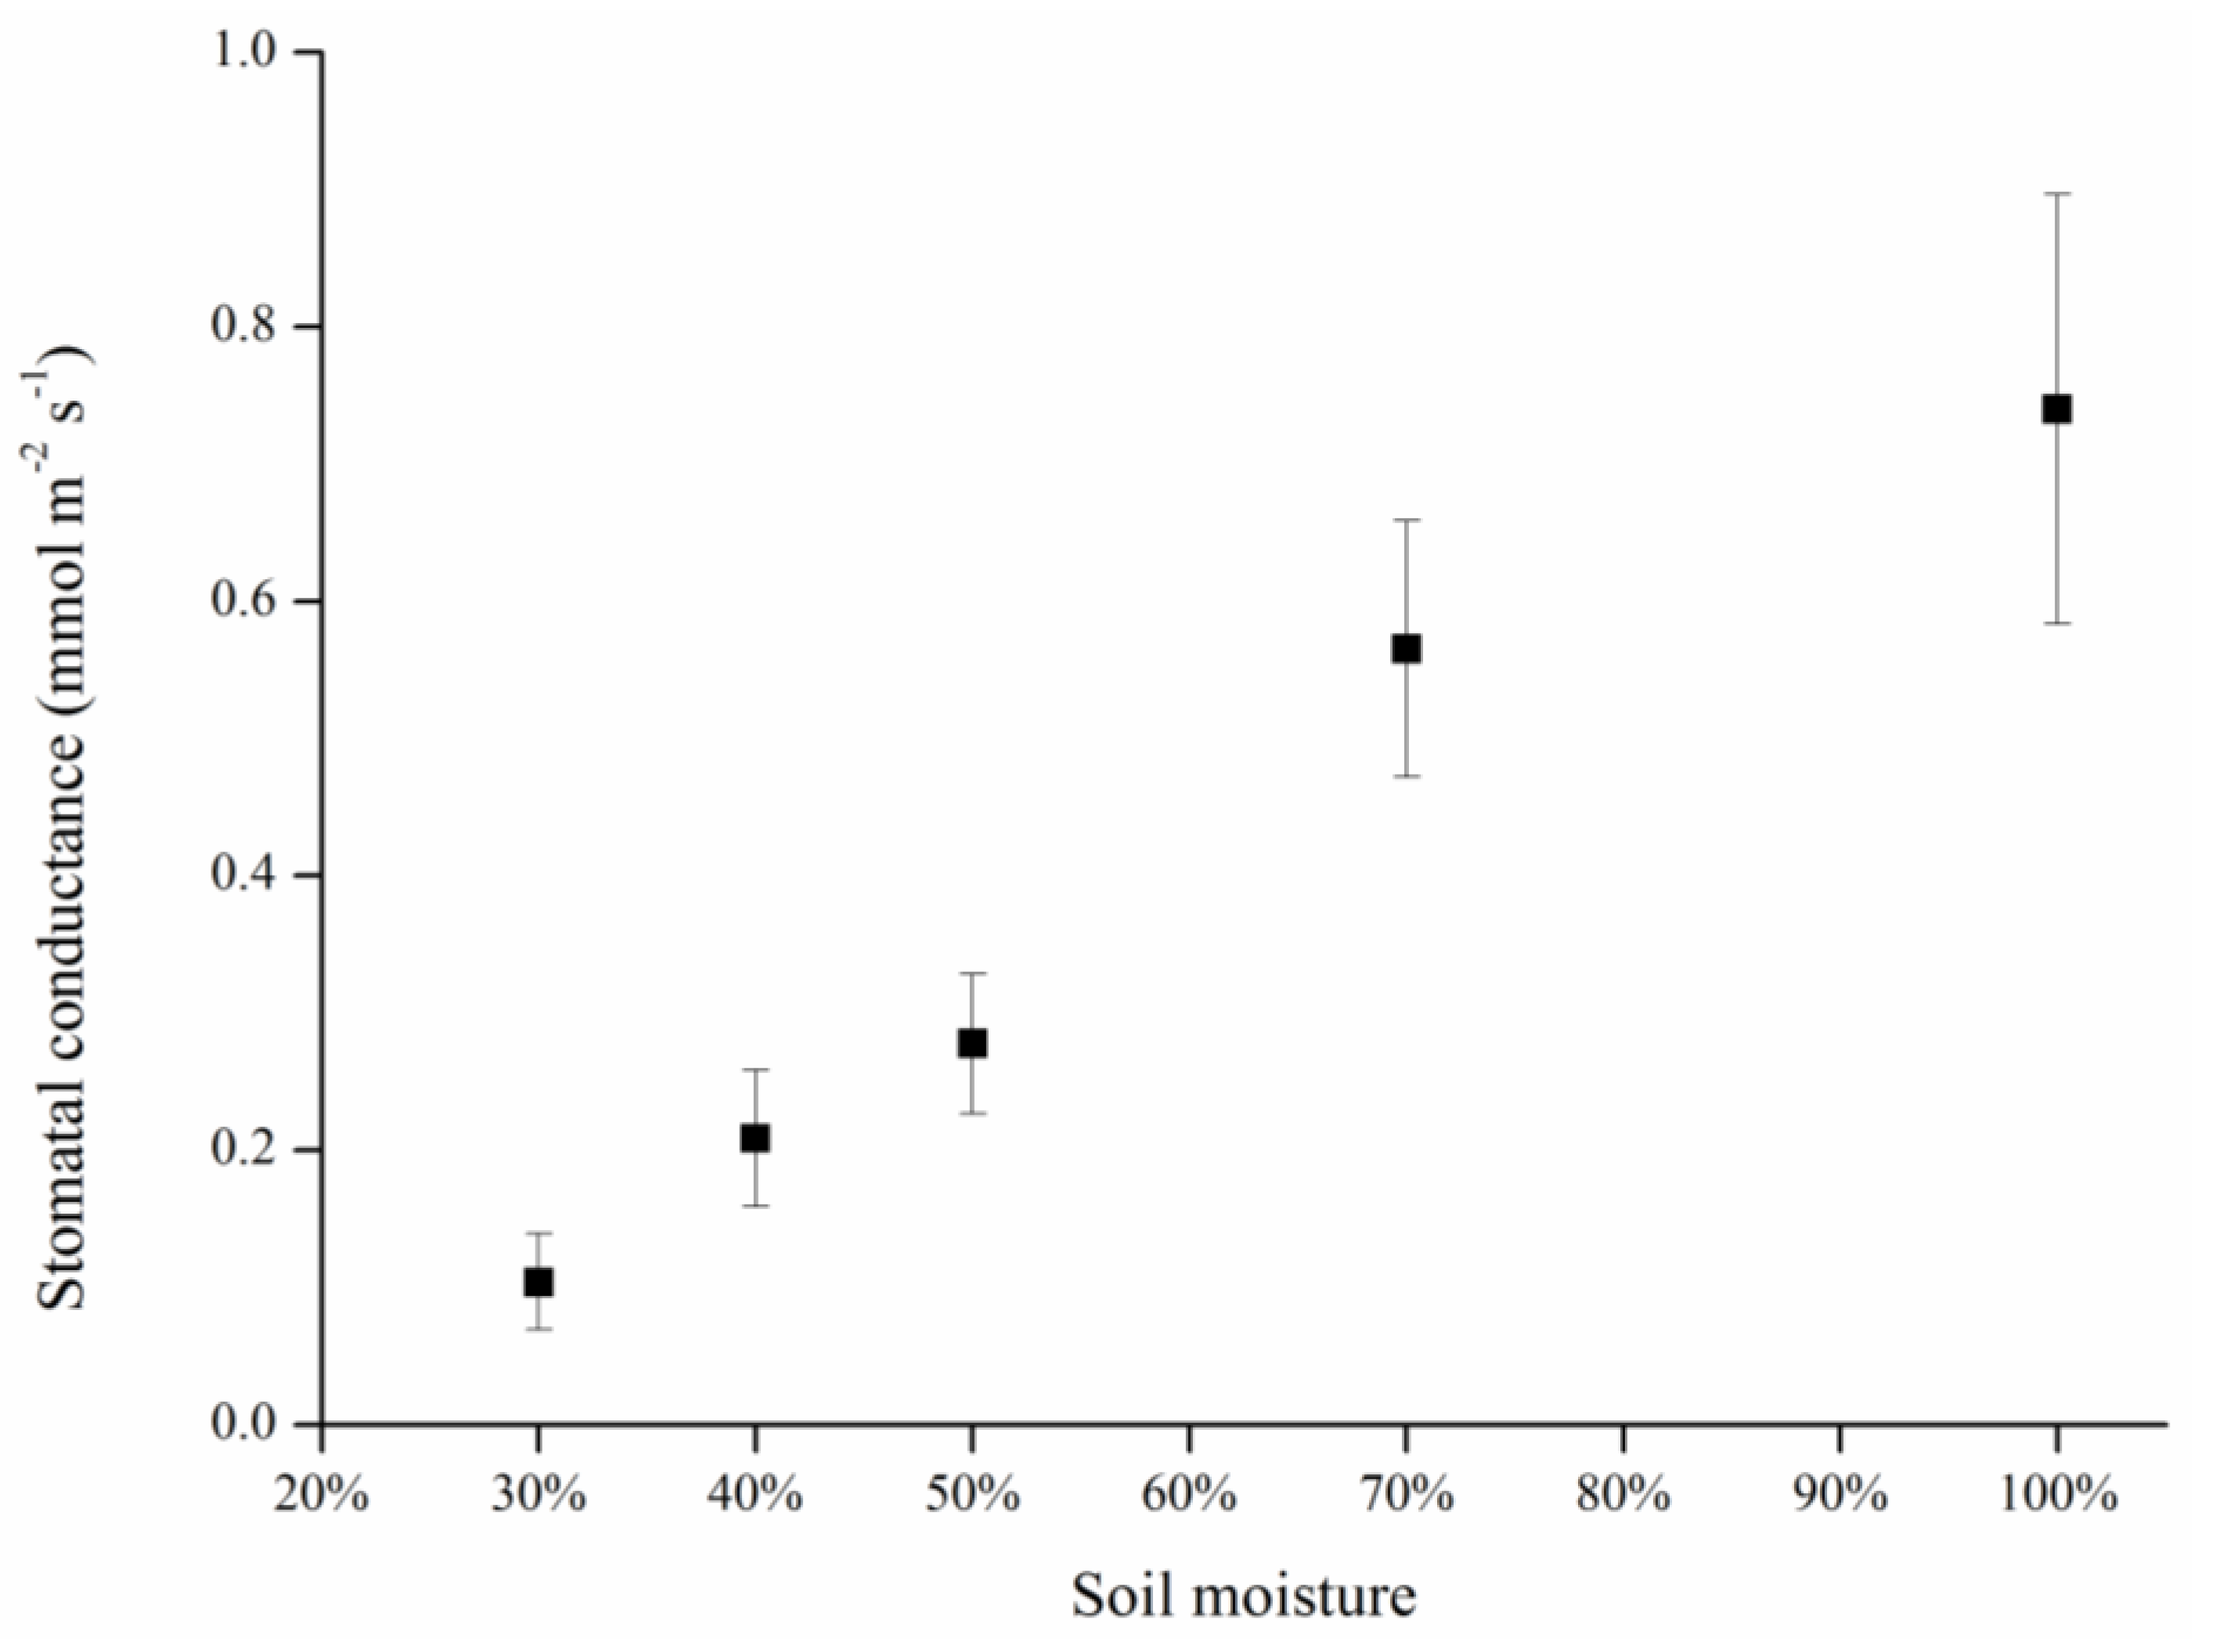
Stomata are sensitive to plant water status, and there is a tendency for stomata to close with decreasing soil moisture; hence, this has been proposed as an indirect measure of stress for improvement of irrigation scheduling. As an indicator of stomata status, stomatal conductance was measured in terms of its relationship with soil moisture (Figure 3 and Figure 6). To avoid drought damage, plants tend to reduce their transpiration rate via stomatal closure. As the leading tissue for transpiration, a decrease in stomatal conductance results in a reduced transpiration rate and decreased transpiration cooling ability. Thus, heat transfer was blocked and the temperature of the canopy or leaves increased, which was reflected in the thermal image. Consequently, in fact, stomata are just channels for transpiration, and leaf temperature changes are based on the heat exchange induced by transpiration substantially, which can be showed as stomatal conductance.
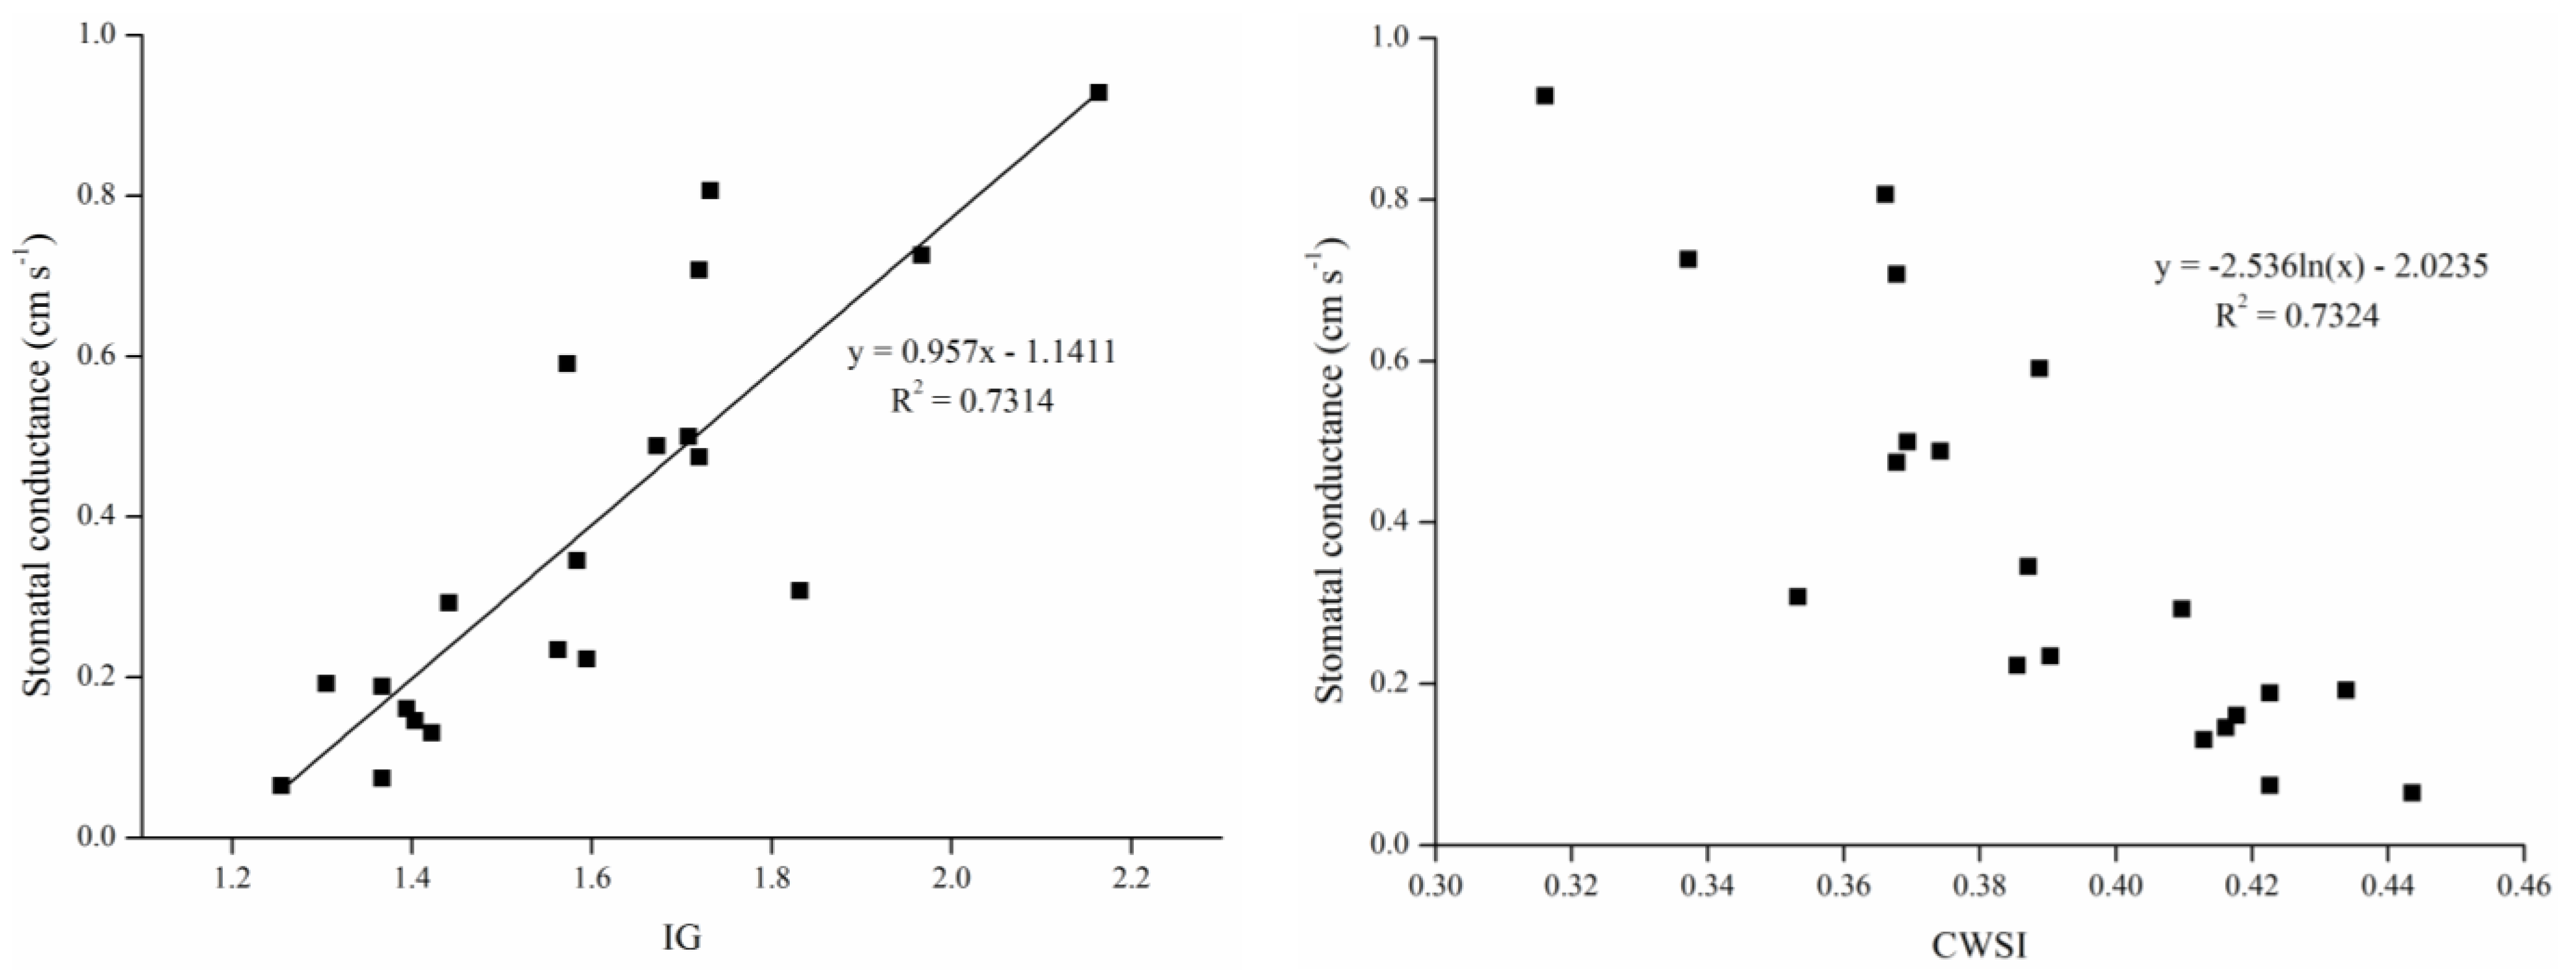
Our results (Figure 7) indicated that the linear correlation between conductance and Ig and the logarithmic relationship between conductance and CWSI were both significant. Given the linear correlation, Ig reflects stomatal conductance more directly, and there was a significant relationship between gs and Ig, with the simulation formula being y = 0.957x − 1.1411. Thus when the Ig is zero, the stomatal conductance is −1.1411; however, Equation (1) shows that relative values of leaf conductance for different surfaces at a given temperature should be zero when the Ig is zero (Tleaf = Tdry), because of the similar thermal properties between real leaves and reference dry leaves in the absence of evaporation [26]. This result isn’t match to the theoretical derivation. This is probably related to the thermal characteristic differences between the reference leaf and the real leaf, and adherent petroleum jelly providing a variant heat capacity and reflectivity. Petroleum jelly should be as thin as possible when making reference leaves.
When applying these thermal indices, it is important to note that they are not direct measures of stress, but only an indicator of stomata status. However, factors other than soil moisture influence stomata (e.g., air humidity, air temperature, etc.). Similarly, leaf temperature can change for reasons other than stomata status (e.g., wind speed and air temperature); in such cases, it is important to identify the causes of stomatal closure and perform calibration to delete interference information (factors other than soil moisture influence stomata) when determine irrigation scheduling using canopy temperature.

4.3. Gradient and Consistent Drought Stress

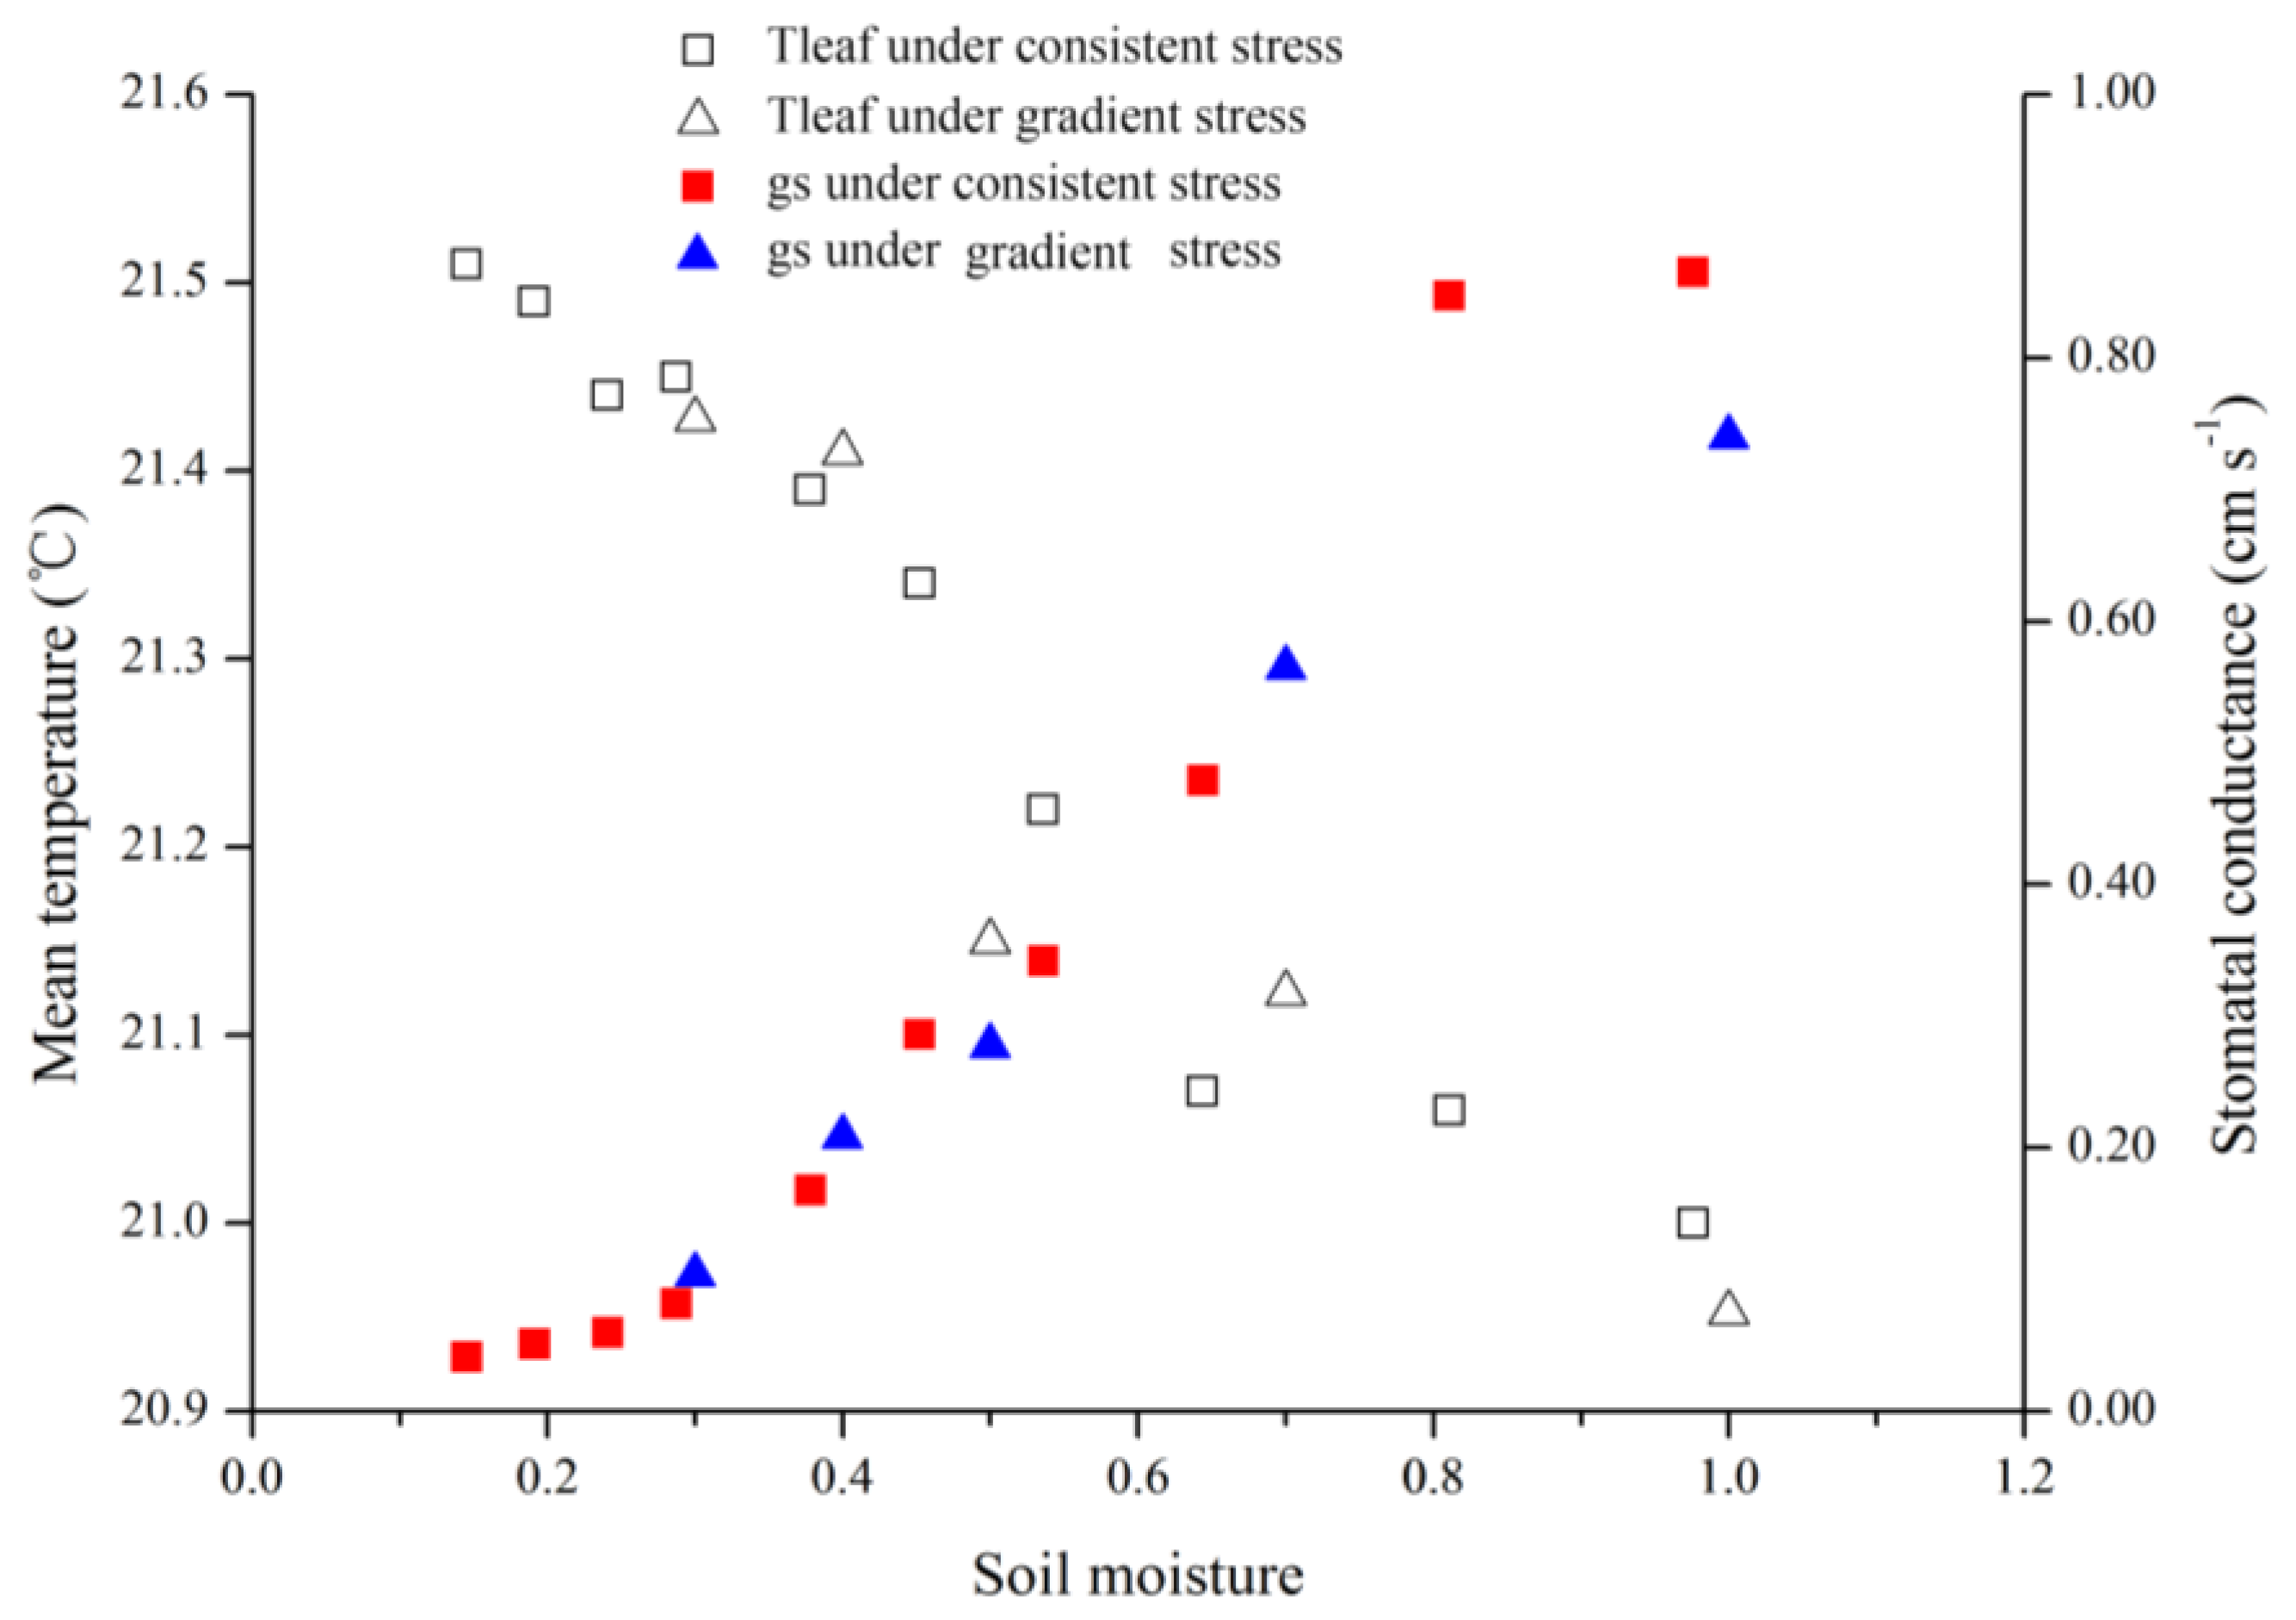
As the results of this study indicated, both gradient- and consistent-drought stress caused leaf stomatal conductance to decrease and canopy temperature to rise. It is important that stomatal and temperature dynamics were related to soil moisture variance, and were similar in both treatments (Figure 8). When fully irrigated, stomatal conductance was approximately 0.87 cm·s−1, and when soil moisture was <30%, stomatal conductance decreased to 0.10 cm·s−1. This indicates that stomatal conductance reflects water status irrespective of long-term water scarcity or lack of sudden rainfall.
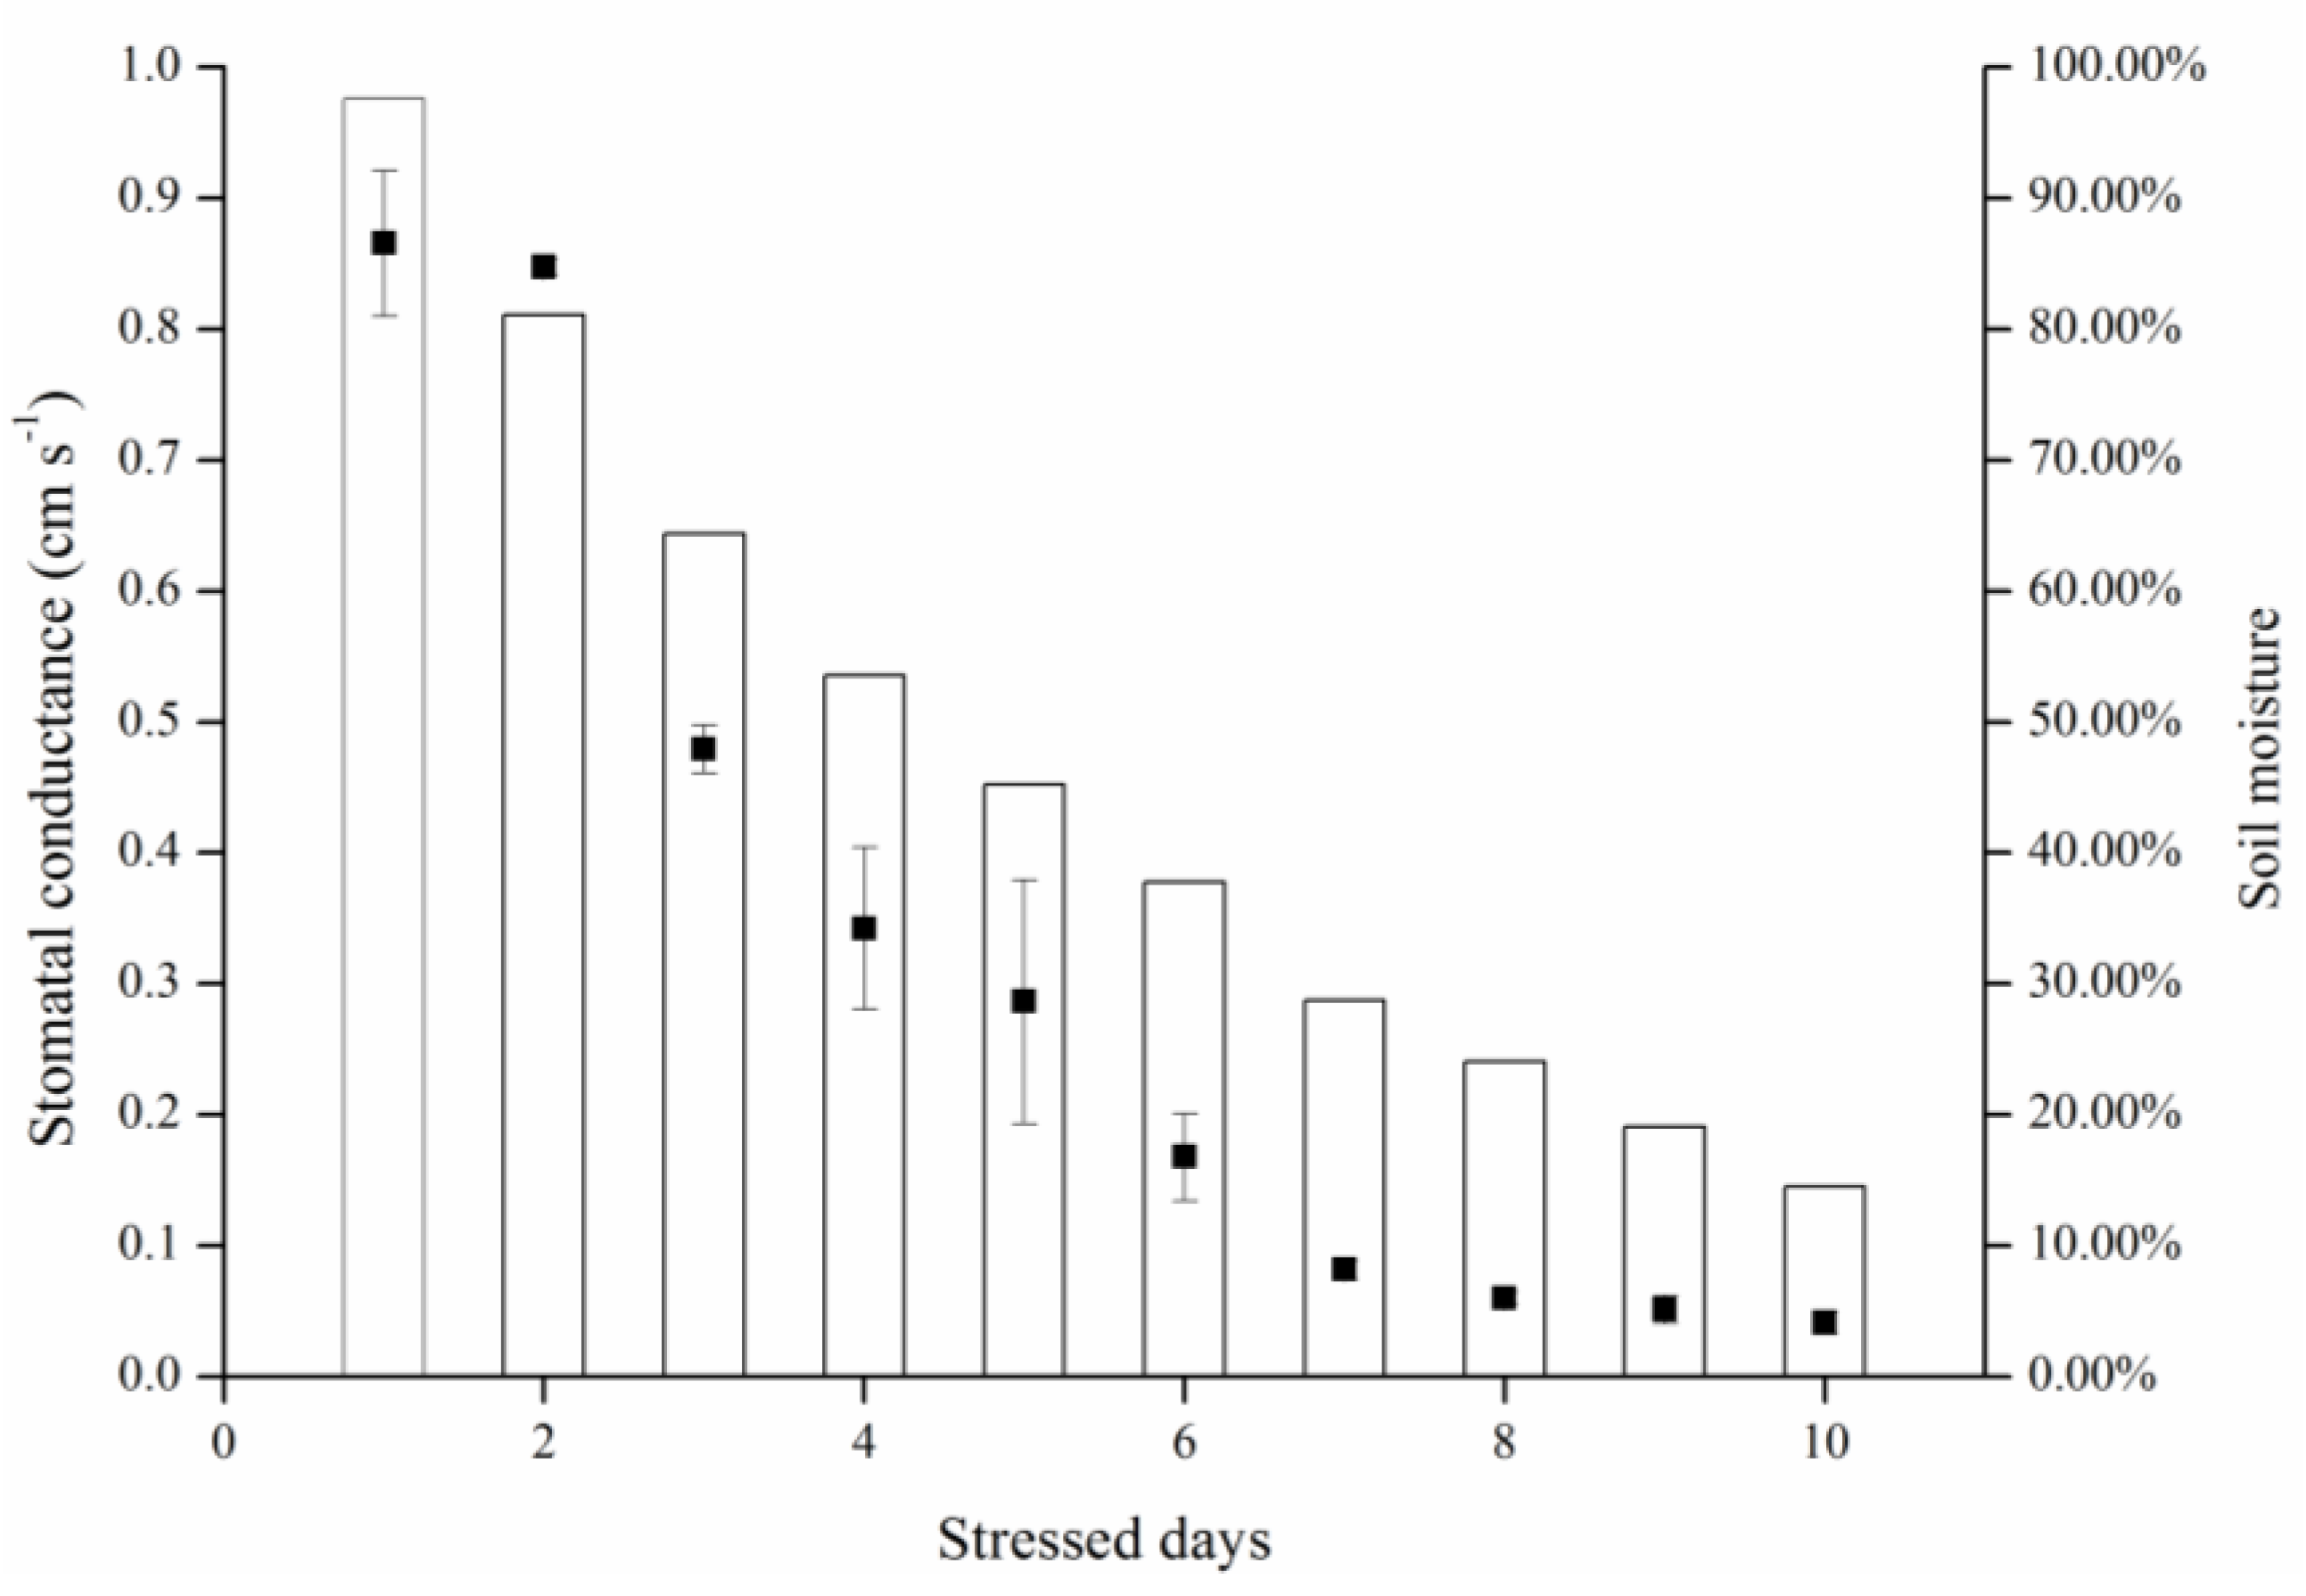
During consistent drought stress conditions, stomatal conductance remains constant in the first 4 days, and decreases beginning on day 5, when the soil moisture content is approximately 60%. On day 8, soil moisture was under 20% and stomatal conductance declined to lower than 0.10 cm·s−1. The stomatal conductance of a particular species has a maximum value; it does not change with soil moisture content when soil moisture exceeds 60% under ambient conditions. Similarly, stomatal conductance became insensitive when soil moisture content was below 20%. Thus, the relationship model (Figure 7) is sensitive in the 20%–60% range of soil moisture. Thermal methods for planning irrigation should be implemented in this range to determine leaf stomatal conductance.
Figure 8. Treatment effects on leaf temperatures (Tleaf) and stomatal conductance (gs) for consistent and gradient drought stress.
Forests 06 03748 g008
Further studies of other species and using different ambient conditions should be conducted to determine the feasibility of thermal imaging to evaluate stomatal and plant stress.

5. Conclusions

In conclusion, this study presented a new method of estimating plant stress status using thermal images, which reflect stomatal conductance. Both the mean and distribution of leaf temperature measured using thermal images were found to be indicators of soil moisture conditions. Compared to traditional measurements, thermal imaging offers a rapid and visual method of determining stomatal conductance and plant stress, which will facilitate refinement of large-scale irrigation scheduling.

Acknowledgments

We thank Yun-Dong Liu (Beijing Forestry University) for his generous help in writing this manuscript. This study was financially supported by the Beijing Excellent Talents Training Project (2014000020124G074).

Author Contributions

Ming-Han Yu, Guo-Dong Ding, and Guang-Lei Gao conceived and designed the study. Guo-Dong Ding, Lei Yan, and Yuan-Yuan Zhao contributed reagents/materials/analysis tools. Ming-Han Yu and Ke Sai performed the experiments. Ming-Han Yu, Guo-Dong Ding, and Guang-Lei Gao contributed to data analysis and paper preparation.

Conflicts of Interest

The authors declare no conflict of interest. The founding sponsors had no role in the design of the study; in the collection, analyses, or interpretation of data; in the writing of the manuscript; or in the decision to publish the results.

References

  1. Allen, C.D.; Macalady, A.K.; Chenchouni, H.; Bachelet, D.; McDowell, N.; Vennetier, M.; Kizberger, T.; Rigling, A.; Breshears, D.D.; Hogg, E.H.; et al. A global overview of drought and heat-induced tree mortality reveals emerging climate change risks for forests. For. Ecol. Manag. 2000, 259, 660–684. [Google Scholar] [CrossRef]
  2. Houghton, J.T.; Ding, Y.; Griggs, D.J.; Noguer, M.; van der Linden, P.J.; Xiaosu, D.; Maskell, K.; Johnson, C.A. Climate Change 2001: The Scientific Basis; Cambridge University Press: Cambridge, UK, 2001. [Google Scholar]
  3. Zimmermann, D.; Reuss, R.; Westhoff, M.; Gessner, P.; Bauer, W.; Bamberg, E.; Bentrup, F.; Zimmermann, U. A novel, non-invasive, online-monitoring, versatile and easy plant-based probe for measuring leaf water status. J. Exp. Bot. 2008, 59, 3157–3167. [Google Scholar] [CrossRef] [PubMed]
  4. Fernandez, J.E.; Rodriguez-Dominguez, C.M.; Perez-Martin, A.; Zimmermann, U.; Ruger, S.; Martin-Palomo, M.J.; Torres-Ruiza, J.M.; Cuevasa, M.V.; Sannb, C.D.; Ehrenberger, W.; et al. Online-monitoring of tree water stress in a hedgerow olive orchard using the leaf patch clamp pressure probe. Agric. Water Manag. 2011, 100, 25–35. [Google Scholar] [CrossRef]
  5. Hopmans, J.W.; Bristow, K.L. Soil and Environmental Analysis, Physical Methods, 2nd ed.; Smith, K.A., Mullins, C.E., Eds.; Marcel Dekker: New York, NY, USA, 2001; Volume 103, pp. 355–357. [Google Scholar]
  6. Collins, M.J.; Fuentes, S.; Barlow, E.W.R. Partial rootzone drying and deficit irrigation increase stomatal sensitivity to vapour pressure deficit in anisohydric grapevines. Funct. Plant Biol. 2010, 37, 128–138. [Google Scholar] [CrossRef]
  7. Kirkham, M.B. Principles of Soil and Plant Water Relations; Elsevier Academic Press: Amsterdam, Holand, 2005. [Google Scholar]
  8. Tari, I. Abaxial and adaxial stomatal density, stomatal conductances and water status of bean primary leaves as affected by paclobutrazol. Biol. Plant. 2003, 47, 215–220. [Google Scholar] [CrossRef]
  9. Jiang, Q.; Roche, D.; Monaco, T.A.; Hole, D. Stomatal conductance is a key parameter to assess limitations to photosynthesis and growth potential in barley genotypes. Plant Biol. 2006, 8, 515–521. [Google Scholar] [CrossRef] [PubMed]
  10. Jones, H.G.; Serraj, R.; Loveys, B.R.; Xiong, L.Z.; Wheaton, A.; Price, A.H. Thermal infrared imaging of crop canopies for the remote diagnosis and quantification of plant responses to water stress in the field. Funct. Plant Biol. 2009, 36, 978–989. [Google Scholar] [CrossRef]
  11. Jones, H.G.; Stoll, M.; Santos, T.; de Sousa, C.; Chaves, M.M.; Grant, O.M. Use of infrared thermography for monitoring stomatal closure in the field: Application to grapevine. J. Exp. Bot. 2002, 53, 2249–2260. [Google Scholar] [CrossRef] [PubMed]
  12. Merlot, S.; Mustilli, A.C.; Genty, B.; North, H.; Lefebvre, V.; Sotta, B.; Vavasseur, A.; Giraudat, J. Use of infrared thermal imaging to isolate Arabidopsis mutants defective in stomatal regulation. Plant J. 2002, 30, 601–609. [Google Scholar] [CrossRef] [PubMed]
  13. Jarvis, P.G.; Mansfield, T.A. Stomatal Physiology; Cambridge University Press: Cambridge, UK, 1981. [Google Scholar]
  14. Leinonen, I.; Jones, H.G. Combining thermal and visible imagery for estimating canopy temperature and identifying plant stress. J. Exp. Bot. 2004, 55, 1423–1431. [Google Scholar] [CrossRef] [PubMed]
  15. Jones, H.G. Plants and Microclimate: A Quantitative Approach to Environmental Plant Physiology; Cambridge University Press: Cambridge, UK, 1983. [Google Scholar]
  16. Grant, O.M.; Tronina, L.; Jones, H.G.; Chaves, M.M. Exploring thermal imaging variables for the detection of stress responses in grapevine under different irrigation regimes. J. Exp. Bot. 2007, 58, 815–825. [Google Scholar] [CrossRef] [PubMed]
  17. Giuliani, R.; Flore, J.A.; Ferreira, M.I.; Jones, H.G. Potential use of infra-red thermometry for the detection of water stress in apple trees. In Proceedings of the Third International Symposium on Irrigation of Horticultural Crops, Estoril (Lisbon), Portugal, 28 June–2 July 1999.
  18. Jones, H.G. Use of infrared thermometry for estimation of stomatal conductance as a possible aid to irrigation scheduling. Agric. For. Meteorol. 1999, 95, 139–149. [Google Scholar] [CrossRef]
  19. Sherwood, B. A set of equations for full spectrum and 8- to 14-μm and 10.5- to 12.5-μm thermal radiation from cloudless skies. Water Resour. Res. 1981, 17, 295–304. [Google Scholar]
  20. Jackson, R.D. Canopy temperature and crop water stress. Adv. Irrig. 1982, 1, 43–85. [Google Scholar]
  21. Richards, J.A. Computer processing of remotely-sensed images: An introduction. Earth-Sci. Rev. 2004, 27, 392–394. [Google Scholar] [CrossRef]
  22. Campbell, J.B. Introduction to Remote Sensing; Taylor and Francis: London, UK, 1996. [Google Scholar]
  23. Corp, L.A.; Mcmurtrey, J.E.; Middleton, E.M.; Mulchi, C.L.; Chappelle, E.W.; Daughtry, C.S.T. Fluorescence sensing systems: In vivo detection of biophysical variations in field corn due to nitrogen supply. Remote Sens. Environ. 2003, 86, 470–479. [Google Scholar] [CrossRef]
  24. Schuerger, A.C.; Capelle, G.A.; di Benedetto, J.A.; Mao, C.Y.; Thai, C.N.; Evans, M.D.; Richards, J.T.; Blank, T.A.; Stryjewski, E.C. Comparison of two hyperspectral imaging and two laser-induced fluorescence instruments for the detection of zinc stress and chlorophyll concentration in bahia grass (Paspalum notatum Flugge.). Remote Sens. Environ. 2003, 84, 572–588. [Google Scholar] [CrossRef]
  25. Fuchs, M. Infrared measurement of canopy temperature and detection of plant water stress. Theor. Appl. Climatol. 1990, 42, 253–261. [Google Scholar] [CrossRef]
  26. Guilioni, L.; Jones, H.G.; Leinonen, I.; Lhomme, J.P. On the relationships between stomatal resistance and leaf temperatures in thermography. Agric. For. Meteorol. 2008, 148, 1908–1912. [Google Scholar] [CrossRef]

