Article

Estimating Values of Carbon Sequestration and Nutrient Recycling in Forests: An Application to the Stockholm-Mälar Region in Sweden

Department of Economics, Swedish University of Agricultural Sciences, Box 7013, 75007 Uppsala, Sweden
Forests 2015, 6(10), 3594-3613; https://doi.org/10.3390/f6103594
Submission received: 15 July 2015 / Revised: 24 September 2015 / Accepted: 29 September 2015 / Published: 13 October 2015
(This article belongs to the Special Issue Ecosystem Services from Forests)

Abstract

:
We calculate values of forest carbon sequestration and nutrient recycling applying the replacement cost method. The value is then determined as the savings in costs by the replacement of more expensive abatement measures with these ecosystem services in cost-effective climate and nutrient programs. To this end, a dynamic optimization model is constructed, which accounts for uncertainty in sequestration. It is applied to the Stockholm-Mälar region in southeast Sweden where the EU 2050 climate policy for carbon emissions and the Baltic Sea action plan for nutrient discharges are applied. The results show that the value of carbon and nutrient sequestration can correspond to approximately 0.5% of the region’s gross domestic product, or 40% of the value of productive forest. The largest part of this value is attributed to carbon sequestration because of the relative stringency in targets and expensive alternative abatement measures. However, sequestration is uncertain because of stochastic weather conditions, and when society has a large risk aversion for not attaining climate and nutrient targets, the values of the forest carbon and nutrient sequestration can approach zero.

1. Introduction

Forests provide a multitude of marketed and non-marketed ecosystem services, where timber outputs provide a marketed service, and biodiversity, pollutant sequestration, and recreational opportunities are examples of non-marketed services. Forest recreational opportunities and biodiversity have been subjected to valuation in monetary terms in several studies, but there are only a few estimates of other ecosystem services, such as carbon sequestration and nutrient recycling (see survey in [1]). The benefits of carbon sequestration and nutrient recycling emerge from their ability to regulate the carbon content in the atmosphere and nutrient leaching at a lower cost than other measures, such as reductions in fossil fuels. Valuation of carbon sequestration for combatting climate change has been carried out at the regional EU and global scale [2,3,4]. However, afforestation (plantation of forest on arable land), which is the least expensive measure for carbon sequestration [5], also implies a reduction in nutrient leaching. Unbalanced nutrient loads can lead to eutrophication of water, as well as increased frequency of harmful algal blooms, sea bottom areas without biological life, toxic cyanobacteria, and decreases in water transparency and populations of commercial fish species [6,7]. There is a complementarity between carbon and nutrient transformations in boreal forests [8], which implies that increases in carbon sequestration reduce nutrient leaching from soil. The purpose of this study is to calculate values of forest carbon sequestration and nutrient recycling in the Stockholm-Mälar region in southeast Sweden. The choice of these services and region is based on the existence of actual targets for carbon and nutrient emissions, and of numerical models allowing for the calculations [9,10].
To the best of our knowledge, there are no published studies that calculate the value of a forest’s ecosystem services in terms of carbon and nutrient sequestration. On the other hand, there is a relatively large body of literature calculating the value of especially carbon sequestration [2,3,4]. There are also a relatively large number of studies on the value of nutrient sequestration by wetlands and coastal ecosystems [11,12,13,14], but not on forest ecosystem nutrient sequestration. Similar to these studies, we apply the so-called replacement cost method for calculating values. The basis for this method is the existence of environmental targets, and the value of a new technology is then measured as the decrease in total costs associated with achieving these targets when the technology is included as a measure. It has then been shown that inclusion of forest carbon sequestration can reduce the total cost of achieving the global target of a maximum of 550 ppmv (parts per million by volume) by 40% [15,16] and the EU 2020 climate target of reducing emissions to 20% from the 1990 emission level in 2020 by 30% [3].
However, pollutant sequestration may have a cost disadvantage when considering uncertainty. Uncertainty arises from stochastic weather conditions, which affect biomass growth, and thereby carbon sequestration and the release of carbon and nutrients from soil. This, in turn, implies uncertainty in reaching stipulated targets, which constitutes a cost associated with this risk. Such costs have been calculated, where cost per unit pollutant sequestration is increased by a risk discount [4,17,18,19]. The calculation of this is, in turn, based on the so-called safety-first principle, which has a long tradition in economics [20]. It is then assumed that decision makers are risk averse against non-attainment of stipulated environmental targets, and the risk discount is determined by this risk aversion and the variability in sequestration. As shown by [4] and [21], the value of forest carbon sequestration in the EU 2020 climate policy is reduced and can approach zero for high levels of the risk aversion.
The current study calculates the value of forest pollutant sequestration with and without uncertainty when we apply the safety-first principle. To this end, we construct a dynamic optimization model with uncertainty, which, in addition to pollutant sequestration, includes abatement measures reducing emissions from fossil fuels and nutrient leaching. A dynamic model is needed because of the focus on future climate and nutrient targets, as well as consideration of depreciation in investment in renewable technologies and nutrient cleaning facilities, and development over time of carbon sequestration in afforested land. In our view, the main contribution of this study is the calculation of values of forest sequestration of several pollutants. Another is the consideration of uncertainty, and a third is the calculation of values of forest nutrient recycling, which have been made mainly for wetlands in other studies.
The study is organized as follows. The conceptual approach and the dynamic optimization model are presented in Section 2. Next, data retrieval is shown in Section 3, and the results are presented in Section 4. The results are discussed in Section 5, and the study ends with concluding comments.

2. Conceptual Framework and Cost-Minimizing Model

The replacement cost method assigns a value to a cleaning technology only if this technology is less costly than other abatement measures for reaching certain emission targets in a cost effective solution. The cost effective solutions are, in turn, determined by a numerical model for minimizing total costs of achieving carbon and nutrient emission targets in a certain time and space. The construction of such a model is thus crucial for the determination of the value of forest ecosystem services in terms of carbon and nutrient sequestration. In the following, we therefore first provide a more intuitive presentation of the replacement cost method, which is followed by a description of the structure of the cost effectiveness model that is used to derive conditions for a positive value of forest carbon and nutrient sequestration and the magnitude of this value.

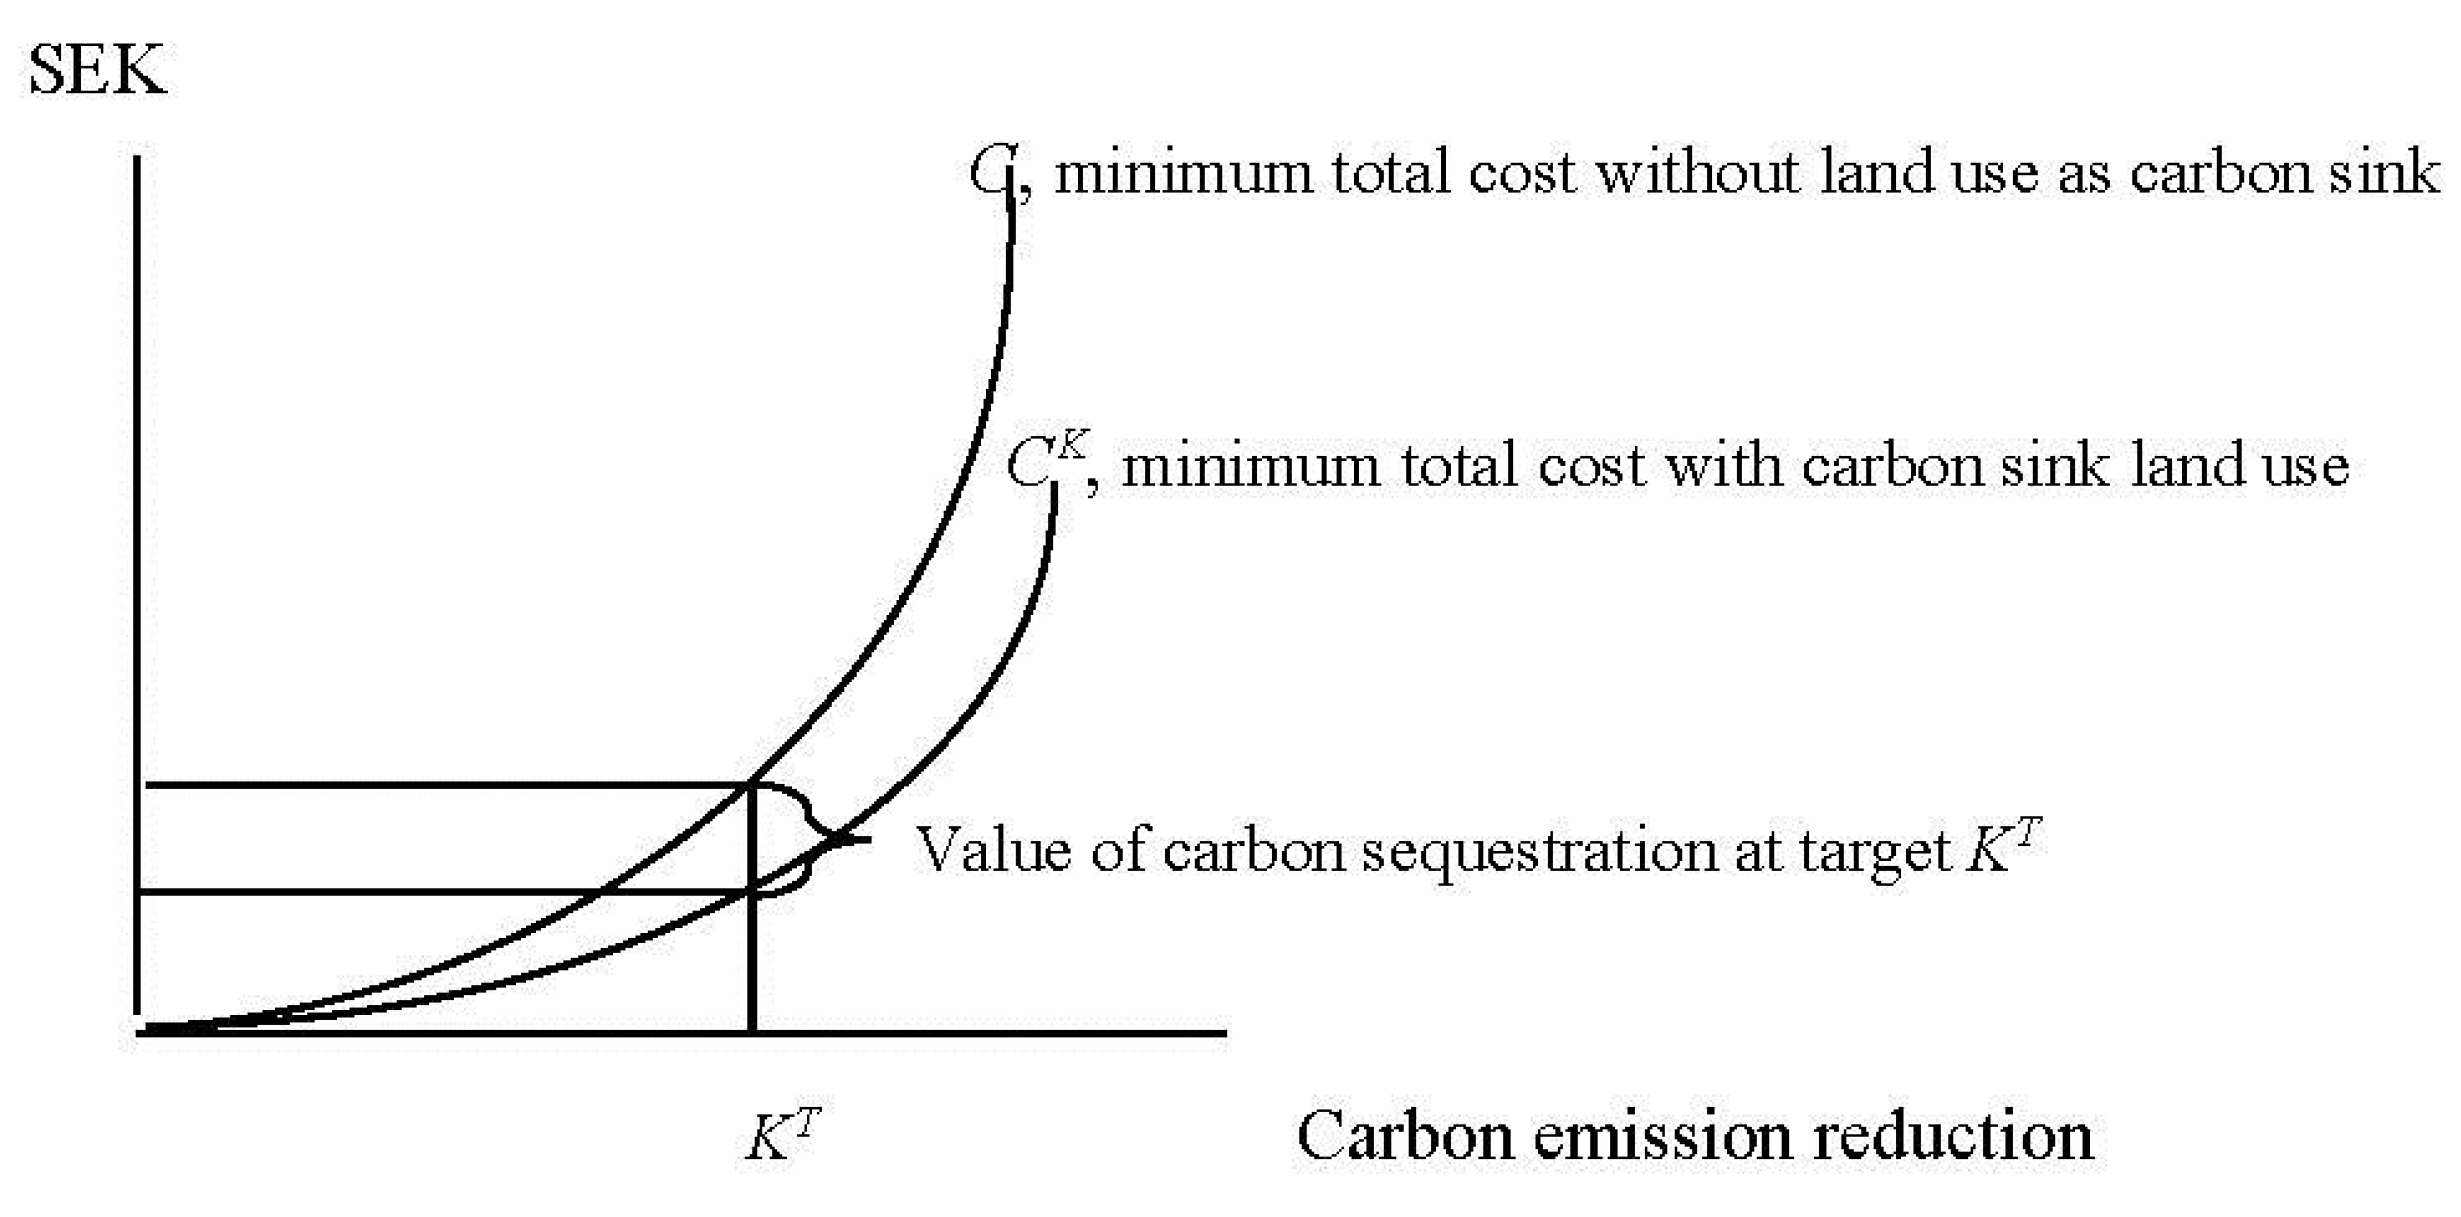
2.1. Conceptual Framework of the Replacement Cost Method

The value of the services of land use in terms of carbon and nutrient sequestration is determined by their cost in relation to the costs of other abatement measures in a cost effective achievement of certain emission targets. The higher the cost of other abatement measures, the larger is the value of the ecosystem service. This simple principle for determining value is illustrated in Figure 1 for carbon sequestration.
Figure 1. Illustration of the calculation of the value of land use as a carbon sink in a cost effectiveness framework. SEK: Swedish crown; KT: carbon emission reduction target.
Forests 06 03594 g001
The horizontal axis illustrates carbon emission reductions, and KT is the target to be achieved. The vertical axis shows the cleaning cost for different emission reduction levels. The curve C illustrates the minimum costs for achieving different emission reduction targets when the carbon sink provided by forests is not included as an abatement option in the cleaning program, and CK illustrates the minimum costs when the carbon sink is included. Each point on C and CK respectively reflects the allocation of all abatement measures that reach the target at minimum cost.
The value of carbon sequestration at the target KT is now determined by the difference in total minimum costs with and without carbon sequestration, which corresponds to the distance C-CK in Figure 1. The value of the carbon sink is then determined by its construction cost and the abatement costs of other measures. The larger the difference between the abatement costs of other measures and that of the carbon sink, the higher the value of the carbon sink. This is, in turn, determined by the stringency in the carbon target since the costs of all abatement measures increase at higher emission reduction levels.
The value of land use for nutrient sequestration is calculated in the same way as for carbon sequestration. However, the value of both these sequestration options depends on whether carbon and nutrient targets are managed separately or simultaneously. When managed separately without consideration of the other pollutant target, the full cost of land use will be borne by the reduction in the pollutant in question. Under simultaneous management, land use measures will have a cost advantage compared with measures affecting only one pollutant and will therefore be implemented to a larger extent than under separate target management.

2.2. Description of the Dynamic Cost Minimizing Model

The model used for calculating the value illustrated in Figure 1 builds on the dynamic model developed by [10], and adds water emission targets. Cost effectiveness is then defined as the allocation of abatement measures over time and at different locations, which reaches predetermined targets in a specific time at minimum costs. The location of carbon emission reductions and sequestration do not affect the impact on the atmosphere. This is in contrast to nutrient abatement and sequestration, where the location matters for the impact on the coastal waters because of the retention of nutrients from the source to the waters. We therefore divide the region into m = 1,..,n drainage basins.
In each time period t, the net business as usual (BAU) emission of pollutant p, where p is carbon dioxide equivalents (CO2e), nitrogen (N), and phosphorus (P), in drainage basin m is determined by the emission of sources minus existing sequestration, X t p m B A U . These emissions can be reduced by decreases in the pollution at the emission sources, a p m f   A t p m f where f = 1,..,l are the different types of sources such as energy production, agriculture, and transport, and apm is the impact on the target. This is unity for CO2e reductions since location of source does not matter for the impact, but 0 < apm ≤ 1 for nutrient since some sources are located in upstream drainage basins where the effect is below unity. For emission sources located at coastal waters, such as sewage treatment plants, the discharge reduction at the source is the same as the load reduction to the sea, which implies that apm = 1. Annual reductions in CO2e are also obtained by existing renewable technologies, A t p m r , where r = 1,..,q technologies. These are obtained from investments, I t m r , which have a maximum technological life time, and are then regarded as capital investments subject to depreciation according to
A t p m r = τ   ( 1 δ r ) t τ a p m r I τ m r
where apmr is the reduction in pollutant p of one unit abatement by technology r, and 0 < δr < 1 is the annual depreciation rate of technology r. Abatement by means of a renewable technology r in time t is thus determined by the accumulated number of investments prior to t, and investment in period t.
The third abatement option is the creation of the carbon and nutrient sink, L t m s , which can be formed by afforestation. However, it may take some time before the full potential of the sink is achieved. This growth depends on biomass growth and soil processes, which, in turn, are determined by type of land use change. Since there are few data on these processes, we assign a simple function where the rate of growth, δs, is constant over time and carbon and nutrient sequestration achieve a maximum. Recall that the pollutant sink in each time period is subject to stochastic weather conditions. We therefore assign the carbon and nutrient sink in a given period t, A t p m s , as dependent of land use changes in prior periods, L τ m s , and an additive stochastic parameter, ε t p m s , which is written as
A t p m s = τ   ( 1 ( 1 δ s ) t τ ) a p m q p m r L τ m s + ε t p m s
where qpms is the maximum sequestration per unit of land area of pollutant p. The larger the t − τ value, the higher the A t p m s for a given L τ m s . Similar to renewable technologies, total pollutant sink in a municipality is then determined by the accumulated carbon sink additions. The difference is that sink capacity is increasing and capacities of renewable technologies are decreasing over time.
Total net emissions of each pollutant, X t p are then the sum of emissions in BAU minus emission reduction obtained by the three classes of measures in each drainage basin:
X t p = m   ( X p m B A U f   A t p m f r   A t p m r s   A t p m s )
The exercise of each abatement measure is subject to a cost, which is described by the cost functions C p m f ( A t p m f ) , C p m r ( I t p m r ) and , C p m s ( L t p m s ) which are assumed to be increasing and convex in their arguments, i.e., costs are increasing at a higher rate in the use of the measure.
Additional assumptions are that abatement in each period is subject to restrictions where only part, bf, of the BAU emissions can be reduced, part of total emissions from fossil fuel or nutrient use can be replaced by a specific technology energy, br, in each period, and that part of agriculture land under BAU, bs, can be converted into forests in each period. The reasons for these restrictions are that drastic reductions in emissions and land use are difficult to implement in a very short time period. The capacity restrictions are then written as
A t p m f b f X p m f B A U
I t y m r b r f   X p m f B A U
L t y m s b s L y m s B A U
The decision maker at the Stockholm-Mälar region is now assumed to apply a safety-first approach in reaching targets on total emission where they formulate a minimum probability or reliability level, αp, of achieving the maximum emission target, T ¯ t p , for each pollutant, which is written as
p r o b ( m   X t p m T ¯ t p ) a p
This can be expressed in terms of mean emissions or leaching, μ T p p , risk aversion, ϕ a p , and variance in loads σ T p p as [22]
μ t p + φ a p ( σ t p ) 1 / 2 T ¯ t p
where μ t p = E [ X t p ] with E as expectation operator; ϕ a p shows the choice of αp as the acceptable deviation of the load from the mean. The level of ϕ a p depends on the shape of the probability distribution, which is discussed in Section 3. The left hand side of Equation (8) thus shows that reliability in achieving the target is obtained at a cost, which increases with reliability concern or the probability of achieving the target, i.e., in ϕ a p , and in σ t p .
Recall from Section 2.1 that the value of L τ m s is calculated as the difference in cost for achieving the targets in Equation (7) with and without the inclusion of L τ m s as an abatement option. Given Equations (1)–(8), the decision maker is then assumed to choose among available options, A t p m f and I t m r , or A t p m f , I t m r , and L τ m s , in order to minimize total cost in present terms for achieving the carbon emission and nutrient leaching targets. When all options are available, this is written as
M i n C = t   m   ( f   C m f ( A t m f ) + r   C t m r ( A t m r ) + s   C t m s ( L t m s ) ) ρ t
s.t. Equations (1)–(9)
where ρ t = 1 ( 1 + i ) t with i as the discount rate.

2.3. Determinants of the Value of Carbon and Nutrient Sink in Forests

The determinants of the magnitude of the value of forests as pollutant sinks can be found by solving for the decision problem in Equation (9). We solve for the cost effective solution by formulating the Lagrange expression, L, which is written as
L = C + p   ( λ T p ( T ¯ p μ T p p φ a p ( σ p T ) 1 / 2 ) + m ( f   γ t p m f ( b f X p m f B A U a p m f A t m f ) ) + r   γ p m r ( b r X p m f B A U a p m r I t m r ) + s   γ p m s ( b s L m s B A U L t m s ) ) )
where λ T p 0 is the Lagrange multiplier for the targets, and γ p m f 0 , γ p m r 0 , and γ p m s 0 are those for the different capacity constraints on abatement measures. The Lagrange multipliers have an interesting interpretation; they provide information on the change in total discounted minimum cost for a relaxation of the constraint. For example, a relaxation of the carbon emission target in 2050 by one unit will decrease the cost corresponding to λ T p 0 where p is CO2e.
We derive the conditions for a positive value from the first-order condition of a cost-effective solution, i.e., the marginal abatement cost for obtaining a unit reduction in the targets shall be equal for the dynamic and spatial allocation for all measures and equal to λ T p p . For ease of exposition but without loss of generality, we assume interior solutions where the capacity constraints are not binding. The first-order conditions for the cost effective solution are then written as
ρ t C t m f A t m f = p   λ T p p a p m f
ρ t C t m r I t m r = p   λ T p p t   a p m r ( 1 δ p r ) T p t
ρ t C t p m s L t m s = p   λ T p p t   ( a p m s q p m s φ a p 2 σ t p m s L t m s ) ( 1 ( 1 δ p s ) T p t )
All three conditions state that the marginal abatement cost in the present value, i.e., the discount factor times the marginal cost, on the left hand side shall equal the weighted sum of marginal impacts on the different targets on the right hand side. The Lagrange multipliers, λ T p p , constitute the weights that reflect the marginal cost of changing the respective target by one unit. A measure has a cost advantage for a relatively low marginal abatement cost and high weighted impact.
Starting by comparing the cost of abatement of sources and investments in renewable energy and nutrient cleaning, i.e., Equations (11) and (12), we can see that investment has a marginal cost advantage for a low depreciation rate, δ p r , and long time period, Tp − t, when the marginal decrease in investment, apmr, acts. Next we compare the marginal cost of reaching the target by investment in cleaning technologies with increased forest area, i.e., Equations (12) and (13). Disregarding uncertainty for the moment, we can then see that the larger the pollutant sink per area of land, apmsqpms, the higher the impact on the respective target. This is also the case for the accumulated sink over time, ( 1 ( 1   δ p m s ) T p t ) which is increasing because of the growth of the planted forest trees. A comparative advantage with pollutant sink compared with investment in renewable energy and nutrient cleaning is then the growth over time in the sink capacity, instead of a decline, which needs replacement of new technology when the old is worn out. This cost advantage is counteracted when we consider the uncertainty term, φ a p 2 σ t p m s L t m s , which instead reduces the marginal impact when uncertainty in the pollutant sink is increasing in the area of afforestation and, hence, increases the marginal cost for reaching the target.
We can also note that the marginal impact increases for all three types of measures when more than one target is affected. A marginal increase in the forest area, which affects all three targets, then has a cost advantage when the other measures affect only one or two targets. The relative advantage of growth in sink per unit of land is then enhanced. On the other hand, the disadvantage of the uncertainty discount is also increased. When the advantages exceed the disadvantages, the value of the services is also determined by simultaneous or separate management of the targets. In practice, each pollutant target is treated separately, at least in Sweden. This means that the advantages of multifunctional measures are not fully utilized since their cost advantages of impacts of several targets are not accounted for.
Based on this simple dynamic model with uncertainty in carbon and nutrient sinks, we can thus conclude that investment in forest ecosystem services has an advantage over other abatement and investment measures when
-
the cost of forest plantations is relatively low
-
the weighted marginal impact of forest on carbon and nutrient sequestration is high
-
the annual growth in sink capacity and depreciation of investment in other technologies are large
-
the uncertainty discount of the pollutant sink is low
-
the management of all targets occurs simultaneously instead of separately
As will be shown in the following, these factors can have a considerable effect on the calculated value of afforestation in the Stockholm-Mälar region.

3. Data Retrieval

The theoretical model presented in Section 2 shows that we need data on pollutant emissions from all sources under BAU, abatement capacities and impacts on targets of different measures, cost functions for all measures, depreciation rates of investment in cleaning technologies, growth rates of pollutant sinks, variance in pollutant sink, risk aversion, and discount rate. All data are obtained from two existing cost minimizing models of the Stockholm-Mälar region. One is a dynamic model for achieving 80% reduction in carbon emission from the 1990 emission level by 2050 [10] and the other is a static model for achieving nutrient targets in the coastal area of the region [9]. Detailed documentations of the data retrieval are found in [9,10]. In the following, we therefore give a brief summary of these data items.

3.1. Carbon Emission and Nutrient Leaching

The Stockholm-Stockholm-Mälar region covers an area of approximately 34,000 km2. Two thirds of the area, or 22,000 km2, is covered by forests and 6400 km2 by arable land. The region contains the capital of Sweden, Stockholm, and 50% of the total Swedish population of 9.5 million people. Sweden and hence the Stockholm-Mälar region is guided by two international commitments; the EU climate policy [23] and the Baltic Sea Section Plan (BSAP) [24]. According to the EU 2050 climate policy, the CO2e emissions should be reduced by 80% from the emission level in 1990, to be reached by 2050, and the BSAP envisages different reductions for the marine basins of the Baltic Sea. The Stockholm-Mälar region is located at the coastal zone of the marine basins with the highest target stringency, i.e., the Baltic Proper, where the requirements are 23% nitrogen and 61% phosphorus reductions.
When calculating leaching of nitrogen and phosphorus to the Baltic Proper, retention of nutrients during the transport from the emission sources located upstream in the drainage basins are deducted since they do not reach the sea. All sources located at the coastal waters, mainly sewage treatment plants and industry, have direct discharges into the Baltic Proper. The numerical model includes 36 drainage basins in the Stockholm-Mälar region with retention rates, i.e., the share of nutrient emission that does not reach the sea, ranging between 0 and 0.9 [9]. A minor part of the nitrogen deposition originates from air-borne emissions from fossil fuel combustion in the Stockholm-Mälar region (Table 1).
Table 1. Carbon dioxide equivalent (CO2e) emissions, and nitrogen (N) and phosphorus (P) leaching from different sources in the Stockholm-Mälar region into the Baltic Proper.
N, ton aP, ton aCO2e Emission , kton bCO2e Sequestration kton b
Forest land77319 3531
Arable land1825156840
Sewage treatment plants561394
Transport82 5451
Industry23 1527
Energy production70 4688
Other CO2e sources 1677
Total8386269141833531
Targets c,d64571053438
a [9]; b [10]; c Targets for N and P are 77% of N and 39% of P loads in 2008 but without target year [24]; d Target for CO2e is 20% of 1990 emission to be reached by 2050 [23].
Arable land and sewage treatment plants are the largest sources of nutrients, and transport and energy production are the major sources of CO2e emission. Existing forest carbon sequestration corresponds to 25% of total emission.

3.2. Abatement Measures and Costs

In addition to afforestation, we include reductions in the use of fossil fuel, replacement of fossil fuel driven cars with electrics cars, and investment in solar and wind power for reducing carbon emissions. These measures also affect the emission of nitrogen oxides and associated deposition in the Baltic Proper. Measures reducing nutrient leaching include investment in sewage treatment plants, cultivation of catch crops, and reductions in the use of fertilizers. All of these measures reduce both nitrogen and phosphorus. Afforestation affects all three pollutants. The basis for choosing these measures is that they turned out to be relatively inexpensive for combatting CO2e emissions and nutrient loads into the Baltic Sea in the Mälar-region [9,10]. Our estimates of the value of the forest as a pollutant sink are then likely to be conservative.
The effects of afforestation on pollutants are calculated as the difference in the carbon and nutrient sink per unit area of forest and arable land. Given the relatively short period until 2050, afforestation requires fast-growing tree varieties to provide carbon sequestration. According to [25], the sink coefficient for forest land is 1.81 ton CO2e/ha and −0.73 ton CO2e/ha for arable land, which gives a net effect of 2.54 ton CO2e/ha afforestation. This effect is assumed to be the same for all drainage basins, obtained after 20 years, and with a constant growth rate during the years.
The cost of afforestation consists of the opportunity cost of land, i.e., differences in annual profit between agriculture and forestry. This information is obtained from a supply curve of arable land, which shows the profits foregone for transferring arable land into other uses [10]. In a similar vein, costs of fossil fuel reductions are calculated as associated decreases in consumer surplus, which are obtained from demand functions of different fossil fuel products (heating oil, coal, gasoline, and diesel).
Data on investment cost functions for wind and solar power are found in [26], who estimated quadratic cost functions for these energy sources for the whole of Sweden. The cost of electric cars is assumed to be constant per 10 km and correspond to the difference in driving costs between gasoline and diesel cars. This cost depends on the type of car and the distance driven per year; the longer the distance, the lower the difference in driving cost. We evaluate the cost for the average distance in Sweden [10]. It is also assumed that the rates are calculated from assumptions of technical life lengths of 40 years for wind and solar power, and 25 years for electric cars. With respect to capacity constraints, assumptions are imposed on the replacement of fossil fuel with renewable energy, and of the existing car fleet with electric cars.
Concerning measures reducing nutrient deposition into the Baltic Proper, considerable investments in sewage treatment plants have already been made, and we therefore assume that further cleaning is carried out by implementing tertiary cleaning. The average investment costs of tertiary cleaning at sewage treatment plants are obtained from [9] and converted into 2011 prices. It is more difficult to obtain information on the technical life length of the investment, but a 50-year perspective is usually assumed. Costs on reductions in the use of fertilisers are calculated as associated decreases in farmers’ profits, or consumer surplus, data on which are found in [9]. Costs of cultivation of catch crops, which are sown at the same time as the ordinary crop is harvested in autumn and thereby prevent nutrient leaching from the soil during autumn and winter seasons, are also found in [9].

3.3. Uncertainty, Targets, and Discount Rate

Recall from Section 2 that data are needed on variance in nutrient and risk aversion in order to calculate the risk discount. There are no data on any of these parameters. We therefore use the standard deviation in carbon sink for Sweden as calculated by [27], and assume that this is the same for nitrogen and phosphorus loads into the Baltic Proper. The standard deviations in [28] include measurement errors in data on carbon sinks for different land uses and uncertainty related to weather variability, which affects biomass growth and thereby carbon sequestration.
The effect on the risk discount of a certain choice of probability of achieving the targets depends on the underlying probability distribution of the pollutant sink. However, there is no information on the probability distributions. In principle, ϕ a p can be quantified in two ways: by assigning a specific or parameter free distribution. The normal distribution is most commonly applied, and ϕ a p is then a standard number such that φ a p f ( φ ) d φ = α p , where ϕ is the standardized distribution of A t p m s , i.e., pollutant sequestration, and f(ϕ) is the probability density function for ϕ [22]. This approach is frequently applied in the literature on policy instruments for stochastic water pollution [9,17,29,30]. Another way of quantifying ϕap is more flexible, which is based on Chebyshev’s inequality where no assumptions are made with respect to the probability distribution [28]. The value of ϕap is then determined where φap = (1−α)−1/2. There are considerable differences in the calculated ϕap depending on the assumption of distribution. For example, at a probability level α = 0.95, ϕap is 1.67 for the normal and 4.47 for Chebyshev’s distribution. We have no prior expectations for the shape of the probability distribution and we therefore make calculations with both distributions.
The EU 2050 climate policy is quite clear; 80% reduction in the 1990 emissions should be obtained in 2050. This is not the case with the nutrient targets set by BSAP, where reductions in nitrogen and phosphorus are specified for different marine basins but not the timing of their achievement. It is only stated that preparedness for implementing the targets should by obtained in 2020. Since it takes some time between implementation of nutrient reductions and final achievement, we therefore simply assume that the targets of 23% reduction in nitrogen and 61% reduction in phosphorus loads into the Baltic Proper should be achieved in 2035.
Regarding the choice of discount rate, there is a large body of literature on the appropriate level of the social discount rate, which is determined by pure time preferences, growth in consumption opportunities, and utility of consumption [31]. It is generally also suggested to use a hyperbolic discount rate, i.e., a time-declining rate, for long-term projects exceeding 50–100 years. A simplification is made in this paper by assigning a uniform discount rate for all municipalities, counties and time periods. Following recommendations made for discounting future streams of net benefits, calculations of cost-effective solutions are made for a relatively low level of 0.015 [32].
With respect to choice of software, all calculations are made with the GAMS optimization program, Solver Conopt2 [33].

4. Results: Value of the Forest for Provision of Carbon and Nutrient Sequestration

The existing carbon sequestration corresponds to 24% of the total emissions in 2011. The inclusion of this sink into the Stockholm-Mälar climate and water policy would generate cost savings since part of the emission target is obtained by sequestration free of charge. However, there is currently a debate on whether carbon sequestration should be included in the EU climate policy, which focuses solely on increases in the carbon sink from a certain reference value, which is denoted additional sinks. One argument against including the existing carbon sink is that this is already considered when setting targets, and its inclusion would tighten the emission target. In the following, we will therefore focus on the value of the additional sink, but also present results on the values of the existing sink. In our model, the only additional sink option is forest plantations on agricultural land. As will be shown, the value of the existing sink available free of charge can be zero depending on risk attitudes and assumptions that stem from uncertainty in carbon sequestration.

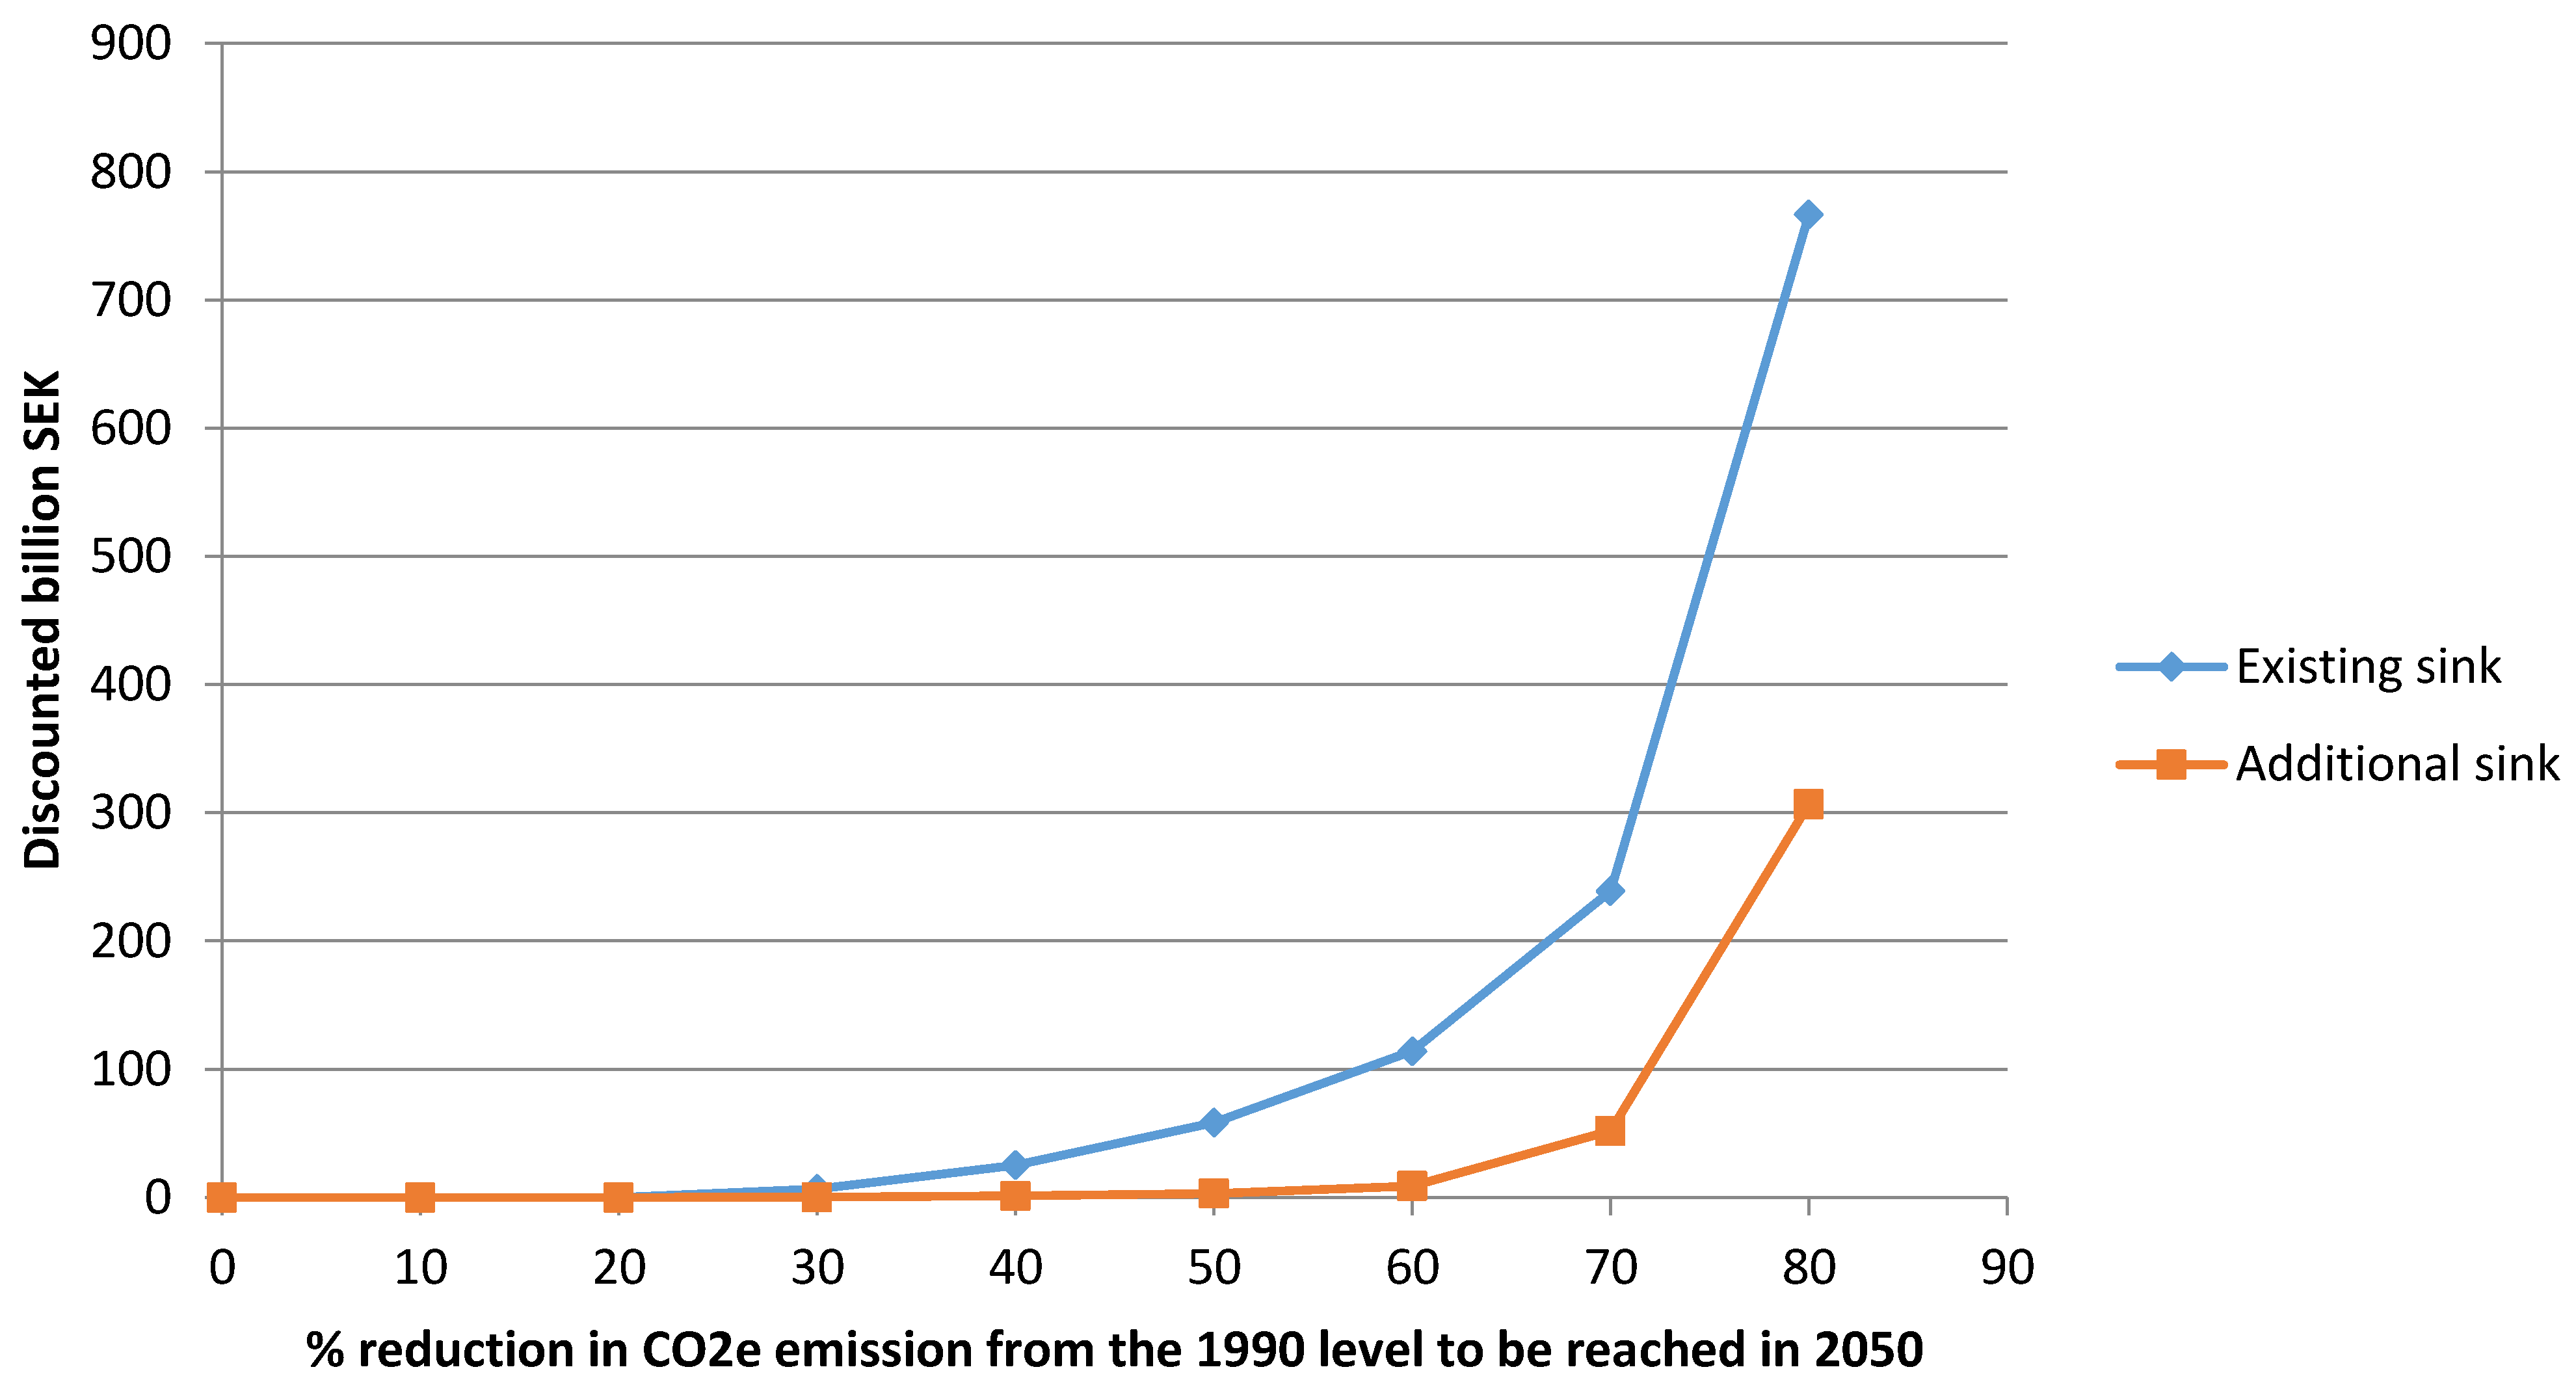
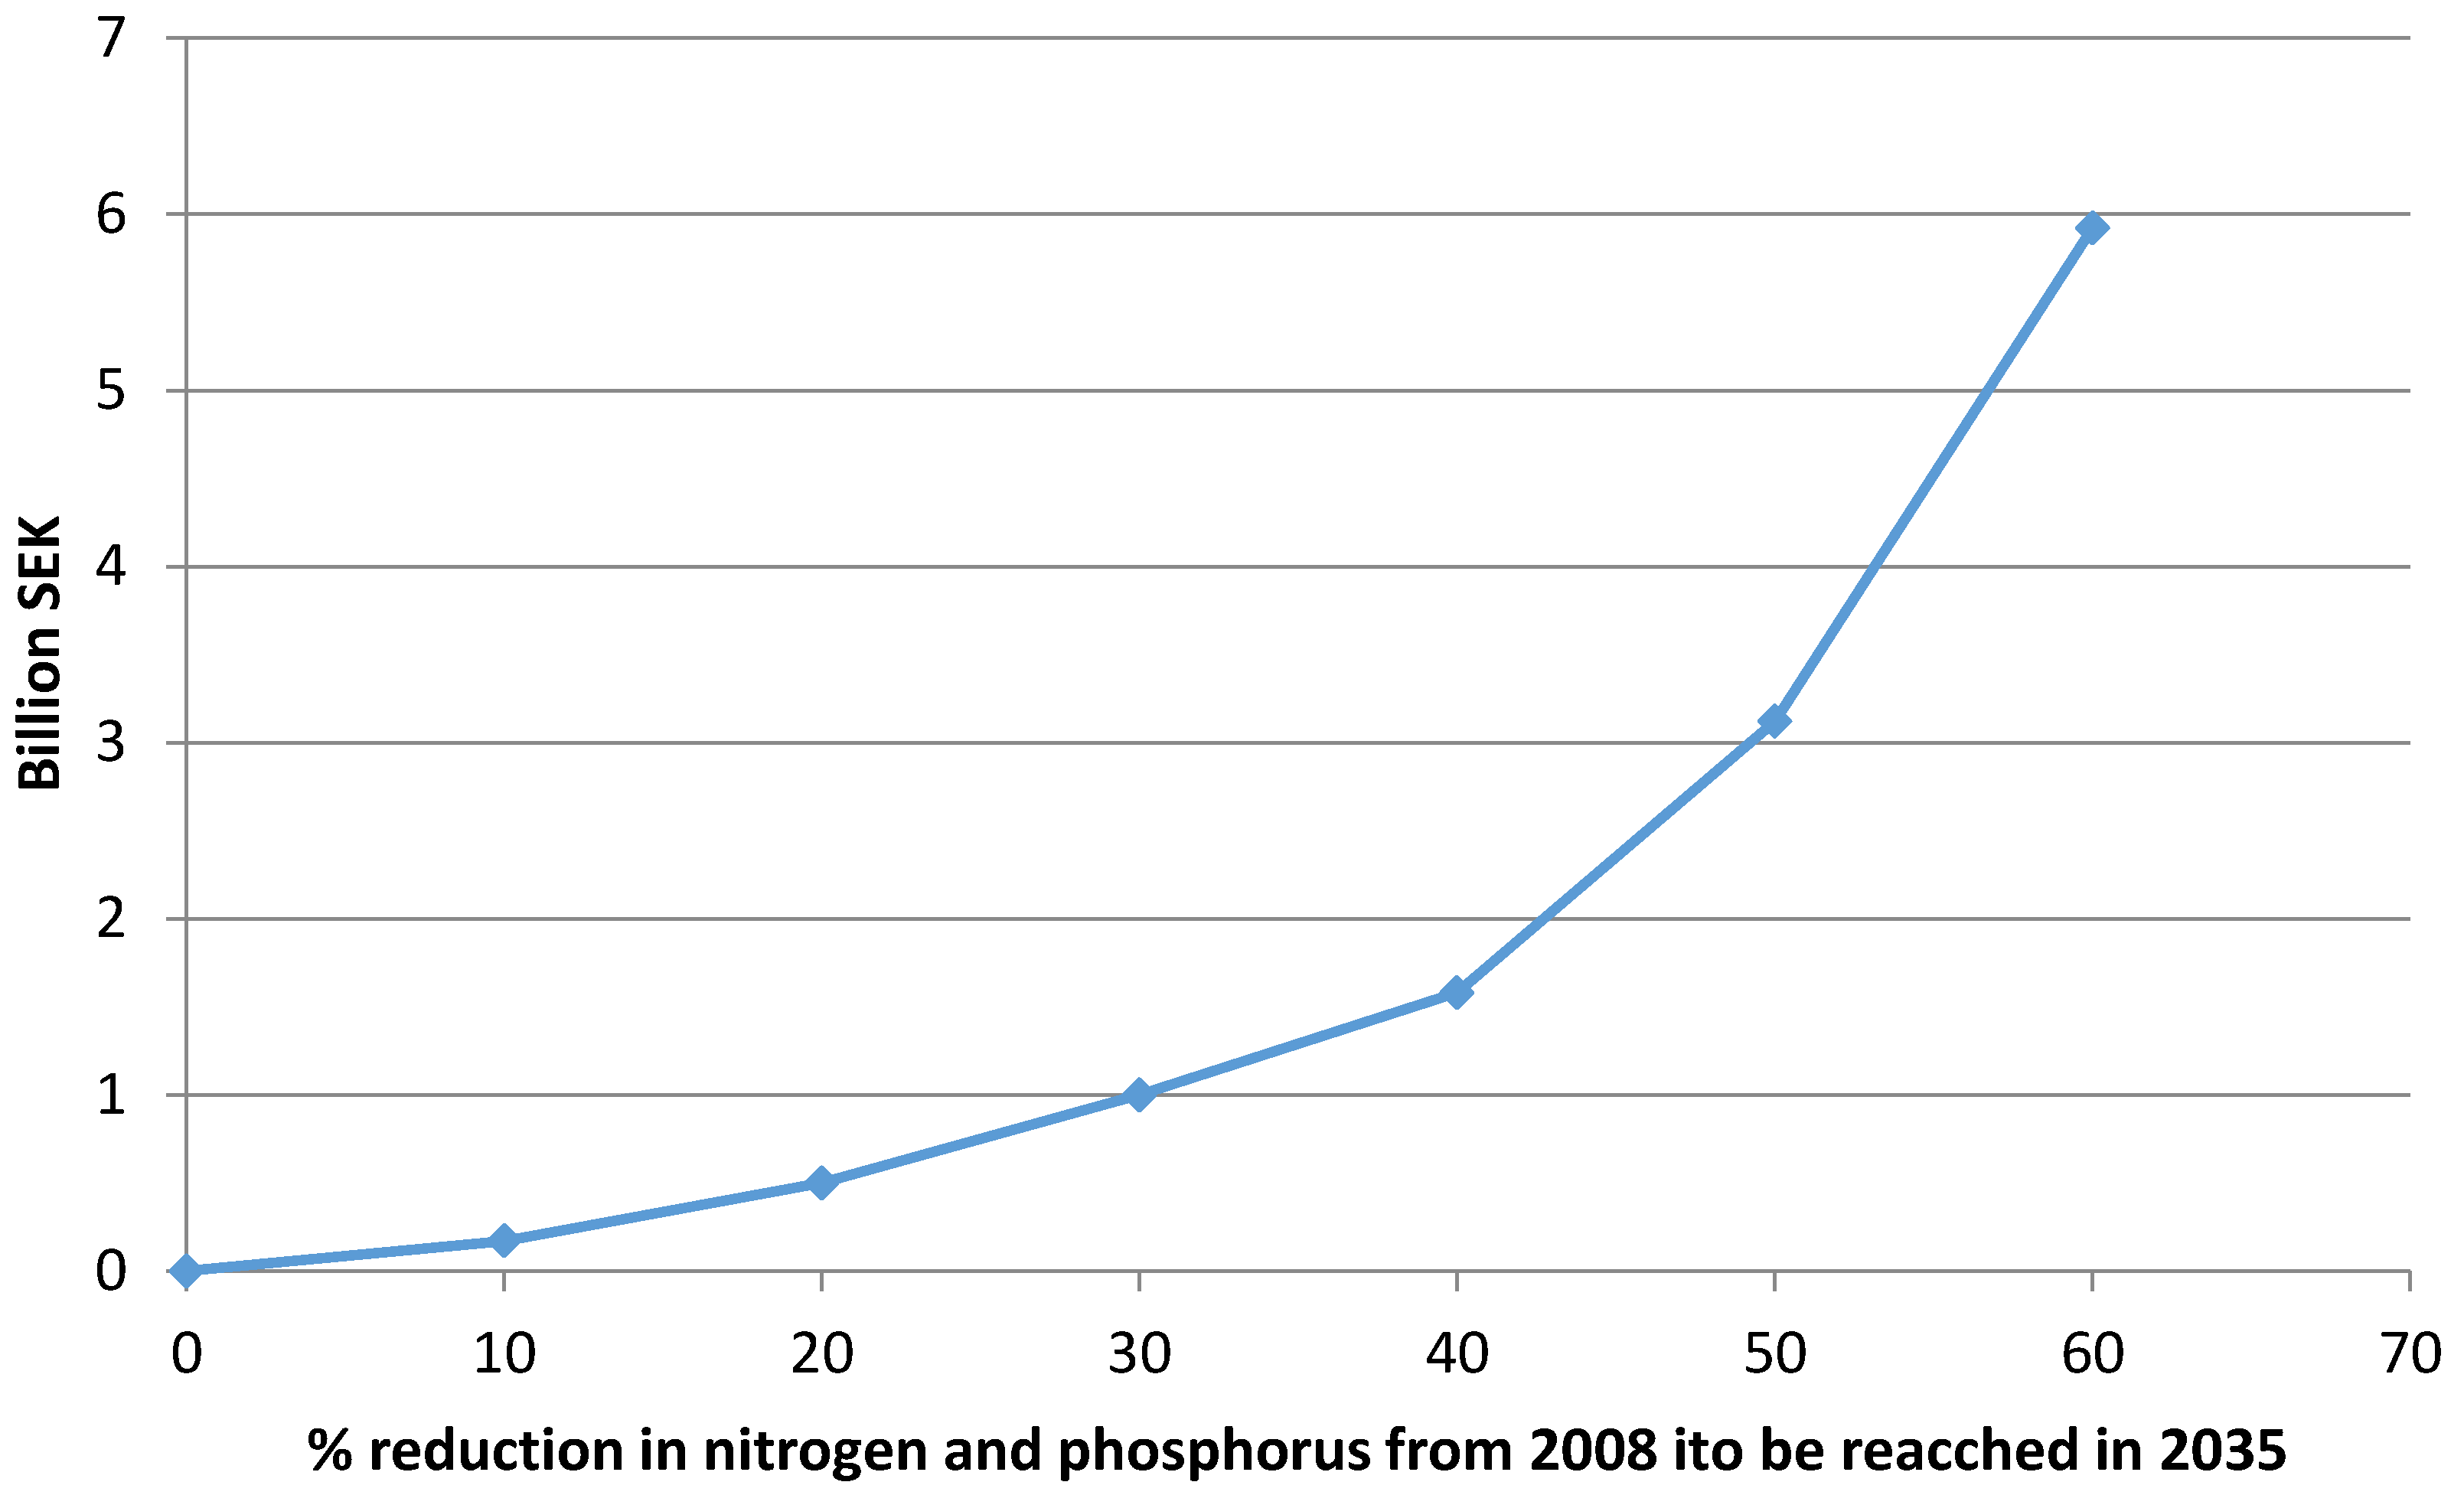
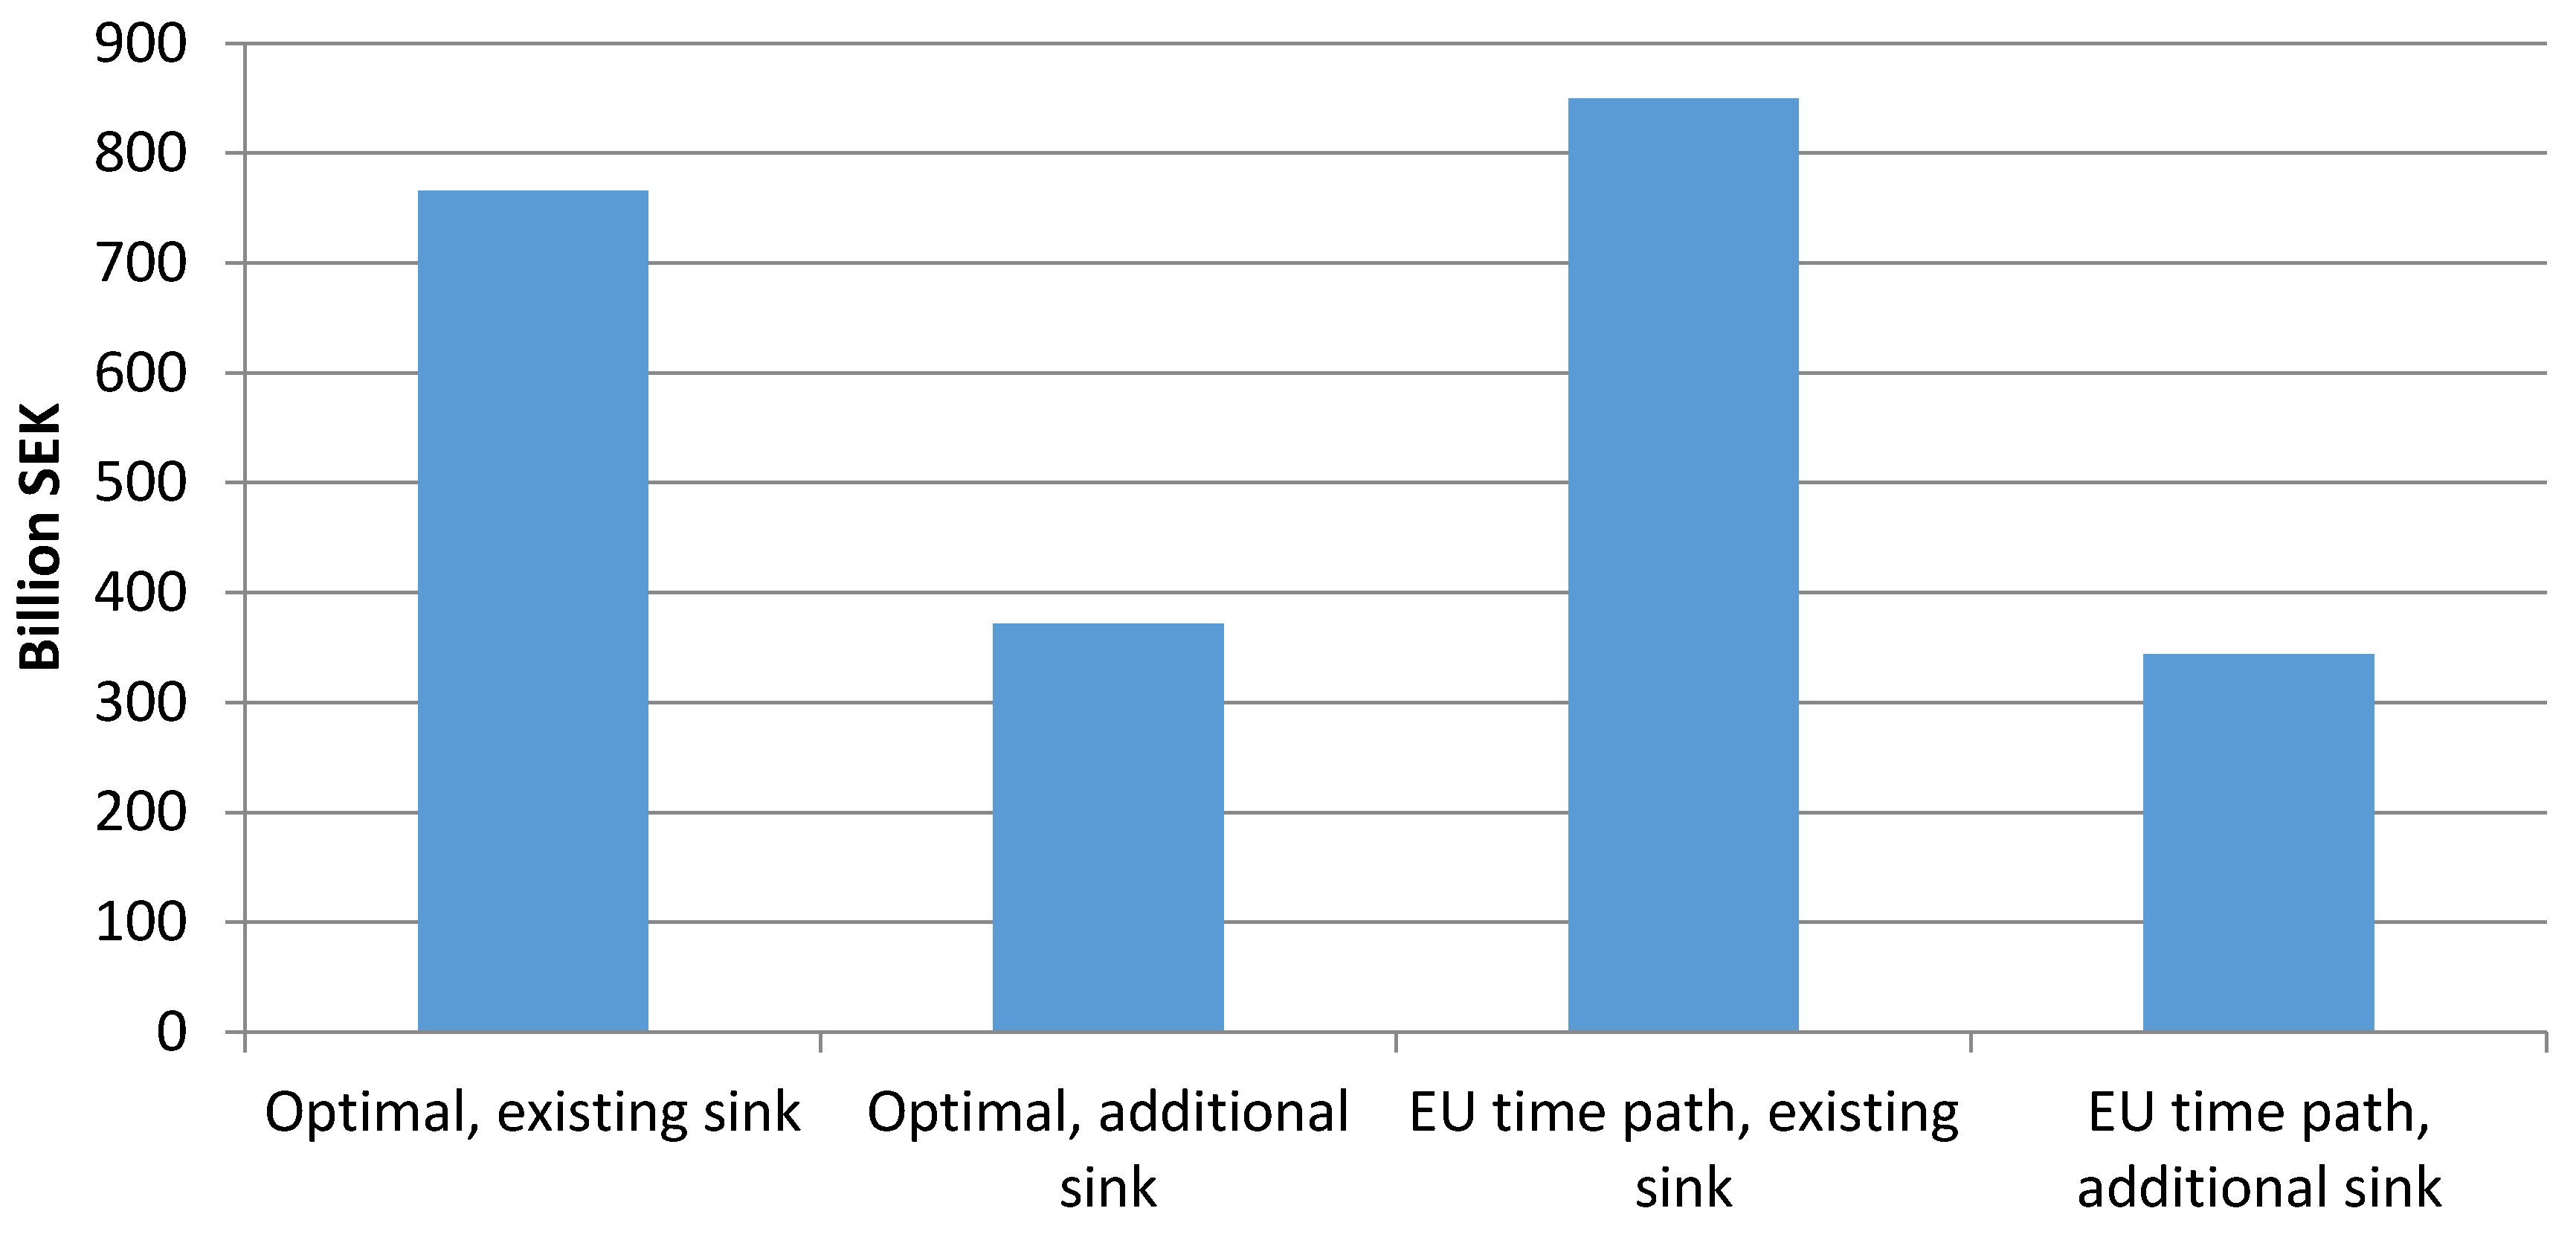
4.1. Value of Pollutant Sink at Different Emission Targets

The main focus of this study is the value of pollutant sinks in achieving the EU 2050 climate policy and BSAP nutrient targets. As shown in Section 2, the value is determined by, among others, the stringency in emission targets, and we therefore present results for different levels of carbon and nutrient emission targets. Starting with carbon emission, the value of forest sequestration ranges from zero to 767 billion SEK (1 Euro = 9.36 SEK, 13 July 2015), depending on the emission target and the inclusion of existing or additional sequestration (Figure 2).
Figure 2. Value of forests for carbon sequestration when only existing or additional carbon sinks are included at different reduction levels from the 1990 emission, to be achieved by 2050.
Forests 06 03594 g002
The zero value arises from the reduction in emission of 15% in the Stockholm-Mälar region from 1990 to 2011 [10]. When existing sinks are included, the zero value increases to approximately 40% of the emissions in 1990. The total abatement cost for reaching the emission target in 2050 without the inclusion of any sink option amounts to 900 billion SEK. The average annual cost of 24 billion SEK corresponds to approximately 1.7% of the gross regional product (GRP) of the Stockholm-Mälar region. This is reduced to 0.3% when only the existing sink is included and to 1.2% when only the additional sink is considered in the climate program.
As expected from the illustration in Figure 1, the carbon sink value increases at higher emission reduction levels because of the higher abatement costs for emission reductions. The carbon sink values are relatively low at reduction levels up to 50%, and then increase rapidly. At the EU target of 80% emission reduction, the value when only existing sinks are included corresponds to approximately 767 billion SEK, and when only the additional sink is included, to 307 billion SEK. The values thus decrease the total cost without any sink option by 84% or 35%.
The corresponding values of forests for reaching different reductions in both nutrients to the Baltic Proper are presented in Figure 3.
Figure 3. Value of the forest for nutrient sequestration in reducing nitrogen and phosphorus loads from the Stockholm-Stockholm-Mälar region to the Baltic Proper in 2035.
Forests 06 03594 g003
The value of the forest for nutrient sequestration is much lower than that for carbon sequestration. One reason is that total costs without nutrient sequestration are lower, and amount to 17 billion SEK at 60% reduction in both nutrients. This corresponds to an average annual cost of 0.5 billion SEK, also obtained by [9]. The cost is reduced by 5.2 billion SEK, or approximately 35%, when forest nutrient sinks are included. This relative reduction is of the same order of magnitude as the additional carbon sinks.

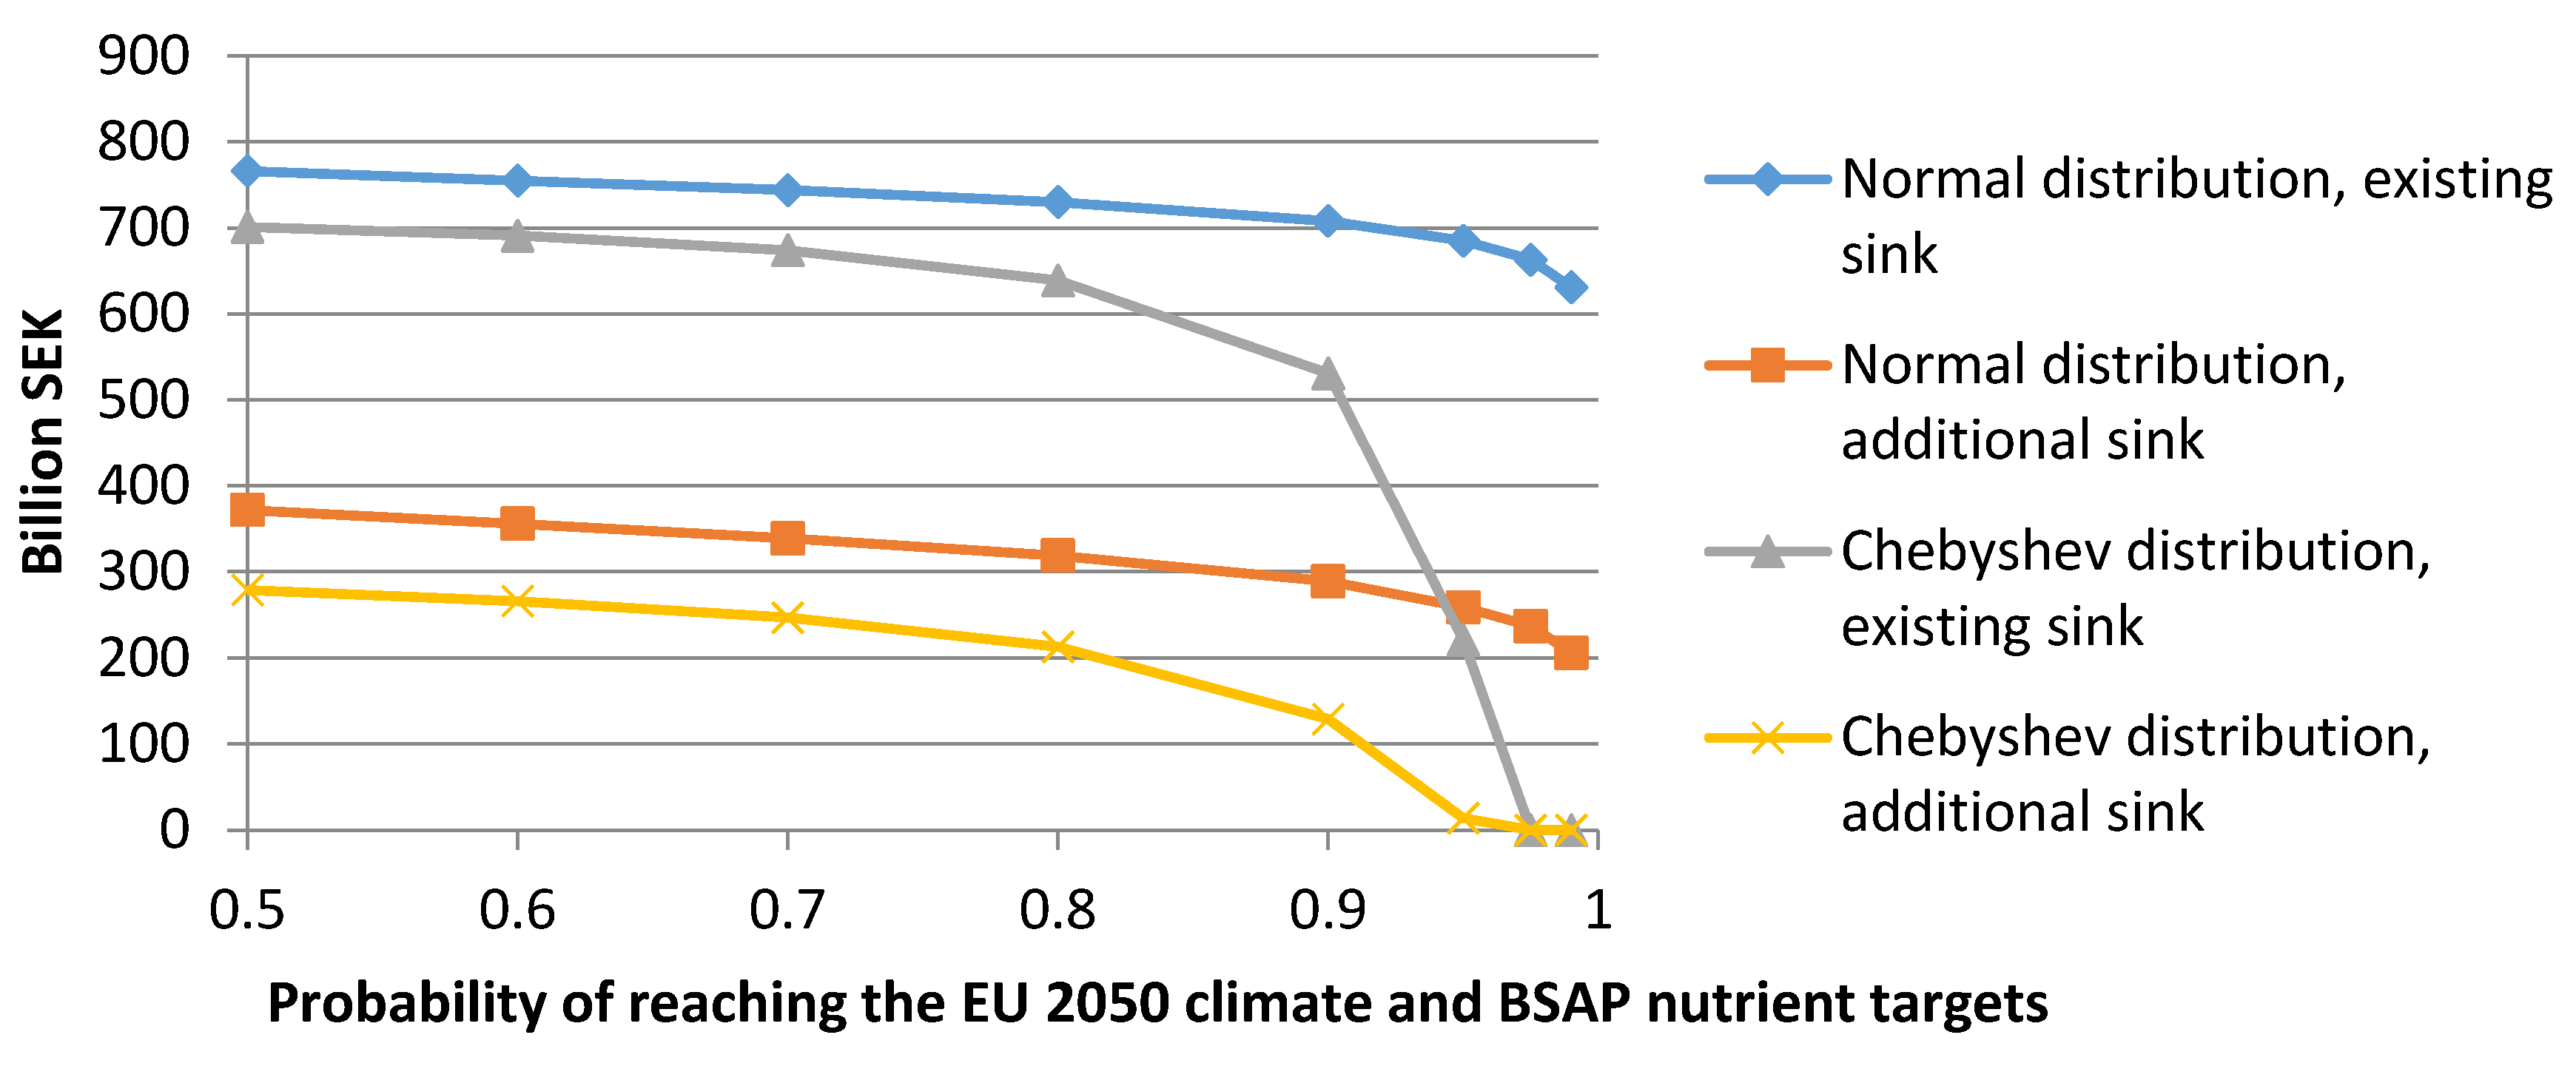
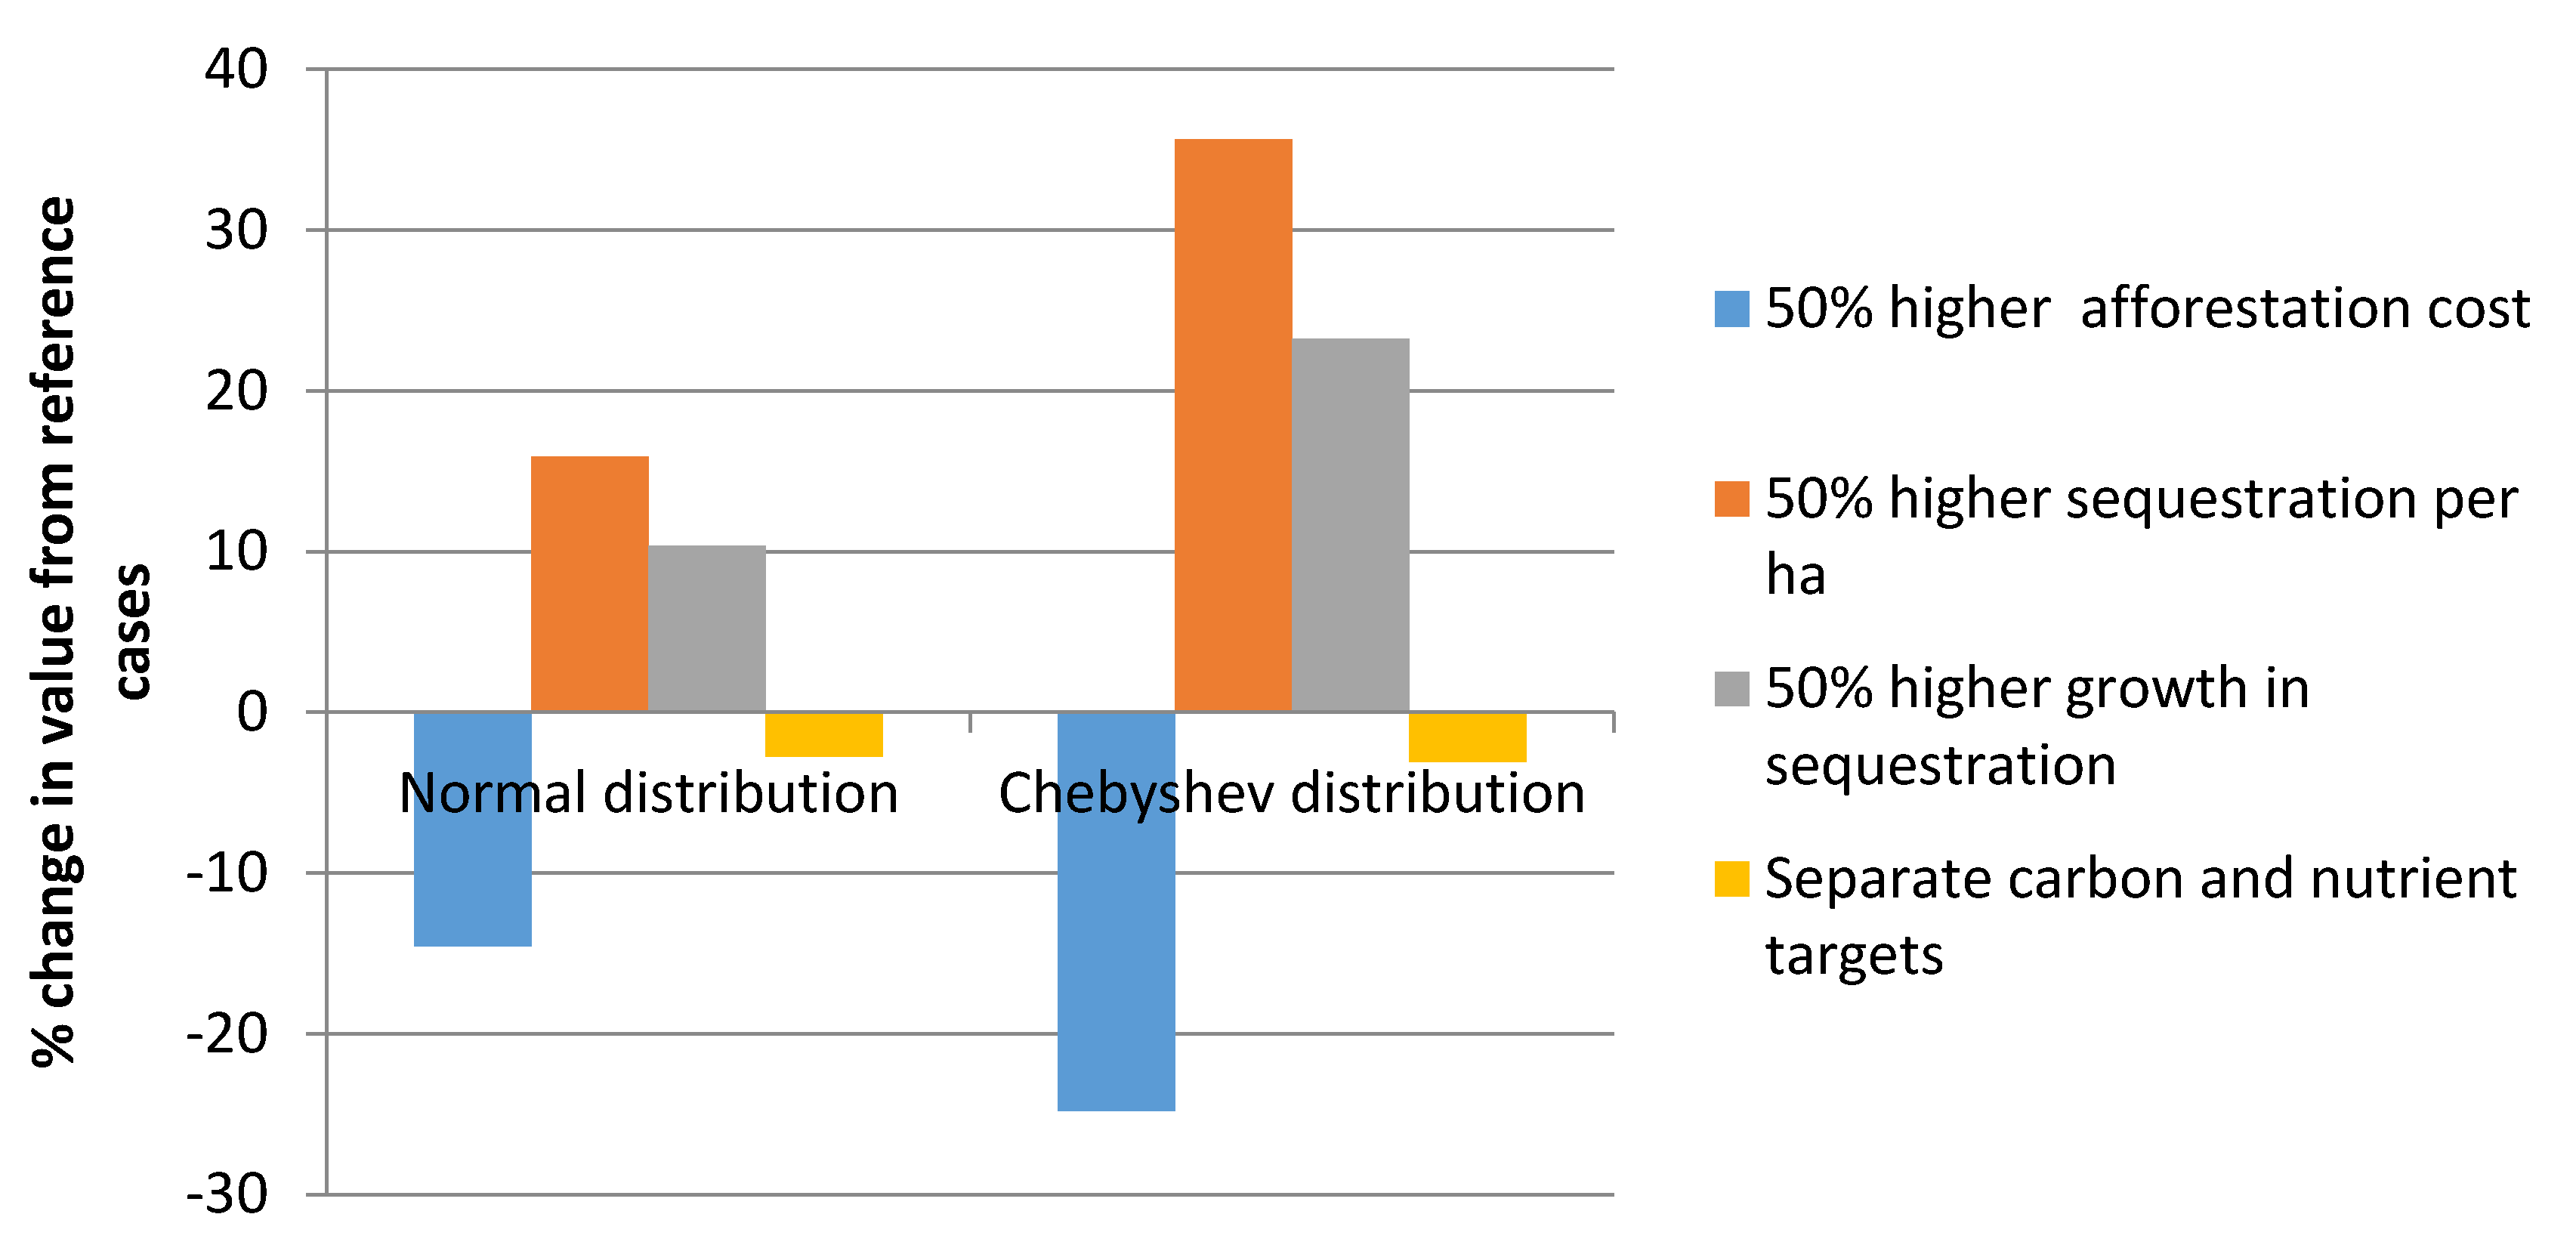
4.2. Uncertainty in Forest Pollutant Sink

One of the main arguments for not introducing carbon sinks in any climate policy is the uncertainty associated with stochastic weather conditions affecting biomass growth and permanence in carbon sinks over time. Therefore, 1 ton CO2e sequestration does not correspond to 1 ton CO2e reduction in emissions. As shown in Section 2, this is treated in terms of an uncertainty discount, which is determined by the risk preference, i.e., the chosen probability of reaching the targets, the variability in the sink, and the chosen probability distribution. We evaluate the value of the forest as a pollutant sink under simultaneous achievement of the EU 2050 climate policy [23] and the Baltic Sea Action Plan [24] at different degrees of risk aversion and for the normal and Chebyshev probability distributions (Figure 4).
Figure 4. Value of forest pollutant sink for reaching the EU 2050 climate and BSAP nutrient targets under different probabilities of reaching the targets and assumptions of probability distributions.
Forests 06 03594 g004
For both the normal and Chebyshev probability distributions, the value decreases as the chosen probability increases. However, the decline is more drastic with the Chebyshev probability distribution, and the value is zero at probability levels exceeding 0.95. The maximum decline in the forest sink value differs for the different probability distributions: it is 166 billion SEK, or 45%, for the normal distribution and 279 billion SEK, or 100%, for the Chebyshev distribution, both of which occur at probability levels exceeding 0.95.
The maximum value of the forest carbon sink amounts to 767 billion SEK, which occurs when there is no risk aversion. The marginal costs for achieving the targets, the Lagrange multipliers in Section 2, then amount to SEK 2570/ton CO2e reduction, and to SEK 10,300/kg phosphorus and SEK 231/kg nitrogen load reduction.

5. Discussion

The option of accepting an existing carbon sink within a climate program is not considered in other studies, in comparison to only additional carbon sinks. The calculated total cost of reaching the EU 2050 climate targets as measured in per cent of gross domestic product of the Stockholm-Mälar region, 1.12%, is within the range of that obtained for reaching the EU 2050 climate targets [34]. The calculated marginal cost of CO2e reduction is also within the range of other studies. On the other hand, the marginal costs of the nutrient load reductions are slightly above the estimates obtained for the entire Baltic Sea and all riparian countries by [35]. One reason that these marginal costs differs from other studies could be the relatively large level of nutrient abatement already carried out in the Stockholm-Mälar region, which raises the marginal cost of further abatement.
The calculated maximum value of the existing sink of 767 billion SEK corresponds to an average forest value of SEK 22500/ha. This value can be compared with the average assessed value of productive forests, which varies between SEK 41,200/ha and SEK 58,800/ha in the different counties in the Stockholm-Mälar region [36]. The value of the existing carbon and nutrient sink can then correspond to 50% of the value for timber products. It is reduced to SEK 8700/ha, or maximum 21% of the value of productive forests, when only additional sinks are included.
As shown in Section 2, in addition to target stringency and uncertainty, there are other determinants of the value of forest pollutant sinks. These include the cost of afforestation, impact on the pollutant sink, and growth of forest sinks. It was also recognized that cost advantages of multifunctional measures materialize under simultaneous management of all targets, but not under separate management.
It is also of interest to investigate how the value is determined by the time path for decarbonization as envisaged by [23]. In order to reach the target in 2050, it is suggested that 20% of the 1990 emission should be reduced by 2020, 40% by 2030, 60% by 2040, and 80% by 2050. This path may not coincide with the cost effective path, the conditions of which were presented in Section 2, and the total cost will then be higher. The calculated total cost for achieving the EU and BSAP targets under optimal conditions amount to 900 billion, and under the EU budget, to 992 billion. This, in turn, affects the value of forest carbon and nutrient sequestration of both the existing and additional sink (Figure 5).
The value of the existing carbon sink is higher under the EU time path since the total abatement cost is larger. On the other hand, the value of the additional sink is slightly lower under the EU time path than under optimal conditions. This seems counter intuitive, but is explained by the gains made by the full use of the forest sinks’ ability to grow over time for optimal solutions, which is limited by the EU suggested time path.
Figure 5. Value of forests as pollutant sinks for reaching the EU 2050 climate target and the BSAP nutrient targets in the Stockholm-Mälar region optimally or under the EU time path without uncertainty.
Forests 06 03594 g005
When considering uncertainty and the other factors influencing the calculated value of the forest as a pollutant sink, it is noted that the relative values, as measured in deviation from the reference values, are more sensitive to changes in parameter values under the Chebyshev than the normal probability distribution (Figure 6).
Figure 6. Impacts on the reference value of the forest as an additional pollutant sink under uncertainty with 0.9 probability (289 billion for the normal and 129 billion for Chebyshev the distribution) of different changes in afforestation cost, pollutant sequestration and growth, and separate management of carbon and nutrient targets.
Forests 06 03594 g006
As expected, the value decreases when the afforestation cost increases, which can be a result of higher future competition of land with food production. A 50% increase in the afforestation cost results in 15% and 25% decline in the reference value under the normal and Chebyshev distribution, respectively. The reason for the larger decline under the Chebyshev distribution is the relatively higher risk discount, which raises the cost of the forest as a pollutant sink compared with the normal distribution. A certain percentage deviation in afforestation costs then has a higher impact on the reference value. This also explains the higher increase in relative values when pollutant sequestration/ha and growth rate over time increases.
However, the decline in the absolute values when the afforestation cost increases by 50% is still higher for the normal distribution, for which it amounts to 43 billion SEK compared with 32 billion SEK for the Chebyshev distribution. On the other hand, the decline in the absolute values is of the same order of magnitude for both distributions when sequestration and the rate of sequestration increase and amount to approximately 46 and 30 billion SEK, respectively. The choice of separate versus simultaneous management has a minor impact on both distributions and raises the cost at the most by 8 billion SEK, which occurs for the normal distribution.

6. Conclusions

The calculation of values of forest carbon and nutrient sequestration in the Stockholm-Stockholm-Mälar region showed that these can be significant. They can create cost savings corresponding to 35% of the cost of achieving the EU 2050 climate and the Helcom BSAP nutrient targets in 2035. The cost saving in percentage for achieving the EU climate target is of the same magnitude as that obtained in other studies [34]. In absolute terms, the total value amounts to 307 billion SEK, which corresponds to approximately 0.45% of the region’s gross domestic product.
However, this value declines when uncertainty in pollutant sink is considered, which is the main argument raised against its inclusion into, in particular, climate policy. Depending on risk aversion and the choice of the probability distribution, normal or Chebyshev distribution, the value can be reduced by 50% or 100%, respectively, at very high risk aversion, where the targets are to be achieved at probability levels exceeding 0.95.
The calculated values are affected not only by the level of uncertainty, but also by factors not considered in this study, which can result in higher or lower estimates (Table 2).
Table 2. Factors increasing or decreasing the calculated values of forest carbon sequestration and nutrient recycling, where × denotes the direction of impact.
FactorIncreased Calculated Value of Carbon and Nutrient SinksDecreased Calculated Value of Carbon and Nutrients
Uncertainty in all abatement measures and not only carbon sink×
Inclusion of more forest management option×
Inclusion of measures reducing uncertainty in the carbon sink×
Policy implementation of carbon and nutrient sink ×
Consideration of more non-marketed ecosystem services××
Uncertainty in other abatement measures such as reduction in fossil fuels or investment in solar energy raises the cost of these measures, and, hence, the value of the forest carbon sink. This would also be the case if more forest management options were included, which would improve pollutant sink per area of forest and/or increase the rate of sequestration growth over time. Another factor contributing to increased values is the inclusion of management options for reducing uncertainty by, for example, increased monitoring of forest biomass growth and carbon sink content and/or improved management for reducing carbon releases from dead wood and soil.
The calculated values can be lower when considering the difficulties associated with implementing a multi-target strategy, which requires allowance for pollutant reduction in several policy systems. For example, afforestation must be deducted from the emission of nitrogen, phosphorus, and CO2e. This can be obtained by an offset system where actors obtain credits for pollutant sequestration, which can be deducted from their pollutant emissions allowances. Another possibility is to include the abatement measures in the policy system where, for example, forest carbon sequestration can be traded on the EU ETS (Emission Trading System), or in a national tax system. Both options face problems when including land use measures because of the difficulties in monitoring and verifying sequestration, and to secure additionality and permanence in the sequestration. Associated transaction costs can be relatively high and the potential cost savings from pollutant sequestration are then smaller than pointed out in this study.
The results are also affected by the number of included non-marketed ecosystem services. This study considered only carbon sequestration and nutrient recycling. However, increases in these two services may result in decreases in other non-marketed services, such as biodiversity, which would reduce the calculated values in this study. On the other hand, if there is complementarity in the provisioning of these services, the calculated value can be raised since increases in the carbon and nutrient sink then provides a simultaneous improvement in biodiversity. Calculations of such trade-offs or complementarities in the provision of forest ecosystem services require quantified production functions for all of these services, which are not available for forests in Sweden.
The conclusion with respect to the value of forest carbon sequestration and nutrient recycling as abatement measures in climate and nutrient programs is thus ambiguous. Although our study shows considerable cost savings in the deterministic and relatively simple case, the consideration of uncertainty, policy implementation, and other ecosystem services can eliminate these savings. This inconclusiveness points out the need for further analysis and investigations of these factors for the potential value of the forest carbon sink and nutrient recycling as abatement options in climate and nutrient programs.

Conflicts of Interest

The authors declare no conflict of interest.

Acknowledgements

We are much indebted to two anonymous reviewers for valuable comments and to funding support from the EU 7th Framework Programme for the COMPLEX ‘Knowledge based climate mitigation systems for a low carbon economy’ project, grant agreement number 308601.

References

  1. Pearce, D. The economic value of forest ecosystems. Ecosyst. Health 2001, 7, 284–296. [Google Scholar] [CrossRef]
  2. Lubowski, R.; Plantinga, A.; Stavins, R. Land-use change and carbon sinks: Econometric estimation of the carbon sequestration supply function. J. Environ. Econ. Manag. 2006, 51, 135–152. [Google Scholar] [CrossRef]
  3. Michetti, M.; Rosa, R.N. Afforestation and Timber Management Compliance Strategies in Climate Policy. A Computable General Equilibrium Analysis. FEEM Working Paper No. 4. 2011. Available online: http://www.feem.it/userfiles/attach/2011118158514NDL2011-004.pdf (accessed on 14 July 2015).
  4. Gren, I.-M.; Carlsson, M. Economic value of carbon sequestration in forests under multiple sources of uncertainty. J. For. Econ. 2013, 19, 174–189. [Google Scholar] [CrossRef]
  5. Aklilu, A.; Gren, I.-M. Economic Incentives for Carbon Sequestration: A Review of the Literature. Working Paper 2014: 08; Department of Economics, Swedish University of Agricultural Sciences: Uppsala, Sweden, 2014; Available online: https://ideas.repec.org/p/hhs/slueko/2014_008.html (accessed on 14 July 2015).
  6. Gilbert, P.M. Eutrophication and harmful algal blooms: A complex global issue, examples from the Arabian Seas and including Kuwait Bay and an introduction to the global ecology and oceanography of harmful algal blooms (GEOHAB) Programme. Int. J. Oceans Oceanogr. 2007, 2, 157–169. [Google Scholar]
  7. Heisler, J.; Glibert, P.M.; Burkholder, J.M.; Anderson, D.M.; Cochlan, W.; Dennison, W.C.; Dortch, Q.; Goble, C.J.; Heil, C.A.; Humphries, E.; et al. Eutrophication and harmful algal blooms: A scientific consensus. Harmful Algae 2008, 8, 3–13. [Google Scholar] [CrossRef]
  8. Boberg, J.; Finley, R.; Stenlid, J.; Ekblad, A.; Lindahl, B. Nitrogen and carbon reallocation in fungal mycelia during decomposition of boreal forest litter. PLoS ONE 2014, 9, e92897. [Google Scholar] [CrossRef] [PubMed]
  9. Gren, I.-M. Climate change and the Water Framework Directive: Cost effectiveness and policy design for water management in the Swedish Stockholm-Mälar region. Clim. Chang. 2010, 100, 463–484. [Google Scholar] [CrossRef]
  10. Gren, I.-M.; Marbuah, G.; Tafesse, W. Cost-Effective Land Use Dynamics towards a Low Carbon Economy in the Stockholm-Mälar Region; Report for COMPLEX: Newcastle, UK, September 2015; Available online: http://owsgip.itc.utwente.nl/projects/complex/complex_files/D4.2%20land%20use%20simulation%20with%20report.pdf (accessed on 14 July 2015).
  11. Gosselink, J.G.; Odum, E.P.; Pope, R.M. The Value of the Tidal Marsh. Center for Wetland Resources; Louisiana State University: Baton Rouge, LA, USA, 1972. [Google Scholar]
  12. Breux, A.; Farber, S.; Day, J. Using natural coastal wetland systems for waste water treatment: An economic benefit analysis. J. Environ. Manag. 1995, 44, 285–291. [Google Scholar] [CrossRef]
  13. Byström, O. The replacement value of wetlands in Sweden. Environ. Resour. Econ. 2000, 16, 347–362. [Google Scholar] [CrossRef]
  14. Gren, I.-M. The economic value of coastal waters as nutrient filters for the Baltic Sea. Reg. Environ. Chang. 2013, 13, 695–703. [Google Scholar] [CrossRef]
  15. Tavoni, M.B.; Sohngen, B. Forestry and the carbon market response to stabilise climate. Energy Policy 2007, 35, 5346–5353. [Google Scholar] [CrossRef] [Green Version]
  16. Anger, N.; Sathaye, J. Reducing Deforestation and Trading Emissions: Economic Implications for the Post-Kyoto Carbon Market. ZEW-Centre for European Economic Research Discussion Paper (08–016). 2008. Available online: http://ftp.zew.de/pub/zew-docs/dp/dp08016.pdf (accessed on 14 July 2015).
  17. Byström, O.; Andersson, H.; Gren, I.-M. Economic criteria for restoration of wetlands under uncertainty. Ecol. Econ. 2000, 35, 35–45. [Google Scholar] [CrossRef]
  18. Kurkalova, L. Carbon sequestration in agricultural soils: Discounting for uncertainty. Can. J. Agric. Econ. 2005, 53, 375–384. [Google Scholar] [CrossRef]
  19. Kim, M.; McCarl, B. Uncertainty discounting for land based carbon sequestration. J. Agric. Appl. Econ. 2009, 41, 1–11. [Google Scholar]
  20. Tesler, L.G. Safety-first and hedging. Rev. Econ. Stud. 1955, 23, 1–16. [Google Scholar]
  21. Gren, I.-M.; Carlsson, M.; Munnich, M.; Elofsson, K. The role of stochastic carbon sink for the EU emission trading system. Energy Econ. 2012, 34, 1523–1531. [Google Scholar] [CrossRef]
  22. Taha, H.A. Operations Research, an Introduction, 2nd ed.; Macmillan Publishing, Inc.: New York, NY, USA, 1976. [Google Scholar]
  23. European Commission. Climate Action. Roadmap for Moving to a Low-Carbon Economy in 2050. Available online: http://ec.europa.eu/clima/policies/strategies/2050/faq_en.htm (accessed on 1 October 2015).
  24. Helcom HELCOM Baltic Sea Action Plan. Nutrient Reduction Scheme. Available online: http://www.helcom.fi/baltic-sea-action-plan/nutrient-reduction-scheme/ (accessed on 7 January 2014).
  25. SEPA (Swedish Environmental Protection Agency) 2014. Utsläpp av Växthusgaser Från Markanvändning. Available online: http://www.naturvardsverket.se/sa-mar-miljon/statistik.A-O/vaxthusgaser-utslapp-och-upptag-fran-markanvändning/ (accessed on 24 February 2014).
  26. Munnich Vass, M. Can Renewable Energies with Learning-by-Doing Compete with Forest Sequestration to Cost-Effectively Meet the EU Carbon Target for 2050? Working Paper 2015:04; Department of Economics, SLU: Uppsala, Sweden, 2015; Available online: http://pub.epsilon.slu.se/11905/ (accessed on 14 July 2015).
  27. Janssens, L.; Freibauer, A.; Schlamadinger, B.; Ceulemans, R.; Ciais, P.; Dolman, A.; Heimann, M.; Nabuurs, G.-J.; Smith, P.; Valentini, R.; et al. The carbon budget of terrestrial ecosystems at country-scale a European case study. Biogeosciences 2005, 2, 15–26. [Google Scholar] [CrossRef]
  28. McCarl, B.A.; Spreen, T.H. Applied Mathematical Programming Using Algebraic Systems; Texas A&M University: Austin, TX, USA, 2010; pp. 14.1–14.18. Available online: ftp://178.213.241.34/pub/Library/BOOKS/heap/SCI%20BOOKS/books2/_djvu/M_Mathematics/MOc_Optimization%20and%20control/McCarl%20B.A.,%20Spreen%20T.H.%20Applied%20mathematical%20programming%20using%20algebraic%20systems%28567s%29.pdf (accessed on 3 January 2015).
  29. McSweeny, W.T.; Shortle, J.S. Probabilistic cost effectiveness in agricultural nonpoint pollution control. Southern J. Agric. Econ. 1990, 22, 95–104. [Google Scholar]
  30. Shortle, J. The allocative efficiency implications of water pollution abatement cost comparisons. Water Resour. Res. 1990, 26, 793–797. [Google Scholar] [CrossRef]
  31. Weitzman, M. Gamma Discounting. Am. Econ. Rev. 2001, 91, 260–271. [Google Scholar] [CrossRef]
  32. Newell, R.; Pizer, W. Discounting the distant future. How much do uncertainty increase valuations? J. Environ. Econ. Manag. 2003, 46, 52–71. [Google Scholar] [CrossRef]
  33. Rosenthal, R. GAMS—A User’s Guide; GAMS Development Corporation: Washington, DC, USA, 2008. [Google Scholar]
  34. Capros, P.; Paroussos, L.; Fragkos, P.; Tsani, S.; Boitier, B.; Wagner, F.; Busch, S.; Resch, G.; Blesl, M.; Bollen, J. European decarbonisation pathways under alternative technological and policy choices: A multi-model analysis. Energy Strategy Rev. 2013, 2, 231–245. [Google Scholar] [CrossRef]
  35. Gren, I.-M.; Savchuck, O.; Jansson, T. Cost effective spatial and dynamic management of a eutrophied Baltic Sea. Mar. Resour. Econ. 2013, 28, 263–284. [Google Scholar] [CrossRef]
  36. Average Assessed Value of Standing Forest and Forest Land by Ownership Class and County, Year 2011. Available online: http://www.skogsstyrelsen.se/Myndigheten/Statistik/Amnesomraden/Ekonomi/Tabeller--figurer/ (accessed on 13 July 2105).

