1. Introduction
Wind storms are one of the most damaging agents for forests in the Northern Hemisphere, especially in Western Europe [
1]. These natural disasters have significant social and environmental impacts [
2] and inflict huge economic losses on the forest sector [
3]. Impacts on the forest-based economy of exceptional events that blow down at least the annual average harvest at the industrial supply scale can last a couple of years [
4]. Storms directly impact both timber production and timber prices [
5], as forest owners are tempted to harvest to limit financial losses. This afflux of timber on the market combined with a poorer quality of fallen timber and the increasing costs of salvaging contribute to lower stumpage prices and inflict revenue losses on forest owners [
6], who are also suffering from future revenue losses due to an anticipated harvest of non-mature stands [
7]. The industry as a whole will also be affected, with the main impact being on roundwood prices and procurement in the mid to long term. After a storm event, there is a short-term increase in the wood supply, usually followed in the medium term by a supply shortage if no mitigation measures are taken [
8]. A storm event will also cause operational difficulties resulting from the lack of harvesting and transport capacities (e.g., working force, harvesters, and trucks), which may slow windfall mobilization and storage operations.
These factors show how important it is that public authorities ensure post-storm crisis management to minimize the short-, mid-, and long-term economic, social, and environmental impacts on the forest-based sector. Public authorities such as governments and public bodies are the key players in the crisis management process for three main reasons: first, they act at the legislative and decisional levels to facilitate or promote crisis measures; second, they can mobilize financial resources to support the forest-based sector; finally, they are the central point of contact for forest-based sector stakeholders. Given current scarce public resources; however, their first priority is adopting the most efficient crisis measures to provide return on public investments. Given the strong interrelation among actors in the forest-based sector, they must not only consider the measures’ efficiency on an individual basis but also pursue the global improvement of the system. These tasks require setting up support tools in order to improve strategic decision-making.
One general way to support decision-making is to use models included in decision support systems (DSSs) to make them more accessible to end-users. Most of the DSSs used in forest management are model-based [
9,
10]. Models are also frequently used in forest economics to simulate situations that may result from changes in policy (e.g., new subsidies, tax systems), market conditions [
11], or climatic conditions [
12]. Among these models, some are general equilibrium models, in which the forest sector interacts with other sectors of the economy [
13,
14]. Models in which only the forest sector is analyzed, ignoring interactions with other economic sectors, are considered partial equilibrium models. The model scope may vary, from local to international scale—the latter including the interrelations among national forest sectors. For example, the Global Forest Products Model (GFPM) described by Buongiorno,
et al. [
15] can be used to simulate how timber production and the harvesting, manufacturing and transportation of products in various countries interact through international trade. Model applications to forest-wood chain management are various: they include demand and procurement [
16], harvest planning [
17], productivity of harvesting operations [
18,
19], and transportation planning [
20,
21,
22]. Models are also frequently used in operational research to support industry and organizations in forest-wood chain planning [
23,
24,
25,
26], after the storm Gudrun in Sweden for instance [
27]. However, no DSS has been proposed to support systemic analysis and strategic management of storm damage and associated impacts on the forest-based sector after storm events.
Therefore, this paper presents an original DSS to assist post-storm crisis management and support public authorities’ decision-making in the aftermath of huge storms. The DSS’ expected output is a comparison of changes in the dynamics of the regional forest-based sector after storms under different crisis management options. The DSS is based on a regional forest model (WALFORM) developed for a case study of Wallonia, the southern region of Belgium. The first chapter describes the development, implementation, and calibration of the model. The second presents an application of the model-based DSS WIND-STORM to a hypothetical storm crisis. Finally, a discussion and conclusions highlight the pros and cons of using this DSS for storm crisis management.
2. The Regional Forest Model (WALFORM)
2.1. Conceptualization
This model represents the regional forest-wood chain dynamics after a storm event. The system dynamics is modelled in terms of stocks, representing the state of the system at any given moment after the storm, and flows, representing the rate at which these stocks are changing at any given instant. System dynamics [
28] has been used to model the interactions between stocks and flows, as this quantitative modeling method enables the building of a simple representation of complex systems. It has been used in several studies on forestry [
29,
30,
31,
32,
33] and supply chain management [
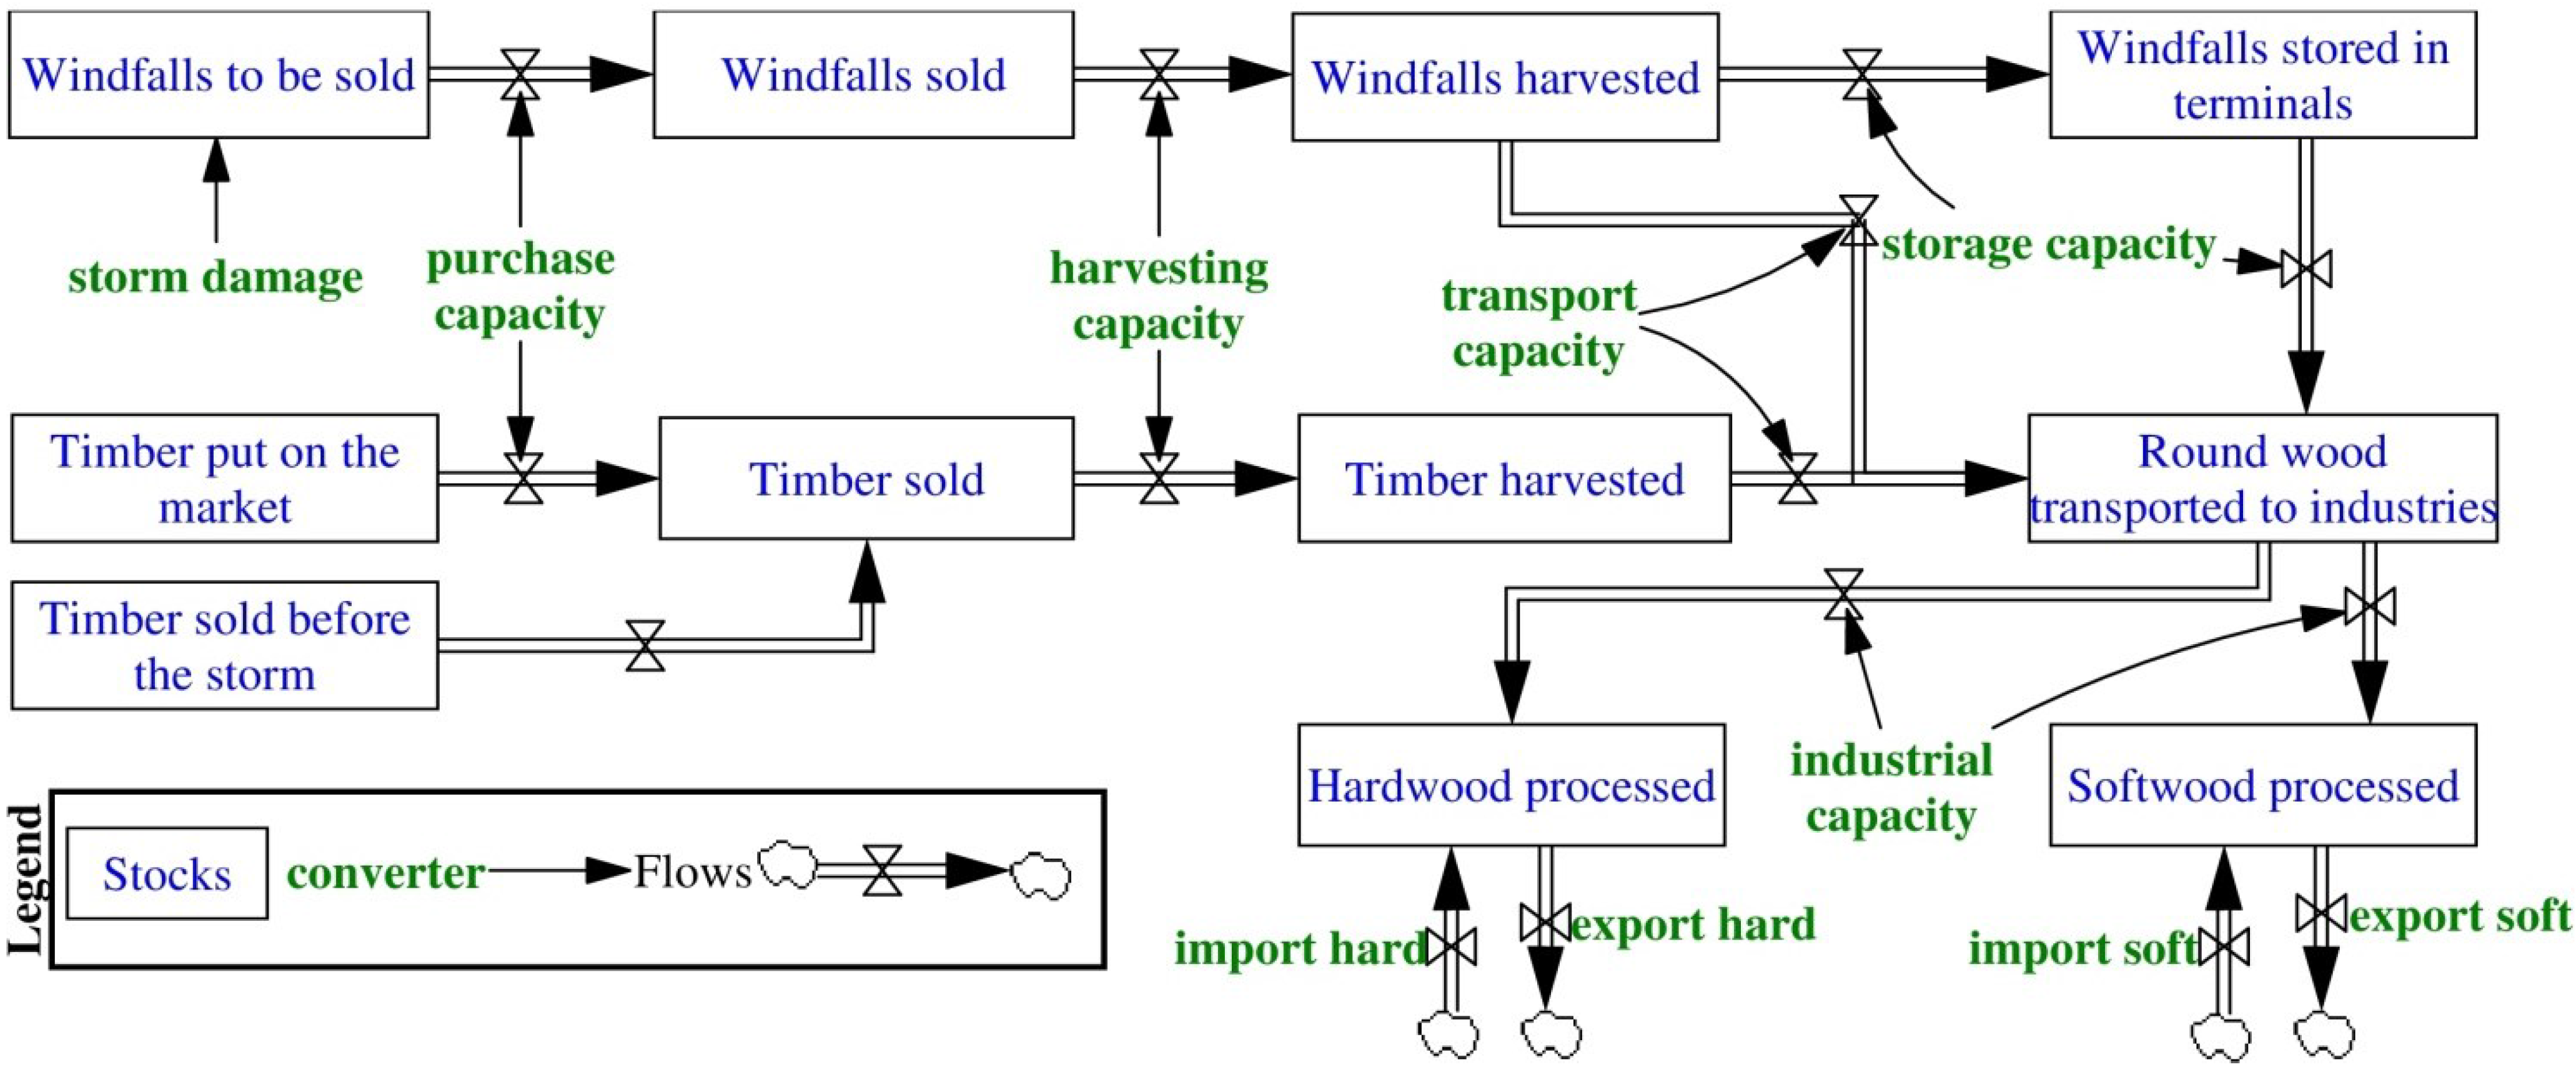
34]. To identify the stocks, the regional forest-wood chain is considered to be the succession of several forest operations: wood purchase, harvesting operations in the forest stands, the transportation of logs and bolts outside forest areas (either to industry sites or to storage terminals), and their primary transformation by local industries for various uses (e.g., sawn timber, paper, panels, fuel wood).
Figure 1 presents a conceptual representation of WALFORM in terms of stocks and flows. The model consists of four interrelated subsystems: purchase, harvesting, transport (including storage), and industry modules. A distinction is made between windfalls, trees affected by wind damage (e.g., uprooted or broken trees), and timber, trees unaffected by the storm (either standing trees or wood products derived from them). For any moment t, input and output rates (flows) determine the level of windfalls and timber within each module (stocks). The rates correspond to the financial or technical capacities available to purchase, harvest, transport, store, or process windfalls and timber. Four groups are distinguished in the model, both for windfalls and timber (spruce, other softwoods, beech, and other hardwoods). For the industry module, groups of species are aggregated in two raw material types (softwood and hardwood species).
The first step in building the model was selecting the parameters that influence the stocks and flows in a normal situation (
i.e., no storm damage); then, the parameters specific to windthrow crises were added. This selection occurred in close collaboration with stakeholders from the forest-based sector, using expert knowledge to sort the information. Particularly challenging was finding a way to reflect the range of storm damage management options implemented in the past, in both Belgium and elsewhere.
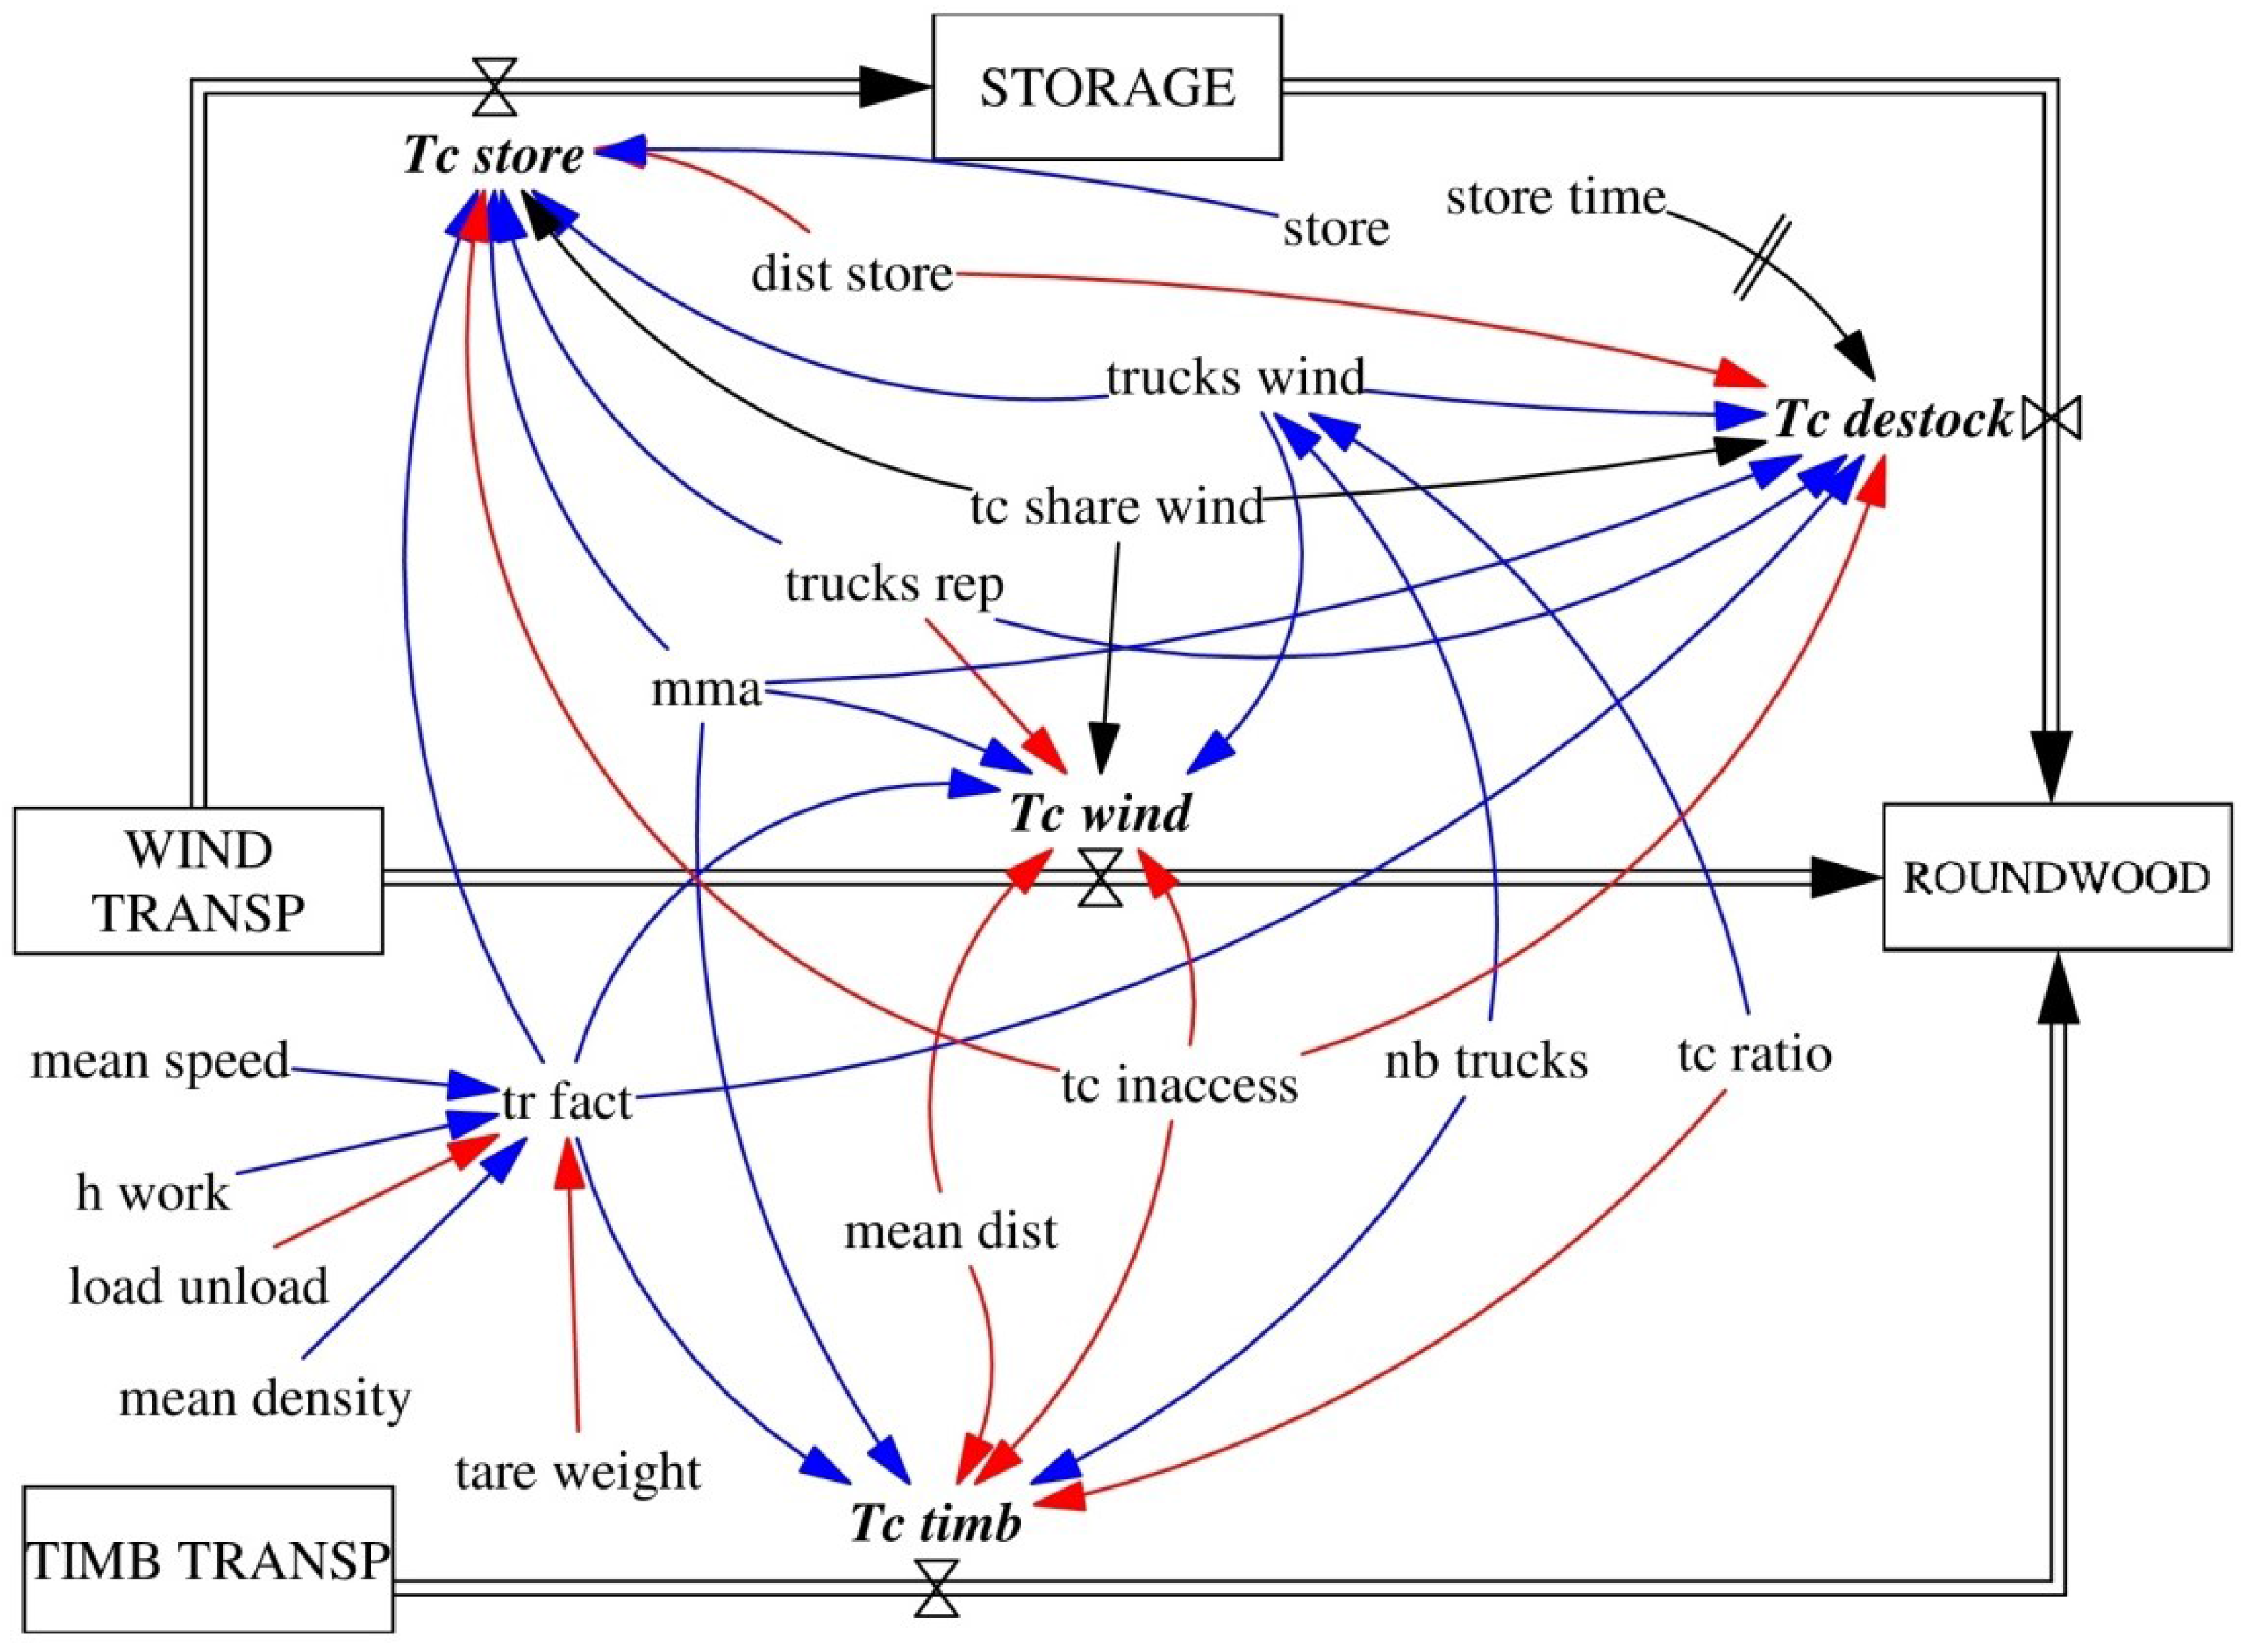
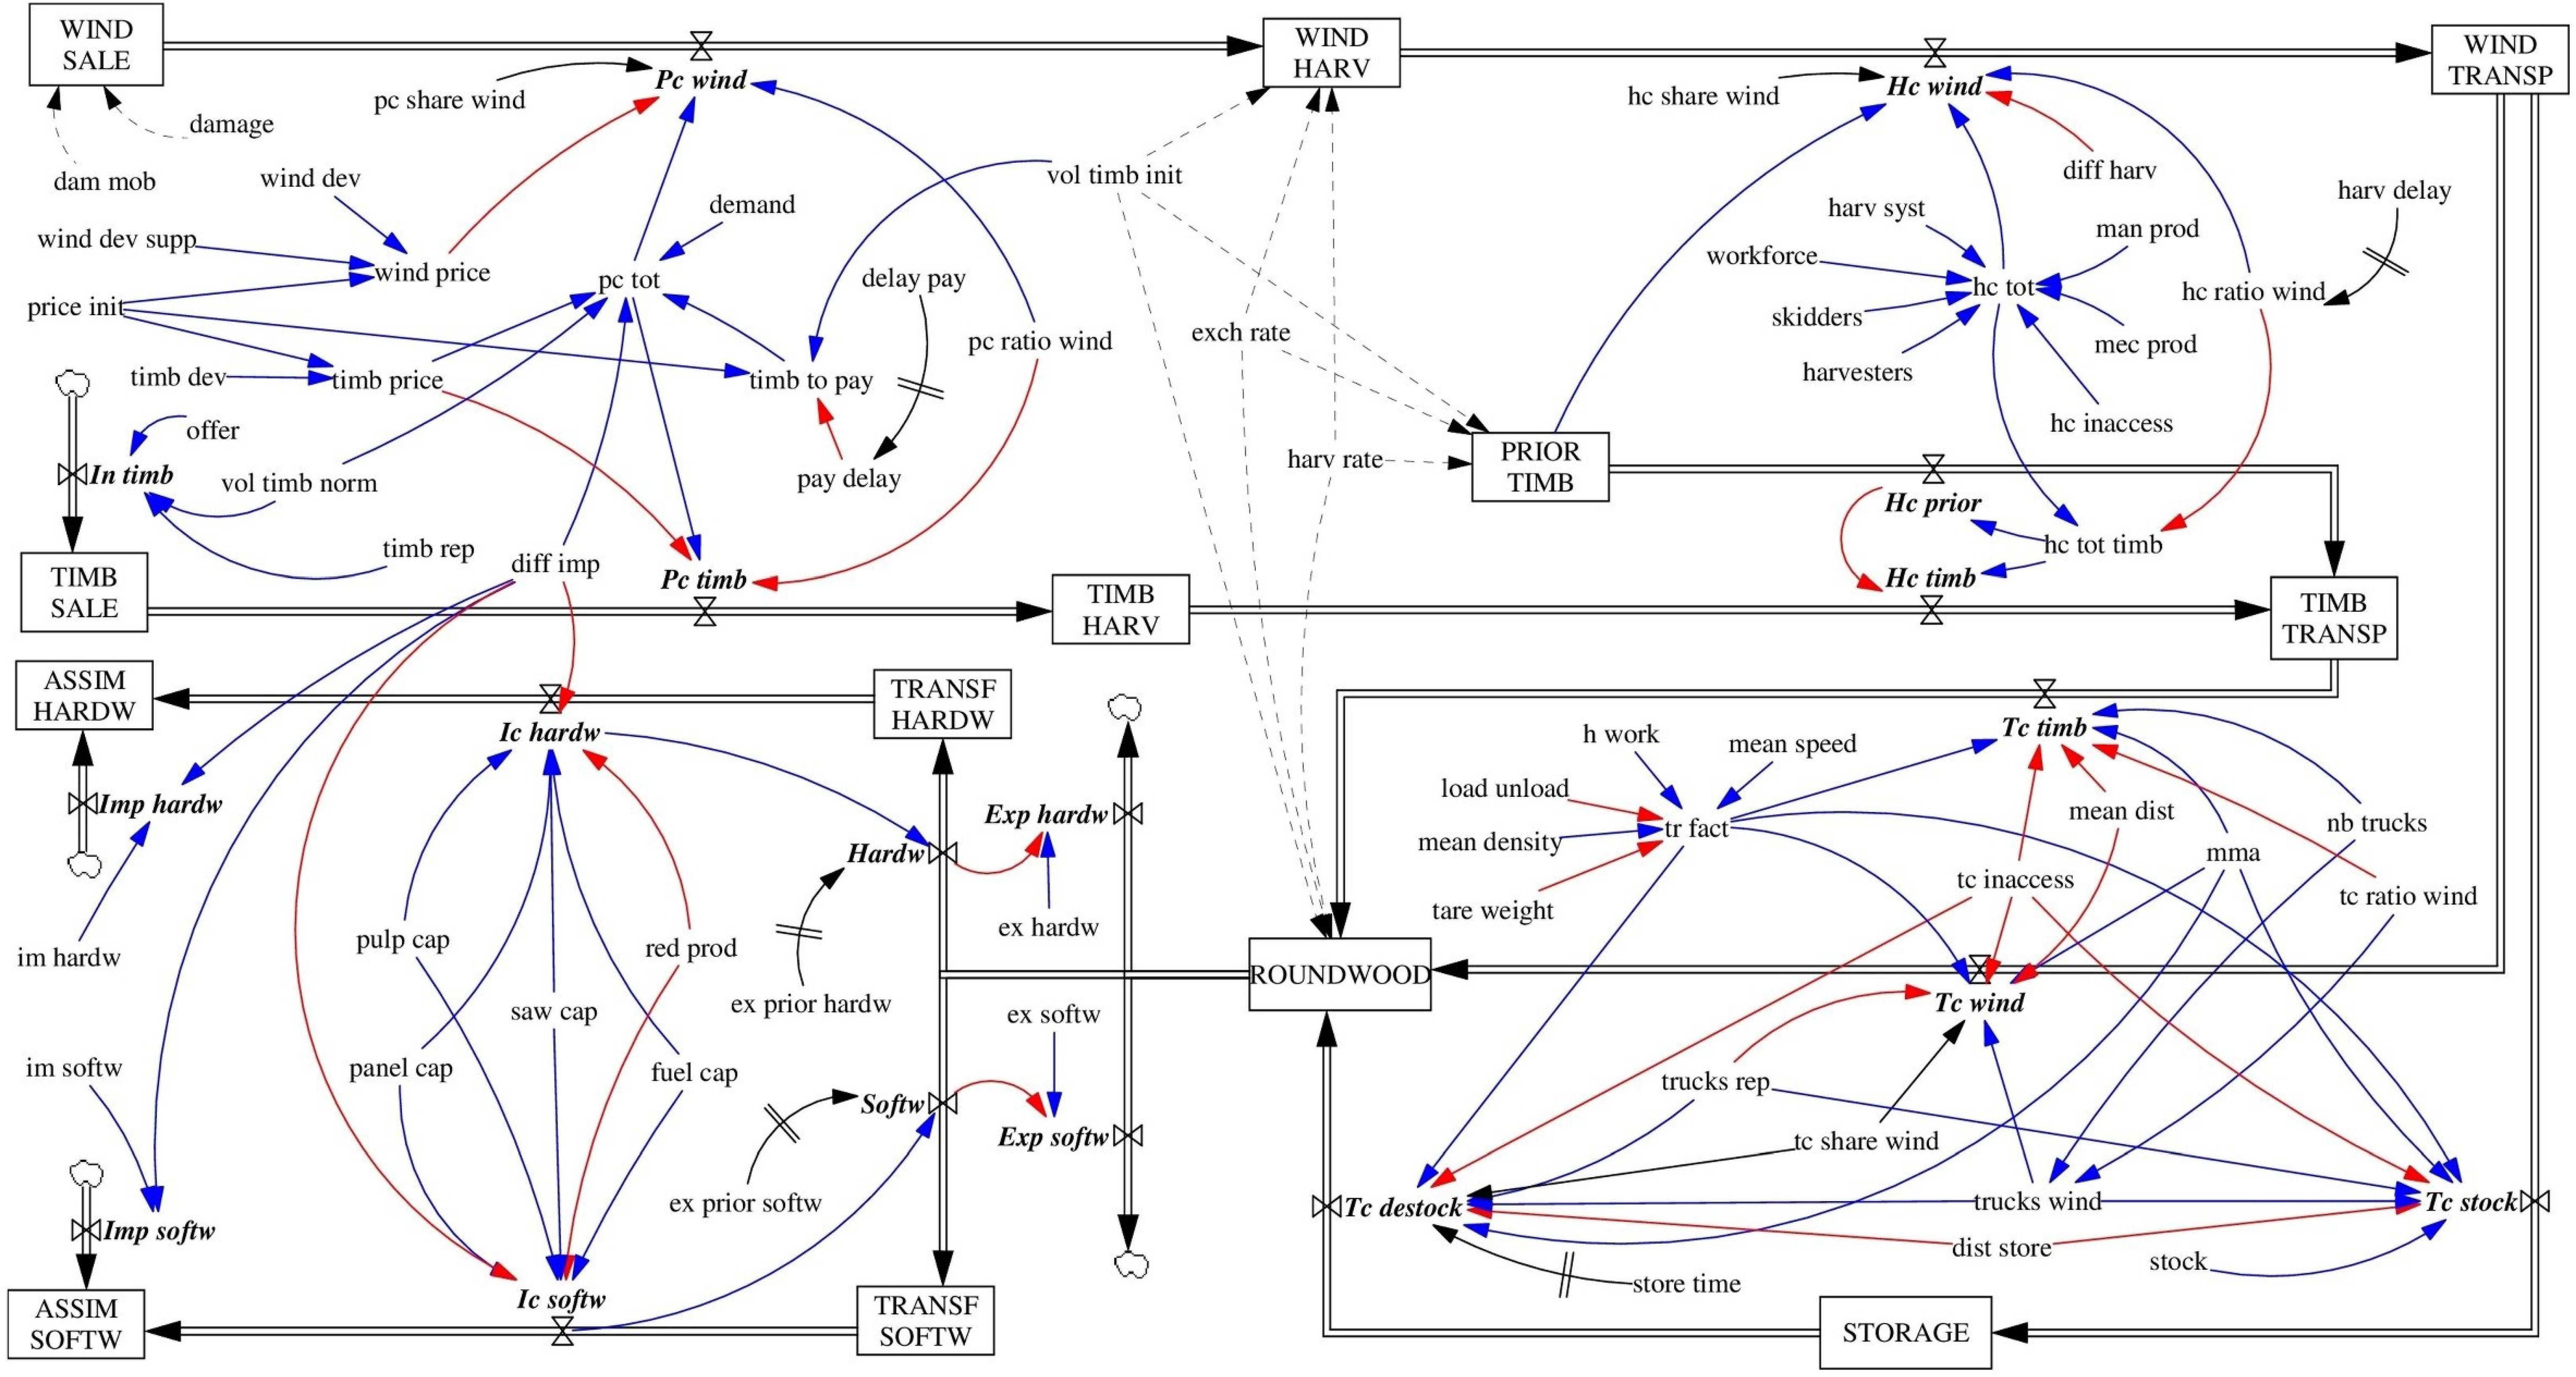
Figure 2 presents the WALFORM model derived from the previous conceptual representation using System Dynamics generic notations. Boxes represent stocks; hourglasses with double arrows represent flows (in italic and bold), and all other elements are converters. The model is composed of 13 stocks, 18 flows, and 61 converters (either constant or variable), as listed and described in
Table S1. The simple arrows in
Figure 2 represent the interactions between parameters. Blue arrows indicate a positive influence: the higher the initial converter is, the higher the impacted converter will be. Red arrows indicate a negative influence: the higher the initial converter is, the lower the impacted converter will be. Dashed arrows indicate that the converter determines only the initial value of a stock. Black arrows with delay marks indicate that a time delay may be applied to the targeted converter. For instance, the activation of payment delays (delay pay) may block or lower the associated converter (timb to pay) for a pre-determined period.
The WALFORM model is an open system: unlike feedback systems, it is not influenced by its past behavior. The capacities (flows) are the only parameters that determine stock levels. However, the levels of stocks downstream from the system are a function of the upstream stocks; thus, the real value of flows will be the minimum between the capacities and the amount of wood (windfalls or timber) available in the stocks at that time. The mathematical relations between stocks and flows and between flows and converters are presented in
Table S2. Euler integration is used to solve the equations. Due to the complexity of these relationships, the sections below will focus on the converters of the four modules and their positive or negative influence on the capacities.
Figure 1.
Conceptual representation of the regional forest-wood chain.
Figure 1.
Conceptual representation of the regional forest-wood chain.
Figure 2.
WALFORM model structure and parameters. Boxes represent stocks, double arrows with hourglasses flows (in italic and bold). Blue (red) arrows indicate a positive (negative) influence between converters. Dashed arrows indicate that the converter determines only the initial value of a stock. Black arrows with delay marks indicate that a time delay may be applied to the targeted converter.
2.2. Purchase Module
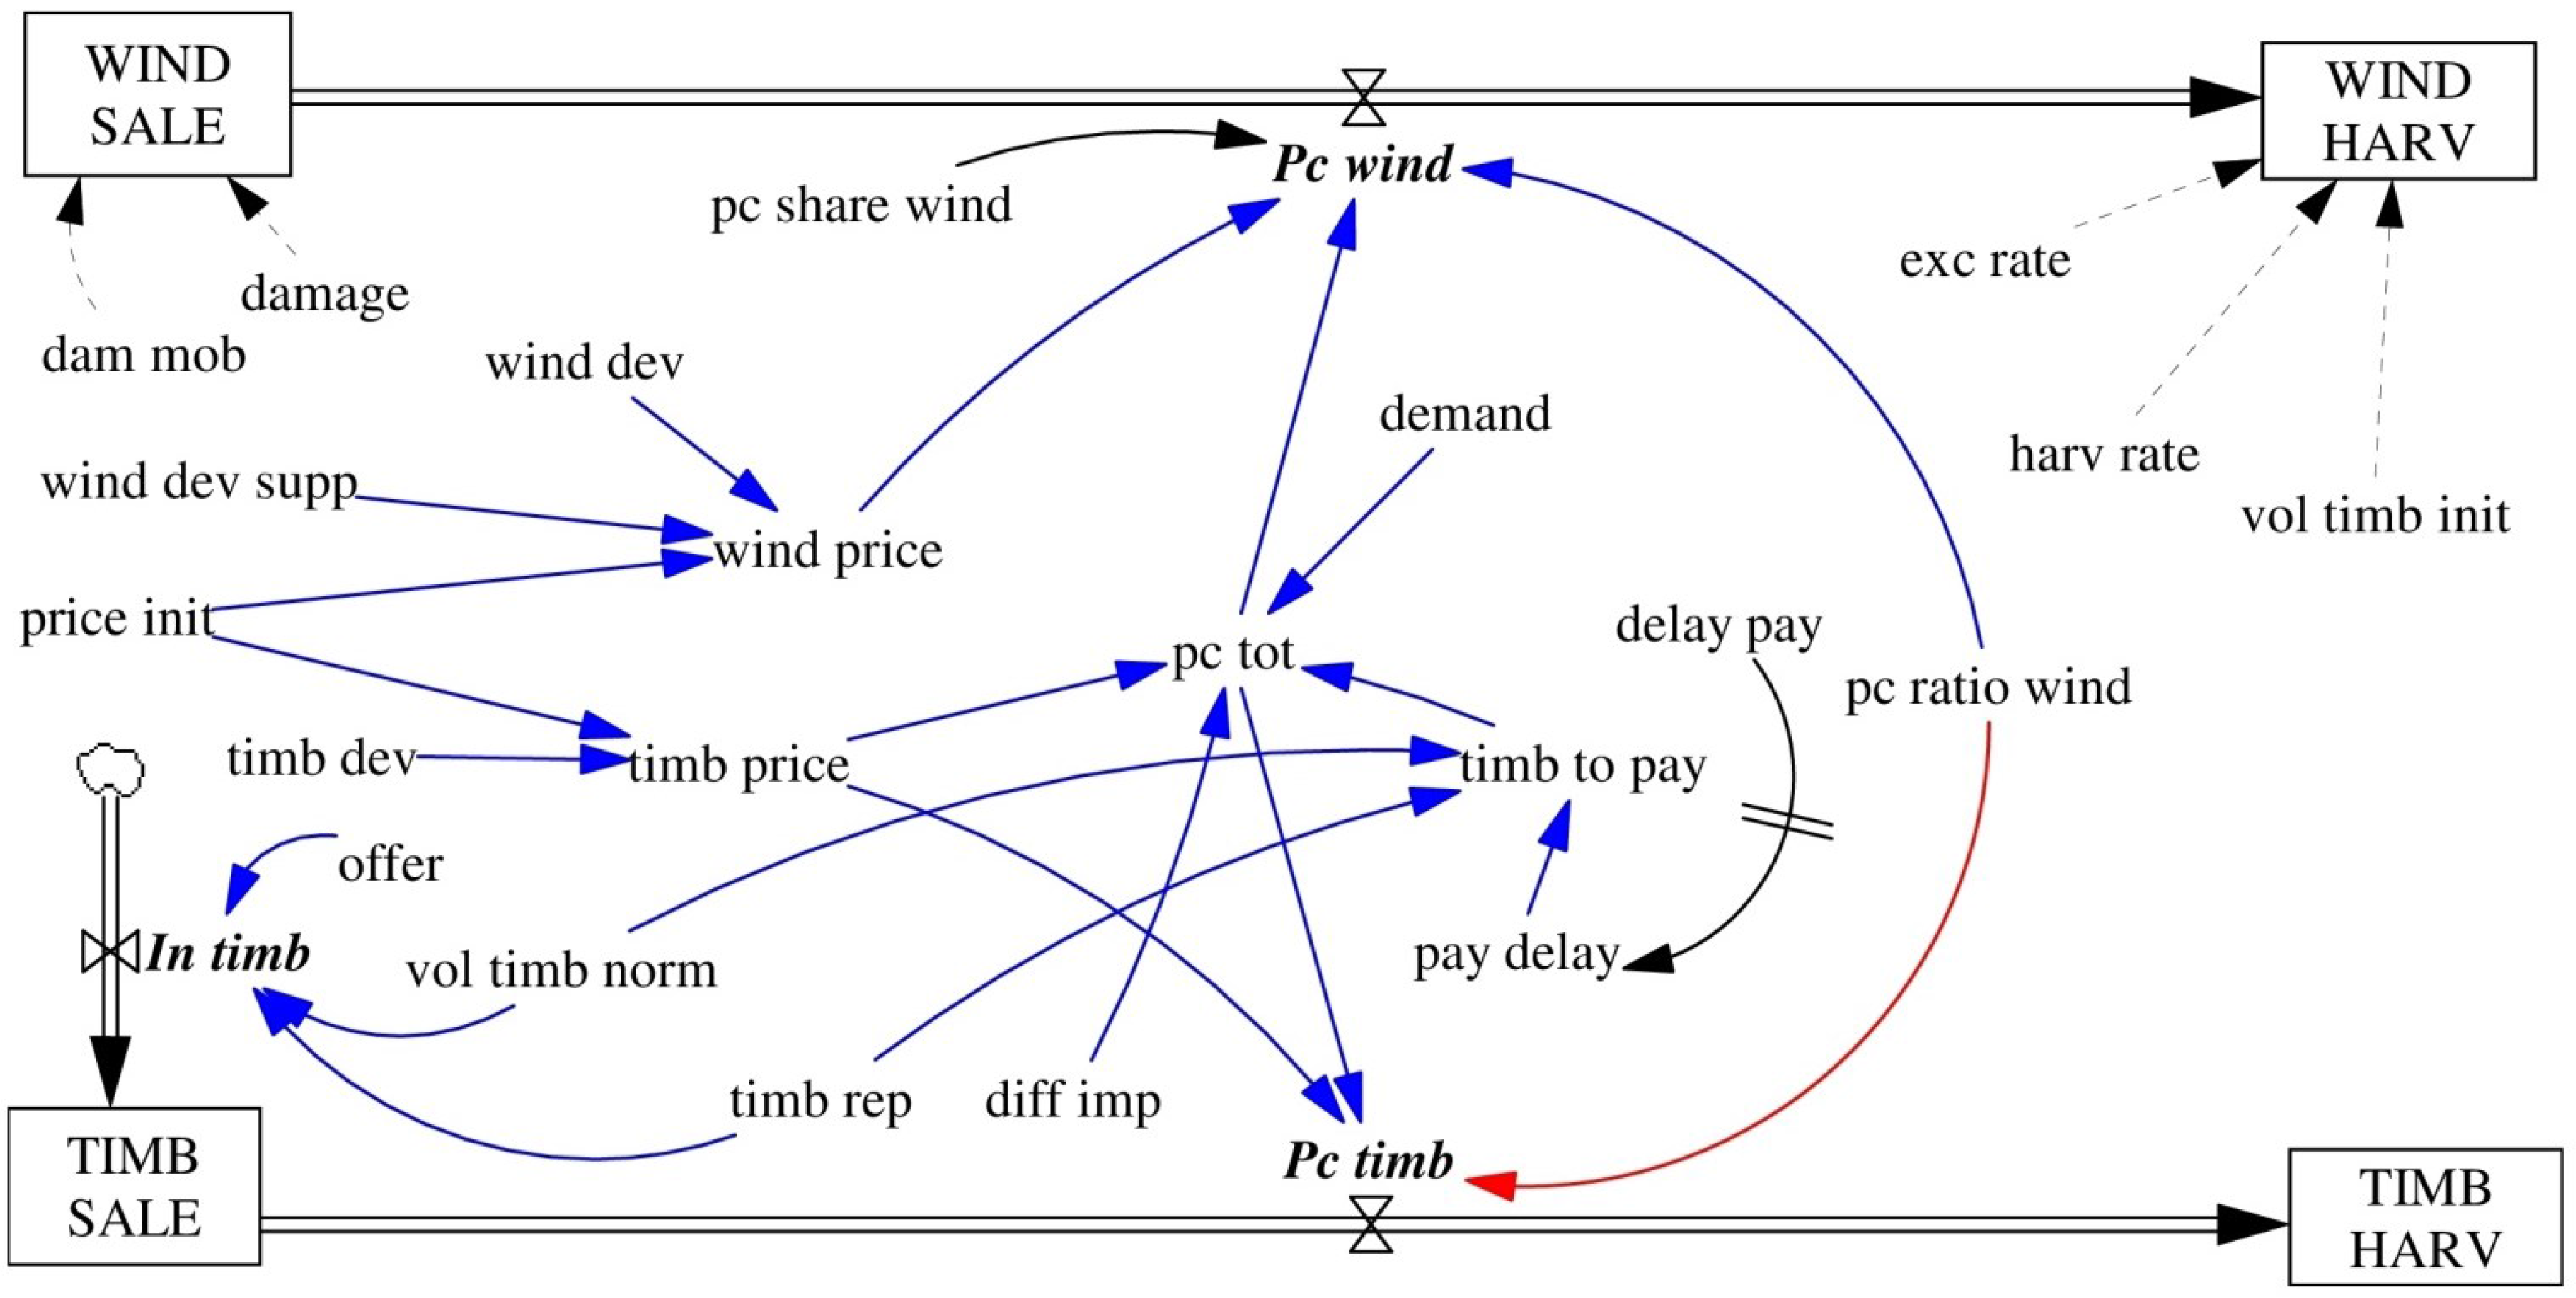
The purchase module (see
Figure 3) depicts the dynamics of windfalls and timber sales. The two main inputs are the volume of damage and the standing timber put on the market. The amount of windfalls to be sold (
WIND SALE) depends on the initial amount of the damage (damage) and the damage mobilization rate (dam mob), which reflects the proportion of windfalls inaccessible or economically unprofitable to harvest. In the case study on Wallonia, a quick damage assessment methodology enables an estimation of the amount of damage within 72 h to feed the model [
35]. The amount of timber put on the market (
TIMB SALE) is a function of the annual repartition of sales (timb rep), of the average annual sales (vol timb norm), and of supply variation (offer). The offer parameter reflects the willingness to put more or less timber on the market during the crisis period. It must be defined for each group of species and for separate periods of 12 months. It is an aggregated value, meaning that it reflects the average behavior of public and private owners.
Figure 3.
Purchase module.
Figure 3.
Purchase module.
The purchase capacity (pc tot) is the global financial capacity for buying wood, expressed in monetary terms. It is affected mainly by prices and demand (see
Table S2 for mathematical relations). Prices after the storm are obtained by applying a devaluation rate (wind dev, timb dev) to the initial prices (price init), which are stumpage prices’ mean current value for each group of species, obtained through statistical methods [
36]. Additional devaluation may be applied to windfalls from the second year (wind dev supp). The purchase capacity assigned to windfalls (
Pc wind) and timber (
Pc timb) is chosen by the user (pc ratio). The government may exceptionally authorize a deferred payment plan for a limited period in order to temporarily boost purchase capacity (pay delay); here, potential buyers benefit from higher financial capacities in the early months and are allowed to pay off the balance later. Increases and decreases in roundwood demand under economic constraints are also taken into account (demand). In the model, variations among imports (diff imp) directly affect purchase capacity, as reduced (increased) imports are thought to be compensated for by a higher (lower) demand for local resources. Regardless of purchase capacity, public authorities may foster exchanges between timber already bought and windfalls in order to redirect prior investments. This proportion will depend on the predetermined exchange rate (exch rate) and on the amount of timber sold before the storm (vol timb init) and not yet harvested.
2.3. Harvesting Module
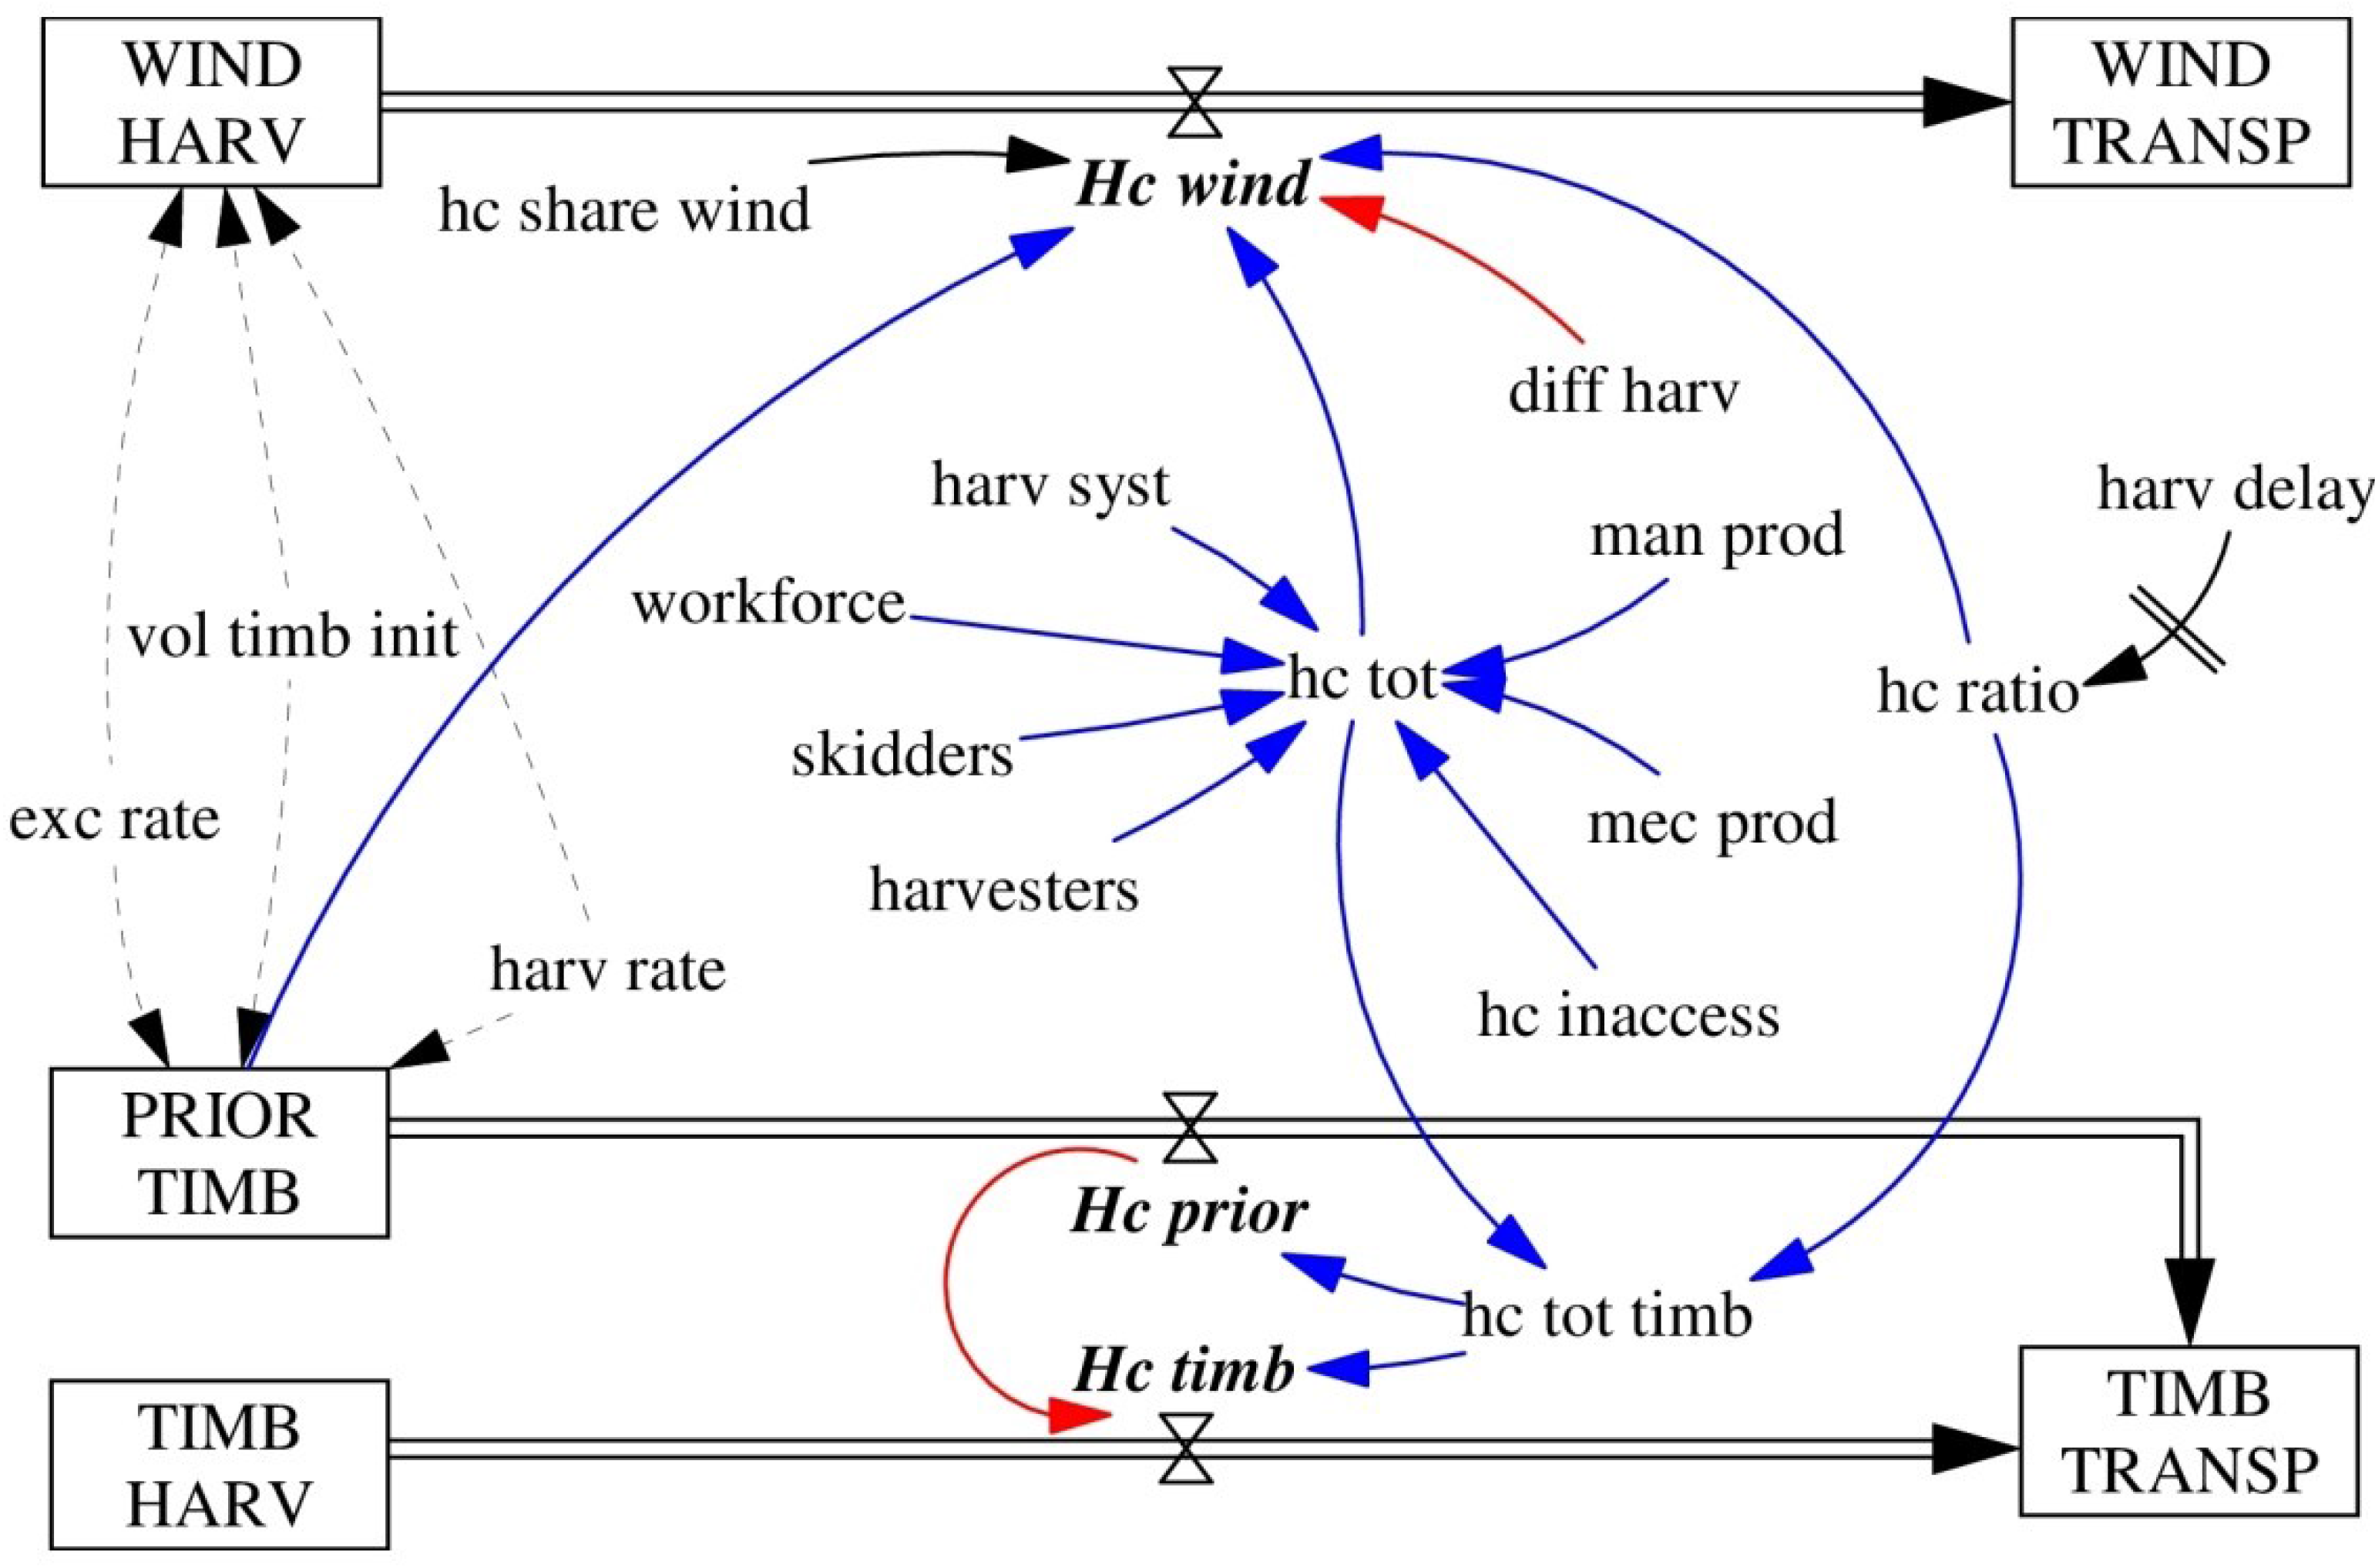
The harvesting module (see
Figure 4) focuses on the harvesting operations within the forest-wood chain. Upstream stocks are amounts of wood sold that must be harvested; downstream stocks are amounts of wood harvested that must be transporter to either storage terminals or industrial sites. The volume to harvest in forest areas is still divided between windfalls and standing timber at this stage, as harvesting systems and productivity differ in both cases. The module also includes the amount of windfalls exchanged with timber and the timber sold before the storm (
PRIOR TIMB). Again, public authorities may extend harvesting delays (harv delay) for a limited period to increase the windfalls harvesting rate.
Figure 4.
Harvesting module.
Figure 4.
Harvesting module.
Harvesting capacities relative to windfalls (Hc wind) and timber (Hc timb) are derived from the total harvesting capacity (hc tot). The overall capacity is a combination of several parameters: the available working force (workforce) and harvesters (harvesters), the manual and mechanical harvest productivity (mec prod, man prod), and the choice of harvesting systems (harv syst). For example, in damaged stands, mix harvesting systems are frequently required to ease access through entwined trees. This global capacity is pooled and redistributed according to strategic choices (hc ratio). For windfalls, a reducing factor (diff harv) is applied to reflect the more difficult working conditions and the lower productivity in damaged areas. As in the purchase module, a specific distribution of harvesting capacity between each group of species may be simulated (hc share wind). For example, priority may be placed on harvesting the species with a lower natural durability first to prevent them from decaying.
2.4. Transport Module
The transport module (see
Figure 5), focusing on the transportation of wood from forest areas to industrial sites or storage terminals, is a highly strategic link in the forest-wood chain. In this module, windfalls are again distinguished from timber products, under the hypothesis that there are no economic reasons to store undamaged timber on storage sites. However, the level of roundwood stock is the sum of windfalls and timber volumes brought to industrial sites. If storage is activated, the maximal amount to store (stock) and the minimal storage time (store time) must be defined. Transport from storage locations to industries will not be possible if the minimal storage time is not reached. Nevertheless, storage is an option and can be bypassed in the model.
Figure 5.
Transport module.
Figure 5.
Transport module.
The specific transport capacities (Tc wind, Tc timb, Tc store, Tc destock) are functions of several parameters: the number of trucks, the maximum mass authorized for the trucks (mma), the mean distance of transport from either forests to industries (mean dist) or forests to storage terminals (dist store), and the truck productivity factor (tr fact). The quantity of trucks available for each operation is predetermined by the user. All of these parameters must be determined for both normal and crisis situations, as specific authorizations may be delivered for limited periods to boost the transport capacity (e.g., to increase the maximum mass authorized for trucks or public incentives to resort to foreign haulers).
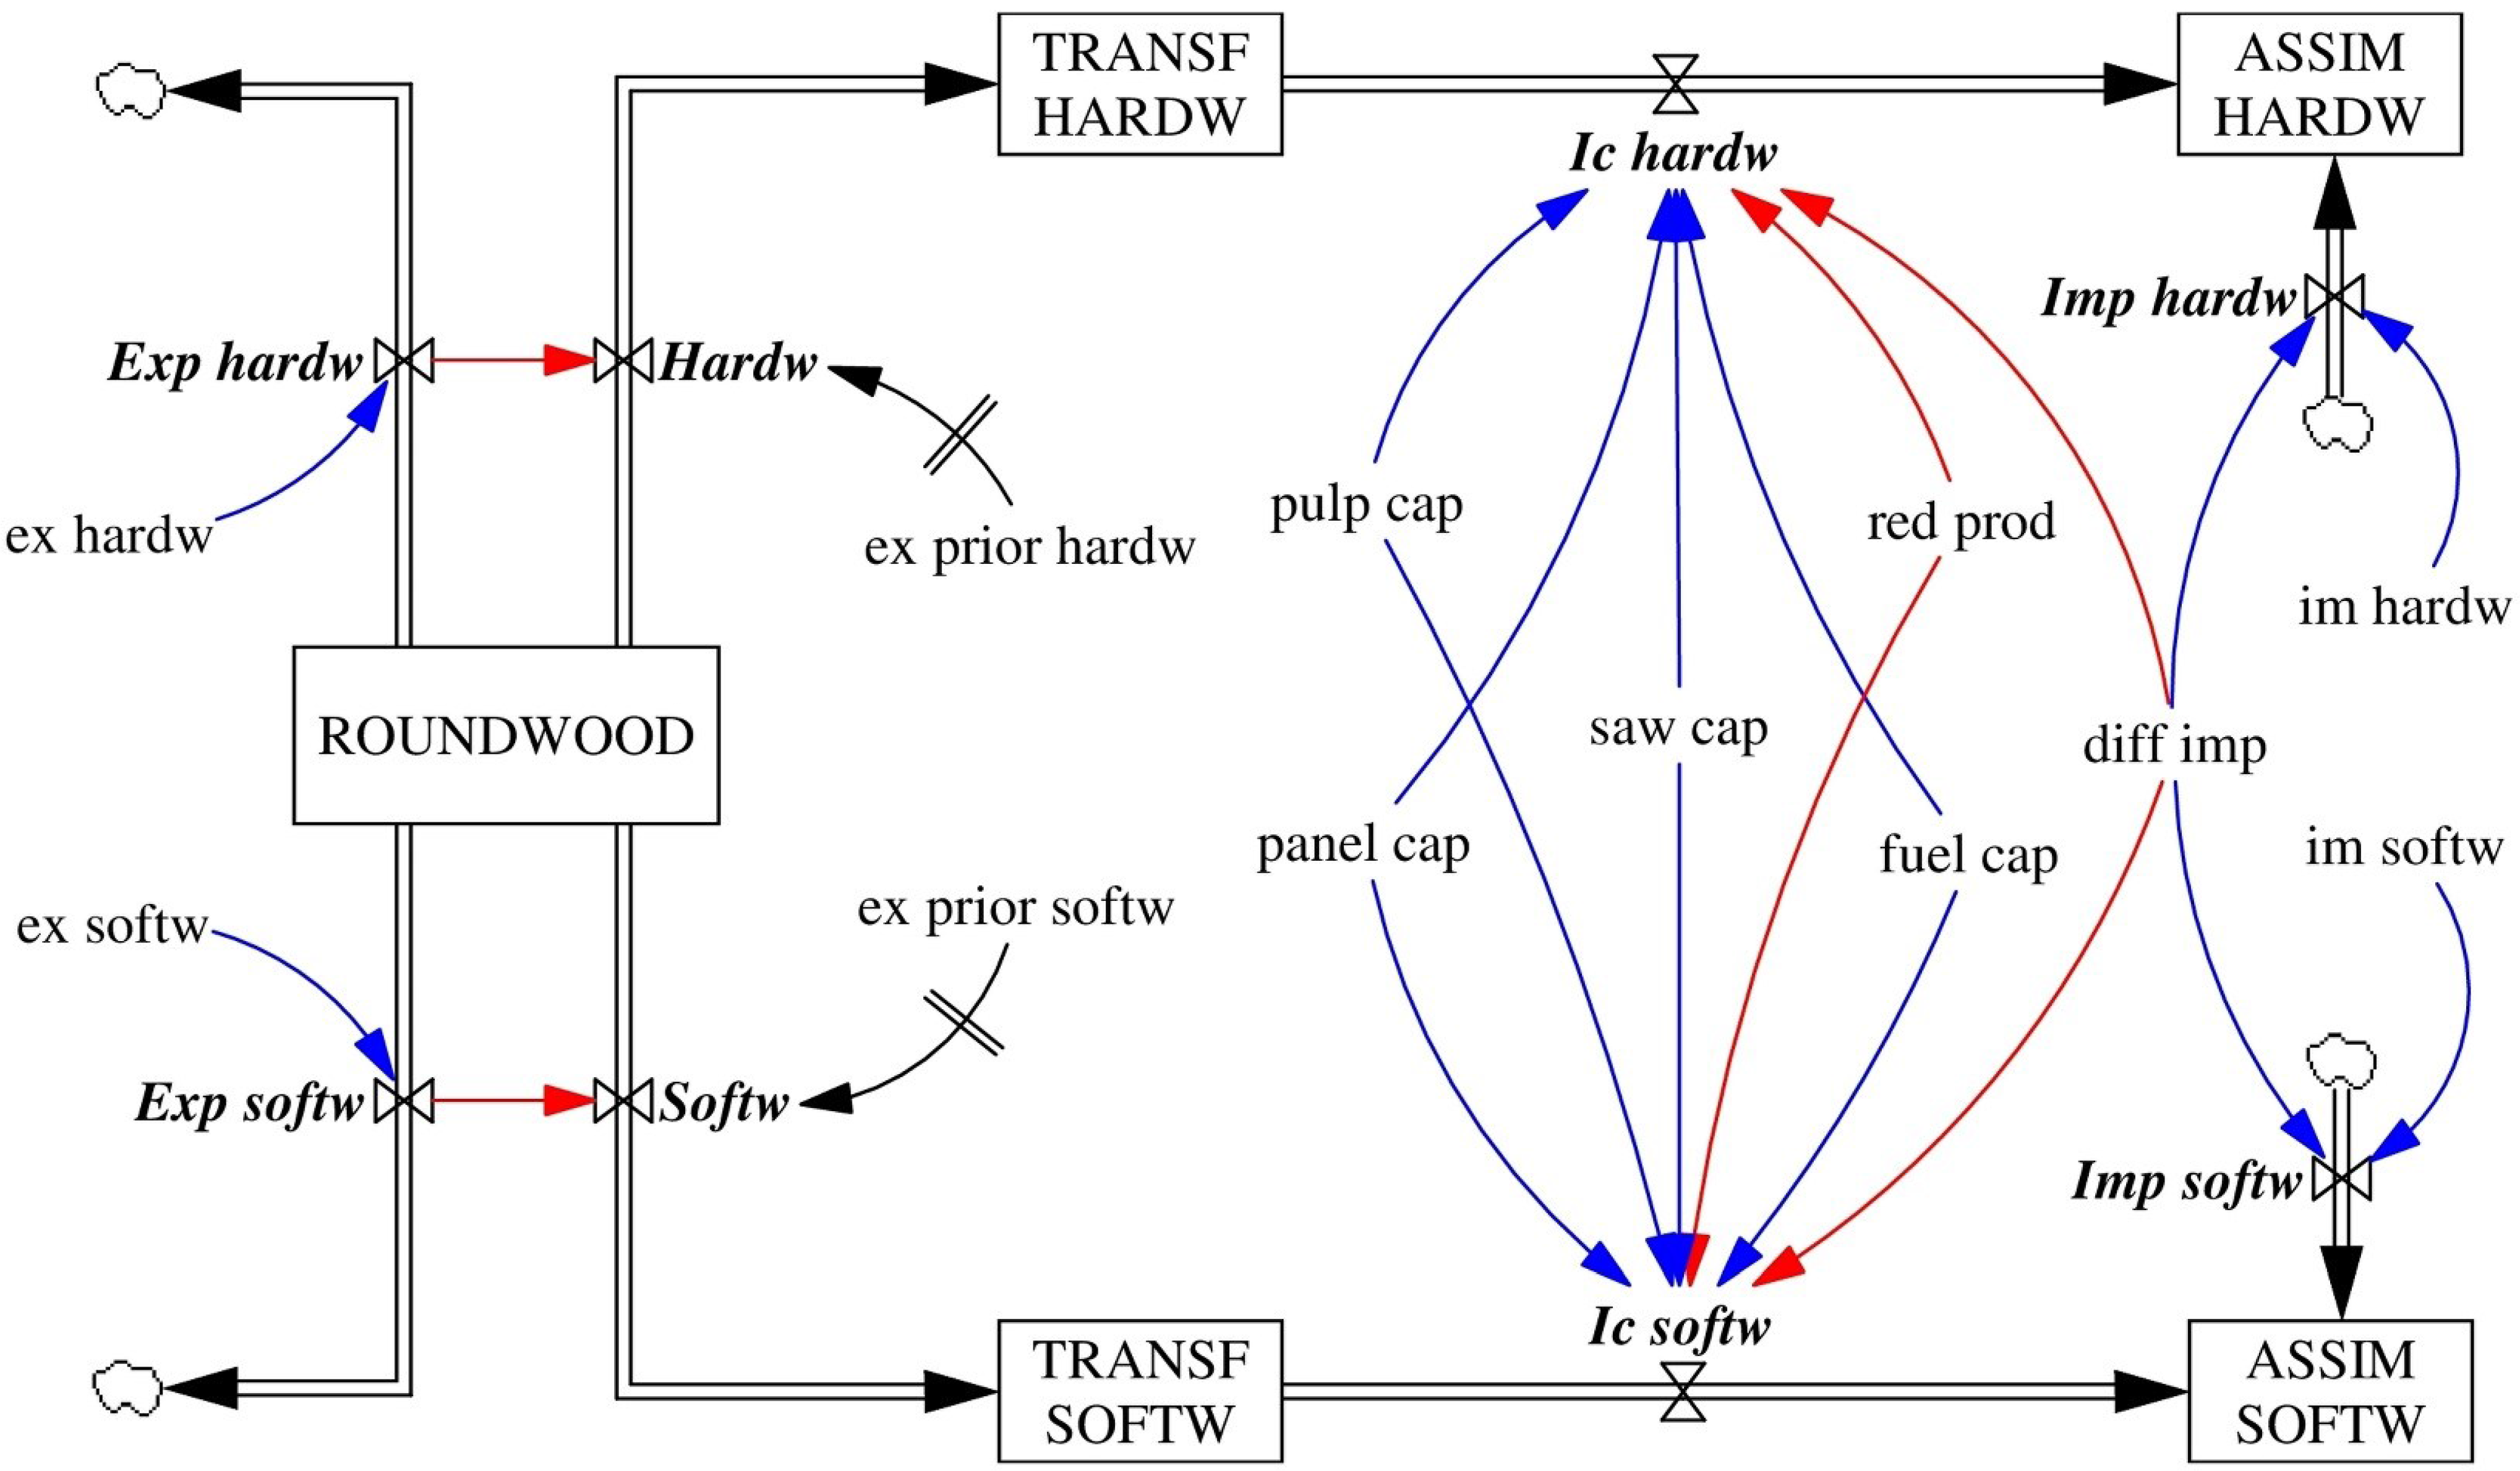
2.5. Industry Module
The industry module (see
Figure 6) represents wood consumption by the primary timber industries (sawmills, paper mills, wood panel manufactures) and the fuel wood sector. In this step, the groups of species are aggregated into two types of raw material: softwood (including spruce and other softwood species) and hardwood (beech and other hardwood species). Exporting flows (
Exp hardw, Exp softw) drain roundwood out of the system, while importation flows (
Imp hardw, Imp softw) add volumes at the end of the process. Industrial capacities for hardwood (Ic hardw) and softwood (Ic softw) are obtained from specific sector capacities (saw cap, pulp cap, paper cap, fuel cap).
Figure 6.
Industry module.
Figure 6.
Industry module.
2.6. Implementation and Calibration
The model was implemented in Excel VBA (Visual Basic for Application 6.3). Excel software seems an appropriate trade-off among accessibility to a wide public, the possibility of designing user interfaces, the power of calculation, and programming interface. The model simulates a 60-month period after a storm event, with a time step of one month. It was calibrated for the regional forest-based sector of Wallonia with data collected through an intensive literature review and interviews with stakeholders. Given normal market conditions, without storm damage, a high degree of agreement between simulated and observed data has been obtained using expert knowledge. For some aspects of storm damage management, comparisons using annual statistics for the forest-based sector were made to validate the model. Feedbacks from previous storm crises in other regions also provided data specific to windthrow crises that could be used after verification. Unfortunately, no complete historical data were available in Belgium with which to validate entirely the model integrating storm damage by comparing its behavior to real crisis dynamics. Nevertheless, the match between model results and real system behavior after a storm was verified via expert knowledge.
2.7. Sensitivity Analysis
As mentioned, the model is not intended to give a precise stock value but to compare crisis management scenarios (in a “what-if” analysis). Due to the model’s limited validation process, however, it was essential to determine the optimal level of precision needed when gathering data and assess model robustness through the relative influence of parameters varying over a certain range on the end result [
37]. To this end, sensitivity analyses were carried on in each module and on all parameters. A selection of studied parameters is presented in
Table 1. For each selected parameter, the calibration value that gave the best fit between the simulated and real world was changed by ±10% increments while the other variables were left unchanged. Differences up to 15% between extreme values were considered significant [
38]. For converters with values that are functions of several variables, we first calculated the impact of a ±10% change on the initial value and then assessed how the error spread over the simulation period.
Table 1.
Effect on model indicator of increasing or decreasing the selected parameters by 10%. Results express the difference from the reference state. The sign (-) reveals an under-estimation. Figures in bold indicate a significant difference (over 15%) between extreme values.
Table 1.
Effect on model indicator of increasing or decreasing the selected parameters by 10%. Results express the difference from the reference state. The sign (-) reveals an under-estimation. Figures in bold indicate a significant difference (over 15%) between extreme values.
| Parameter | Module | Indicator | −10% | +10% |
|---|
| price init | Purchase | Time to sell all windfalls | - | - |
| Unsold timber after 60 months | - | - |
| wind dev | Purchase | Time to sell all windfalls | −20% | 7.7% |
| Unsold timber after 60 months | −14% | 11.5% |
| demand | Purchase | Time to sell all windfalls | −4% | 4% |
| Unsold timber after 60 months | 40% | −48% |
| offer | Purchase | Time to sell all windfalls | - | - |
| Unsold timber after 60 months | −44% | 44% |
| harvesters | Harvesting | Total harvesting capacity | −8% | 8% |
| Windfalls harvested | −8.7% | 7.9% |
| Total volume harvested | −7.7% | 6.8% |
| mec prod | Harvesting | Total harvesting capacity | −8% | 8% |
| workforce | Harvesting | Total harvesting capacity | −2% | 2% |
| man prod | Harvesting | Total harvesting capacity | −2% | 2% |
| dist store | Transport | Time to store | −4% | 4% |
| tr fact | Transport | Round wood transported to industry | −7.8% | 7.8% |
| nb trucks | Transport | Round wood transported to industry | −8% | 7.8% |
| im hardw | Industry | Local hardwood processed | −1.2% | 1.2% |
| ex hardw | Industry | Local hardwood processed | 8% | - |
Sensitivity analysis results show that estimated stumpage prices have no influence on the system stocks but influence only the cash flow between owners and merchants and the total value of sales. Contrariwise, the devaluation rate applied to windfalls may have a significant impact on the amount of sales: the higher the devaluation, the faster the sales of windfalls, but the relation appears not to be linear. Changes in demand and offer do not influence the time required to sell windfalls but have huge impacts on the stock of unsold timber after 60 months. Thus, if decision-makers focus only on windfalls mobilization, those parameters are not crucial; when considering the impacts on forest owners, however, they should be determined carefully.
In the harvesting module, the impacts of ±10% variation are less obvious. The impacts of changing mechanical harvesting capacity (i.e., number of harvesters or productivity) on the total harvesting capacity may be explained by the greater contribution of mechanical harvesting relative to that of manual harvesting. On the other hand, errors in the estimation of manual harvesting capacity (i.e., number of fellers or productivity) have a marginal impact on total harvesting capacity. In the transport module, changes of ±10% in the average distance between forest areas and storage terminals do not significantly impact the time needed to store windfalls. This result does not indicate that this distance is optimal (see below), but it does reveal that error in its estimation has no influence on the model. Conversely, variations in transport capacity (i.e., number of trucks or productivity) influence the total amount of roundwood transported to industries.
As mentioned, the sensitivity analysis results are also useful for evaluating which parameters are main influences on the stocks and fluxes of the system. For instance, if their influence were strong, decision-makers would know that those parameters might be key levers of the system when using the DSS based on the model (see section below). The exercise was made for the average distance between forest areas and the storage terminals parameter (dist store). Starting from a reference of 30 km, the sensitivity analysis showed no significant impact of a 10% decrease or increase (see
Table 1). However, when larger or smaller distances were taken into account (
i.e., 10, 20, 40, 50 km), the time required to store the targeted amount of windfalls varied between −17% (10 km) and +20% (50 km). The mean distance between storage places and forest areas thus appears to be a key element of wood storage policy after a storm. Such thorough analysis should be used to improve forest-wood chain functioning before the next storm, with the limitation that the state of the system is constituted by the dynamic combination of 61 converters and 18 flows; thus, merely optimizing each individual parameter will not lead to the perfect scenario for all stakeholders.
4. Discussion and Conclusions
Decision makers in storm crisis management often lack the tools for evaluating the consequences of their strategic decisions. Crisis measures that appeared efficient when considered in isolation have actually been counterproductive because the forest-based sector was not considered from a systemic point of view, indicating the need to develop a new type of DSS able to reproduce the dynamics of forest operations (e.g., sales, harvesting, transport, transformation) in a disrupted market situation. The WALFORM model developed and calibrated for the Wallonia region in Belgium serves as the basis of this DSS. Based on the system dynamics modeling approach, the WIND-STORM tool focuses on system behavior rather than numerical results [
33]. The DSS, based on 61 parameters, can simulate a wide range of crisis management scenarios. A graphic user interface and advanced database management capabilities for data access, key requirements for an efficient DSS [
39], have been developed.
The results of the case study presented in Chapter 3 suggest that the DSS reflects the variations among scenarios quite accurately. More generally, the DSS provides a wide spectrum of information to the end-user, allowing all types of scenario to be simulated. WIND-STORM can also be used prospectively. Simulations should be run between two crises to identify which key elements to focus on when the next calamity occurs and find structural solutions for the system bottlenecks. The DSS could be optimized by automating the simulation phase to generate a portfolio of scenarios derived from the initial level of damage and then selecting those that correspond to the decision-makers’ options. However, a fully optimized process is not possible because qualitative criteria such as political, social, environmental, and ethical considerations are also part of the decision process. Though the DSS offers decision-makers a wide range of possibilities, it cannot provide the optimal scenario for storm damage management.
This paper does not pretend to identify new storm damage management options, but it can foster systemic approaches in decision-making. In this field, this study’s proposed use of system thinking and methodology supported by a modeling tool is novel. Reports and analyses on storm event management [
40,
41,
42,
43] have often mentioned a lack of coordination between forest-based stakeholders and decision-makers. The joint use of a DSS in a crisis unit forces decision-makers and forest stakeholders to share opinions and to compromise, thus fostering successful crisis management.
Nevertheless, this approach has some weaknesses. The first concerns the model development and the necessity of representing the real forest-wood chain with a limited number of parameters. This need introduces minor compromises for convenience [
44] and generates unexpected effects. However, sensitivity analyses conducted on selected parameters tend to confirm the robustness of the model outputs [
37]. Nevertheless, model sensitivity should be further investigated to inform end-users of the expected impacts of all parameters on the system. A second drawback is the complexity of the model and the difficulty users may have understanding the mechanisms behind the results [
11]. Decision-makers may not feel confident when using a DSS as a “black box” to produce policy recommendations [
45], as they must explain why and how their decisions are made. According to [
33], a good model is ultimately the one that is used. In other words, if decision-makers cannot follow the reasoning used by the system, they are not likely to understand its output or follow the DSS’ recommendations [
46]. To address this issue, stakeholders were involved in the modeling step [
47], and training was provided to end-users afterwards. Finally, data availability and updates may be another limitation. The use of the DSS must be prepared before a crisis occurs, and the data must be continuously updated by the forest public service, the recipient of the DSS after its development. This need may interfere with the correct use of the tool during emergencies.
Despite these limitations, the DSS could be highly valuable for the forest-based sector if, and only if, the decisional context is appropriate. The search for a well-balanced solution relies on data coming from stakeholders, and false or truncated information will lead to poor decisions. More generally, sound decisions require honesty and confidence among all stakeholders, including public authorities, the forest community (e.g., scientists, practitioners), and actors in the forest-wood chain. Public authorities must keep the global welfare of the forest sector in mind because strategic decisions will be cost-efficient only if they are balanced and satisfactory for all parties. Meanwhile, the role of scientific community is to inspire confidence in the approach—as system thinking is seldom used in forestry—and address methodological concerns. In addition, while computer systems can deal with the structured portion of a problem [
48], the judgment of the decision-maker is required to deal with the unstructured part [
49]. Thus, decision-makers must seek advice from the forest community throughout the decision-making process. This kind of participatory process is also useful for the forest sector as a whole because sound strategies enhances the efficiency of the use of public resources [
50].
Of course, this DSS is just one tool among several that could help public authorities, decision-makers, and operational managers in the aftermath of huge storms. Other critical aspects of storm damage management should be addressed in future works—damage assessment and timber storage, for instance. Damage assessment is very important because the post-storm strategy is based on it. Appropriate methods of collecting data quickly after the calamity are thus needed, as well as IT tools for facilitating data transmission and processing. A tool for supporting the tactical management of storage operations is also very important, as this paper showed that the location of storage terminals and associated transport capacity are key elements of storage policy. Using a Geographical Information System (GIS) to identify potential storage locations before the storm and ideal localizations of terminals after the event could also be very useful. From a regional point of view, Wallonia still lacks the risk assessment tools for predicting the probability of damage in forest areas and producing risk maps with which to inform decision-makers of risk levels. The risk assessment approaches used in bordering countries [
51,
52] should be tested and adapted to regional specifications in order to provide a fully integrated approach to wind-risk management and facilitate the transition from risk assessment to crisis management.


