Case Report

Case Study Report: Community-Based Monitoring Systems for REDD+ in Guyana

Global Canopy Programme, 23 Park End Street, Oxford, OX11HU, UK
*
Author to whom correspondence should be addressed.
Forests 2015, 6(1), 133-156; https://doi.org/10.3390/f6010133
Submission received: 4 April 2014 / Accepted: 26 December 2014 / Published: 6 January 2015

Abstract

:
A fundamental component of initiatives to reduce emissions from deforestation and forest degradation (REDD+); will be the development of robust and cost-effective measuring, reporting, and verification (MRV) instruments for national forest monitoring and safeguard information systems. It is increasingly recognized that community-based monitoring (CBM) offers a positive model for greater participation and engagement of indigenous and forest-dependent communities within a REDD+ framework. Yet plans for CBM within REDD+ MRV systems remain limited, and there are currently relatively few concrete examples of CBM informing national forest monitoring systems. This paper outlines findings from a community MRV project with Amerindian communities in the North Rupununi, Guyana; and demonstrates that a CBM approach can enable key REDD+ requirements: in understanding local deforestation drivers and measuring carbon stocks; and for providing information on safeguards through social and environmental assessments. In addition, the authors discuss community capacity-building on smartphone technology for monitoring as a challenging yet viable pathway for scaling the use and adoption of indigenous knowledge and local skills for REDD+ programs.

1. Introduction

Since its acceptance into the 2007 Bali Action Plan, REDD+, or reducing emissions from deforestation and forest degradation plus the role of conservation, sustainable management of forests, and the enhancement of forest carbon stocks, has become the preeminent focal strategy for climate mitigation and forest conservation. As tropical forest countries adopt and prepare for REDD+, a key priority will be meeting the United Nations Framework Convention on Climate Change (UNFCCC) mandate on the effective participation and role of forest-dependent communities in the design and implementation of REDD+ schemes [1,2]. In addition to accurately measuring and tracking changes in forest carbon stocks/flows, countries are obliged to report on the effectiveness of environmental intervention policies and activities for REDD+ and to assess social, environmental, and governance benefits through safeguard information systems (SIS)—a key requirement in order to access results-based finance from REDD+ [2,3,4].
It is increasingly recognized that involving local communities in forest monitoring can help maximize the efficiency, effectiveness, and equity of REDD+ through multiple pathways. For example, CBM can increase the participation and engagement of local forest-dependent populations in REDD+ by contributing to land tenure reform—for instance, through improved land title recognition—and may stimulate dialogue between stakeholders on conservation interventions [5]. Evidence suggests that involving local stakeholders in monitoring also enhances resource management for REDD+ [6]. In addition, CBM can play an important role in complementing and expanding national forest carbon inventories through the provision of additional data sources on carbon stock measurements. Studies have demonstrated that data collected through CBM can validate remote-sensing estimates to improve the accuracy of national emissions monitoring and reporting [7,8,9,10,11]. Furthermore, CBM can be advantageous in terms of lowering costs of data collection in the longer term, while delivering accurate and reliable data that is comparable to that collected by trained scientists [12,13,14,15,16,17]. The objective of this study is to present the framework in which CBM is being considered as part of a REDD+ Readiness project in Guyana. In this project, CBM is considered for gathering data and analyzing local drivers of deforestation and forest degradation, participatory mapping and ground truthing of satellite imagery, measuring carbon stocks through forest inventories, and providing information on local co-benefits and for safeguard monitoring systems. This report presents a brief description of the methods used and the results obtained so far. Later it presents a discussion of the implications for the design of REDD+ and inclusion of CBM in Guyana and draws the main conclusions.
The experience and knowledge of forest communities can be used through a CBM model to support and improve the quality of data collected for NFMS and help report forest changes in real-time and on a regular basis [13,17]. This is of particular importance in regions where forest change is complex and difficult to identify using remote sensing, such as in small-scale forest disturbance activities (e.g., charcoal extraction) or in the displacement of drivers of deforestation and carbon emissions from one area to another—i.e., leakage [10,17]. Similarly, community members are well positioned for regularly checking and verifying the implementation of long-term REDD+ activities and associated carbon stock changes from forest regeneration and reforestation efforts in forest sites.
Lastly, CBM can provide valuable information on the impacts of REDD+ activities on ecosystem services, biodiversity, and wellbeing—vital for inclusion in future national SIS—which can help inform community responses and engagement with broader REDD+ and landscape scale conservation strategies [18,19,20,21]. However, concerns still remain over the widespread use of CBM in the collection of scientific data on forest monitoring. In particular, practitioners are skeptical that CBM can provide data to a sufficient degree of accuracy and quality, caution that CBM may worsen or precipitate community conflicts, or are concerned that multiple sub-national project-based community monitoring schemes will detract from what they believe should be a nationally managed forest monitoring process [22]. However, in response to the perceived benefits of CBM, early efforts are being made in several countries to integrate and embed these approaches into national REDD+ schemes [10,12,20,23].
CBM has been utilized in many different contexts and for different monitoring purposes (e.g., health) but predominantly on a site-by-site basis. Challenges therefore still remain for scaling up CBM to fit within national forest monitoring systems for REDD+ [10,12]. Current community engagement in sub-national REDD+ projects is also quite low; recent estimates suggest that 48% of voluntary REDD+ projects have no involvement of local stakeholders in forest monitoring and only 12% involve local stakeholders in monitoring biomass, biodiversity, and livelihoods [12]. Key challenges to integration at the national level include a lack of data compatibility between national and community level datasets, and limited interoperability with existing national level, technocratic, and top-down data regimes, particularly in their requirements for carbon stock estimation and reporting [10,13]. Furthermore, the lack of agreed data protocols and guidelines on the use of locally collected data, coupled with perceptions over the lack of accuracy and utility of community-acquired data, have slowed progress on integration [17,21]. Other challenges include securing long-term funding sources for the roll-out and use of CBM at scale; ensuring the approaches taken account for the “free, prior and informed consent” (FPIC) of communities; using local knowledge and building capacity appropriately; addressing issues of validity and robustness of community collected data; and overcoming the significant political obstacles and interests that often undermine local-level participation.
In this context, the findings from this study on existing participatory monitoring efforts underway in Guyana shed light on some of the challenges and opportunities of using CBM within the development of national MRV systems and wider REDD+ policy frameworks.

2. Background

2.1. REDD+ in Guyana

Guyana is a high forest cover and low deforestation (HFLD) country, with 18.5 million hectares (approximately 85%) of forest cover, and a deforestation rate just under 0.08% in 2012 [24]. National forests are, however, increasingly at risk of deforestation and degradation from large- and small-scale mining (accounting for 93% of deforestation), timber extraction, and infrastructure developments linked to these industries. There is also growing pressure from the expanding agricultural sector as a result of increased market integration and trade with neighboring countries, in particular Brazil [24]. Since 2006, Guyana has actively pursued a policy mechanism (REDD+) to avoid deforestation and, in 2009, signed a Memorandum of Understanding with Norway for the implementation of its Low Carbon Development Strategy (LCDS), a national plan to reorient Guyana’s economy and move towards more sustainable extractive industries and forest management. This bilateral agreement established a framework for performance-related finance of up to $250 million over a five-year period until 2015 for the implementation of the LCDS. Avoiding deforestation, promoting low carbon development, and adapting to climate change are the three main pillars of the LCDS, linked to its REDD+ agenda [25].
Underpinning the LCDS are two critical components to achieving effectiveness and equity: (i) the development of a national monitoring, reporting, and verification system (MRVS) to measure and track changes in national forest carbon stocks and determine the level of performance-related payments under the Guyana–Norway agreement; and (ii) multi-stakeholder participation—in particular of indigenous forest dependent communities—in the design and implementation.
The engagement of forest-dependent communities in REDD+ is of particular relevance in Guyana, where 13.9% of national forest area is owned by Amerindian peoples [24]. While the LCDS initially only covers the State Forest Estate and excludes Amerindian and private land, the intention of the Government of Guyana is that titled Amerindian communities will be given the future option of participating in the LCDS and “opting in” to a REDD+ agreement with the government, in return for future benefits as a pro rata share of compensation payments that the country receives [26]. The technical structure of this opt-in mechanism is currently being developed by the Office of Climate Change and the Ministry of Amerindian Affairs [27]. Resulting payments could either be made directly to communities or indirectly through an Amerindian Development Fund.

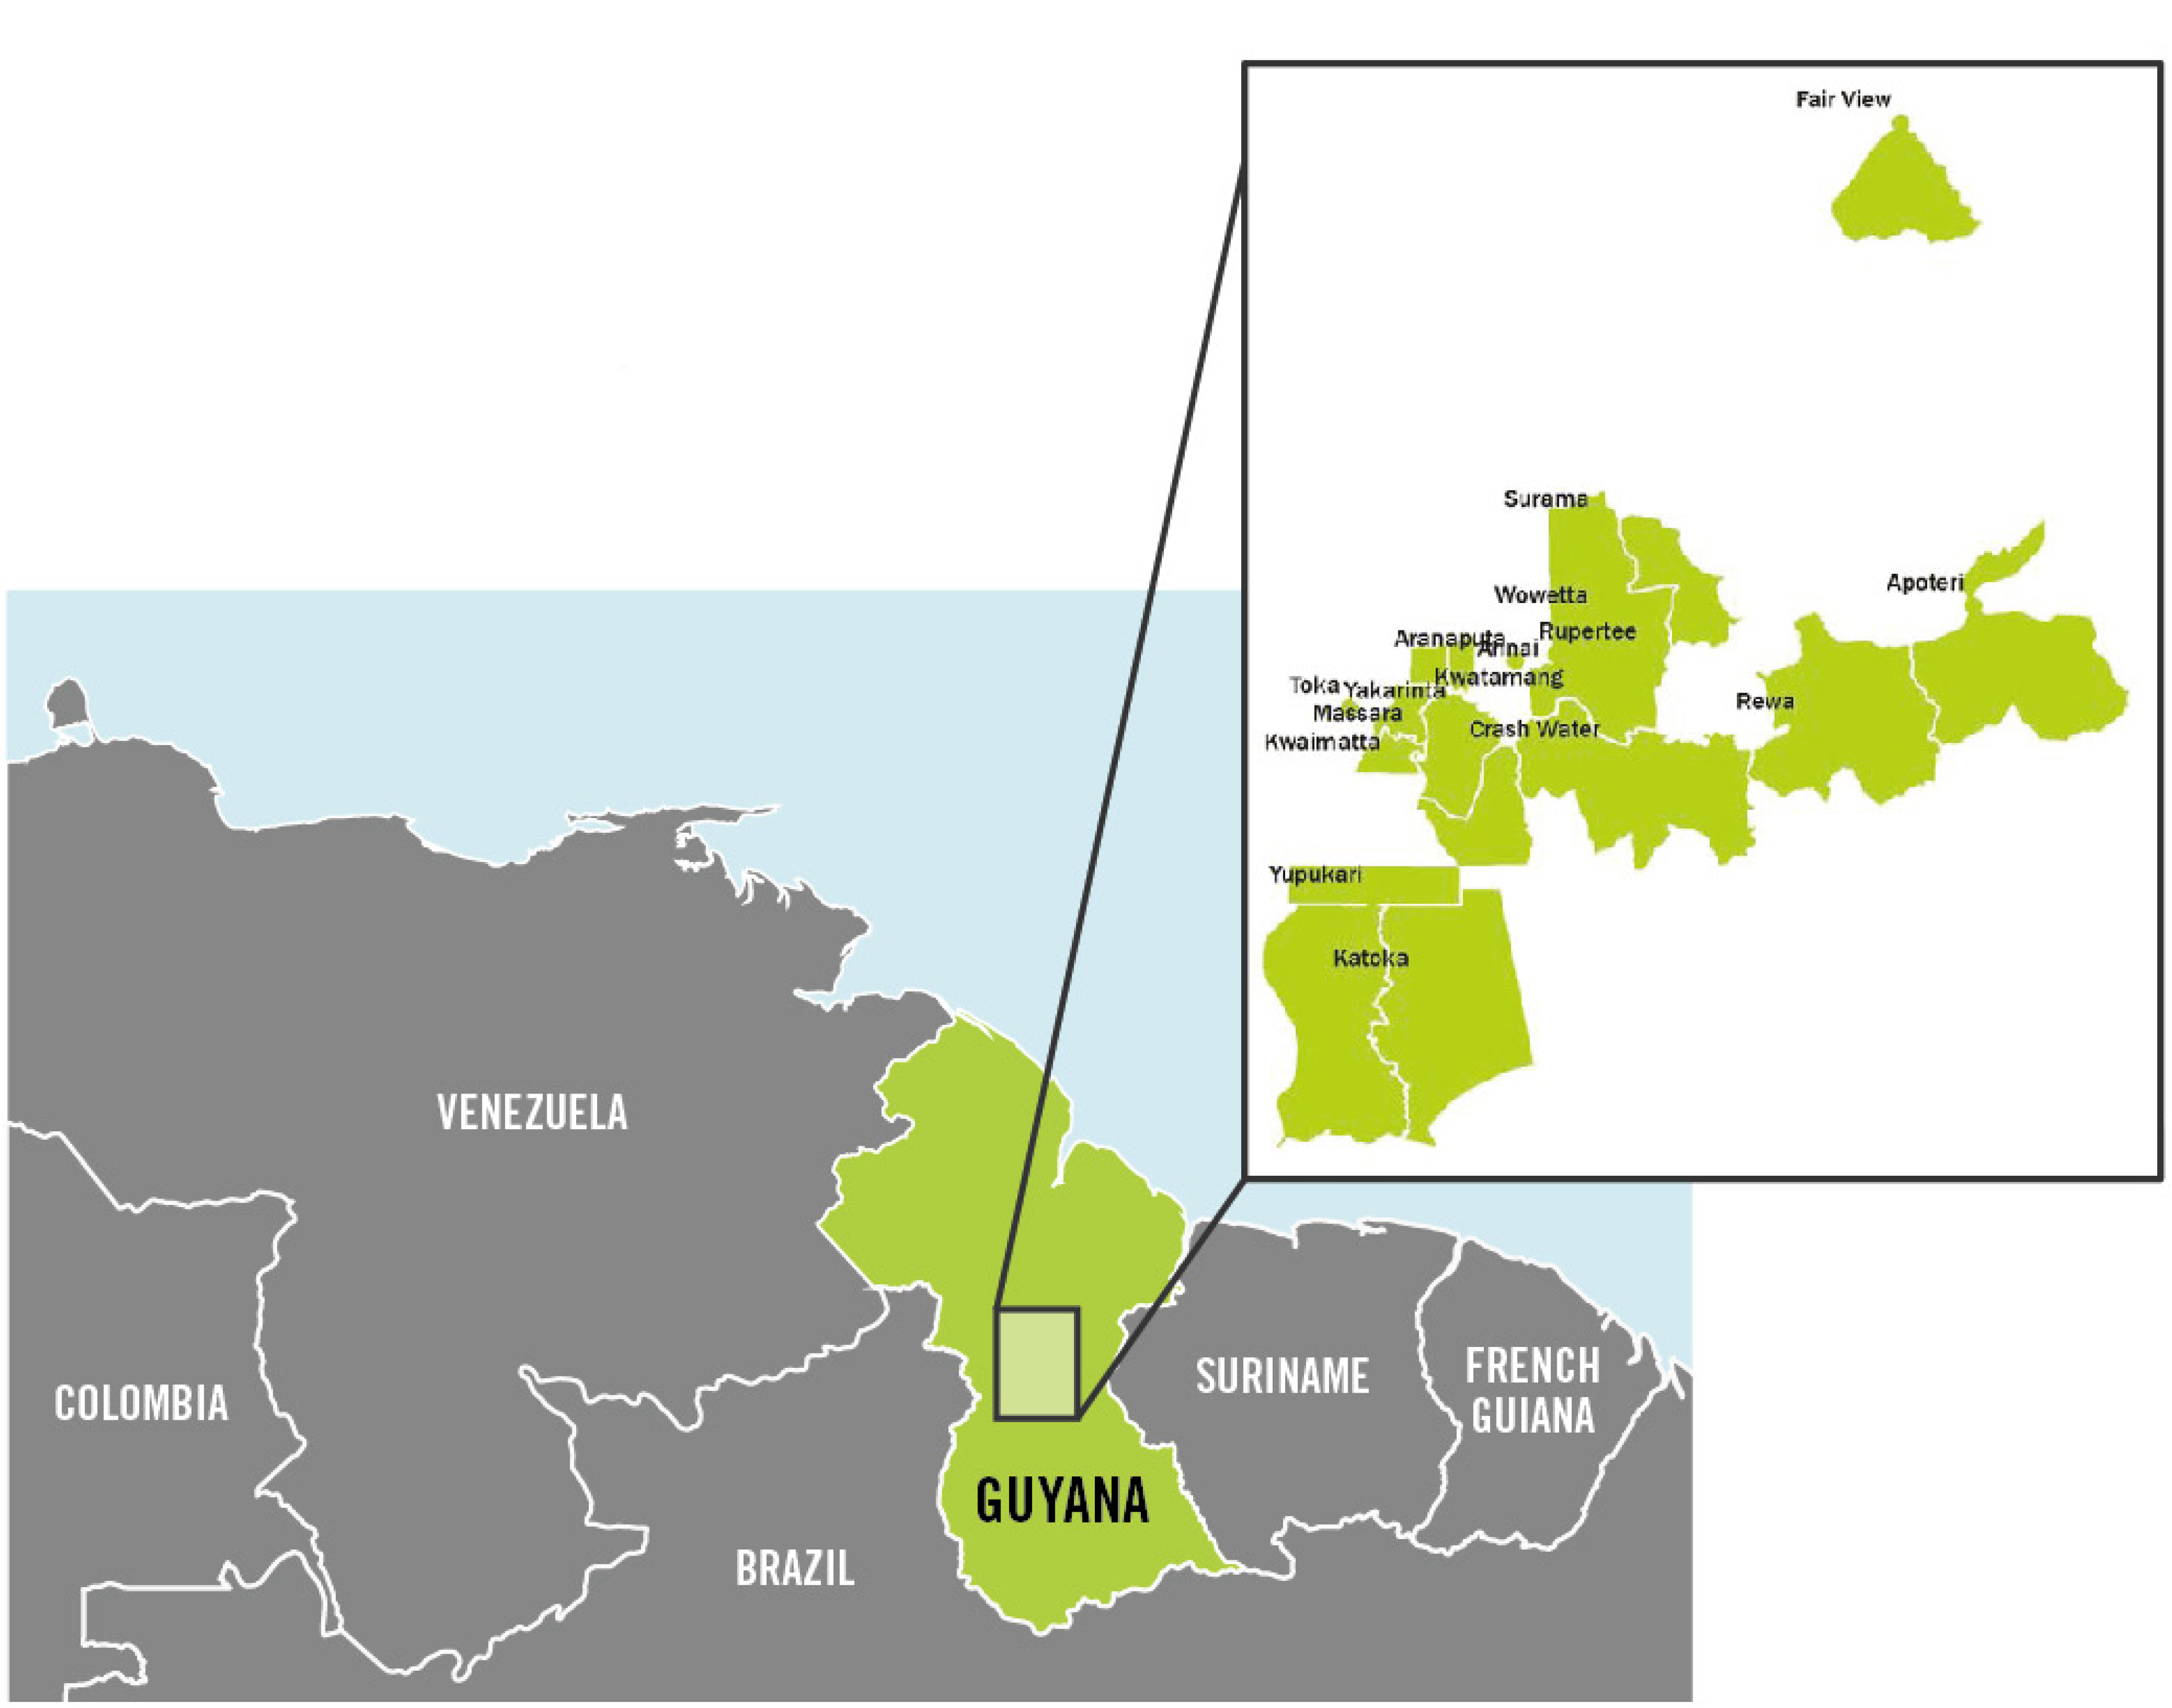
2.2. Case Study/Early Activities

While the framework for ensuring full and effective participation of indigenous peoples and local communities is still unclear, the Guyana Forestry Commission, the government institution responsible for implementing the country’s REDD+ MRV system, has been exploring sub-national participatory monitoring approaches at the community level as part of the national MRVS roadmap [28,29]. Under these commitments, 16 indigenous Makushi communities from the Annai District and surrounding Amerindian lands in the North Rupunini, covering a cumulative area of 311,531 hectares (Figure 1), were selected to pilot practical mechanisms for implementing REDD+ on the grounds that this could inform approaches for national policies on MRV, build local capacity, and generate learning and knowledge on the role of CBM in forest conservation.
The North Rupununi region is located in southwestern Guyana, encompasses areas of high cultural and ecological diversity, and has a landscape mosaic consisting of large areas of old growth tropical forest, savannah, and wetland ecosystems. The sustainability of local Amerindian Makushi livelihoods (e.g., farming, hunting, and fishing) in the region is increasingly threatened by the development of Guyana’s interior, in particular threats from mining and road building and their associated sociocultural and environmental pressures. These developments have increased access to forest resources and formerly remote markets for both communities and external actors, driving a growing community awareness of the need for more sustainable and systematic management of forest resources.
Figure 1. Map of the participating communities in the North Rupununi, Guyana.
Forests 06 00133 g001

3. Methods

In this context, a community MRV (CMRV) project was established in 2010 in collaboration with the North Rupununi District Development Board (NRDDB) (representing 16 Amerindian communities in the region), the Guyana Forestry Commission (GFC), the Iwokrama International Centre for Rainforest Conservation and Development (IIC), and the Global Canopy Programme (GCP) (project facilitators).
Through formally selecting Annai District (five of the 16 communities) as a Community Demonstration Site (CDS) within the national MRVS framework, this collaboration aimed to implement a community monitoring system that could contribute to the national MRV system through producing relevant reports and datasets on local drivers of deforestation and forest degradation, providing carbon stock measurements, and performing ground truthing exercises to help validate remote sensing data. While the results from this work within the CDS were intended to support and inform the development of the national MRV system, they also have clear relevance for community resource management and REDD+ monitoring and safeguards.

3.1. Local Monitoring of Co-Benefits

In addition to these monitoring targets under the Community Demonstration Site, community members from Annai District and the surrounding villages identified and prioritized the collection of additional information on hunting and fishing practices and timber and non-timber forest product harvests, including indicators on the consumption, availability, and perceptions of change in the use of these resources (Table 1). Information on community wellbeing indicators was also collected (Table 2), as well as land use data (e.g., urban areas, hunting grounds, fishing areas, farms, forest conservation areas, burial sites, and tourism zones) and information on community infrastructure, such as roads, schools, and health posts. This data was intended to support local decision-making on natural resource management and development at the village and district level.

3.2. Building Local Capacities

To implement the monitoring system, 32 community members from participating villages and five local project management staff were trained in forest biomass assessment and ground truthing methodologies, data entry, processing, and analysis using GIS software and other tools, as well as in semi-structured interviewing and communication techniques. Data were collected off-line by the 32 community monitors (text, images, area polygons, and point data) using adapted open source Open Data Kit (ODK) software on Android mobile smartphones. Data collection forms and protocols were designed by GCP in partnership with the NRDDB and community monitors. Data were then uploaded from phones to a central computer where they could be analyzed by the local project management staff and project facilitators (GCP, NRDBB, and IIC) using a range of tools: Microsoft Excel, ODK Aggregate and later SMap software, Arc GIS, QGIS, and Google Maps Engine.

3.3. Data Sharing

All data are owned by the communities. A data sharing protocol was developed within the communities to identify which data could be shared with external actors and the process for addressing data sharing requests. Under the Community Demonstration Site, the communities agreed to share the information collected on deforestation drivers, aboveground carbon stocks, and the ground-truthing results with GFC.
Table 1. Sustainability indicators for natural resource use.
Resource type
TimberNTFPFishGameWater
Indicator➢ Number HH extracting timber➢ Number HH extracting NTFP➢ Number HH extracting fish (top extractor HH)➢ Number HH extracting game➢ Water extraction points and sources
➢ Seasonality of extraction➢ Seasonality of extraction➢ Seasonality of extraction➢ Seasonality of extraction➢ Quantity extracted (litres)
➢ Quantity extracted (FBM/month)➢ Quantity extracted (KG/month)➢ Quantity extracted (KG/month)➢ Quantity extracted (unit/month)➢ Extraction methods
➢ Extraction methods➢ Extraction methods➢ Extraction methods (techniques and tools)➢ Extraction methods➢ Proximity of contaminants to water sources (distance)
➢ Species preference and demand (price per species)➢ Species preference and demand (price per species)➢ Species preference and demand (price per species)➢ Species preference and demand (price per species)➢ Water treatment frequency
➢ Perceived timber scarcity over 5 years➢ Perceived scarcity over 5 years➢ Extraction effort and time➢ Quantity commercialised➢ Vegetation cover near water sources
➢ Occurrence of illegal extraction➢ Extraction location➢ Quantity commercialised by species➢ Extraction location (vegetation type)➢ Perceived threats and changes to water quality and quantity
➢ Quantity commercialisation➢ Perceived fish size changes over 5 years➢ Occurrence of illegal extraction
➢ Demand (price per species)➢ Perceived fish scarcity over past 5 years (availability and location)➢ Perceived scarcity of 5 past years (availability and location)
➢ Extraction location➢ Extraction location, (distance)
➢ Demand (price per species)
➢ Occurrence of illegal extraction
➢ Occurrence of sport fishing
➢ Effectiveness of management plans (rules and enforcement)
Table 2. Community-defined wellbeing indicators.
Information type
Material WealthEmployment & enterpriseSocial relations &governanceCulture & beliefsSecurityEducation & skillsHealth
Indicator➢ Number of HH with regular income➢ Frequency of out-migration➢ Frequency of food exchanges➢ Frequency of church attendance➢ Occurrence of theft➢ Number of people with official education➢ Perceived frequency of diseases
➢ Existence of transport and communication infrastructure➢ Perceived community development➢ Number of HH participating in village activities➢ Number off HH speaking native language➢ Frequency of alcohol-related incidents➢ Number of education facilities in the community➢ Self-reported health & emotional wellbeing
➢ Number of HH with farm inputs and livestock➢ Availability and access to financial loans➢ Number of HH married or in long-term partnership➢ Purchase of food and water➢ Frequency of illegal activities➢ Perceived quality of education services➢ Number of existing health facilities
➢ Number of HH able to purchase food➢ Community businesses➢ Incidences of resource conflict➢ Existence of traditional activities➢ Frequency and length of flooding➢ Number of HH with potable water
➢ Number of HH with mobility➢ Number of HH with extended family support➢ Building material preference➢ Frequency and length of droughts➢ Distance of HH from contaminants
➢ Electronic assets per HH
➢ Perceived level of cooperation➢ Perceived quality of health services
➢ Attendance of village meetings➢ Leisure and sport facilities
➢ Perceived quality of village leadership➢ Water treatment and waste disposal facilities

3.4. Assessing Drivers of Deforestation and Forest Degradation

In order to identify key drivers of forest change at the local level, a series of workshops were held with community members for them to initially understand and discuss national definitions of forests (areas of at least 1 ha with a minimum of 30% tree cover and minimum height of 5 meters), and deforestation and degradation (deforestation being one hectare or more of forest that is permanently cleared/clear cut). From these discussions, monitoring the impacts of community farming practices on forest change was prioritized out of a list of deforestation and degradation drivers identified by the communities, which also included community infrastructure, logging, and mining, due to the greater perceived impact on forest areas and livelihood relevance of farming amongst the communities.

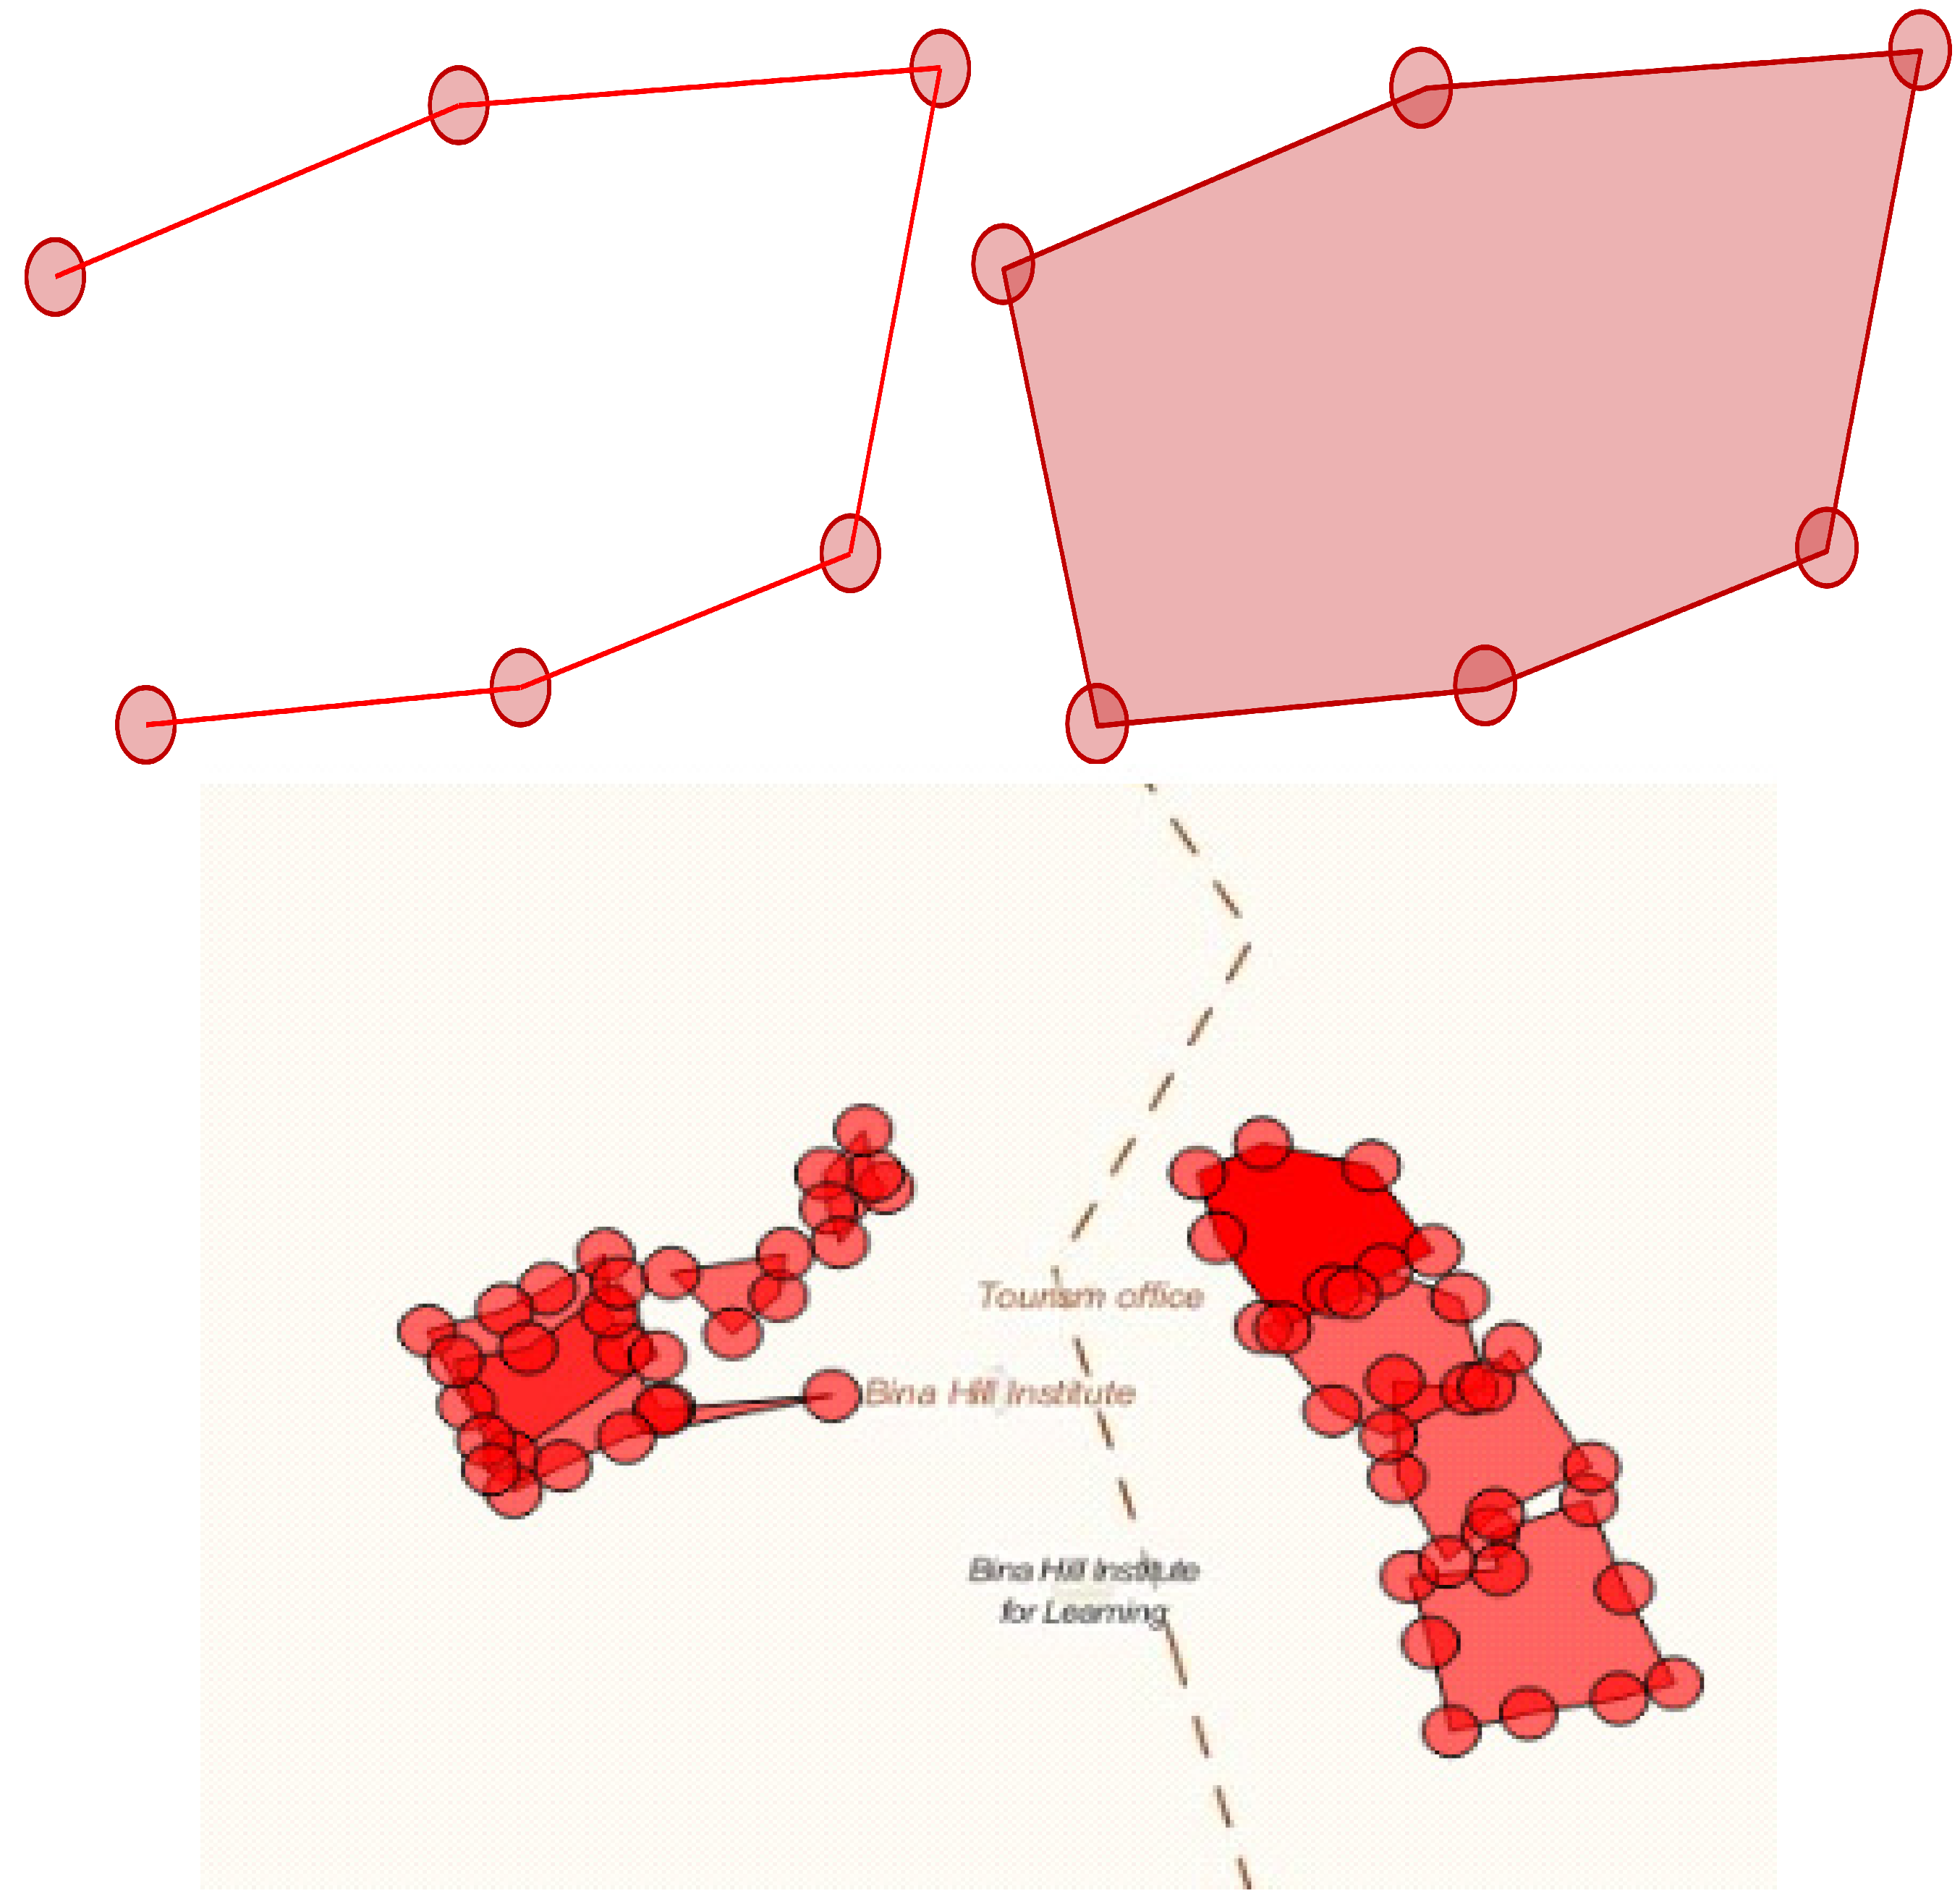
Mapping Agricultural Areas

To quantify the impacts of farming practices on community forests, farm plots from 2011, 2012, and 2013 were visited. The location, shape, and size in hectares of these plots were recorded through farm visits by community monitors using the GPS functionality and ODK software on their mobile phones throughout the latter half of 2013 (respondents were asked to identify and allow community monitors to visit old and new farms from 2011, 2012, and 2013). This allowed digital polygons with individual data sets to be created (Figure 2). These polygons were then analyzed and visualized by the local project management team and project facilitators using QGIS and Google Maps Engine in order to assess land use change annually between 2011 and 2013 across all 16 communities.
Figure 2. Mobile phones were used to record the points on the boundary of the farmland, capturing the area and shape of the farm; the resulting polygons are now visualized in Google Maps Engine.
Forests 06 00133 g002aForests 06 00133 g002b

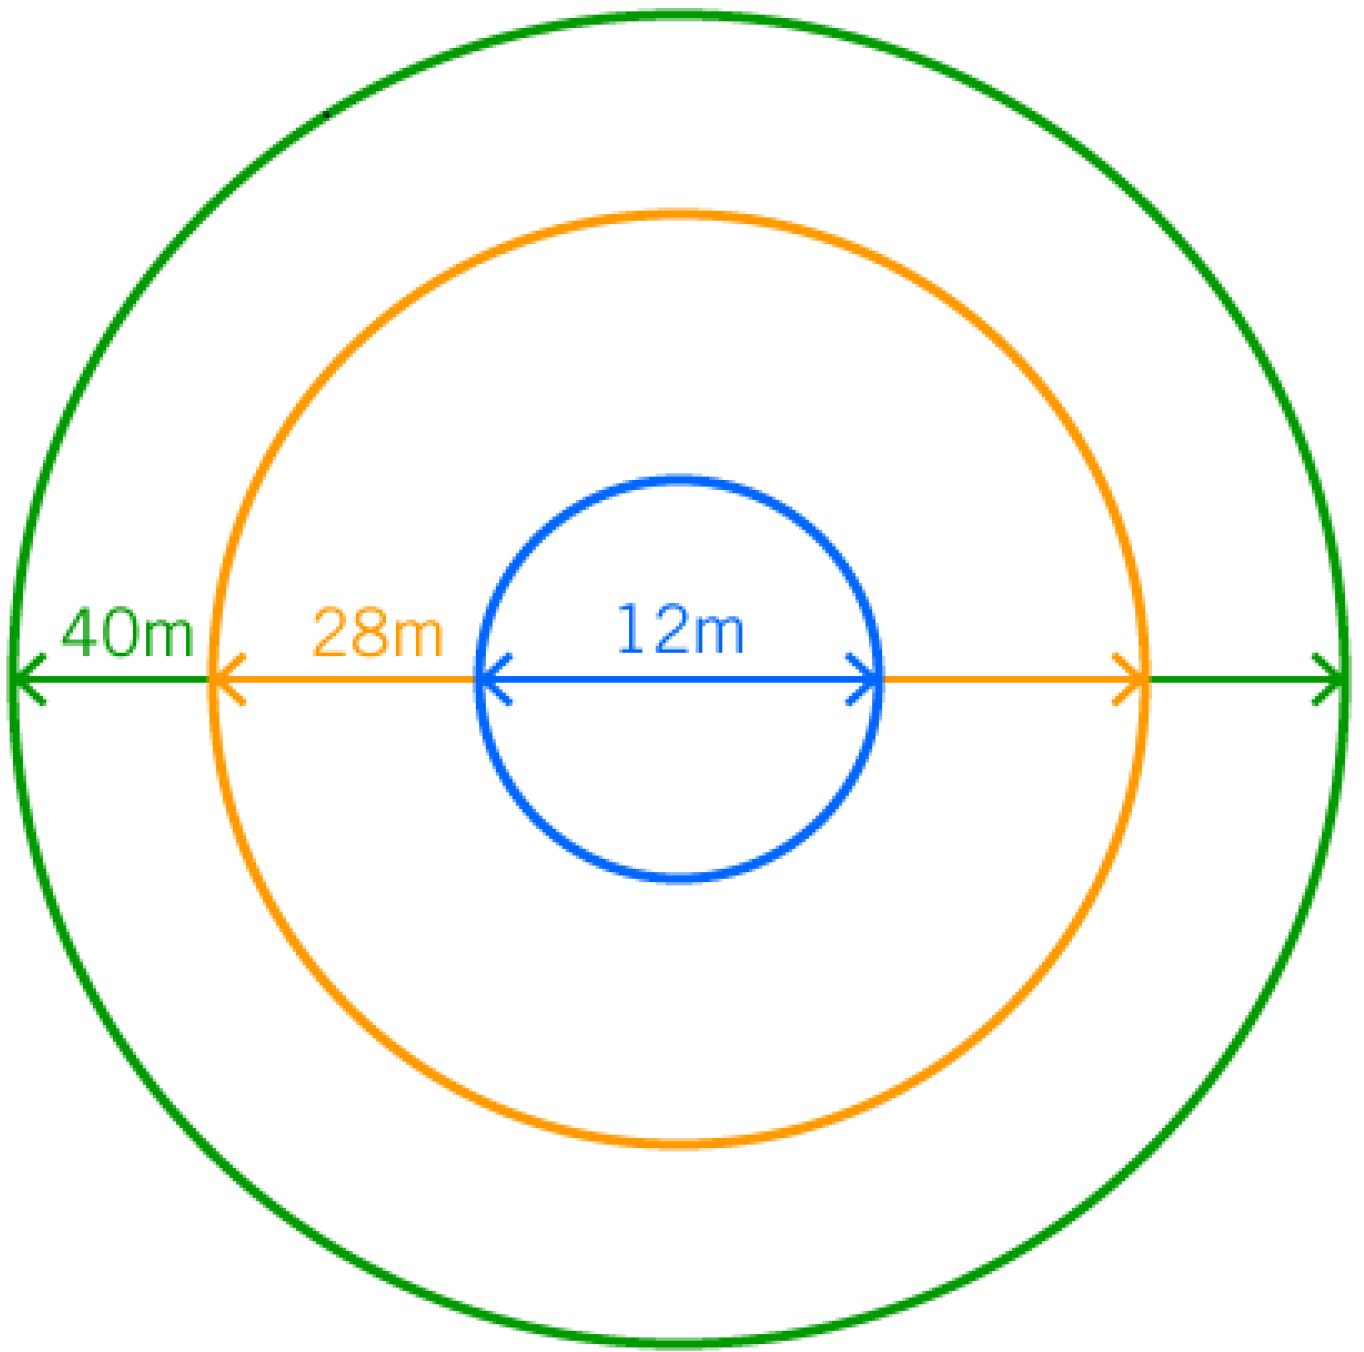
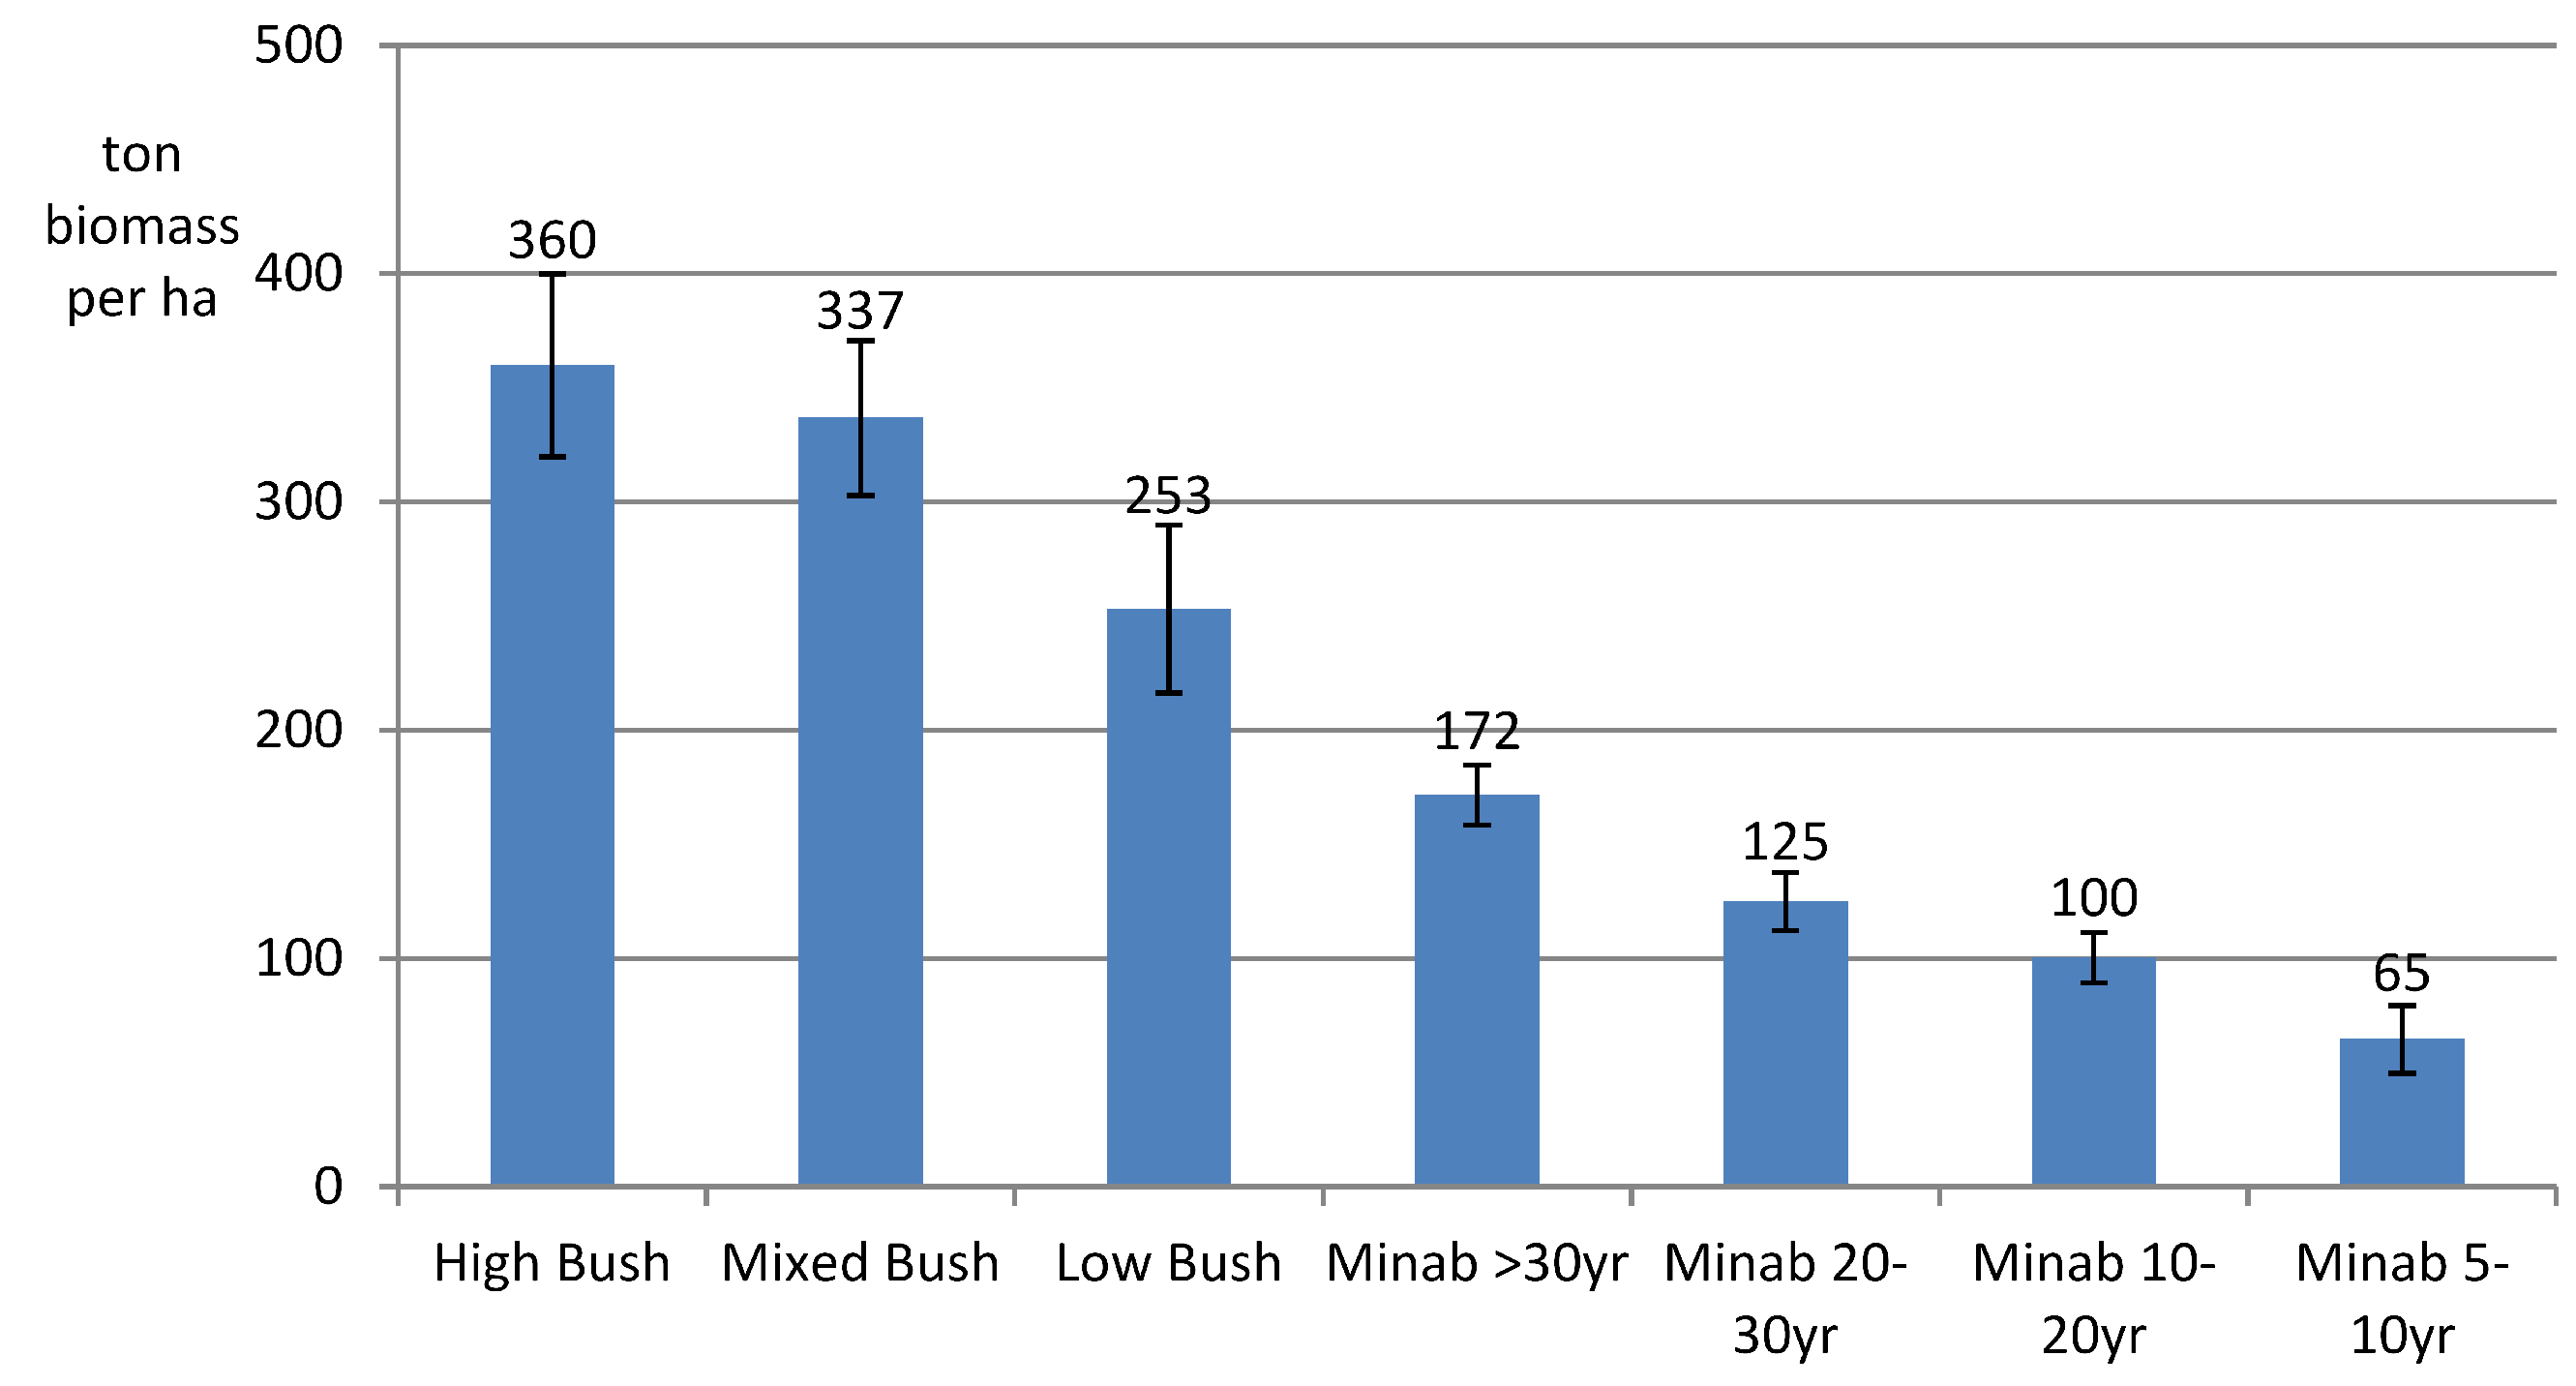
3.5. Facilitating Community Measurement of Aboveground Biomass

To support the estimation of emissions factors for greenhouse gas emission calculation in Guyana, the communities estimated aboveground biomass within three forest types and within agricultural land. Biomass was estimated for three broad community-derived forest classifications:
  • “High bush”: primary, high canopy forest comprising purple heart (Peltogyne paniculata) and associated species;
  • “Mixed bush”: Mixed forests with tree species such as mora (Dimopharidra mora), wallaba (Esperua falcate). and green heart (Nectandra flodier) forests;
  • “Low bush”: low-lying mixed swamp forest and scrub in areas prone to seasonal flooding.
Within these three types of woodland, 117 random plot locations were selected by local project staff and community monitors using satellite imagery and village maps, which represented the forest classifications. In each of the 16 communities, two paired plots were recorded in each forest type (high, medium, low) with two more in the forest type with the greatest area in that community’s titled lands. Therefore, in total across all 16 communities, 57 plots were measured in high bush, which covers 18,461 ha of community titled land; 38 plots in mixed bush, which covers 9720 ha, and 22 plots in low bush, which covers 2392 ha.
A further 128 randomly selected biomass plots (randomized by drawing village household plots from a hat) for fallow farms (minabs) of four different age classes were also measured (5–10 years: 23 plots; 10–20 years: 34 plots; 20–30 years: 36 plots; >30 years: 50 plots); with two plots in each age class for each community’s lands.
Circular nested plots of 0.125 ha were used (Figure 3). The GPS location at the center of the plot, forest height, soil type, slope of terrain, tree species, and diameter at breast height (DBH) were recorded by community monitors in each plot.
Figure 3. Circular nested plot design consisting of three circular plots with diameters of 12, 28, and 40 m. Within the 12-m diameter plot, all trees with a DBH of ≥ 5 cm were measured; within the circular ring between 12 and 28 m diameter plots, all trees with a DBH ≥ 25 cm were measured; and in the outer ring, between 28 and 40 m diameter plots, all trees with a DBH ≥ 50 cm were measured.
Forests 06 00133 g003
Aboveground biomass was then calculated using an allometric equation from Chave et al. [30] for moist forest stands. This is a generalized equation for tropical moist forest, and is not specific for any one type of tree; applied to all trees within the plot, it gives the biomass per plot from which the biomass per hectare can be calculated. According to Chave et al. [30] the error on the estimation of a tree’s biomass is around ±5%.
( AGB ) est  =  ρ x exp ( 1.499   + 2.148 ln ( D ) +   0.207 ( ln ( D ) ) 2     0.0281 ( ln ( D ) ) 3 )
D = diameter at breast height in cm; ABG = aboveground biomass, tons of dry matter.
It was assumed that the carbon density of stems between 5 and 25 cm DBH was the same across the entire plot, and that the carbon density of stems of 25 cm and 40 cm DBH measured in the inner and middle nest was the same across the entire plot.

3.6. Supporting Communities to Ground Truth Satellite Data

In order to accurately understand forest change in Amerindian lands, community monitors ground-truthed areas of deforestation identified by the Guyana Forestry Commission in the Community Demonstration Site. Deforested areas were derived from the GFC from LANDSAT images acquired between 1990 and 2010. The local project management team, with the support of the project facilitators, applied a systematic sampling approach over a 250-m grid within the areas of deforestation identified in the Community Demonstration Site (Figure 4); grid points that fell in mountainous areas were omitted due to logistical impracticalities. Ground truthing exercises were then carried out by community monitors at each grid cross point, recording the vegetation type, land use activities taking place (e.g., active farm, fallow, fire, or no disturbance), the geo-location, and taking a photographic record of that point.
Figure 4. Deforestation areas (red) ground truthed within the Community Demonstration Site.
Forests 06 00133 g004
The results were then analyzed manually by the local project management team with the support of project facilitators using Arc GIS.

3.7. Monitoring Resources of Local Interest and Safeguards

During the participatory development of the monitoring framework, monitoring priorities for local resource management and development were identified by the communities in addition to the indicators developed under the Community Demonstration Site to contribute to the national MRVS. Indicators for these priorities—community maps, natural resources, and community wellbeing—were defined through participatory workshops. While these indicators were designed for local use, they have relevance in the context of how community-collected data can inform REDD+ safeguards.

3.7.1. Natural Resource Use

Qualitative and quantitative information on water use, timber/non-timber harvests, fishing and hunting practices was gathered through facilitated group discussions with “top extractors” and semi-structured household interviews undertaken by the community monitors using ODK. “Top extractor” groups were identified through meetings with village council members in each of the villages, and for household interviews a sample of 20 households was selected randomly in each of the 16 villages.

3.7.2. Community Wellbeing

Baseline data on wellbeing was generated by focusing on key social indicators identified by the communities at the onset of the project. The information was then collected by community monitors in two data collection cycles (November 2012–December 2013, and October 2013–December 2013) using ODK questionnaires aimed at 320 households and 16 village councils.

4. Results

4.1. Community Demonstration Site: Data Contributing to the National MRVS

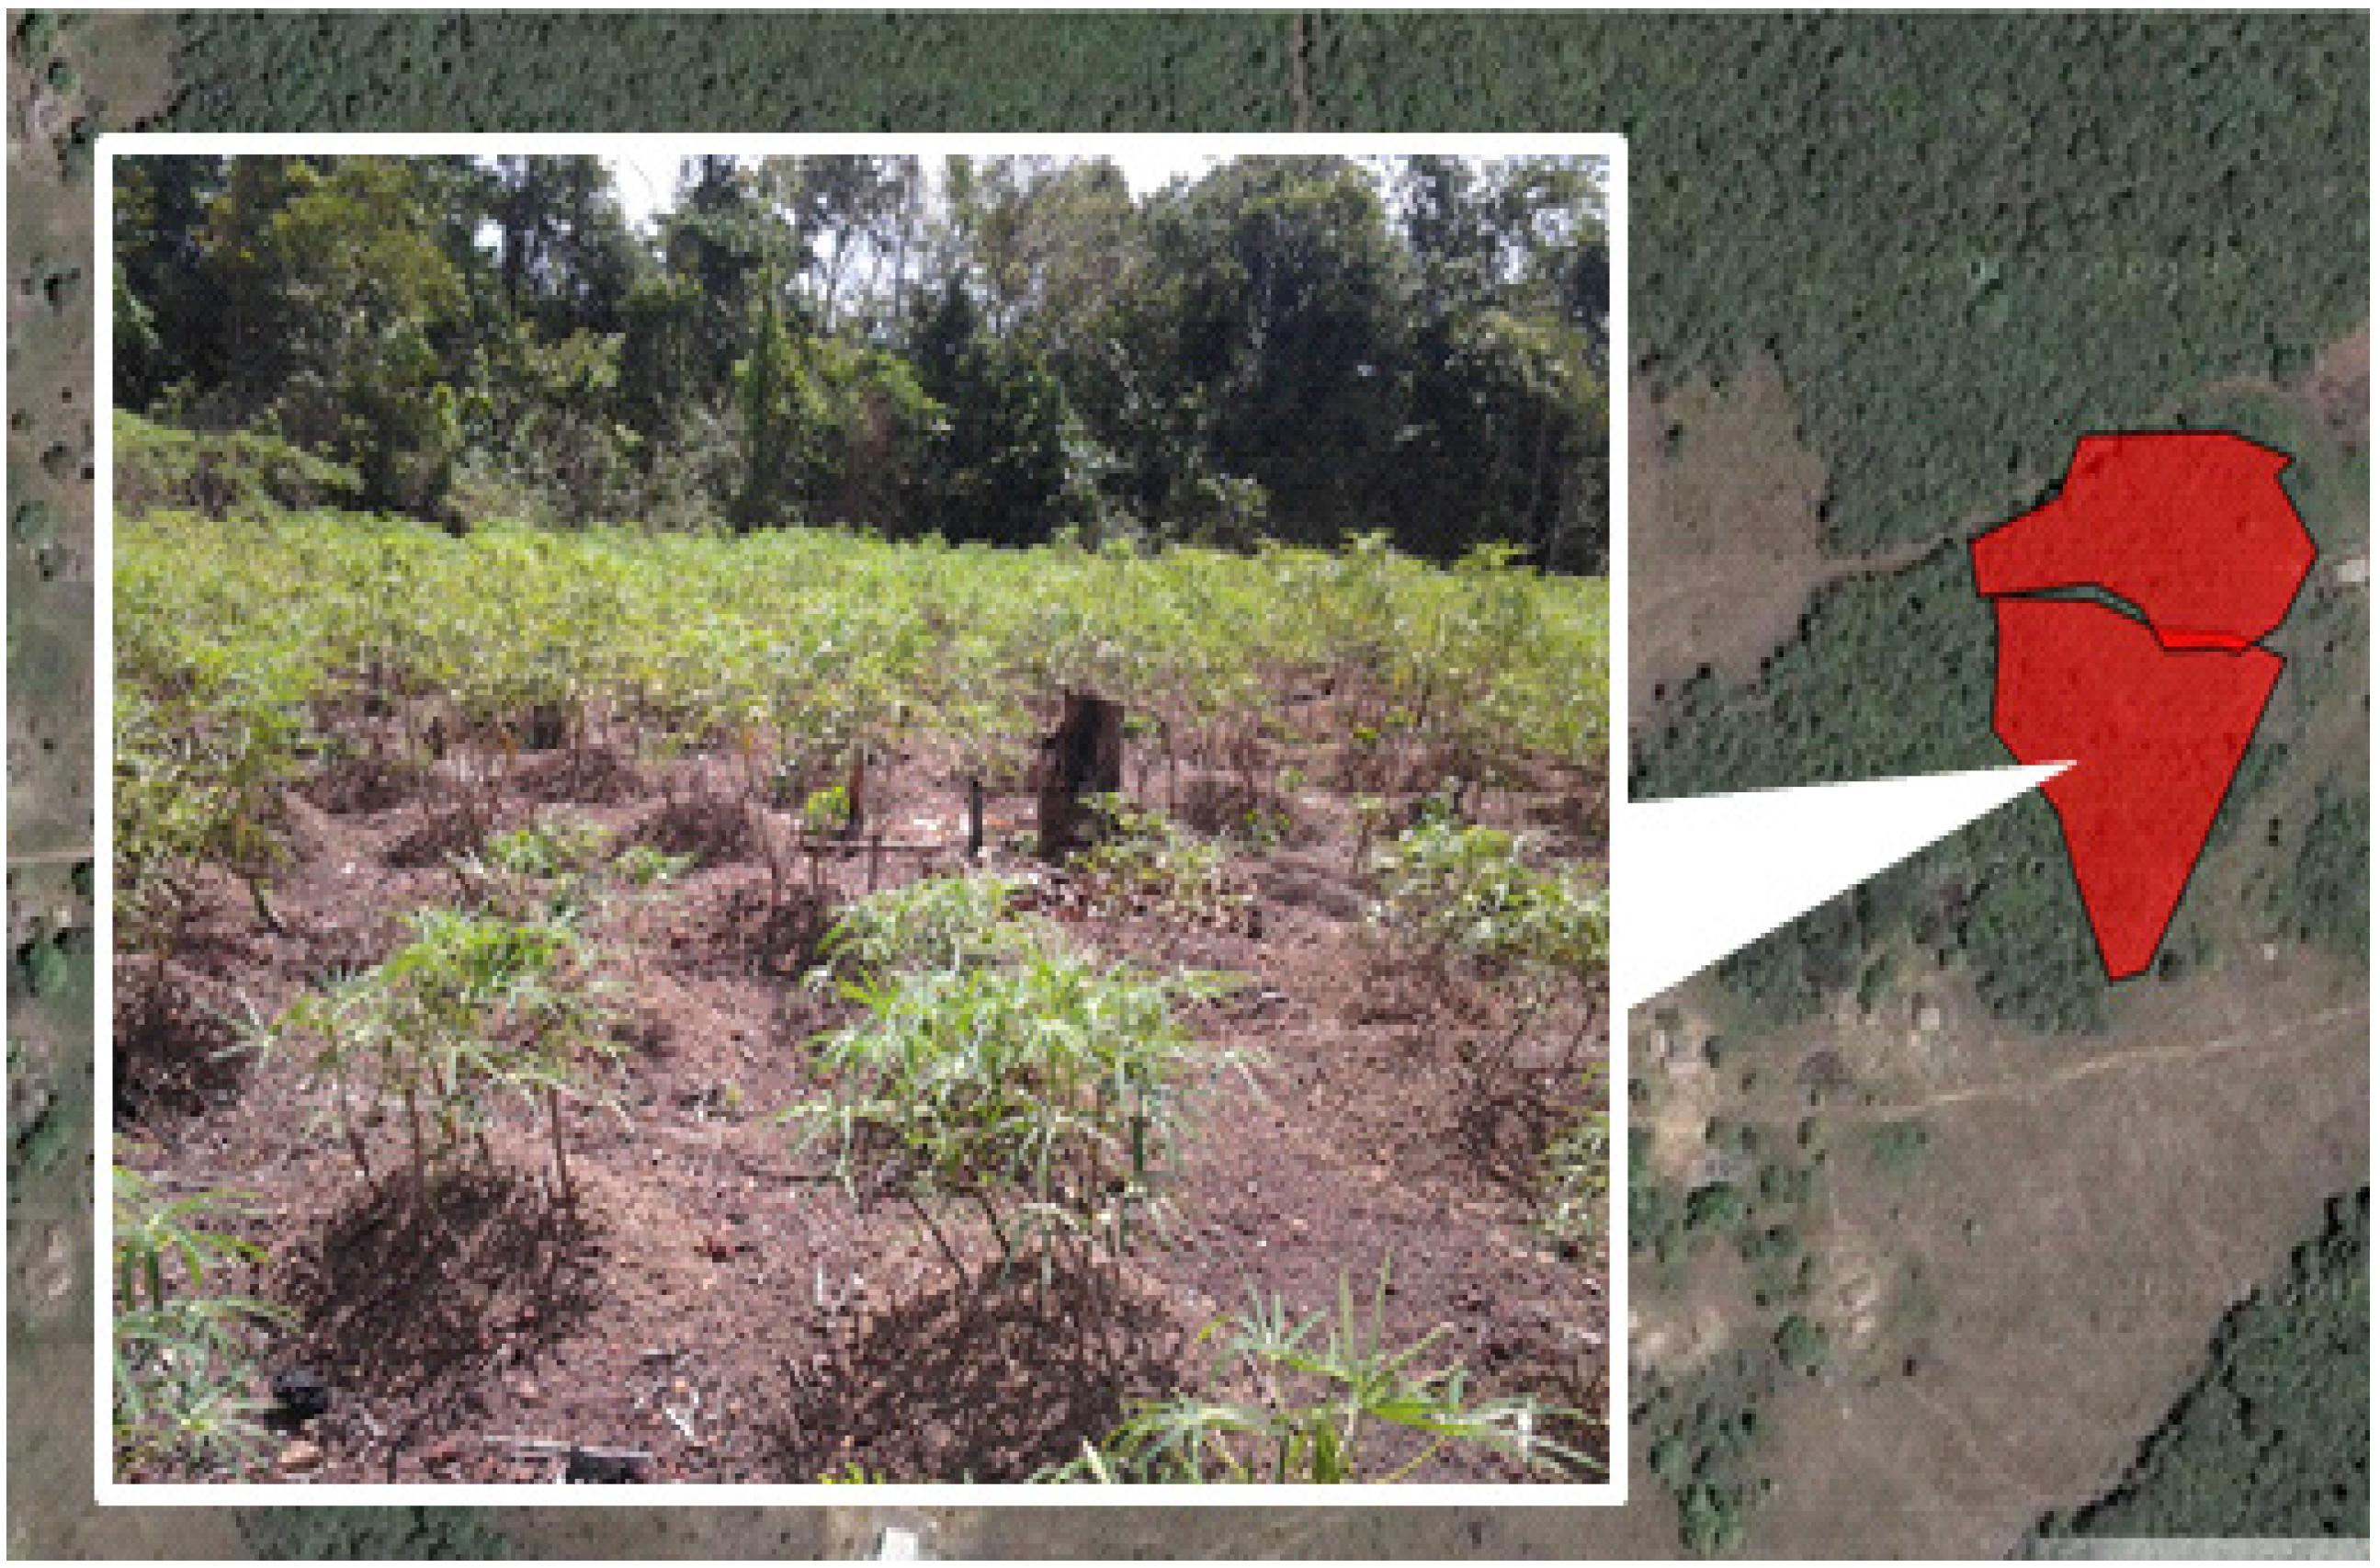
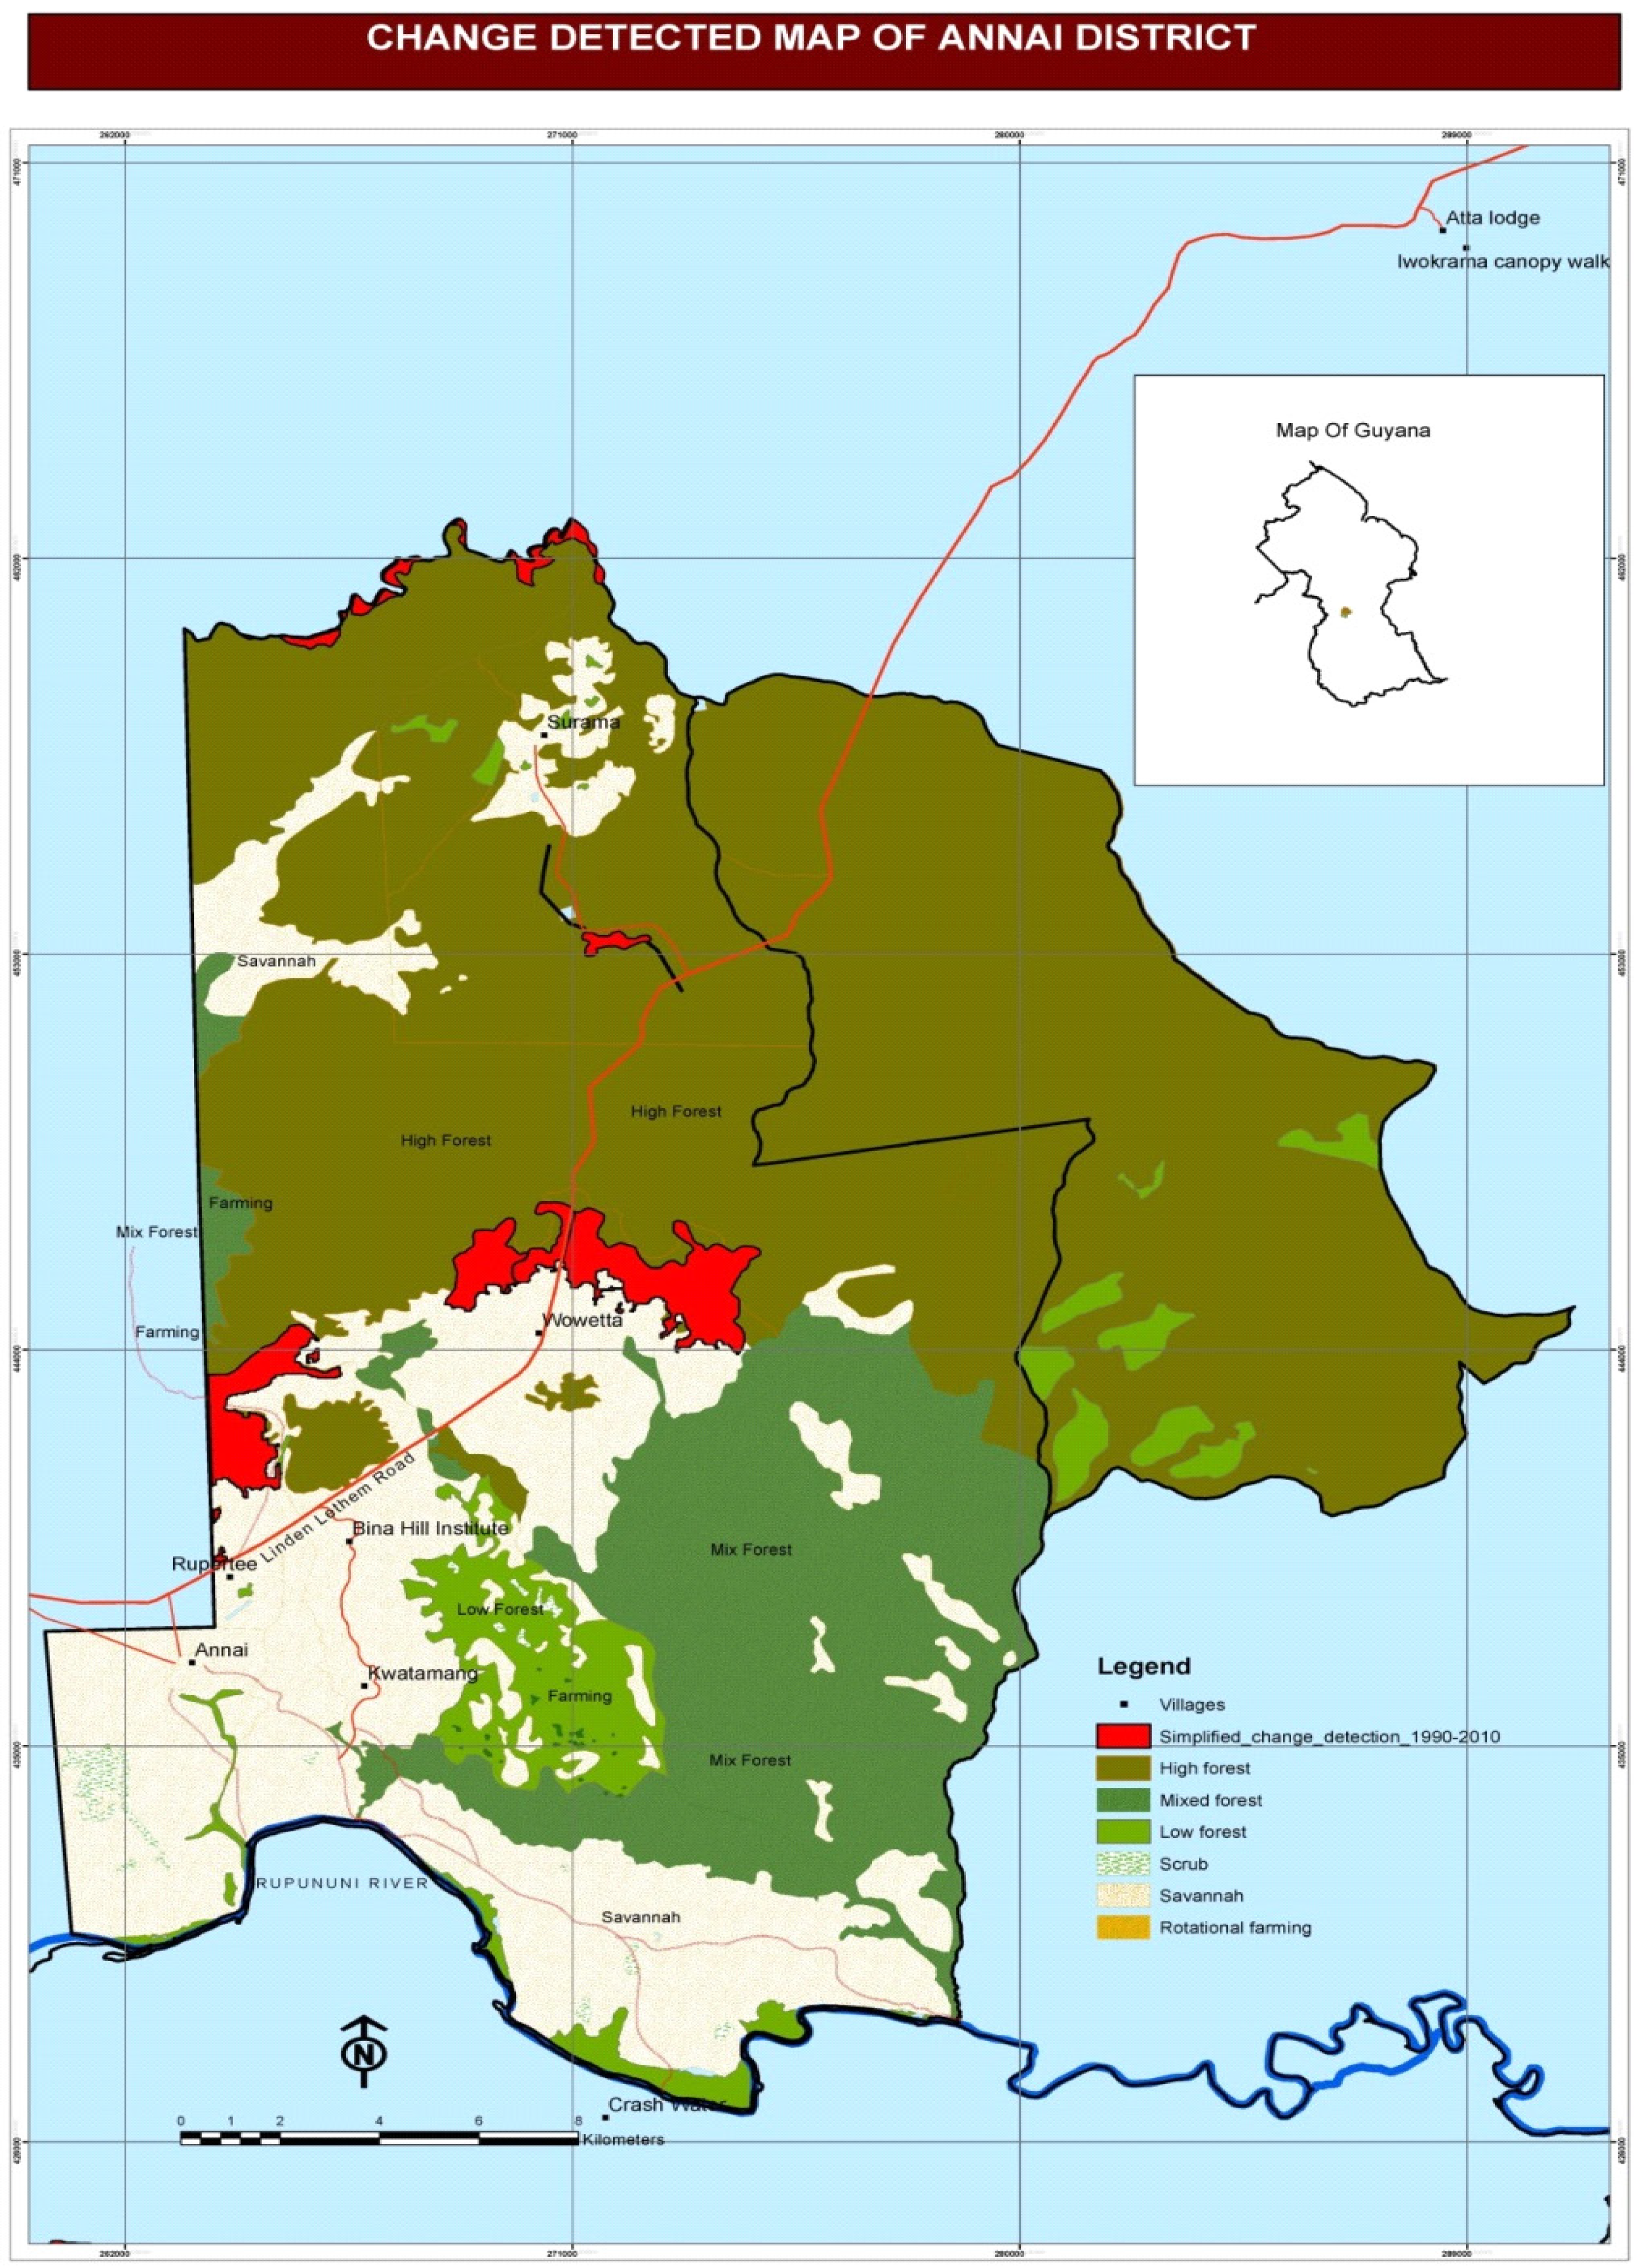
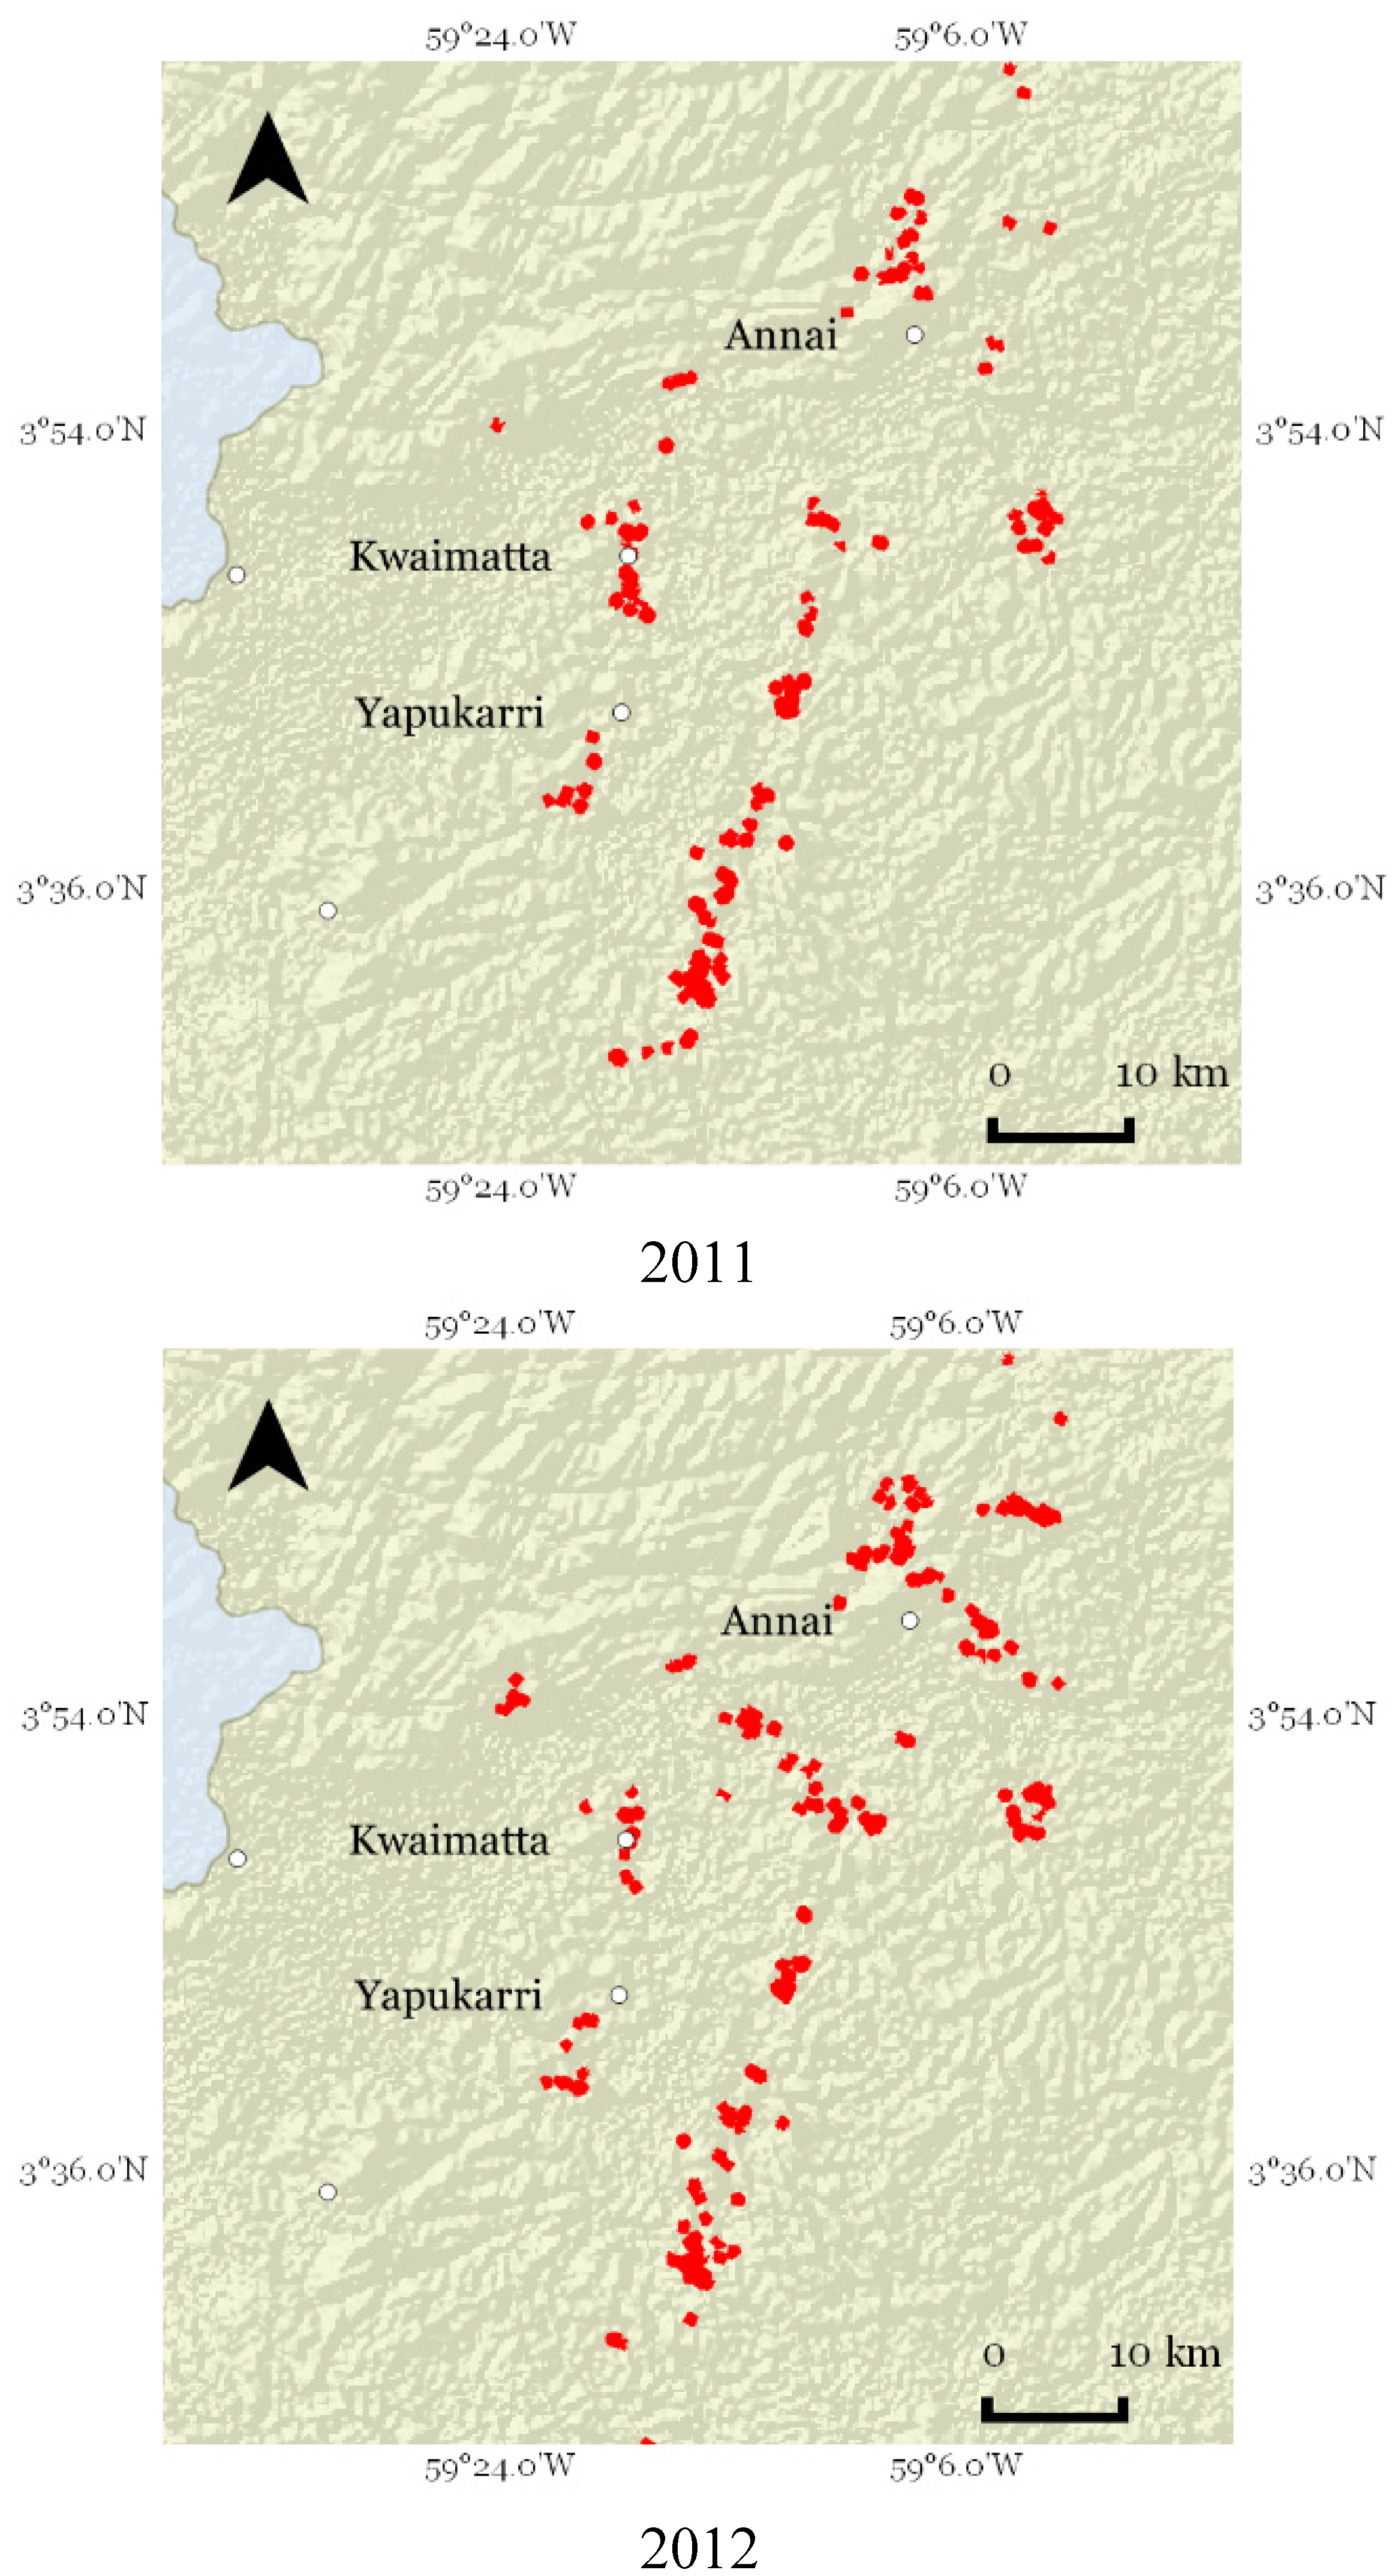
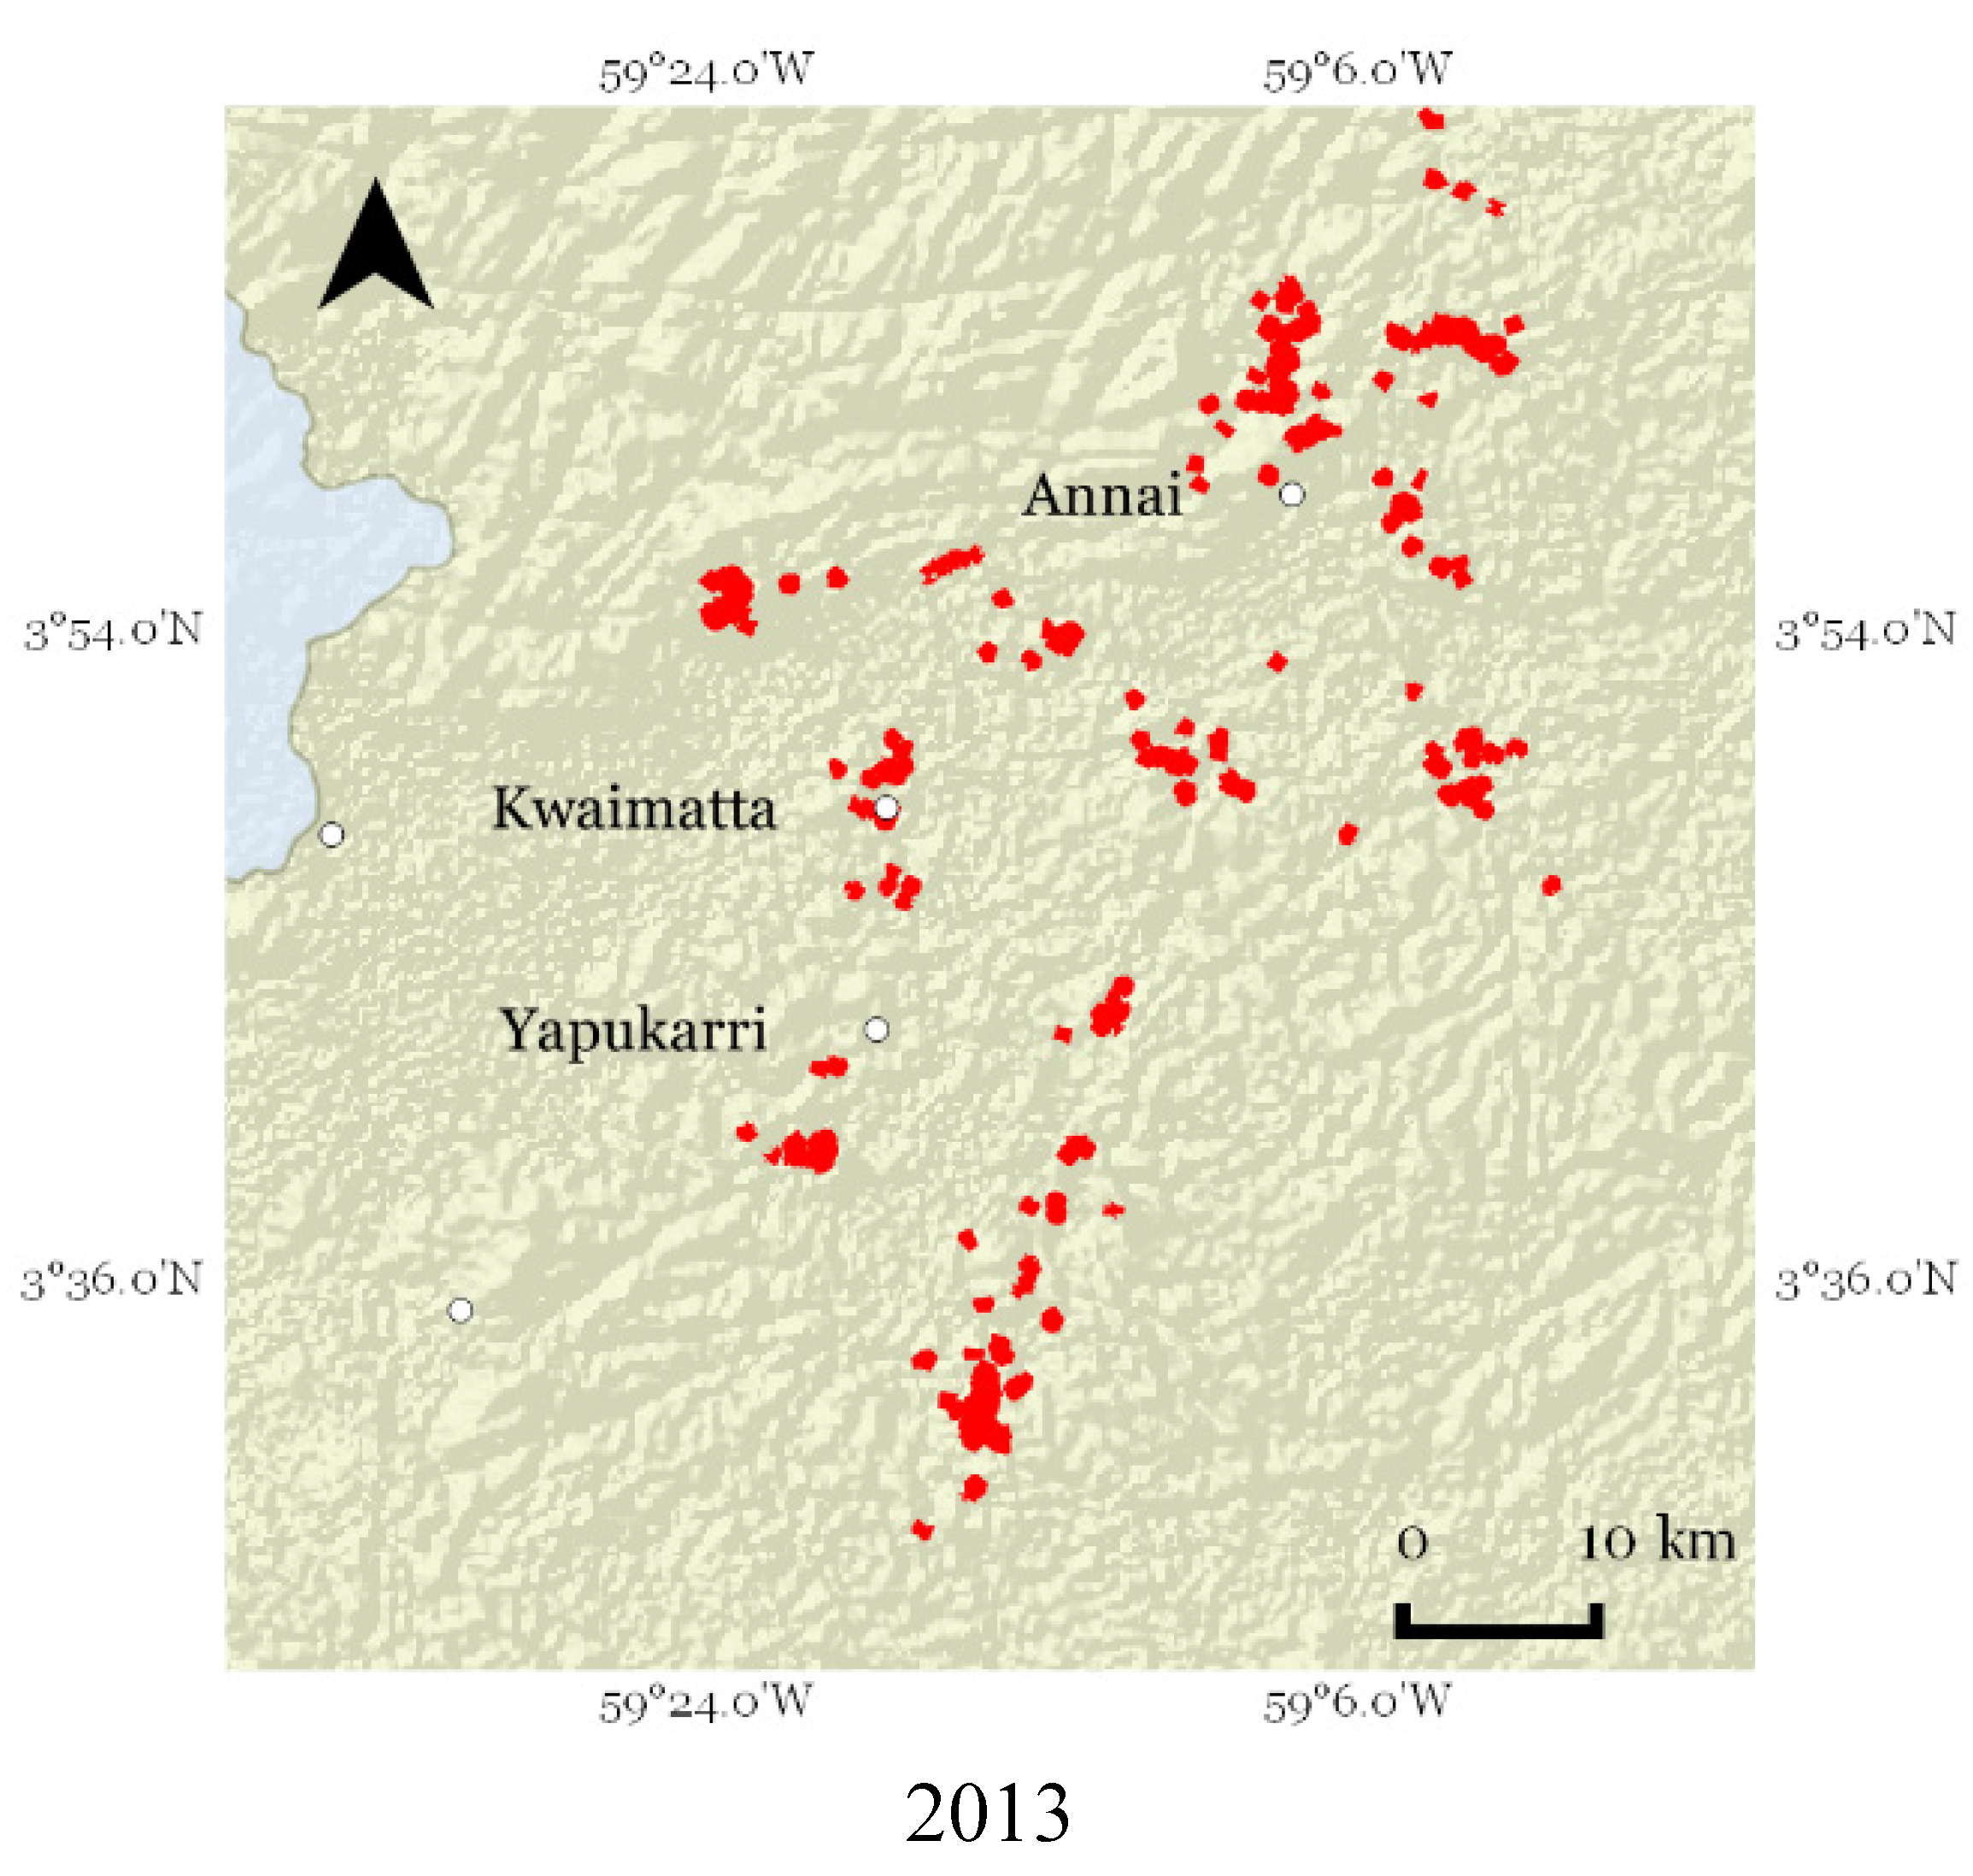
4.1.1. Assessing Drivers of Deforestation and Forest Degradation: Farming Impacts

Results indicate that traditional farming area in the North Rupununi has more than doubled from 2011 to 2013 (Figure 5). In addition to the spatial information acquired through ODK, the structured questionnaires that accompanied them revealed further quantified information about agricultural practices, which could be used in reference level modeling. Traditional recorded farming area in the region has, according to the data generated by this project, gone up from 64.12 ha in 2011 to 117.42 ha in 2013. This near doubling of the farmland in two years demonstrates the utility of community-collected data in quantifying drivers of deforestation. Figure 5 visualizes farm expansion in a subsection of the area; these maps have been made available on Google Maps Engine, but are not yet used by the community as they do not have sufficiently good Internet access.
Analysis of initial farming data collected from semi-structured interviews showed that 97% of respondents continue to practice traditional/rotational farming in the community, the remaining having adopted savannah farming techniques (commercial approaches). As a result, the majority of households tend to farm on largely forested areas at an average distance of eight kilometers from their homes. The size and number of plots depends on household size and kinship networks, but normally varies from 0.4 to 0.9 ha each depending on production type. Farm rotation periods average between 3 and 5 years with 10–15 years on fallow periods. Results from the Community Demonstration Site show that 75% of all farms from 2012 to 2013 were cut from fallow areas (minabs > 10 years old) with the remaining 25% cut from high bush forests.
Figure 5. Traditional farming areas in the North Rupununi, 2011–2013.
Forests 06 00133 g005aForests 06 00133 g005b
Results from across the 16 communities showed that 74% of village households recognized in interviews that there is a gradual move towards more commercially-oriented farming practices. Twenty-six percent also point to an increasing use of pesticides and the introduction of new crop varieties, such as different varieties of cassava (Manihot esculenta) that are outside traditional farming techniques. Another recent trend that has emerged is the growing tendency to extend farms to cultivate cash crops like cassava as income-generating enterprises, resulting from increased market integration and demand for farine (a byproduct of cassava) from nearby mining camps and local markets. These extended farm plots average 2–2.5 hectares in size and retain elements of traditional cultivation patterns in that they remain within forested areas yet cover larger areas and have fewer crop varieties planted.
Results also show that there has been a decrease in plot rotation time. Respondents cited crop loss from faster weeds, poorer soils, and pests as key factors. In addition, 73% of the total households interviewed mentioned changes in the weather, warmer climates, and less predictability of the start and end of seasons as the most notable changes to farming rotation intervals. Indeed, 48% of households interviewed stated that they have changed the location (shifting to higher ground or savannahs) and frequency of clearing farm plots as a result. Prior to this study, data relating to community agriculture as a driver of deforestation was anecdotal, and reasons for the reduction in farm rotation time were poorly understood.

4.1.2. Measuring Aboveground Biomass

Results from the 128 biomass plots for fallow farms of four different age classes show that fallows increase in aboveground biomass with time and that the oldest fallows (172 ± 13 tons biomass/ha) have less than half the aboveground biomass of high bush (360 ± 40 tons biomass/ha) (Figure 6).
Figure 6. Aboveground biomass per hectare in different forest types in the North Rupununi.
Forests 06 00133 g006
The accuracy of the aboveground biomass data is being validated by the Guyana Forestry Commission, who are also developing improved forest classifications to enable the harmonization of community-collected data within national systems. However, the biomass values for high bush are within the range of values for lowland mixed forest from three previous forest inventories in Guyana reported by Alder & van Kuijk of 303.6, 360.9, and 385.9 tons/ha [31].

4.1.3. Ground Truthing Satellite Data

The community data demonstrated that the LANDSAT-derived deforestation dataset had many false positives; 60% of the 178 ground-truthed points within the deforested area were found to be forested with no signs of disturbance, more than 25% were fallow farms (minabs > 10 years old), and active farms were only found on 6% of points. Areas affected by fires were found at only four points (2%). Given the large disconnect between the findings on the ground and the deforestation dataset, further investigation is needed to verify the results and understand if this was a result of any issues in the orthorectification process, the small number of ground control points used, or a mismatch between projections of the different datasets. The local project management team will work with the GFC in order to verify the ground truth measurements and to assess the causes of the false positives found within the dataset.

4.2. Resources of Local Interest and Safeguards

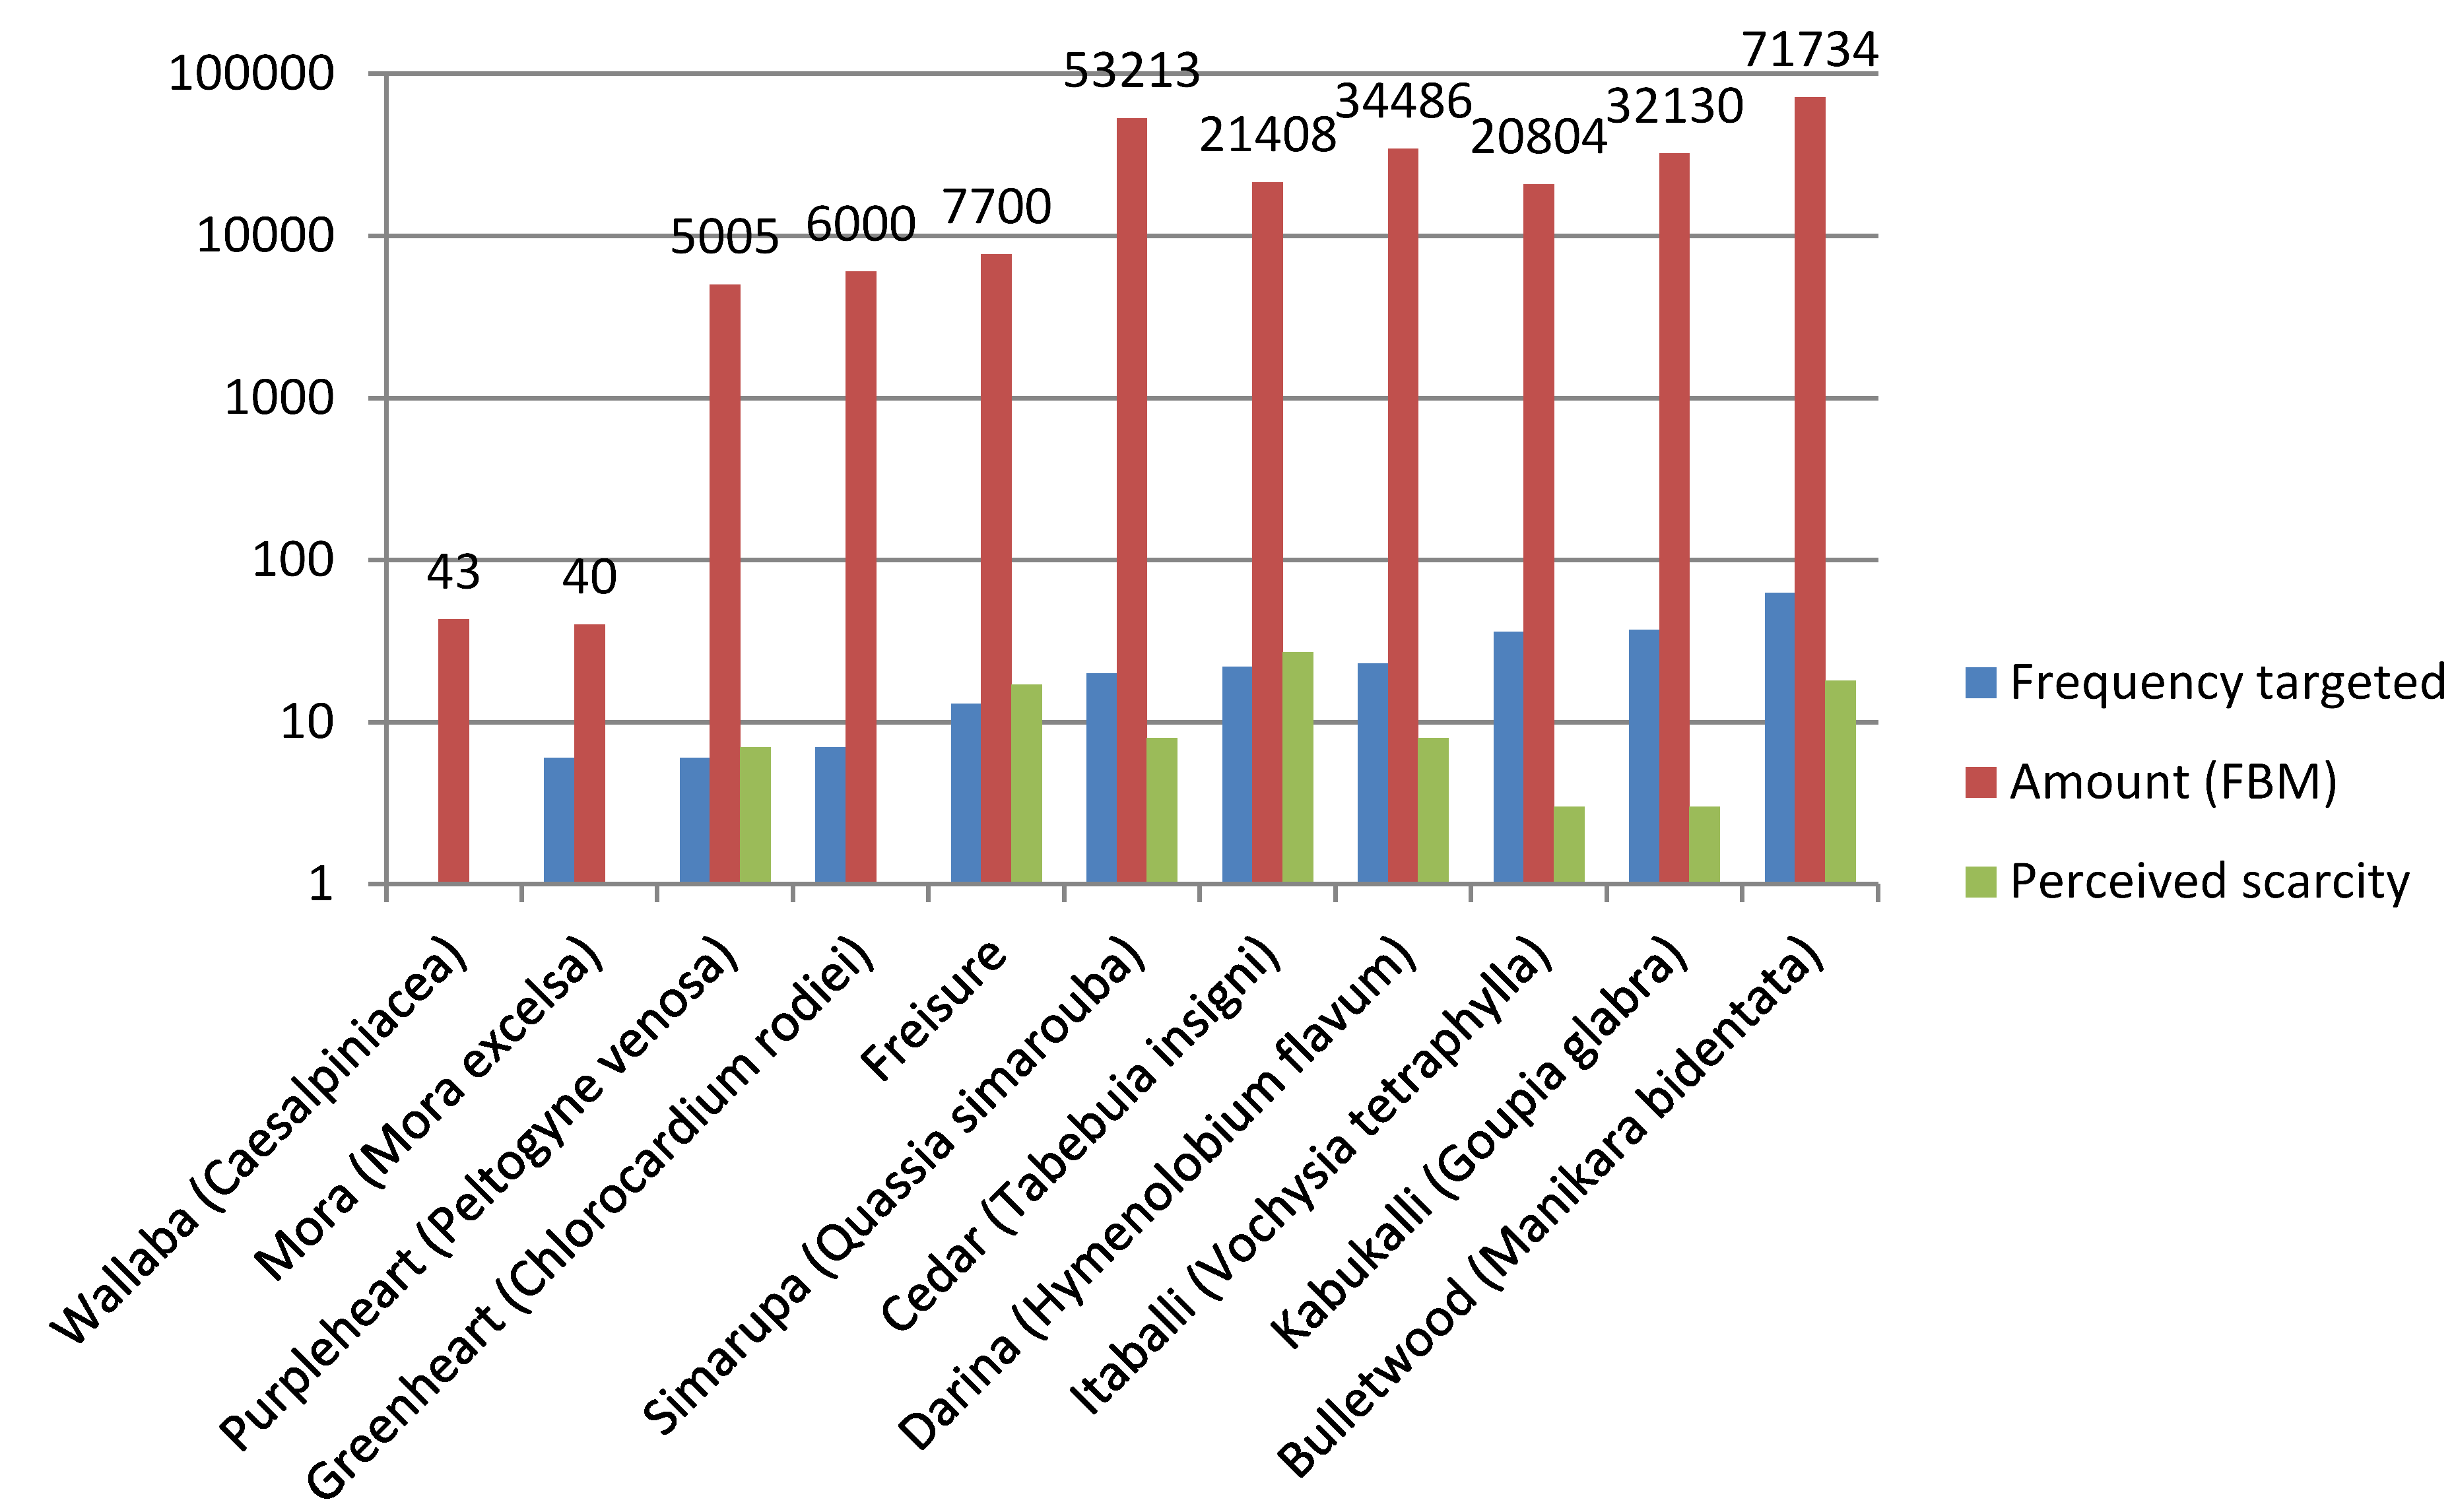
4.2.1. Natural Resource Use: Timber Harvest

A variety of data on timber products, NTFPs, fishing, and game were collected, with the primary aim of informing local management decisions. However, these data are also relevant in testing the efficacy of communities in collecting information on potential REDD+ safeguard indicators; here we present results from the timber extraction survey that are also relevant to understanding forest degradation at the community level and REDD+ monitoring. Summary results from “top extractor” group discussions within the Community Demonstration Site (Annai District) provide an initial estimation of quantities of timber harvests, in board-feet (1 FBM or board foot measure = 0.00235973722 m3), as well as information on the most targeted species and perceptions on scarcity (Figure 7).
Figure 7. Extraction trends and amounts in FBM (1 month) in the Annai District.
Forests 06 00133 g007
This estimate of the extraction of timber (equivalent to about 596 m3) is based on one month recall during January 2013 with a sample of “top-extractors”; thus the figures should be seen as an indication of the order of magnitude of current community logging cut and not total volumes. Timber harvests for subsistence purposes (building material and infrastructure) and commercialization occur at different scales throughout the year, with higher demand in the dry season because of improved access to forests. Only a low percentage of households in each community are top extractors engaging in commercial timber extraction. These individuals have the forest access as well as the necessary equipment and licenses to do so. However, community members reported the occurrence of unregulated extraction activities from external actors. More detailed inventories are needed to determine the impact of small-scale logging on forest degradation over time and to assess the effectiveness of current community management practices; however, this initial data can be used as a forest access indicator, and for monitoring drivers of deforestation.

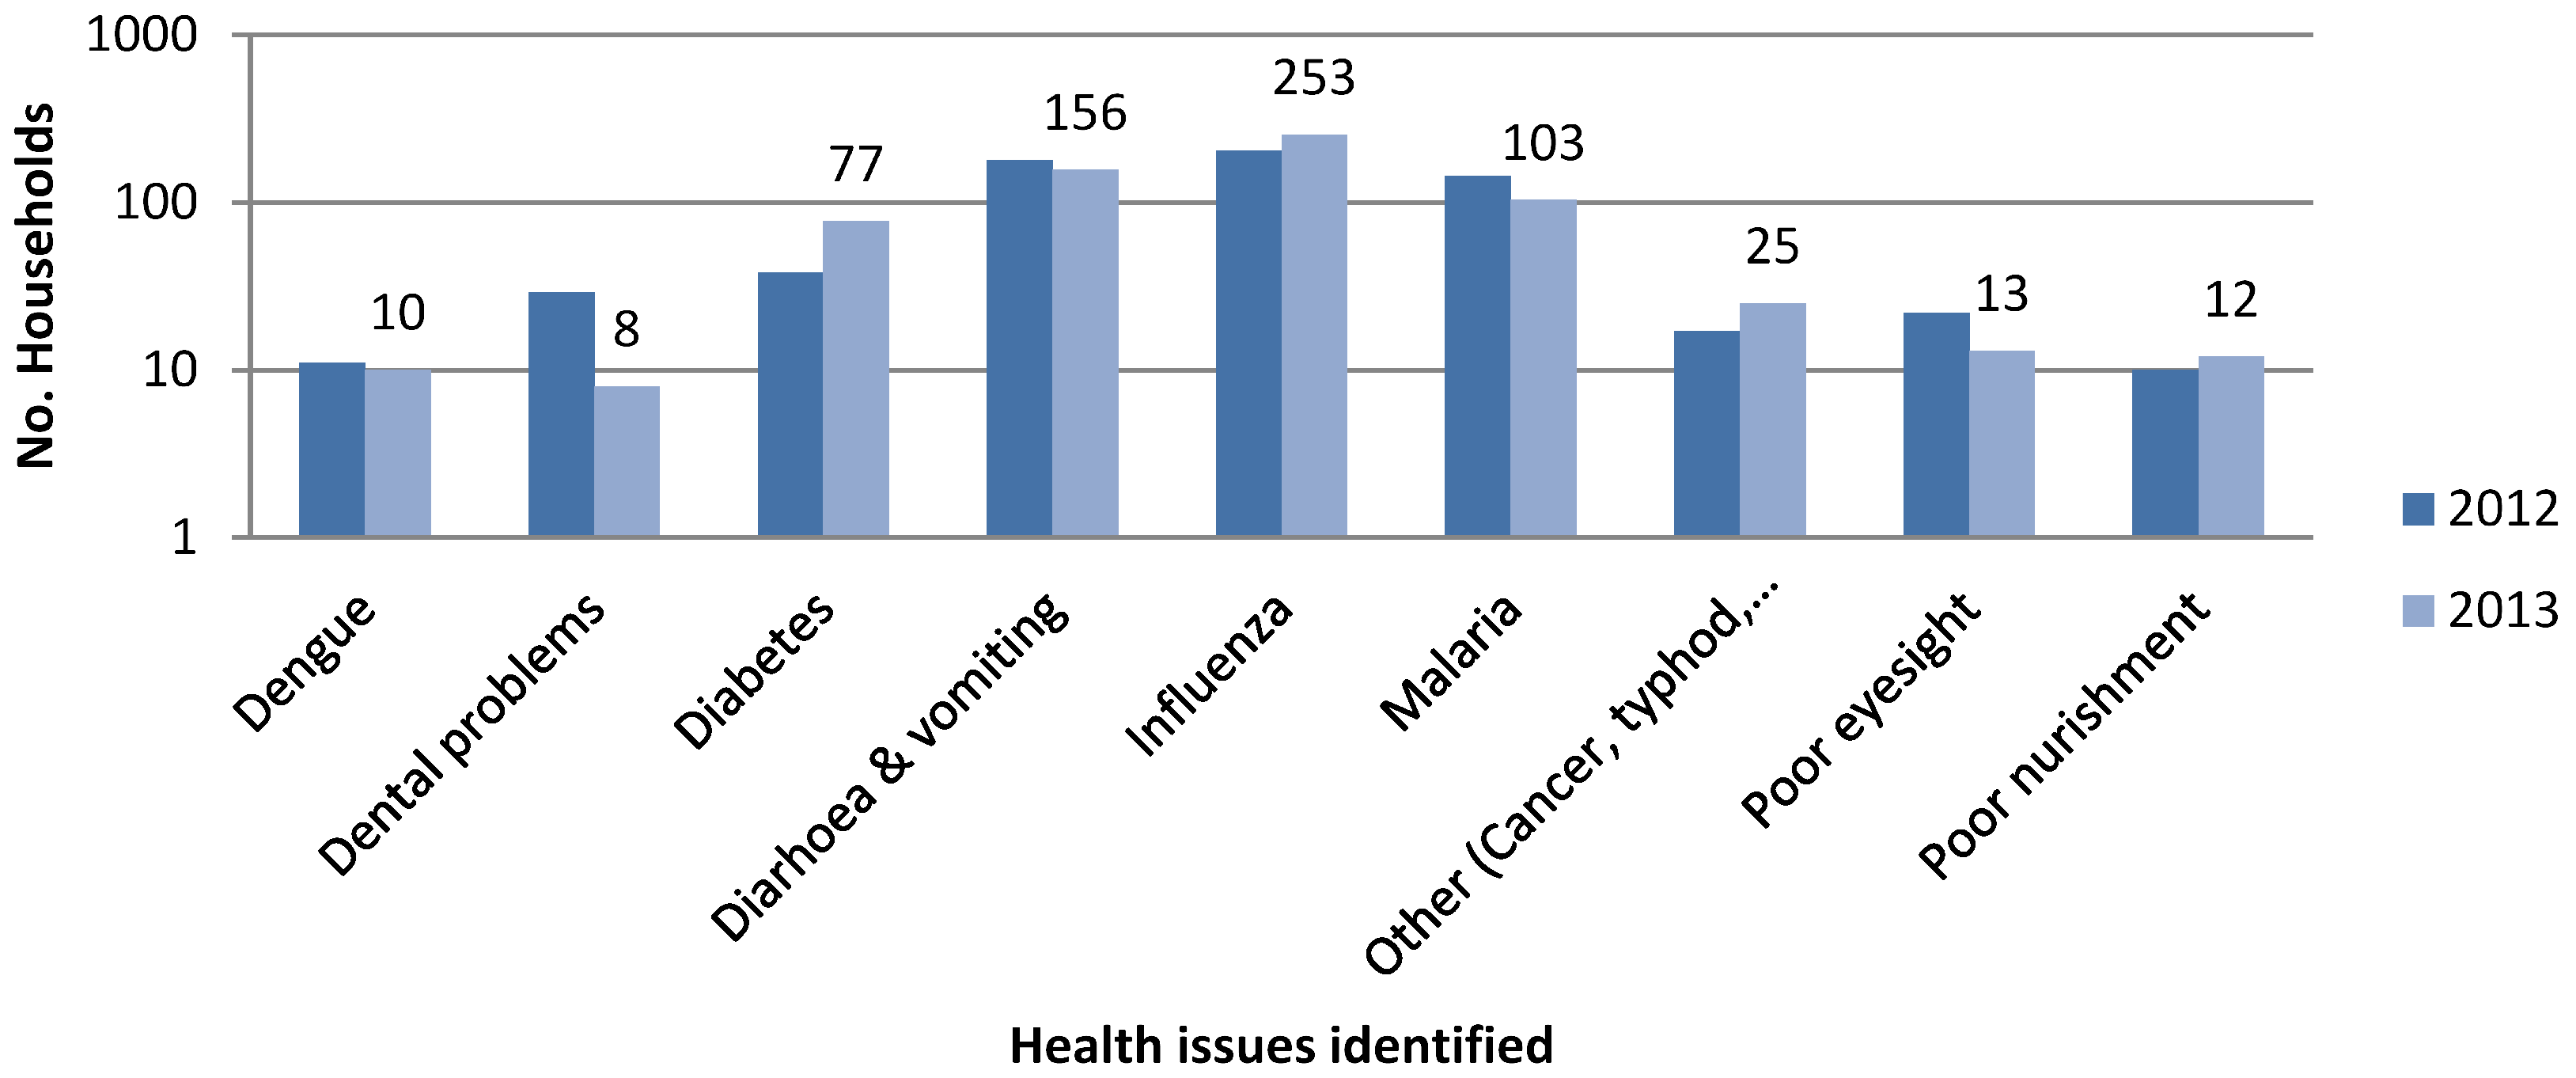
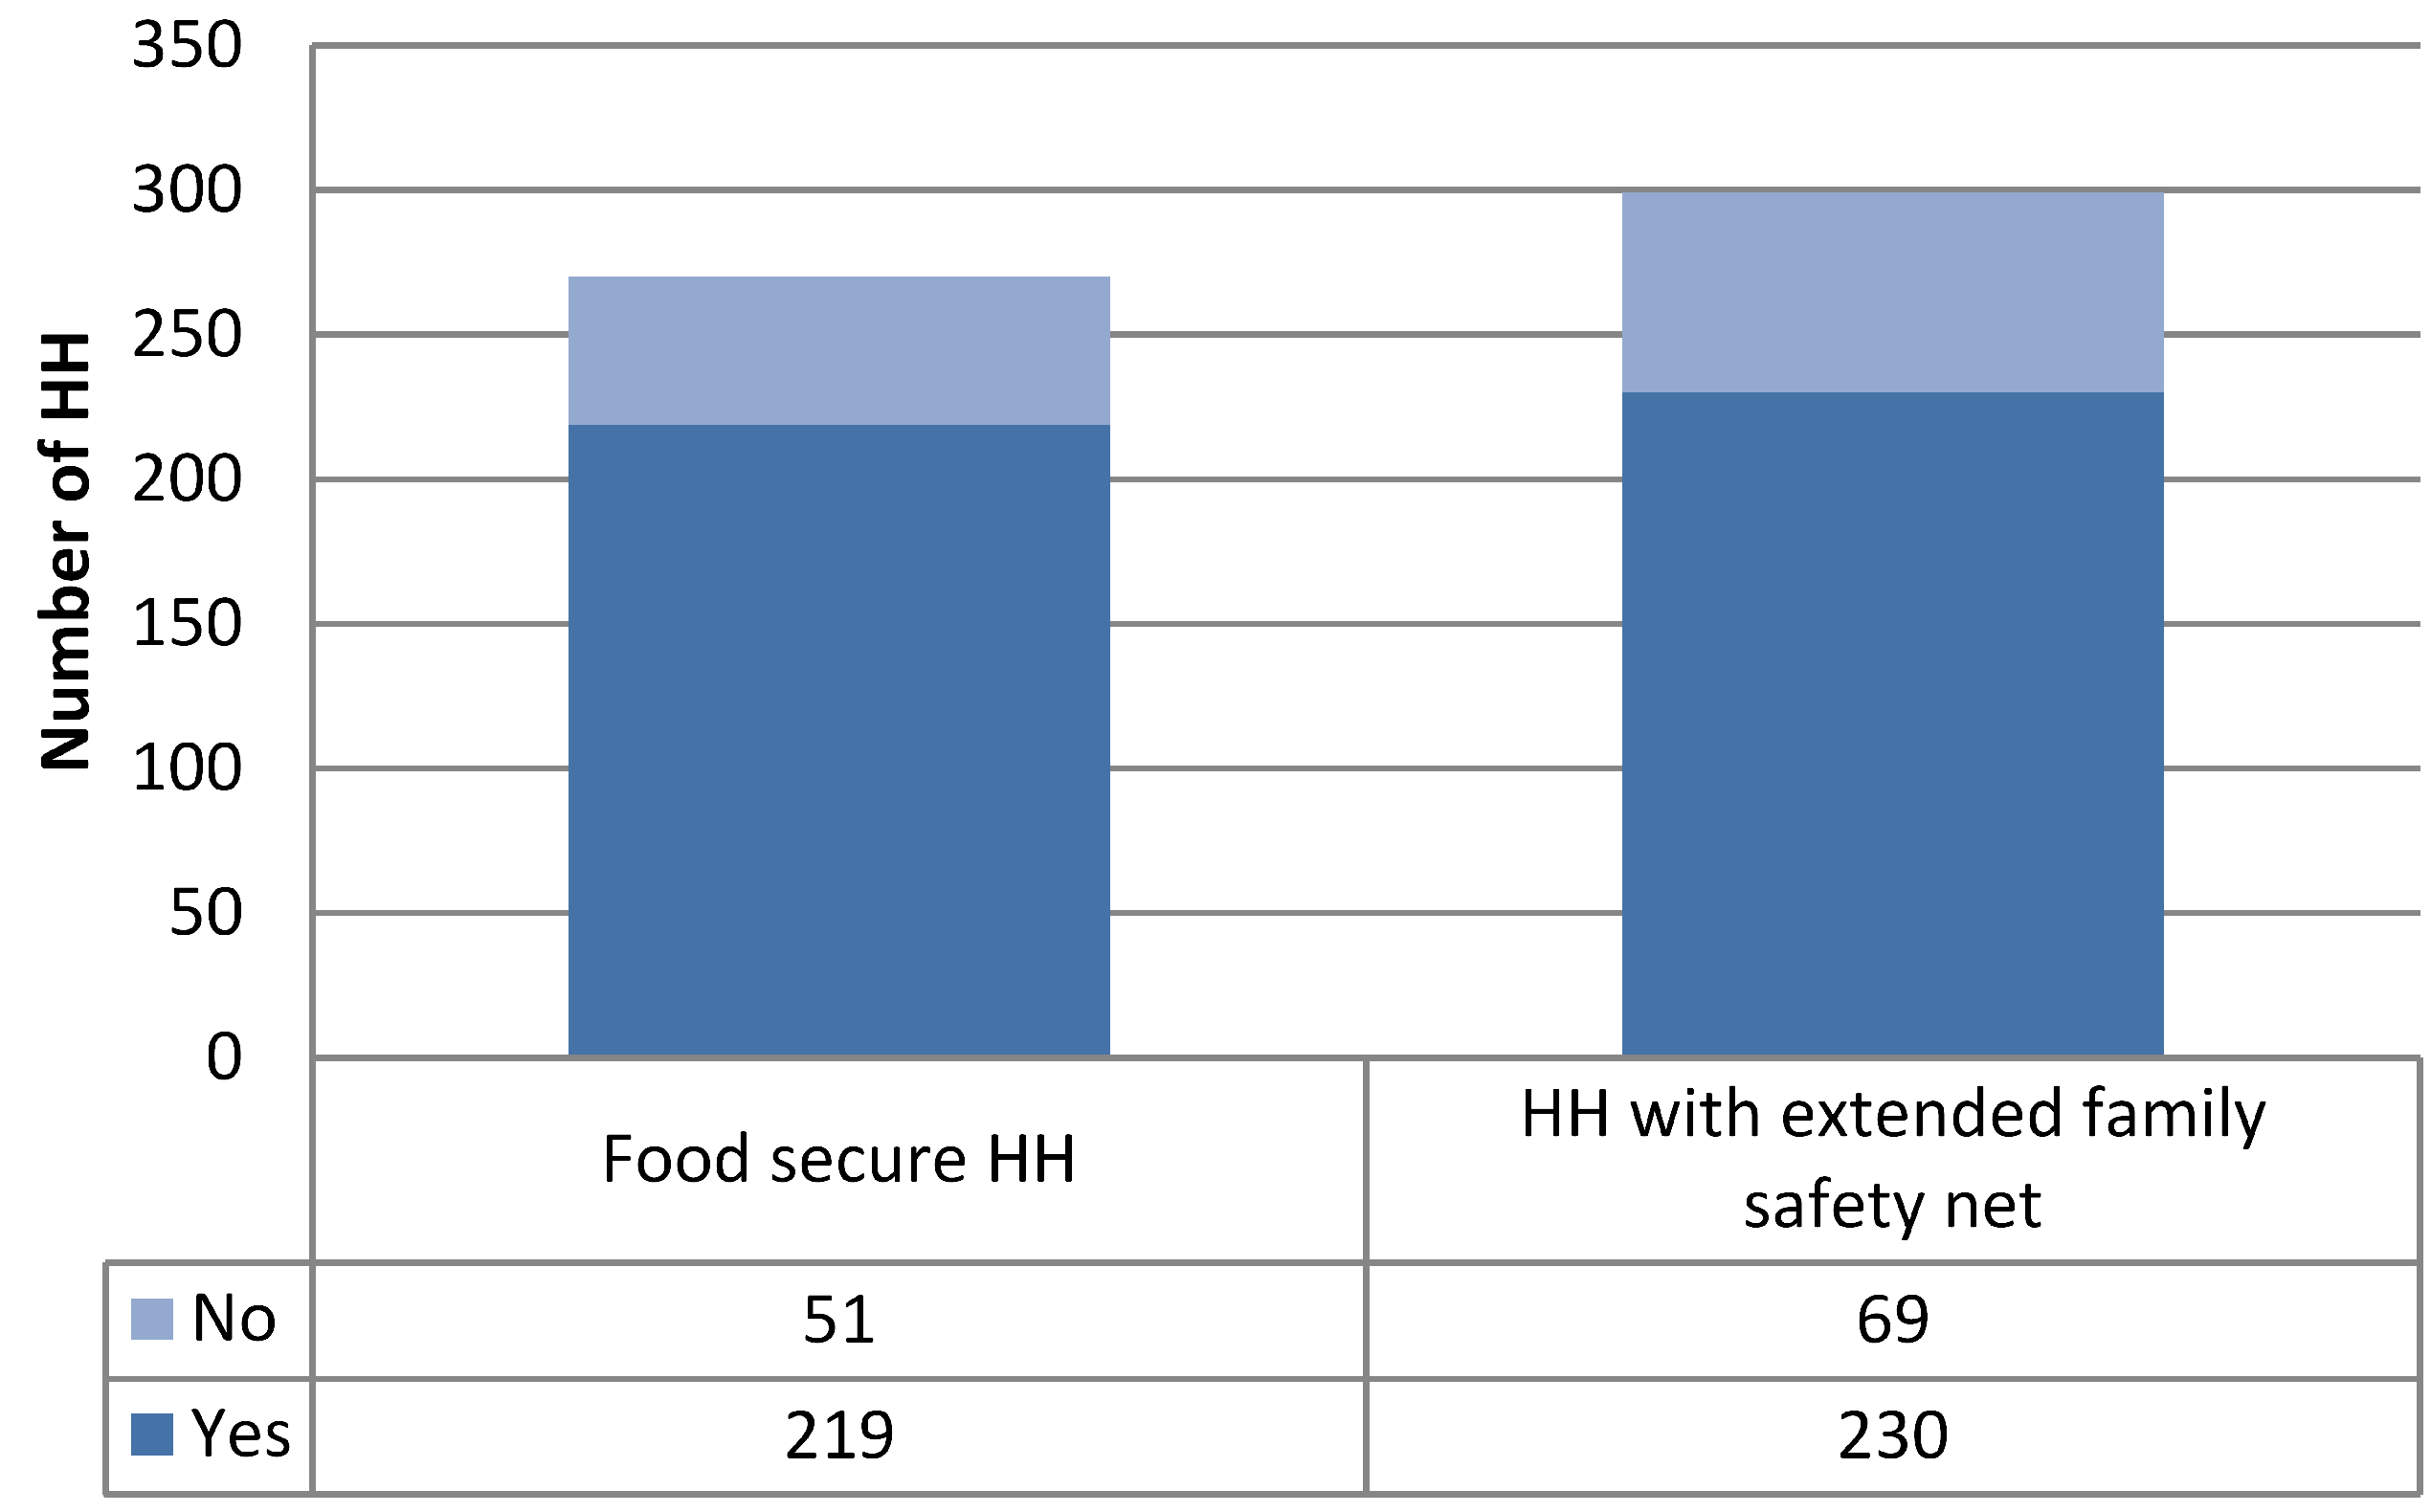
4.2.2. Community Wellbeing

The community-defined indicators of wellbeing cover a range of topics including material wealth, employment, community relations, health, education, culture and beliefs, and security (Table 2). While results were collected and shared at the individual community level, the data sharing agreement requires that any wellbeing data that can be shared with external actors must be aggregated across the 16 communities.
Across the 16 communities, respondents identified alcohol abuse (34%), unemployment (27%), and theft (10%) as the most pressing social issues affecting the population. Wellbeing results also shed light on the prevalence of water and mosquito-borne diseases as the most frequent health issues across the region over the past two years (Figure 8), yet results also show that 95% of respondents consider themselves to be in good health.
Figure 8. The most frequent health issues reported across the 16 communities in 2012 and 2013.
Forests 06 00133 g008
Results also provide important insights on interactions and social cohesion among communities in the North Rupununi. The perceived level of cooperation in the community was among the most pressing social issues, with roughly 9% of respondents choosing it as a key issue, and a quarter of respondents also describing it as “poor.” Yet, food security and the reliance on family safety nets are seen as broadly positive across households, which provides a picture of social networks and reciprocity that exists within villages as opposed to inter-communal relations (Figure 9).
Figure 9. Perceptions on food security, safety nets, and external pressures.
Forests 06 00133 g009
Outsiders from neighboring regions and countries settling and intermarrying, and the flow of people travelling through the region, were identified by respondents as a catalyst for cultural changes. Yet in terms of cultural prevalence, monitoring results show that 71% of respondents as a whole are fluent in the Makushi language, which suggests the retention of Makushi identity across the communities in the North Rupununi even with these growing internal changes. Results also highlight the local perceptions on the growing threat from illegal logging, mining, and fishing activities on community resources, with over half (51%) feeling threatened.
After the introduction of the REDD+ mechanism, these data may serve in the assessment of changes in migratory patterns, social ills, health, and social cohesion, thereby contributing towards the national Safeguard Information System. Furthermore, the wide range of community-defined wellbeing indicators, which go beyond simple indicators of poverty, demonstrate the importance of engaging forest-dependent communities in providing information on social safeguards. A transparent data sharing protocol is essential in ensuring that data provided by communities is used appropriately.

5. Discussion

5.1. Contributions of Community-Based Monitoring to National MRV Systems for REDD+

Local drivers of deforestation and forest degradation are not often captured in national forest monitoring systems or through remote sensing and thus, particularly in countries where local drivers of deforestation and degradation are important, community-based monitoring offers an important source of information to complement existing datasets [10]. Furthermore, the results from Guyana suggest that while national classifications of deforestation drivers tend to omit traditional farming systems due to their regenerative nature and low permanence, their role in forest change is still unclear given the changing local realities resulting from responses to climate variables and other external pressures. Rotation patterns that characterize traditional farming and the growing role of cash crops need to be assessed further over time to understand the process of recuperation of fallow lands within forest areas; the community-collected data contributes towards this understanding and would support modeling of carbon flows in the region.
Further uncertainty on the impact of local land use practices has been generated from ground truthing results, which have revealed inconsistencies between remote sensing data and forest disturbance on the ground. While the results will need to be verified, they show the value of different levels of forest monitoring, and thus give further impetus for pushing for locally-generated data flows to improve forest monitoring systems. The results also point to the need to focus on remote sensing methodologies being applied to understand forest fragmentation and degradation, in order to further understand the role of traditional farming systems within this classification.
Communities’ data from this study, consistent with regional estimates, contributed towards an understanding of aboveground carbon stocks that is in turn important for understanding the impact of land use practices on carbon stocks over time and in calculating emission factors. Understanding carbon sequestration rates and the potential loss or contribution of traditional farming practices to carbon stocks is important in determining the sustainable fallow and rotation periods needed for communities wanting to understand and participate in REDD+ schemes. In order to better understand the accumulation of biomass over time in fallow fields, measurements of narrower age classes could be captured if needed.
The results from the Community Demonstration Site and subsequent reporting to the GFC highlight the need to harmonize forest type classifications and species taxonomies when communities are contributing to national analysis. The divergence between community and national definitions demonstrates the challenges of linking indigenous knowledge systems of forests to national and scientific classifications. Standard protocols for data collection and reporting can also support the integration of community-collected data into national forest monitoring systems.

5.2. Providing Data for REDD+ Safeguard Information Systems

Beyond MRV, the variety of data collected on wellbeing and natural resource use has clear relevance for REDD+ monitoring and Safeguard Information Systems, through assessing the social and environmental impacts resulting from wider national interventions targeting community forest areas. While this has not been a direct focus under the national MRVS roadmap in Guyana, safeguards under bilateral agreements, such as the current Guyana–Norway agreement and a future international REDD+ mechanism, will require information on safeguards. As countries such as Guyana develop Safeguard Information Systems it will be important to extend CBM approaches and demonstrate the efficacy of community-collected data for REDD+ safeguards.
A key outcome of CBM beyond its national contributions is that communities participating in monitoring are more knowledgeable about the value of forest in their territories and REDD+ more broadly and thus more engaged, which can help in future decision-making related to the planned “opt-in” mechanisms under the LCDS in Guyana. Results from a project evaluation exercise showed that 85% of community leaders (Toshaos and village councilors) felt the priorities of their communities had been taken into account in drawing up the monitoring framework, which is fundamental for embedding monitoring results and aligning priorities at the local level. Beyond REDD+, CBM can assist communities in assessing and understanding their forests further, and in planning resource use and sustainable development that are in line with wider forest policy initiatives such as REDD+.

5.3. Harnessing Technology for Scale

REDD+ under the UNFCCC requires national level MRV, and thus both integrating and scaling-up locally-based CBM initiatives are key challenges for national forest monitoring systems. The use of digital technology in overcoming data integration challenges and facilitating more efficient data collection, data processing, and sharing has been tested in a number of CBM projects [17]. Yet while technology has been an enabler for improving accuracy through reducing transcription errors, data processing, and quicker data sharing, it has also introduced new challenges in terms of building local capacity for data management and analysis, which is important for ownership and incentivizing control and buy-in by community members.
The case study demonstrates that participatory training approaches that are adapted to the local realities and cultural context and the development of guidelines and procedures to clarify data collection, processing, and reporting steps for monitoring can support the required capacity building on using technology-based monitoring systems. However, the local project management team is still reliant on the support of consultants and the project facilitators to analyze the data using advanced tools such as Arc GIS and Google Maps Engine.

5.4. Sustainability

The cost-efficacy of CBM is a key factor when considering its inclusion within national forest monitoring systems. While CBM can be advantageous in terms of lowering the cost of data collection over time, in the case of Guyana, the high initial costs of developing a CBM system using technology and local capacity building programs is a key challenge for scale.
Furthermore, the experience in Guyana shows that in order to regularly collect data and maintain a monitoring system, tangible local benefits are imperative. Community members undertaking this work need financial compensation for their service, as relying on community reciprocity or participation alone cannot compensate for the opportunity cost of engaging in more attractive economic activities (like mining) that can add considerably to the costs of sub-national monitoring models.
Community learning networks could play an important role in wider and more accessible capacity building programs to enable knowledge and information sharing at the local level on CBM. This approach was successfully trialed with community-to-community training on forest monitoring between CMRV project members from the North Rupununi and Wai Wai communities in the Konashen Community-Owned Protected Area. By utilizing the capacity of local institutions and actors, this approach can provide a role for communities in replicating and scaling the CBM approach nationally and reduce the upfront costs of implementing a CBM system.
However, without long-term, holistic, and sustainable financing for CBM, initiatives are constrained to the project level. At present, policy uncertainties at the national level on the MRVS and the future REDD+ mechanism have been barriers to progress in Guyana. Defining the benefit-sharing framework and opt-in mechanism for community performance-based payments under the national REDD+ program is an essential first step in clarifying community participation in REDD+ and further understanding the sustainability of CBM within it.

6. Conclusions

The results from subnational monitoring in Guyana show that communities are highly capable of identifying and assessing local drivers of deforestation; in carrying out ground-based validation of satellite data on forest change; and in measuring aboveground carbon stocks. All of these are key inputs for national forest inventories and monitoring systems and in developing the national MRV architecture in Guyana.
However, going beyond REDD+ MRV, community-collected data can also provide information for Safeguard Information Systems (SIS). While national SIS are in the early stages of development, the case study demonstrates not only the relevance of community-collected data for safeguards but the importance of engaging forest-dependent communities in the development of locally appropriate safeguards.
The integration of CBM in REDD+ is likely to depend on national and international priorities, costs, and the perceived capacity and role of communities in addressing key REDD+ requirements. Experiences in participatory monitoring initiatives among communities of the North Rupununi further support similar conclusions worldwide—that forest-dependent communities are best placed to identify and collect information that can contribute towards addressing national REDD+ requirements on MRV and SIS.

Acknowledgments

The authors would like to acknowledge the financial support from the Norwegian Agency for Development Cooperation (NORAD) for the implementation of this project. The support of our partners in Guyana, the North Rupununi District Development Board (NRDDB) and the Iwokrama International Centre for Rainforest Conservation and Development (IIC), must also be noted. Without the hard work of the community members of the North Rupununi District, it would not have been possible to produce this paper.

Author Contributions

The research and outputs presented are the result of a collective work undertaken by project partners and staff for the CMRV project. The authors, Helen Bellfield, David Sabogal, Matt Leggett, and Lucy Goodman, are all staff members at the Global Canopy Programme responsible for different components of the wider “Forest Compass: Community Powered Assessment of Safeguards and Ecosystem Services” project funded by NORAD.

Conflicts of Interest

The Global Canopy Programme has received funding from NORAD to coordinate the actors involved in this community MRV project.

References

  1. Decision 4/CP.15, Addendum, FCCC/CP/2009/11/Add.1, March 2010. In Proceedings of the Conference of the Parties on Its 15th Session, Copenhagen, Denmark, 7–19 December 2009.
  2. Decision 1/CP.16, Addendum, FCCC/CP/2010/7/Add.1. March 2011. In Proceedings of the Conference of the Parties on Its 16th Session, Cancun, Mexico, 29 November–10 December 2010.
  3. Decision 2/CP.17, Addendum, FCCC/COP/2011/9/Add.1, March 2012. In Proceedings of the Conference of the Parties on Its 17th Session, Durban, South Africa, 28 November–11 December 2011.
  4. Decision 9/CP.19, Addendum, FCCC/CP/2013/10/Add.1, January 2014. In Proceedings of the Conference of the Parties on Its Nineteenth Session, Warsaw, Poland, 11–23 November 2013.
  5. Larson, A.M.; Brockhaus, M.; Sunderlin, W.D.; Duchelle, A.; Babon, A.; Dokken, T.; Pham, T.T.; Resosudarmo, I.A.P.; Selaya, G.; Awono, A.; et al. Land tenure and REDD+: The good, the bad and the ugly. Glob. Environ. Chang. 2014, 23, 678–689. [Google Scholar] [CrossRef]
  6. Danielsen, F.; Burgess, N.D.; Jensen, P.M.; Pirhofer-Walzl, K. Environmental monitoring: The scale and speed of implementation varies according to the degree of people’s involvement. J. Appl. Ecol. 2010, 47, 1166–1168. [Google Scholar] [CrossRef]
  7. Schelhas, J.; Samar, S.; Johnson, C.; Asumadu, K.; Tease, F.; Stanturf, J.; Blay, D. Opportunities and capacity for community-based forest carbon sequestration and monitoring in Ghana. Nature Fauna 2010, 25, 41–45. [Google Scholar]
  8. Brewster, J.; Bradley, A.; Yeang, D. Community-based Monitoring, Reporting and Verification (MRV): An Assessment in the Oddar Meanchey Community Forestry REDD+ Site, Cambodia; Lessons Learned Report; United Nations Development Programme (UNDP): Phnom Penh, Cambodia, 2011. [Google Scholar]
  9. Skutsch, M.; Balderas Torres, A. Expanding MRV for assessment of policy effectiveness and as a basis for benefit distribution (Chapter 10). In Capacity Development in National Forest Monitoring: Experiences and Progress for REDD+; Mora, B., Herold, M., de Sy, V., Wijaya, A., Verchot, L., Penman, P., Eds.; Center for International Forestry Research (CIFOR): Bogor, Indonesia, 2013. [Google Scholar]
  10. Pratihast, A.K.; Herold, M.; de Sy, V.; Murdiyarso, D.; Skutsch, M. Linking community-based and national REDD+ monitoring: A review of the potential. Carbon Manag. 2013, 4, 91–104. [Google Scholar] [CrossRef]
  11. Larrazábal, A.; McCall, M.K.; Mwampamba, T.H.; Skutsch, M. The role of community carbon monitoring for REDD+: A review of experiences. Curr. Opin. Environ. Sustain. 2012, 4, 707–716. [Google Scholar] [CrossRef]
  12. Danielsen, F.; Adrian, T.; Brofeldt, S.; van Noordwijk, M.; Poulsen, M.K.; Rahayu, S.; Rutishauser, E.; Theilade, I.; Widayati, A.; An, N.; et al. Community monitoring for REDD+: International promises and field realities. Ecol. Soc. 2013, 18, 41. [Google Scholar] [CrossRef]
  13. Austin, K.; Stolle, F. Community-based Monitoring. In REDD+ Measurement, Reporting and Verification (MRV) Manual; Hewson, J., Steininger, M., Pesmajoglou, S., Eds.; USAID-supported Forest Carbon, Markets and Communities Program: Washington, DC, USA, 2013. [Google Scholar]
  14. Skutsch, M.; Zahabu, E.; Karky, B.S.; Danielsen, F. The Costs and Reliability of Forest Carbon Monitoring by Communities. In Community Forest Monitoring for the Carbon Market: Opportunities Under REDD; Skutsch, M., Ed.; Earthscan: Washington, DC, USA, 2011. [Google Scholar]
  15. Danielsen, F.; Burgess, N.D.; Balmford, A. Monitoring matters: Examining the potential for locally-based approaches. Biodivers. Conserv. 2005, 14, 2507–2820. [Google Scholar] [CrossRef]
  16. Danielsen, F.; Skutsch, M.; Burgess, N.D.; Jensen, P.M.; Andrianandrasana, H.; Karky, B.; Lewis, R.; Lovett, J.C.; Massao, J.; Ngaga, Y.; et al. At the heart of REDD+: A role for local people in monitoring forests? Conserv. Lett. 2011, 4, 158–167. [Google Scholar] [CrossRef]
  17. Pratihast, A.K.; Herold, M.; Avitabile, V.; de Bruin, S.; Bartholomeus, H.; Ribbe, L. Mobile devices for community-based REDD+ monitoring: A case study for central Vietnam. Sensors 2012, 13, 21–38. [Google Scholar] [CrossRef] [PubMed]
  18. Hvalkof, S. Imperatives for REDD+ Sustainability: Non-Carbon Benefits, Local and Indigenous Peoples; International Work Group for Indigenous Affairs (IWGIA): Copenhagen, Denmark, 2013. [Google Scholar]
  19. Skutsch, M.; Vijge, M.J.; Turnhout, E.; den Besten, J.W.; Wits, T.; Herold, M. InfoBrief No. 2: Options for a national framework for benefit distribution and its integration with REDD+ monitoring. In Proceedings of the Workshop convened by WWF Netherlands and WU on REDD+ Measuring, Reporting and Verification—Science Solutions to Policy Challenges’, Zeist, The Netherlands, 10–12 June 2013.
  20. De Sy, N. Forest monitoring should integrate biodiversity and socioeconomic data, say experts. Available online: http://blog.cifor.org/13018/forest-monitoring-should-integrate-biodiversity-and-socioeconomic-data-say-experts#.UuKkKhBFDIU (accessed on 13 March 2014).
  21. Palmer Fry, B. Community forest monitoring in REDD+: The “M” in MRV. Environ. Sci. Policy 2011, 14, 181–187. [Google Scholar] [CrossRef]
  22. Lund, J.F. Towards a more balanced view on the potentials of locally-based monitoring. Biodivers. Conserv. 2014, 23, 237–239. [Google Scholar] [CrossRef]
  23. Case-Studies: Getting Countries MRV Ready; Lessons from Mexico and Guyana; Conservation International: Arlington, VA, USA, November 2012.
  24. Guyana REDD+ Monitoring Reporting & Verification System (MRVS) Year 3 Interim Measures Report 01 January 2012–31 December 2012; Guyana Forestry Commission: Georgetown, Guyana, 2013.
  25. Joint Concept Note; Government of Guyana: Georgetown, Guyana; Government of Norway: Oslo, Norway, 2012.
  26. Guyana’s REDD+ Governance Development Plan; Office of the President, Republic of Guyana: Georgetown, Guyana, June 2011.
  27. Developing a Framework for an “Opt in” Mechanism for Amerindian Villages; Concept Paper; Office of the President, Republic of Guyana: Georgetown, Guyana, March 2010.
  28. Bholanath, P.; Dewnath, N.; Singh, J. Developing a monitoring, reporting and verification system for REDD+ in Guyana. In Capacity Development in National Forest Monitoring: Experiences and Progress for REDD+; Mora, B., Herold, M., de Sy, V., Wijaya, A., Verchot, L., Penman, P., Eds.; CIFOR: Bogor, Indonesia, 2013. [Google Scholar]
  29. Terms of Reference for Developing Capacities for a National Monitoring, Reporting and Verification System to Support REDD+ Participation of Guyana Background, Capacity Assessment and Roadmap; Guyana Forestry Commission: Georgetown, Guyana, 2009.
  30. Chave, J.; Andalo, C.; Brown, S.; Cairns, M.A.; Chambers, J.Q.; Eamus, D.; Fölster, H.; Fromard, F.; Higuchi, N.; Kira, T.; et al. Tree allometry and improved estimation of carbon stocks and tree balance in tropical forests. Ecosyst. Ecol. 2005, 144, 87–99. [Google Scholar]
  31. Alder, D.; van Kuijk, M. A Baseline Assessment of Forest Carbon in Guyana; Guyana Forestry Commission: Georgetown, Guyana, 12 June 2009. [Google Scholar]

