Article

Soil Carbon Stocks in Two Hybrid Poplar-Hay Crop Systems in Southern Quebec, Canada

1
Department of Natural Resource Sciences, McGill University, Ste Anne de Bellevue, QC, H9X 3V9, Canada
2
Institut de Recherche en Biologie Végétale, Université de Montréal & Jardin botanique de Montréal, Montreal, QC, H1X 2B2, Canada
3
Sciences Naturelles, Université du Québec en Outaouais, Ripon, QC, J0V 1V0, Canada
4
Department of Geography, McGill University, Montreal, QC, H3A 0B9, Canada
*
Author to whom correspondence should be addressed.
Forests 2014, 5(8), 1952-1966; https://doi.org/10.3390/f5081952
Submission received: 20 January 2014 / Revised: 2 July 2014 / Accepted: 30 July 2014 / Published: 7 August 2014
(This article belongs to the Special Issue Forest and Wood Vegetation Carbon Stores and Sequestration)

Abstract

:
Tree-based intercropping (TBI) systems, consisting of a medium to fast-growing woody species planted in widely-spaced rows with crops cultivated between tree rows, are a potential sink for atmospheric carbon dioxide (CO2). TBI systems contribute to farm income in the long-term by improving soil quality, as indicated by soil carbon (C) storage, generating profits from crop plus tree production and potentially through C credit trading. The objectives of the current study were: (1) to evaluate soil C and nitrogen (N) stocks in soil depth increments in the 0–30 cm layer between tree rows of nine-year old hybrid poplar-hay intercropping systems, to compare these to C and N stocks in adjacent agricultural systems; and (2) to determine how hay yield, litterfall and percent total light transmittance (PTLT) were related to soil C and N stocks between tree rows and in adjacent agricultural systems. The two TBI study sites (St. Edouard and St. Paulin) had a hay intercrop with alternating rows of hybrid poplar clones and hardwoods and included an adjacent agricultural system with no trees (i.e., the control plots). Soil C and N stocks were greater in the 0–5 cm depth increment of the TBI system within 1 m of the hardwood row, to the west of the poplar row, compared to the sampling point 1 m east of poplar at St. Edouard (p = 0.02). However, the agricultural system stored more soil C than the nine-year old TBI system in the 20–30 cm and 0–30 cm depth increments. Accumulation of soil C in the 20–30 cm depth increment could be due to tillage-induced burial of non-harvested crop residues at the bottom of the plow-pan. Soil C and N stocks were similar at all depth increments in TBI and agricultural systems at St. Paulin. Soil C and N stocks were not related to hay yield, litterfall and PTLT at St. Paulin, but hay yield and PTLT were significantly correlated (R = 0.87, p < 0.05, n = 21), with lower hay yield in proximity to trees in the TBI system and similar hay yields in the middle of alleys as in the agricultural system. Nine years of TBI practices did not produce significant gains in soil C and N stocks in the 0–30 cm layer, indicating that the total C budget, including C sequestered in trees and unharvested components (litterfall and roots), must be assessed to determine the long-term profitability of TBI systems in Canada.

1. Introduction

Canadian agricultural operations contribute approximately 8% of national greenhouse gas (GHG) emissions each year, mainly from fertilizers, enteric fermentation and manure management [1]. With improved management of cropland and forests, it is possible to mitigate GHG emissions through carbon (C) sequestration while enhancing soil and crop productivity. In 2011, the Agreement for the Agricultural Greenhouse Gases Program (AAGGP), administered through Agriculture and Agri-Food Canada, was initiated to assess agricultural technologies that would help achieve this goal. Tree-based intercropping (TBI) systems, which combine widely-spaced tree rows of a medium to fast-growing woody species, such as poplar (Populus spp.), were one of the technologies prioritized for investigation by AAGGP, because trees can be a sink for atmospheric carbon dioxide (CO2), as well as a long-term source of farm income [2,3]. Globally, agroforestry technologies, including TBI systems, provide opportunities for C sequestration, and other environmental and financial benefits [4].
Canadian farmers require evidence of the economic benefits of TBI systems to consider adopting this technology. Studies on the productivity (yield of trees and crops) and the economic profitability of Canadian TBI systems have considered tree species, tree planting density and height and crown diameter, crop species, manure and fertilizer application rates and timing, soil type and the age of a system [5,6]. Tree species assessed for Canadian TBI systems included hybrid poplars and high-valued hardwood species, such as Juglans nigra L., Quercus rubra L., Prunus serotina Ehrh., Fraxinus americana L. and Fraxinus pennsylvanica Marsh. [7]. Crops grown in Canadian TBI systems included grain crops, like corn (Zea mays L.) and cereals, although oilseeds, such as soybean (Glycine max (L.) Merill) and canola (Brassica napus L.), were evaluated in some studies [7]. These studies generally concluded that crop yields were maintained and that soil quality was improved in TBI systems. Soil quality improvements included greater soil microbial biomass, diversity and stability, higher nutrient cycling efficiency [7,8] and more soil C storage for a 21-year-old TBI system [9].
The main factors that influence soil C and nitrogen (N) dynamics in TBI systems include litterfall and light availability [2]. Litterfall from trees, as well as the unharvested part of the crop, i.e., intercrop residues, are a source of quickly decomposing C substrates that promote microbial activity and contribute to soil C storage in TBI systems [10,11]. Trees are expected to grow large enough, such that they begin to shade the inter-row area for part of the day, depending on tree spacing and growth habit, reducing evapotranspiration and keeping the soil surface cooler, which would slow decomposition in the topsoil and, thus, reduce CO2 loss from the system [10,11]. However, light required for crop growth may also be intercepted, thus reducing crop yield. A decline in crop yield in the short-term is not desirable for the producer who needs to make a profit from the annually-harvested intercrop. However, if this is offset by greater soil (and tree) C sequestration in the longer term and assuming that there is economic value in C sequestration, the trade-off may be acceptable to the producer.
Given that TBI systems receive C inputs from tree litterfall and may have lower decomposition rates than systems without trees, we hypothesized greater soil C storage near the soil surface (e.g., 0–5 cm soil depth) and in the topsoil layer (e.g., 0–30 cm soil depth) of a TBI system compared to an agricultural system producing the same crop. Our objective was to evaluate the soil C and N stocks in the 0–5 cm and 0–30 cm depths between tree rows of nine-year old hybrid poplar-hay intercrop systems and to compare these C and N stocks to those in adjacent agricultural systems. Since C and N stocks in these TBI systems may be affected by litterfall, light interception and hay yield, these relationships were evaluated with correlation analysis.

2. Experimental Section

2.1. Site Description

The experimental sites were nine-year old TBI hybrid poplar systems at St. Paulin (46°27′ N, 72°59′ W, 141 m above sea level; Southern Quebec, Canada) and St. Edouard (46°20′ N, 73°11′ W, 176 m above sea level). The selected characteristics of the experimental sites are provided in Table 1, with additional information on the experimental design and land management (tillage, fertilization and pruning) in the following sections. Figure 1 illustrates the site layout and location of these TBI systems.

2.2. Experimental Design

At each site, the experimental design was a randomized complete block design with three blocks and two systems (TBI system and agricultural system with no trees) established in 2004. Each TBI plot was bounded on both sides by rows of hybrid poplar, with two arable alleys in the middle separated by one row of hardwood species (Figure 2). At St. Paulin, the control plots (i.e., the agricultural system with no trees; hereafter referred to as “agricultural system”) were randomly assigned with one per block (Figure 1b). The TBI plots and agricultural system plots were side-by-side, and the agronomic procedures (e.g., crop species, fertilizer and manure applications, tillage) were the same in all plots within each block. At St Edouard, the agricultural system was located at the north and south ends of the experimental field, outside of the TBI experiment (Figure 1c). Agronomic practices, including crop species, fertilizer and manure application and tillage, were the same in the TBI and agricultural system plots, including historical land use and agronomic activities before trees were planted. In the current study, we limited our sampling of the TBI system to alleys bounded by one clone of poplar, DN3570 (DN denotes Populus deltoids x nigra hybrid).
Table 1. Characteristics of the experimental tree-based intercropping systems at St. Paulin and St. Edouard, southern Quebec, Canada.
St. PaulinSt. Edouard
Soil characteristicsLoamy sand (79% sand, 5% clay, 16% silt) 1; pH water 6.2 (5.2–6.8) 1; classified as Dystric Brunisol 2Loamy sand (86% sand, 2% clay, 12% silt) 1; pH water 6.3 (5.3–6.8) 1; classified as Humo-Ferric Podzol 2
ClimateMean annual precipitation: 1113 mm yr−1Mean annual precipitation: 1079 mm yr−1
Mean annual temperature: 4 °C 3Mean annual temperature: 3 °C 3
Poplar speciesDN3333 (P. deltoides × P. nigra, cv. Stormont, Ontario, Canada) DN3570 4 (P. deltoides × P. nigra, no cv. name, Belgium)DN3333 (P. deltoides × P. nigra, cv. Stormont, Ontario, Canada) DN3570 4 (P. deltoides × P. nigra, no cv. name, Belgium)
Hardwood speciesQuercus rubra L. and Prunus serotina Ehrh.Quercus rubra L. and Fraxinus americana L.
Tree density314 trees ha−1500 trees ha−1
1 Bambrick et al. (2010) [9] analyzed soil physical and chemical properties for the St. Edouard and St. Paulin sites; 2 Soil classification was based on Soil Classification Working Group (1998) [12] data; 3 Weather data for the St. Edouard and St. Paulin sites was sourced from Environment Canada (2008) [1]; 4 DN in DN333 and DN3570 denotes Populus deltoids x nigra hybrid.
Figure 1. Maps indicating (a) the location of the tree-based intercropping (TBI) sites in southern Quebec, Canada (©OpenStreetMap contributors), and the site layouts at (b) St. Paulin and (c) St. Edouard.
Forests 05 01952 g001
Figure 2. Sampling positions for the experimental tree-based intercropping systems at (a) St. Edouard and (b) St. Paulin, southern Quebec, Canada. The sampling position (1–6) and corresponding distance from trees in meters (m) within the tilled alleys are indicated.
Forests 05 01952 g002

2.3. Field Operations for St. Paulin

Alternating rows of hybrid poplar and high value hardwood species were 12 m apart and planted in spring, 2004. Poplar rows consisted of rooted cuttings planted at 2-m intervals, whereas hardwood rows consisted of two-year old seedlings that were planted every 3–4 m. The tree row was a 1.5 m-wide uncultivated strip, which included a 1.2 m-wide black polythene-film mulch. The edge of the tilled alley was approximately 0.8 m from the edge of the tree row. In May, 2012, the mean diameter at breast height (DBH, 1.3 m) of hybrid poplar and hardwood species was 13 cm and 4 cm, respectively. Poplar trees and hardwood trees were pruned between mid-June to mid-July to promote vertical growth, to prevent knots in the bole and to increase light availability for the agricultural intercrop. Poplar and hardwoods were pruned in 2004, 2005 and again in 2010. Hardwoods were also pruned in 2006 and 2007.
Oat (Avena sativa L.) was planted in mid-June, 2004, after tree planting. Subsequent agricultural crops were: buckwheat (Fagopyrum esculentum Moench) in 2005, 2006 and 2008; canola in 2007; winter rye (Secale cereale L.) underseeded in 2008 due to poor emergence of the buckwheat crop; a forage mix (Mix Bo–Champ 1043) with common timothy (Phleum pratense L.) and alfalfa (Medicago sativa L.) was planted in 2009 with red clover (Trifolium pratense L.) and persisted for the next four years (until 2012).
The soil was tilled from 2004 to 2009. Tillage with a disk harrow in the spring incorporated manure and residues, i.e., non-harvested residues and roots from the previous crop, into the soil at a depth of approximately 8 cm and within ~1–2 m of tree stems. Plowing with a moldboard plow (to a 15-cm depth) occurred in the fall after the harvest of annual crops, but no tillage was performed after seeding forages. Horse manure (solid manure mixed with bedding, C:N ratio of about 25:1; [13]) was broadcast on the soil surface in 2004 and 2007 at a rate of 30 Mg ha−1 with a rear-discharge manure spreader in the spring before tillage operations. In 2007 and 2012, agricultural lime (CaCO3) was applied at a rate of 5 Mg ha−1 and incorporated into the soil with fall plowing (in November). No other fertilizers were applied.

2.4. Field Operations for St. Edouard

Alternating rows of hybrid poplars (planted in 2004) and hardwood tree species were planted with a spacing of 2 m within the tree row and 10 m between rows. A 1.5 m-wide uncultivated strip was maintained along each tree row, which included a 1.2 m-wide black polythene-film mulch. The edge of the tilled alley was approximately 0.8 m from the tree row.
Poplar trees and hardwood trees were pruned between mid-June to mid-July in 2004, 2005 and again in 2010. The hardwoods were also pruned in 2006 and 2007. In May, 2012, the mean DBH of hybrid poplar and hardwood species was 13.0 cm and 5.5 cm, respectively.
Buckwheat was planted in early-June, 2004, after tree seedlings were planted, in spring, 2005, and spring, 2006. Winter rye was planted in September, 2004 and 2006, and winter wheat (Triticum aestivum L.) was planted in September, 2005. Canola was planted in 2007 and 2008. No crop (fallow) was planted in 2009 and 2010. Buckwheat was planted in 2011, and a forage mix (Mix Bo-Champ 1043) with common timothy and alfalfa was planted in 2012.
Intercropped and agricultural system plots were tilled from 2004 to 2008 and again in 2011 and 2012. The field was plowed and harrowed in spring, 2012, prior to planting the forage mix, with no further tillage done during forage establishment and growth phases. At St. Edouard, 40 kg N ha−1 were applied as ammonium nitrate on 19 May 2005. Fertilizer N:phosphorus:potassium (N:P2O5:K2O; 30:38:43; custom blend) was applied before seeding in 2006, with additional 74 kg N ha−1, applied as ammonium nitrate, on May 10, 2006. Agricultural lime (5 Mg ha−1) was applied in 2007. Cow manure (liquid slurry, C:N ratio of approximately 10:1; [14]) was broadcast on the soil surface at a rate of 2170 L ha−1 with a low-boom tanker truck and incorporated into the soil along with residues, i.e., non-harvested residues and roots from previous crop, prior to seeding the forage mix in May, 2012.

2.5. Soil Sampling and Analysis

Soil samples were collected in October, 2012, by making composites of three soil samples taken randomly from each plot with a 7.6-cm diameter soil corer, at three depths (0–5 cm, 5–20 cm and 20–30 cm). Samples were collected from the six positions indicated in Figure 2, as well as the agricultural system. Soil samples were kept on ice while in the field and refrigerated at 4 °C until analysis. A subsample of soil from each plot and sampling depth was dried (60 °C for three days), finely ground and sieved to pass a 40-μm sieve before analysis for total C and N with a ThermoFinnigan Flash EA 1112 CN analyzer (Carlo Erba, Milan, Italy). A previous study at the same sites detected no carbonates in these soils following treatment with dilute acid (1 M HCl), so it was assumed that total C was equivalent to organic C [9]. Soil bulk density was measured by taking an intact core (3-cm diameter) from the middle of the following soil depths: 0–5, 5–10, 10–20 and 20–30 cm. For instance, for the 5–10 cm depth, soil bulk density cores were collected from the middle of that depth increment (6 to 9 cm). Bulk density was determined by drying (60 °C) the soil to a constant mass and weighing it. The soil C stocks were calculated using Equation (1).
Soil C stock (kg m−2) = BD (g cm−3) × soil depth (cm) × C (g g−1) × 10
where BD is bulk density and the conversion factor for g to kg is 1000 and for cm2 to m2 is 10,000. Soil N stocks were calculated similarly. Soil C and N stocks in the 5–20-cm soil depth were calculated using an average BD value for the 5–10- and 10–20-cm soil depth increments, the measured soil C content (g g−1) for the 10–20-cm depth increment and Equation (1). The soil C and N stocks in the 0–30-cm depth were calculated as the sum of the total depths (0–5, 5–20 and 20–30 cm).

2.6. Yield

Hay yield data was collected in June, 2012, at the St. Paulin site only. Two transects were designated within each experimental plot to capture the yield variability due to shading and other effects of the hardwood (red oak and black cherry) and poplar (clone DN3750) rows. The sampling quadrat of 0.25 m2 (50 cm × 50 cm) was located 1.5, 3.5 and 6 m from the row for hardwoods and poplar, within 1 m of the soil sampling positions depicted in Figure 2b and at 3.5 m between 1 and 2, 2 and 3, etc. The agricultural system plots were sampled from two quadrats positioned in the center of the plot, with a 2-m distance between them. Yield results were averaged between the two quadrats and extrapolated to a kg m−2 basis. Yield was determined by cutting the above-ground biomass to ground level with grass shears, placing the biomass in a paper bag for transport, drying (60 °C for three days) and weighing. The C content was set at 45% of the harvested biomass on a dry matter basis, based on literature values [15]. No hay was collected from the St. Edouard site in 2012, because forages are not harvested during the establishment year.

2.7. Litterfall

At the St. Paulin and St. Edouard sites, litterfall data was collected at two-week intervals from June–October, 2012. Two transects were designated within each experimental plot to capture the litterfall variability from the hardwood and poplar rows. The litterfall traps (dimensions: 0.25 m2, 50 cm × 50 cm) were placed at six positions, shown in Figure 2, as well as in the center of the agricultural system. Litterfall (mixed, from all tree species) was collected in a plastic bag, transferred to a paper bag, dried (60 °C for three days) and weighed to get litterfall dry mass (kg m−2). The C content of litterfall was assumed to be 45%, based on literature C values [15]. Cumulative litterfall during the period June–October, 2012, was the sum of litterfall dry mass measured at two-week intervals, and the litterfall C stock was calculated using Equation (2).
Litterfall C stock (kg C m−2) = ∑ (litterfall dry mass (kg m−2) × 45/100)

2.8. Percent Total Light Transmittance (PTLT)

The percent total light transmittance (PTLT) was estimated from hemispherical photographs taken on 26–27 July 2011, at the St. Paulin site only. Pictures were taken 1 m above the soil surface with a digital camera (Nikon Coolpix 990, Tokyo, Japan) equipped with a fisheye lens (Nikon fisheye converter FC–E8, Tokyo, Japan) at distances of 0, 1, 2, 3 and 6 m from the hardwood tree row, on the east and west sides, as well as in the center of the agricultural system, for the east and west direction (a total of 11 sampling locations per plot). Hemispherical photographs were also taken at the center of agricultural system plots. All photographs (n = 33) were analyzed with Gap Light Analyser (GLA) Version 2.0 (Simon Fraser University, Burnaby, BC, Canada, and the Institute of Ecosystem Studies, Millbrook, NY, USA) [16] to determine the PTLT. Since the photographs were not taken at the same distances as those of forage biomass sampling, the PTLT across the TBI alley was interpolated by a quadratic linear regression [17].

2.9. Statistical Analyses

We ran two different mixed-model analysis of variance (ANOVAs) to compare soil C and N stocks amongst positions, i.e., the distance from the tree (Figure 2), for each soil increment, and all possible interactions between these factors. There were a total of six positions within TBI systems and a position in the agricultural system (Position 7, Figure 1 and Figure 2). For both mixed-model ANOVAs, the block was a random factor, and for one mixed-model ANOVA, we used the position as a fixed factor. For the other mixed-model ANOVA, Positions 1, 3, 4 and 6 (the positions located east or west of the tree; Figure 2) were random effects to test species and orientation effects on soil C and N stocks. In both cases, ANOVAs were done separately for the two sites and separately to test the effects of the three soil depth increments (0–5, 5–20 and 20–30 cm) and the total soil depth increment (0–30 cm) on C and N stocks. When significant (p ≤ 0.05), differences in the mean soil C and N stocks among positions were compared with a Tukey test.
We then pooled data from the six positions within the TBI systems to contrast an integrated value for the TBI system with the value from Position 7, the agricultural system, allowing comparison of soil C and N stocks in the TBI system vs. the agricultural system. The pooled data were weighted, considering that each sampling position represented a proportion of the plot area within the TBI system. The integrated value for the TBI systems was then calculated according to position where the “central” sampling Points 2 and 5 account for half of the area (i.e., 0.25 for each), and the remaining “next-to-tree” Points 1, 3, 4, and 6 account for the other half (i.e., 0.125 for each). Contrast analysis was done separately for the two sites, for each of the three soil depth increments (0–5, 5–20 and 20–30 cm) and the total soil depth increment (0–30 cm).
Relationships between soil C and N stocks and litterfall were evaluated with Pearson correlation analysis for both sites, separately. Relationships between soil C and N stocks, hay yield and PTLT were assessed with Pearson correlation analysis for St. Paulin only. The sample size of the group and correlation coefficients were reported when p ≤ 0.05.

3. Results and Discussion

Soil C and N Stocks

Soil C and N stocks were greater in the 0–5-cm depth increment of the TBI system within 1 m of the hardwood row, west of the poplar row, than at the sampling point 1 m east of poplar at St. Edouard (p = 0.02, Table 2 and Table 3). There was no difference in soil C and N stocks in the 0–5-cm depth increment across the TBI system in St. Paulin (Table 4 and Table 5). Soil N stocks exhibited a similar pattern as soil C stocks in the 0–5-cm depth, due to significant correlations between soil N and C stocks at all soil depth increments at St. Edouard (R = 0.87, p < 0.05, n = 63) and at St. Paulin (R = 0.88, p < 0.05, n = 63). Soil C and N stocks were not affected by block, tree species and orientation effects (p > 0.05), suggesting normal soil variability across the two TBI systems.
Soil C and N stocks in the 0–5-cm depth increment were similar in TBI systems and agricultural systems (Positions 1–6 compared to Position 7, p > 0.05) at St. Edouard and St. Paulin (Table 2, Table 3, Table 4 and Table 5). We therefore reject our hypothesis of greater soil C and N storage in the soil surface (0–5 cm depth) of the TBI systems compared to agricultural systems producing the same crop.
At St. Edouard, soil C and N stocks in the 0–30-cm depth increment were greater in the agricultural system (11.32 ± 0.48 kg C m−2 and 1.30 ± 0.07 kg N m−2) than the integrated value for the TBI system (8.56 ± 0.74 kg C m−2 and 0.86 ± 0.12 kg N m−2) (p = 0.01 and p = 0.02, respectively; Table 2 and Table 3). At St. Paulin, there was no difference in soil C and N stocks of the 0–30-cm depth increment in the agricultural system (10.10 ± 0.79 kg C m−2 and 1.30 ± 0.17 kg N m−2) compared to the integrated value for the TBI system (8.57 ± 0.72 kg C m−2 and 0.95 ± 0.06 kg N m−2 (Table 4 and Table 5). We reject the hypothesis of greater soil C and N storage in the topsoil layer (e.g., 0–30-cm soil depth) of a TBI system compared to an agricultural system producing the same crop.
Comparing the soil C and N stocks in the soil depth increments (0–5, 5–20, and 20–30 cm) of the TBI and agricultural systems revealed greater soil C stocks, but no difference in soil N stocks, in the 20–30-cm depth increment of the agricultural system at St. Edouard (p = 0.001, Table 2 and Table 3), but had no effect on soil C and N stocks in depth increments at St. Paulin (Table 4 and Table 5). The reason that the St. Edouard site had a larger soil C stock in the 20–30-cm depth increment of the agricultural system (3.13 ± 0.23 kg C m−2) than the TBI system (1.65 ± 0.54 to 2.70 ± 0.51 kg C m−2) is attributed to residue inputs and tillage practices. Compared to agricultural systems, TBI systems have lower crop yields and less biomass in unharvested crop components, i.e., crop residues and fine roots that act as a source of quickly decomposing C substrates and promote microbial activity [10]. Fine roots could be important for building soil C stocks in the 0–30-cm depth increment of the agricultural system and intercropped area of TBI systems, since more than 95% of crop fine roots are found within the 0–35-cm soil depth increment of these study sites [17]. At St. Edouard, the unharvested crop components were plowed into the soil, to a depth of about 15 cm, before planting the forage mix in May, 2012. Poirier [18] reported that tillage-induced burial of unharvested crop residues increased soil C storage at the bottom of the plow layer, which would correspond to the 20–30-cm soil depth increment in this study.
Table 2. Average soil C stocks (kg C m−2 ± standard deviation, n = 3) for a tree-based intercropping (TBI) system and an adjacent agricultural system (Ag Sys) at St. Edouard, southern Quebec, Canada.
St. EdouardPosition 1
TBI SystemAg SysContrast 3 (p-Values)
Depth (cm)1234567TBI vs. Ag Sys
0–51.19 ± 0.13 b 21.50 ± 0.04 ab2.21 ± 0.34 ab2.31 ± 0.66 a1.74 ± 0.17 ab2.24 ± 0.35 a1.94 ± 0.35 ab0.55
5–203.20 ± 0.79 a4.76 ± 1.30 a5.84 ± 1.40 a5.33 ± 1.60 a4.23 ± 1.50 a4.10 ± 1.60 a6.25 ± 0.87 a0.08
20–301.86 ± 1.10 a1.65 ± 0.54 a2.23 ± 0.34 a2.43 ± 0.80 a1.85 ± 0.16 a2.70 ± 0.51 a3.13 ± 0.23 a0.001
0–306.24 ± 0.67 a7.90 ± 0.64 a10.28 ± 0.68 a10.07 ± 1.00 a7.82 ± 0.62 a9.04 ± 0.82 a11.32 ± 0.48 a0.01
1 Positions 1–6 correspond to positions within the TBI system as represented in Figure 2a, whereas Position 7 is in the agricultural system; 2 Means not sharing the same letter are significantly different at p < 0.05 (Tukey test), where “a” is different from “b”, but “ab” is similar to “a” and “b”; 3 p-values are the contrast analysis between an integrated value for the TBI system (Positions 1–6) and Position 7, the agricultural system.
Table 3. Average soil N stocks (kg N m−2 ± standard deviation, n = 3) for a tree-based intercropping (TBI) system and an adjacent agricultural system (Ag Sys) at St. Edouard, southern Quebec, Canada.
St. EdouardPosition 1
TBI SystemAg SysContrast 3 (p-Values)
Depth (cm)1234567TBI vs. Ag Sys
0–50.11 ± 0.05 b 20.16 ± 0.01 ab0.28 ± 0.00 ab0.38 ± 0.23 a0.21 ± 0.03 ab0.27 ± 0.05 ab0.24 ± 0.05 ab0.82
5–200.26 ± 0.11 a0.47 ± 0.25 a0.65 ± 0.21 a0.58 ± 0.12 a0.41 ± 0.27 a0.41 ± 0.28 a0.73 ± 0.08 a0.07
20–300.07 ± 0.11 a0.08 ± 0.10 a0.20 ± 0.09 a0.22 ± 0.14 a0.15 ± 0.04 a0.29 ± 0.15 a0.29 ± 0.07 a0.22
0–300.43 ± 0.09 a0.72 ± 0.12 a1.10 ± 0.10 a1.20 ± 0.16 a0.77 ± 0.12 a0.97 ± 0.16 a1.30 ± 0.07 a0.02
1 Positions 1–6 correspond to positions within the TBI system as represented in Figure 2a, whereas Position 7 is in the agricultural system; 2 Means not sharing the same letter are significantly different at p < 0.05 (Tukey test), where “a” is different from “b”, but “ab” is similar to “a” and “b”; 3 p-values are the contrast analysis between an integrated value for the TBI system (Positions 1–6) and Position 7, the agricultural system.
Table 4. Average soil C stocks (kg C m−2 ± standard deviation, n = 3) for a tree-based intercropping (TBI) system and an adjacent agricultural system (Ag Sys) at St. Paulin, southern Quebec, Canada.
St. PaulinPosition 1
TBI SystemAg SysContrast 3 (p-Values)
Depth (cm)1234567TBI vs. Ag Sys
0–51.70 ± 0.49 a 21.56 ± 0.49 a1.69 ± 0.57 a1.73 ± 0.02 a1.69 ± 0.96 a1.52 ± 0.11 a1.84 ± 0.45 a0.56
5–204.98 ± 1.20 a3.71 ± 1.30 a4.47 ± 0.99 a3.46 ± 0.55 a3.43 ± 1.20 a3.77 ± 0.60 a5.10 ± 1.10 a0.10
20–302.36 ± 1.20 a2.91 ± 0.57 a2.46 ± 0.28 a2.71 ± 0.86 a2.62 ± 1.10 a3.03 ± 0.09 a3.18 ± 0.78 a0.23
0–309.04 ± 0.98 a8.18 ± 0.80 a10.28± 0.68 a7.90 ± 0.48 a7.73 ± 1.10 a8.32 ± 0.27 a10.10 ± 0.79 a0.15
1 Positions 1–6 correspond to positions within the TBI system as represented in Figure 2b, whereas Position 7 is in the agricultural system; 2 Means not sharing the same letter are significantly different at p < 0.05 (Tukey test), where “a” is different from “b”, but “ab” is similar to “a” and “b”; 3 p-values are the contrast analysis between an integrated value for the TBI system (Positions 1–6) and Position 7, the agricultural system.
Table 5. Average soil N stocks (kg N m−2 ± standard deviation, n = 3) for a tree-based intercropping (TBI) system and an adjacent agricultural system (Ag Sys) at St. Paulin, southern Quebec, Canada.
St. PaulinPosition 1
TBI SystemAg SysContrast 3 (p-Values)
Depth (cm)1234567TBI vs. Ag Sys
0–50.22 ± 0.09 a 20.20 + 0.10 a0.22 + 0.11 a0.23 + 0.02 a0.21 + 0.20 a0.19 + 0.03 a0.25 + 0.10 a0.52
5–200.65 + 0.27 a0.38 + 0.28 a0.55 + 0.19 a0.33 + 0.13 a0.34 + 0.26 a0.42 + 0.10 a0.66 + 0.24 a0.10
20–300.24+ 0.22 a0.34 + 0.09 a0.26 + 0.06 a0.31 + 0.15 a0.27 + 0.23 a0.36 + 0.04 a0.40 + 0.16 a0.26
0–301.10 + 0.19 a0.92 + 0.16 a1.00 + 0.12 a0.87 + 0.10 a0.82 + 0.23 a0.97 + 0.06 a1.30 + 0.17 a0.13
1 Positions 1–6 correspond to positions within the TBI system as represented in Figure 2b, whereas Position 7 is in the agricultural system; 2 Means not sharing the same letter are significantly different at p < 0.05 (Tukey test), where “a” is different from “b”, but “ab” is similar to “a” and “b”; 3 p-values are the contrast analysis between an integrated value for the TBI system (Positions 1–6) and Position 7, the agricultural system.
Table 6. Cumulative carbon content (kg C m−2) of litterfall collected from July–October, 2012, in tree-based intercropping (TBI) systems and adjacent agricultural systems (Ag Sys) at St. Edouard and St. Paulin, southern Quebec, Canada. Values are the mean ± standard deviation (n = 3).
Position 1
TBI SystemAg Sys
1234567
St. Paulin0.003 ± 0.004 a 20.002 ± 0.001 a0.004 ± 0.004 a0.003 ± 0.001 a0.002 ± 0.001 a0.001 ± 0.002 a0.004 ± 0.005 a
St. Edouard0.028 ± 0.020 ab0.006 ± 0.004 b0.019 ± 0.011 ab0.015 ± 0.010 ab0.007 ± 0.011 ab0.038 ± 0.037 a0.008 ± 0.006 ab
1 Positions 1–6 correspond to positions within the TBI system as represented in Figure 2a and Figure 2b, whereas Position 7 corresponds to agricultural system plots; 2 Means not sharing the same letter are significantly different at p < 0.05 (Tukey test), where “a” is different from “b”, but “ab” is similar to “a” and “b”.
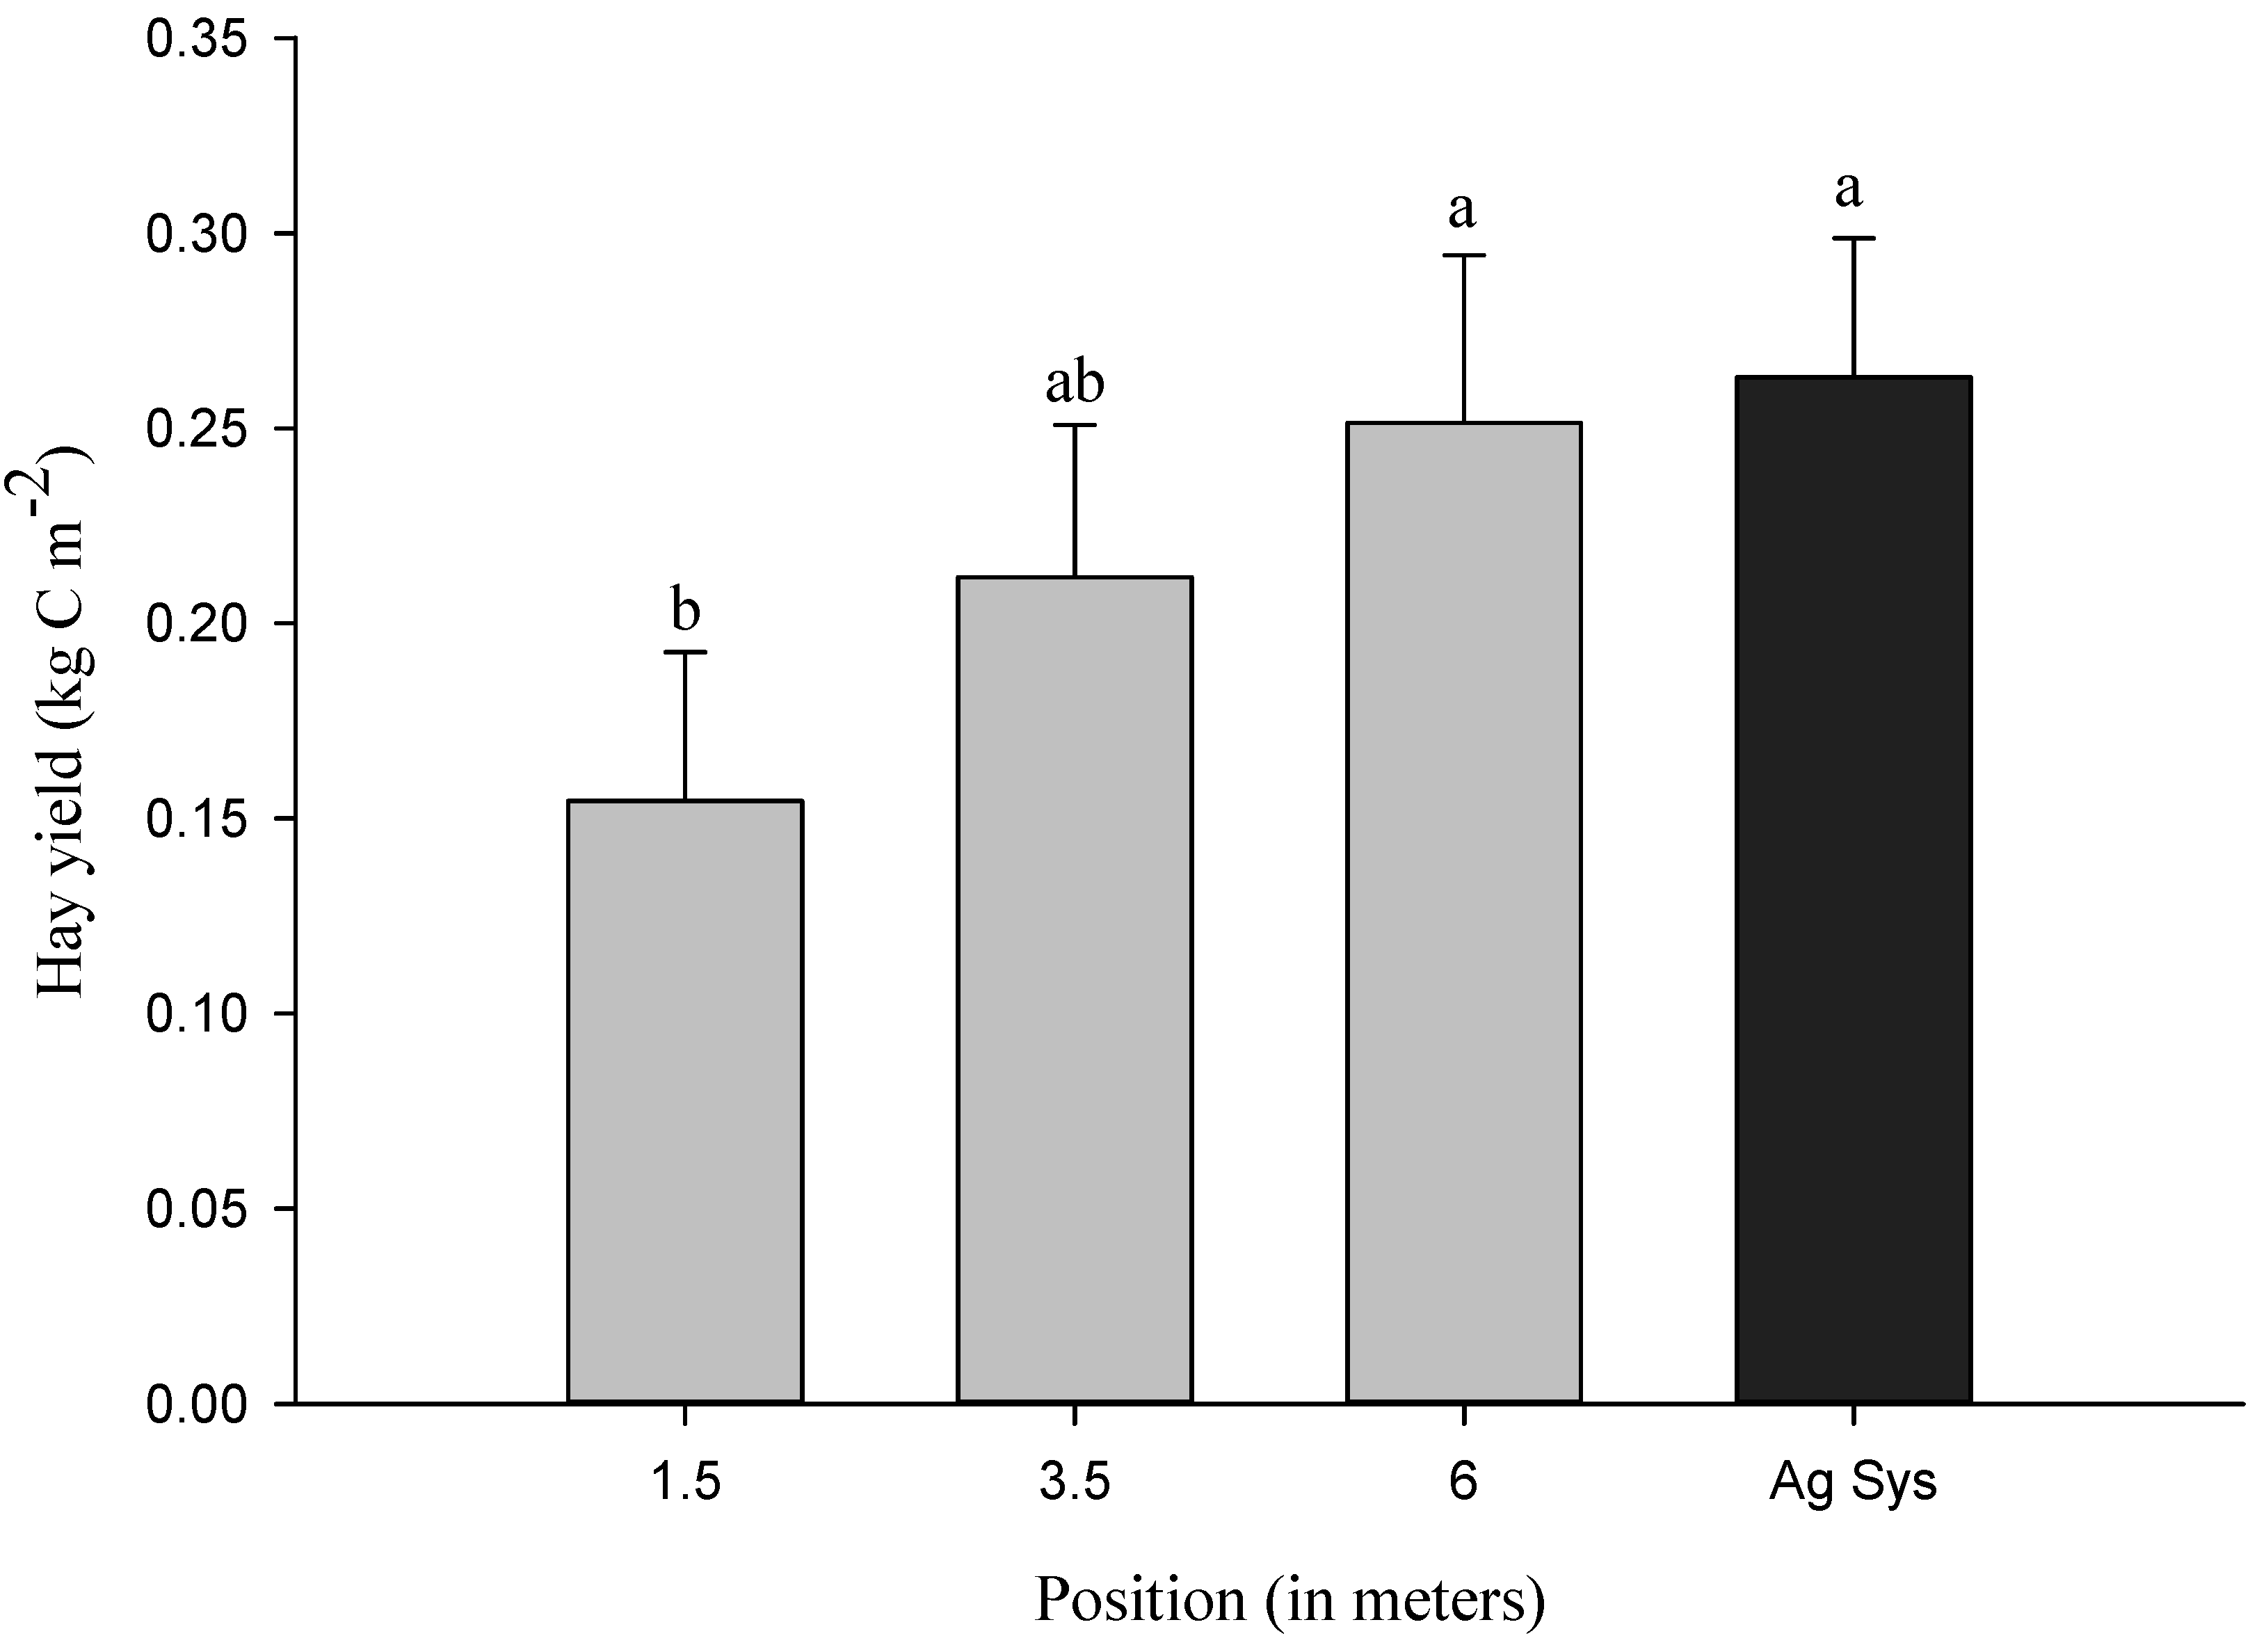
Hay yield at the St. Paulin site was greater 6 m from the tree row and in the agricultural system than at positions 1.5 m and 3.5 m from the tree row (p < 0.001; Figure 3). However, hay yields were not correlated with soil C and N stocks in three soil depth increments (0–5, 5–20 and 20–30 cm). Litterfall inputs were similar across the TBI system and agricultural system at St. Paulin (Table 4), and there was no relationship between litterfall and soil C and N stocks in three depth increments (0–5, 5–20 and 20–30 cm). We attribute this result to the low C input from litterfall at St. Paulin (Table 4). Greater C inputs from litterfall were documented at St. Edouard, which had significantly (p < 0.05) more litterfall at the sampling position 1 m west of poplar than at the sampling location 3 m east of poplar (Table 4). Although previous studies indicated litterfall to be a primary driver of soil C spatial variability within TBI systems [
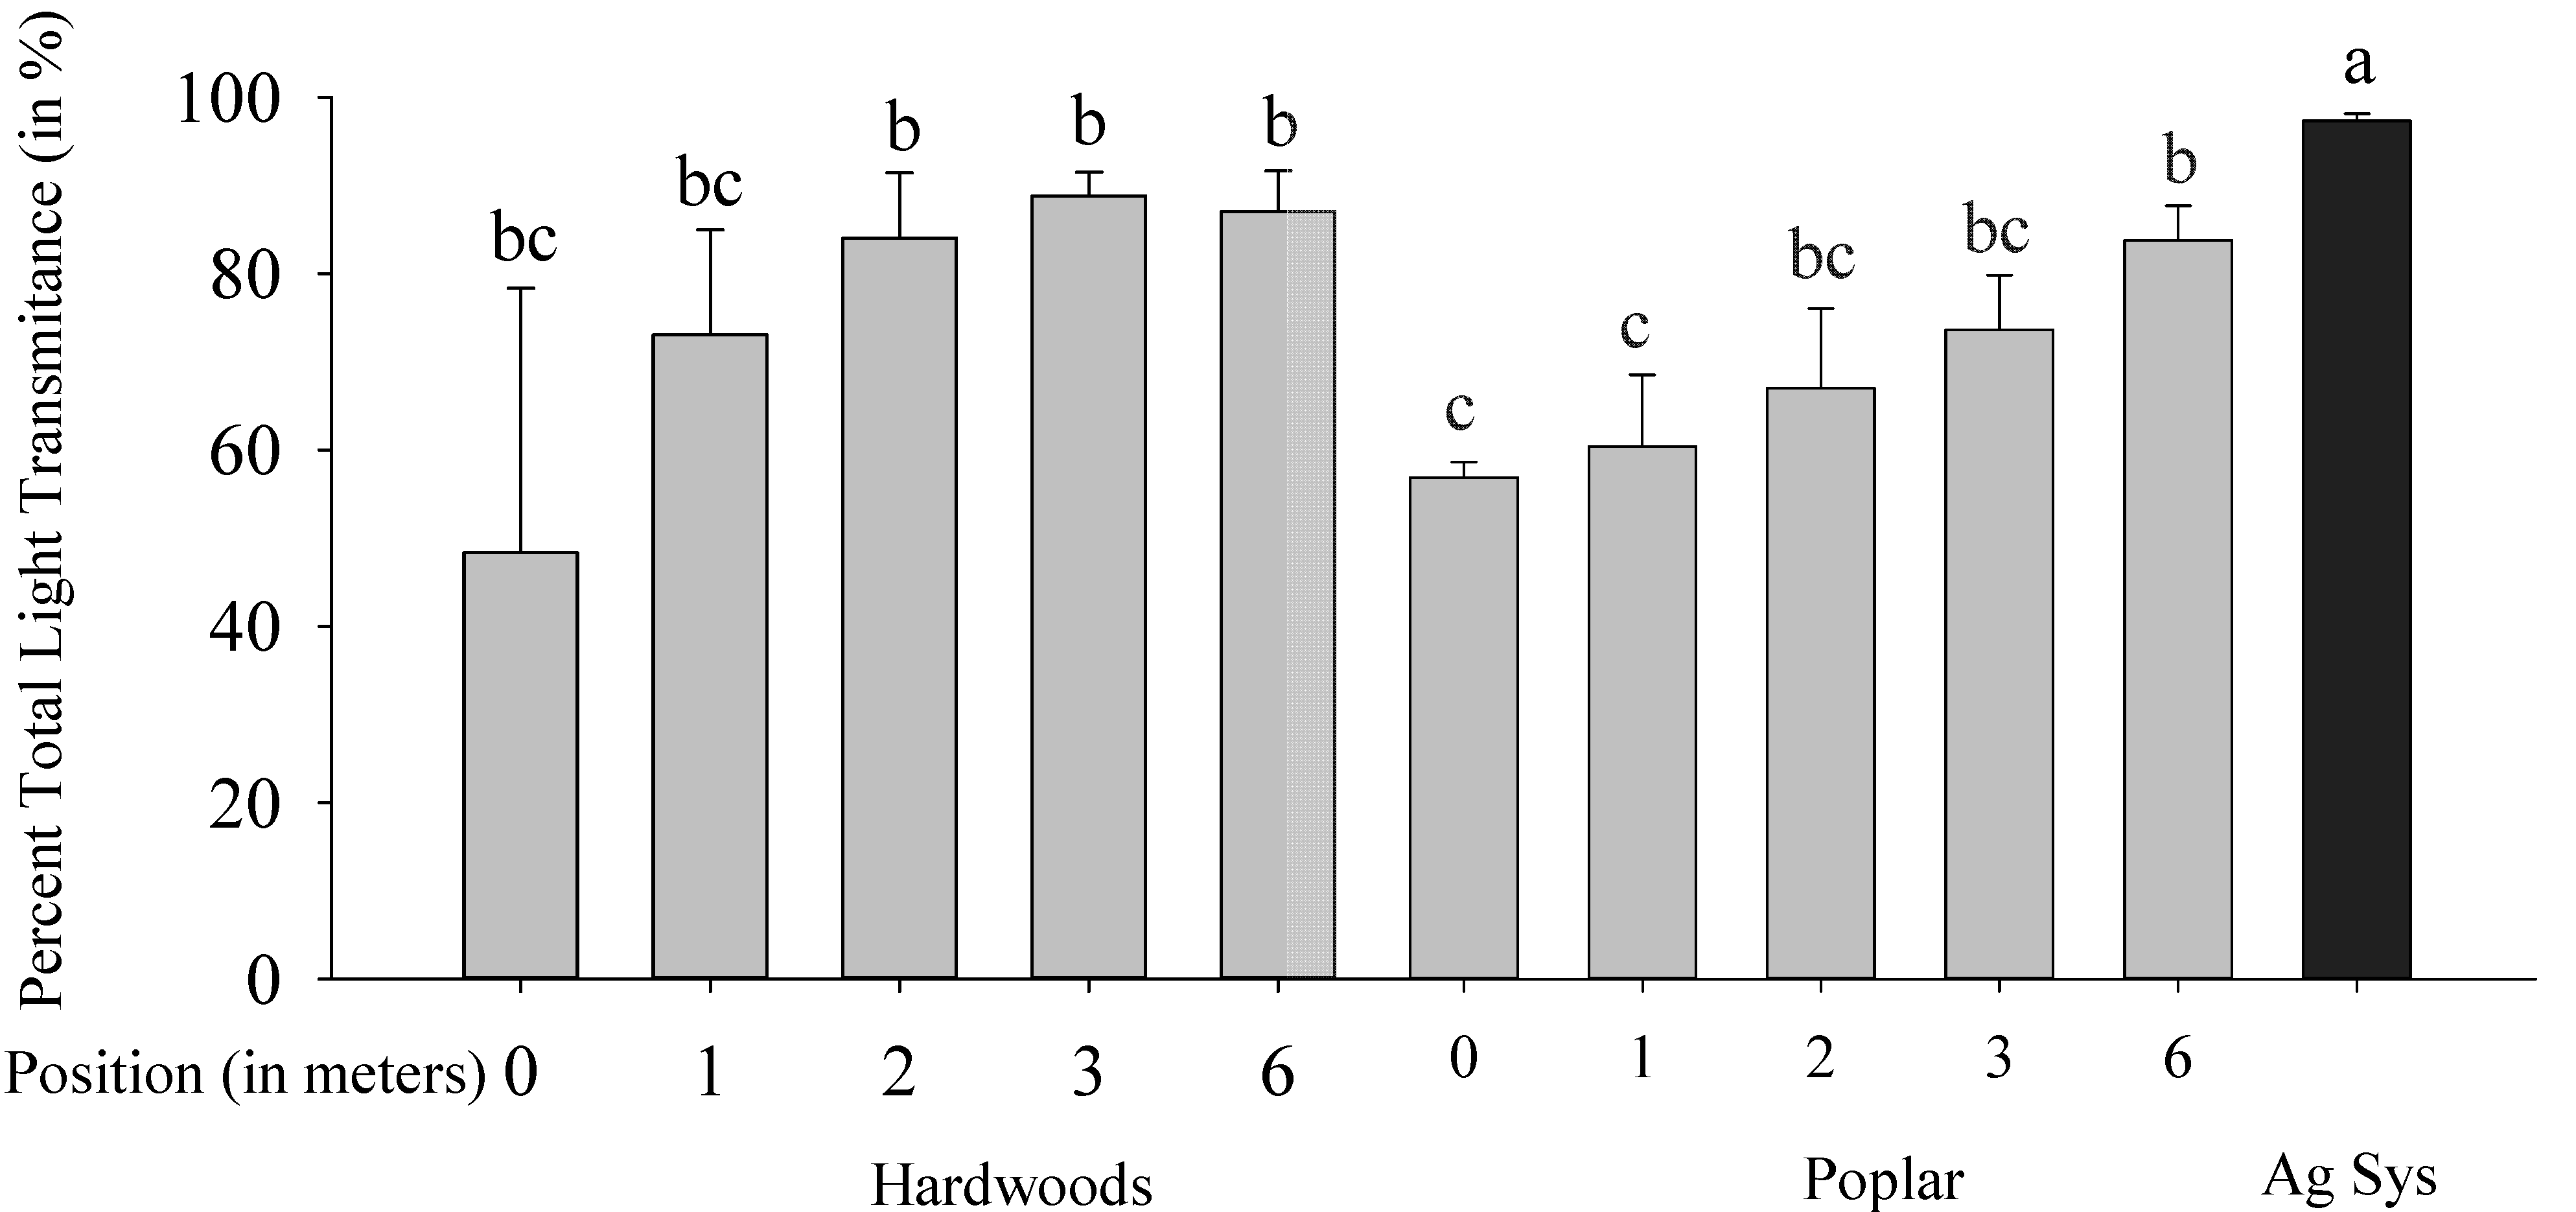
9], the low C inputs from litterfall across the TBI system resulted in no correlation between litterfall and soil C stocks. Finally, the PTLT was greater in the agricultural system (97% ± 1%) than the TBI system (72% ± 9%) at St. Paulin (Figure 4); while the variability in PTLT was related to hay yield across the TBI systems (R = 0.87, p < 0.05, n = 21), the PTLT was not correlated with soil C stocks at this site.
Figure 3. Hay yield (kg C m−2) at sampling positions located 1.5, 3.5 and 6 m from the tree row (pooled amongst the poplar and hardwood trees) and in the center of the adjacent agricultural system (Ag Sys) at St. Paulin. The error bars are the standard deviation of the mean (n = 6). Means with different letters are significantly different at p < 0.05 (Tukey test).
Forests 05 01952 g003
Figure 4. Percent total light transmittance (PTLT) at sampling positions located at 0, 1, 2, 3 and 4 m from the hardwood row, located at 0, 1, 2, 3 and 6 m from the poplar row and in the center of an adjacent agricultural system (Ag Sys) at St. Paulin. The error bars represent standard deviation of the mean (n = 3). Means with different letters are significantly different at p < 0.05 (Tukey test).
Forests 05 01952 g004
Note: Position (in meters) is not indicated for Ag Sys because hemispherical photographs were taken at the center of agricultural system plots.

4. Conclusions

Nine years of TBI technologies at two sites with alternating hybrid poplar and hardwood rows caused little change in soil C and N stocks across the TBI system. Relative to adjacent agricultural systems, the soil C and N stocks were stable in the 0–5-cm soil depth increment of TBI systems at St. Edouard and St. Paulin. The soil C stock was 18% to 32% lower and the soil N stock was 37% to 51% lower in the 0–30-cm soil depth increment of these TBI systems than the agricultural systems. The nearly two-fold gain in soil C stocks in the agricultural system compared to the TBI system at St. Edouard was attributed to tillage-induced burial of unharvested crop components, which could slow their decomposition and lead to subsurface C accumulation in the agricultural system. Although hay yield and the biomass of unharvested crop components was greater in the agricultural system than the TBI system, the smaller soil C and N stocks in TBI systems were not correlated with hay yield, litterfall or PTLT. Given that C inputs from unharvested crop residues and litterfall may be insufficient to sustain soil C stocks in TBI systems, the application of organic amendments, such as animal manure or compost, could be considered. A C budget that accounts for tree growth, harvested (crop) and unharvested (litterfall and roots) crop components in TBI systems would convincingly demonstrate their C storage capacity, as well as crop plus tree production, permitting better assessment of the potential environmental and economic benefits of TBI systems in Canada.

Acknowledgments

The authors gratefully acknowledge the funds provided by the Agricultural Greenhouse Gases Program, Agricultural and Agri-Food Canada and Fonds Québécois de la Recherche sur la nature et les Technologies (FQRNT) for the original design establishment. We acknowledge Stephane Daigle, Statistician, Institut de recherche en biologie végétale, for his assistance with the statistical analysis. We also thank the land owners, René-Paul and Louis Lessard, and Michel Arès, who collaborated with us for this study.

Author Contributions

The scope and hypotheses for the study were developed by Kiara Winans and Joann Whalen. The manuscript was written collaboratively, with statistical analysis, data interpretation and major conclusions by Kiara Winans, Alain Cogliastro, David Rivest and Joann Whalen. Kiara Winans contributed to collection and analysis of soil samples. Alain Cogliastro contributed to the collection and analysis of hemispherical photographs, and correspondence with the farmers. David Rivest contributed to the collection and analysis of yield samples. Lisa Ribaudo contributed to the collection and analysis of litterfall samples, and created Figure 1.

Conflicts of Interest

The authors declare no conflict of interest.

References

  1. Environment Canada. National Inventory Report 1990–2011: Greenhouse Gas Sources and Sinks in Canada Executive Summary. 2010. Available online: http://www.ec.gc.ca/Publications/default.asp?lang=En&xml=A07ADAA2-E349-481A-860F-9E2064F34822 (accessed on 10 July 2013). [Google Scholar]
  2. Montagnini, F.; Nair, P. Carbon sequestration: An Underexploited Environmental Benefit of Agroforestry Systems. Agroforest. Syst. 2004, 61, 281–295. [Google Scholar]
  3. Stanturf, J.; Portwood, C. Economics of Afforestation with Eastern Cottonwood (Populus deltoids) on Agricultural Land in the Lower Mississippi Alluvial Valley. In Proceedings of the Tenth Biennial Southern Silvicultural Research Conference, Shreveport, LA, USA, 16–18 February 1999.
  4. Udawatta, R.; Jose, S. Agroforestry Strategies to Sequester Carbon in Temperate North America. Agroforest. Syst. 2012, 86, 225–242. [Google Scholar] [CrossRef]
  5. Rivest, D.; Cogliastro, A.; Vanasse, A.; Olivier, A. Production of Soybean Associated with Different Hybrid Poplar Clones in a Tree-based Intercropping System in Southwestern Quebec, Canada. Agr. Ecosyst. Environ. 2009, 131, 51–60. [Google Scholar] [CrossRef]
  6. Evers, A.; Bambrick, A.; Lacombe, S.; Dougherty, M.; Peichl, M.; Gordon, A.; Thevathasan, N.; Whalen, J.; Bradley, R. Potential Greenhouse Gas Mitigation through Temperate Tree-based Intercropping Systems. Open Agric. J. 2010, 4, 49–57. [Google Scholar] [CrossRef]
  7. Thevathasan, N.; Gordon, A.; Bradley, R.; Cogliastro, A.; Folkard, P.; Grant, R.; Kort, J.; Liggins, L.; Njenga, F.; Olivier, A.; et al. Agroforestry Research and Development in Canada: The Way Forward. Adv. Agroforst. 2012, 9, 247–283. [Google Scholar]
  8. Rivest, D.; Lorente, M.; Olivier, A.; Messier, C. Soil Biochemical Properties and Microbial Resilience in Agroforestry Systems: Effects on Wheat Growth under Controlled Drought and Flooding Conditions. Sci. Tot. Environ. 2013, 463, 51–60. [Google Scholar] [CrossRef]
  9. Bambrick, A.; Whalen, J.; Bradley, R.; Cogliastro, A.; Gordon, A.; Olivier, A.; Thevathasan, N. Spatial Heterogeneity of Soil Organic Carbon in Tree-based Intercropping Systems in Quebec and Ontario, Canada. Agroforest. Syst. 2010, 79, 343–353. [Google Scholar] [CrossRef]
  10. Mungai, N.; Motavalli, P.; Kremer, R.; Nelson, K. Spatial Variation of Soil Enzyme Activities and Microbial Diversity in Temperate Alley Cropping Systems. Biol. Fert. Soils 2005, 42, 129–136. [Google Scholar] [CrossRef]
  11. Jose, S.; Gillespie, A.; Seifert, J.; Mengel, D.; Pope, P. Defining Competition Vectors in a Temperate Alley Cropping System in the Midwestern USA. 3. Competition for Nitrogen and Litter Decomposition Dynamics. Agroforest. Syst. 2000, 48, 61–77. [Google Scholar]
  12. Soil Classification Working Group. The Canadian System of Soil Classification, 3rd ed.; NRC Research Press: Ottawa, ON, Canada, 1998. [Google Scholar]
  13. Warren, L.; Sweet, C. Caring for Alberta’s Rural Landscape: Manure and Pasture Management for Horse Owners; Alberta Agriculture, Food and Rural Development, Her Majesty the Queen in Right of Alberta: Alberta, Canada, 2003.
  14. Centre de Référence en Agriculture et Agroalimentaire du Québec (CRAAQ). Guide de Référence en Fertilisation, 2nd ed.; Centre de Référence en Agriculture et Agroalimentaire du Québec: Ste Foy, QC, Canada, 2010. [Google Scholar]
  15. Delate, K.; Holzmueller, E.; Frederick, D.; Mize, C.; Brummer, C. Tree Establishment and Growth using Forage Ground Covers in an Alley–cropped System in Midwestern USA. Agroforest. Syst. 2005, 65, 43–52. [Google Scholar] [CrossRef]
  16. Gap Light Analyzer (GLA), Version 2.0. Imaging Software to Extract Canopy Structure and Gap Light Transmission Indices from True-Colour Fisheye Photographs, Users Manual and Program Documentation. Simon Fraser University: Burnaby, BC, Canada, 1999.
  17. Bouttier, L.; Paquette, A.; Messier, C.; Rivest, D.; Olivier, A.; Cogliastro, A. Vertical Root Separation and Light Interception in a Temperate Tree-based Intercropping System of Eastern Canada. Agroforest. Syst. 2014. [Google Scholar] [CrossRef]
  18. Poirier, V.; Angers, D.; Rochette, P.; Chantigny, M.; Ziadi, N.; Tremblay, G.; Fortin, J. Interactive Effects of Tillage and Fertilization on Soil Carbon Profiles. Soil Sci. Soc. Am. J. 2009, 73, 255–261. [Google Scholar] [CrossRef]

