Article

Historical Patterns of Natural Forest Management in Costa Rica: The Good, the Bad and the Ugly

1
Department of Geography, McGill University, Montreal, QC H3A 2K6, Canada
2
Department of Ecology and Evolutionary Biology, University of Connecticut, Storrs, CT 06269-3043, USA
*
Author to whom correspondence should be addressed.
Forests 2014, 5(7), 1777-1797; https://doi.org/10.3390/f5071777
Submission received: 8 May 2014 / Revised: 9 July 2014 / Accepted: 14 July 2014 / Published: 23 July 2014

Abstract

:
We present an in-depth analysis of natural forest management practices in Costa Rica based on a new historical forestry GIS database encompassing five conservation regions in the country where selective logging has been prevalent for the last 18 years. Natural forest management refers to the selective logging practices for the production of timber in natural forest ecosystems. The study considers natural forest management plans developed following a standardized format, based on Forestry Law 7575, established in 1996. Our results show a positive aspect of forest management where a large percentage of the managed forest is still standing, contrary to other tropical countries where selective logging promotes land use change. The negative finding is that managed forest areas occur in the last remaining forest fragments outside of protected areas, which challenges the continuity of selective logging in the near and mid future due to the potential impoverishment of the isolated forest stands. The most negative aspect is the recent establishment, by law, of a very short return logging cycle (10–15 years—minimum cutting cycle) as it contradicts ecological studies showing that tropical forests require over 60 years for the forest structure and composition to return to a state similar to pre-logging states. Our results should inform decision makers and managers in conservation areas to review current policies and establish new benchmarks for sustainable forest management in the country.

Graphical Abstract

1. Introduction

Worldwide, the sustainable use of tropical forest areas outside of protected area networks (e.g., national parks, wildlife refuges, biosphere reserves) is the only option for preserving a wide range of species and ecosystems absent from protected areas [1]. Therefore, tropical forests outside protected areas deserve special attention in terms of their management, anthropogenic dynamics and conservation. As compared to human activities (e.g., cash crops, mining, etc.) that eliminate forest ecosystems and their well-recognized services (scenic beauty, mitigation of greenhouse gasses, watershed protection, biodiversity), it has been argued that natural forest management (i.e., conventional logging, reduced impact logging) has the potential to be a land use that preserves forests in the long term [2,3] and has a low impact on species richness and abundance [4,5]. At the same time, other studies have shown the negative impacts of forest management in terms of their immediate and mid-term effects at different spatial scales, such as changes in the hydrological patterns of streams, forest impoverishment and increases of forest edges [6,7,8]. Nevertheless, the impact of natural forest management varies depending on the nature and extent of forest damage [9] and the policies that provide both a legal framework and its enforcement. The enforcement should allow forest stands to be preserved after the extraction of timber resources in the long term.
The estimated size of natural tropical Permanent Forest Estates (PFE: forests under state ownership and centralized control) worldwide is 761 million hectares, comprising 403 million hectares of production forest and 358 million hectares of protected forest [10]. Between 2005 and 2010, the area of natural forest under management plans in International Tropical Timber Organization (ITTO) producer countries increased to 183 million hectares, which accounts for 24% of the PFE. Worldwide, certified natural-forest production in PFEs increased 63% and sustainable forest management (SFM) doubled during the same period [10]. SFM is important for forest conservation purposes, since it is based on a series of principles, criteria and indicators that aim to maintain, over the long-term, the biological, physical and social characteristics of these ecosystems [11,12].
In Costa Rica, the management of natural forests has been regulated in different ways since the establishment of a forestry legislation framework. For instance, the first Forest Law (1969) did not include any restrictions on selective logging. Later, Laws 7032 and 7174 (1986 and 1990, respectively) required a registered professional to produce a management plan prior to forest exploitation [13]. The 1996 Forestry Law 7575 established the Forest Manager with public’s faith who is overseen by a Union of Professionals. The Forest Manager is in charge of designing and supervising forest operations [13] and most importantly, prohibited land use conversion from forest to non-forest. Public’s faith means that the statements of fact made by a Forest Manager in a written instrument are considered as evidence of the facts recorded and that those statements are irrefutable unless a litigating party brings a special plea alleging fraud or forgery (Valverde, 2014 personal communication).
The 1996 Forestry Law 7575 enhanced forest protection and led to the development of technical procedures to facilitate selective logging in forest stands. These technical aspects, among others, include the collection of land tenure information, a forest inventory and census, technical specifications about logging roads, and topographic maps indicating stream networks and large tree locations (>60 cm DBH). All of this information is integrated into a technical document called the natural forest management plan produced by the Forest Manager and submitted, for approval, to a regional office of the Forestry Authority of the State. In this case a natural forest is defined by law as a native ecosystem that encompasses a minimum area of two hectares and is characterized by the presence of mature trees of different ages, species and forms, one or more canopy layers that cover more than 70% of the surface, and more than 60 trees per hectare with a DBH greater than 15 cm. In this paper, natural forest management refers to the selective logging practices for the production of timber in this natural ecosystem. Further definitions regarding natural forest management in Costa Rica can be found in [14].
Despite these policy efforts to regulate the forestry activity, not a single study has rigorously measured the sustainability of forest management in Costa Rica at the country level and from a historical perspective since the establishment of the law. For instance, information about historical natural management trends are almost unknown or only collected for certain periods of time or regions [15]. This problem is not necessarily unique to Costa Rica. With the establishment of the UN REDD+ initiative as a major international policy to prevent forest degradation and deforestation in tropical countries as well as provide funding for sustainable management [16], many tropical countries need to provide detailed information about their forest resources (e.g., inventories) and strategies for their conservation.
In this study, we present an in-depth analysis of natural forest management practices in Costa Rica based on a new historical forestry GIS database encompassing five Conservation Areas in the country where selective logging has been prevalent for 18 years [14,15]. A Conservation Area is a geopolitical division used in Costa Rica to regulate different activities related to the sustainable use of natural resources (timber, geothermal energy, water, etc.). Our main objective is to critically assess the overall impact of selective logging practices in different regions of the country. Our temporal assessment is based on an analysis of the historical trends of forest management, while our spatial analysis uses two approaches. The first approach aims to examine whether areas subject to forest management preserve the forest stand in the longer term (i.e., forest “fate”) since, according to the Forestry Law 7575, land use change from forest to non-forest is prohibited. Therefore, the expectation is that forest areas subject to logging retain their forest cover. The second approach aims to determine the relationship between forest management areas, landscape structure and composition [17] in each region.
A legislation recently developed in Costa Rica defines the sustainability standards for natural forest management and the Code of Practices including the procedures for polycyclic forest management and the potential for a second harvest rotation of 15 years with a minimum of 10 years [18]. We argue that this rotation time might not be adequate for forest recovery since it ignores the current research in forest growth under new climate change regimes [19,20], the changes in tree species composition after logging and the structural recovery of forest stands over time (depending on logging intensity) [21]. We compare the modeled distribution of the numbers of tree harvested per hectare for each Conservation Area with the simulated distribution using low felling intensity (LFI) reduced-impact logging (RIL) principles (i.e., 3 ± 1 trees/ha). Based on these results, we provide a general discussion on the potential negative effects of such a short rotation time.

2. Experimental Section

Our analysis is based on a recently created historical forestry relational database (FRD) and Forestry Geographic Information System (FGIS) encompassing more than 600 selective logging records in five Conservation Areas (CAs) in Costa Rica, spanning more than 20 years [14]. The CAs are: Huetar Norte Conservation Area (ACAHN), Coordillera Volcanica Central Conservation Area (ACCVC), Tortuguero Conservation Area (ACTO), La Amistad-Caribe Conservation Area (ACLA-C) and Osa Conservation Area (ACOSA). Conservation Areas in Costa Rica are under the jurisdiction of the Ministry of Environment and Energy (MINAE) through the National System of Conservation Areas (SINAC). Costa Rica is divided into 11 Conservation Areas, which are governed using the same administrative and development model concerning the management of natural resources in both public and private lands [13]. Figure 1 shows the Conservation Areas included in this study as well as the number of management plans (n) used to calculate historical trends and spatial statistics. To analyze the historical trends of forest management in each conservation area we queried the FRD for each management plan that was presented by a Forest Manager in the regional office of the specific conservation area. We then calculated basic statistics (mean, median, standard deviation, and coefficient of variation) for total property area, and the area of the productive and protected zones of the forest stand (Table 1). Protected zones in the management unit are defined as areas near water bodies (e.g., 15 to 50 mt buffer around streams and 100 mts buffer around springs) and on steep slopes (>40%) where selective logging is prohibited, while forest areas outside the protected ones are considered productive zones. A more detailed description of natural forest management practices in Costa Rica can be found in [14]. The total area of the property may also include other land uses (e.g., agriculture, pastures, etc.).
To assess the impact of forest management on the long-term permanence of forest cover (over the last 18 years), four datasets were used: the FGIS, the forest cover assessment for Costa Rica for the year 2005 [22], recent images in Google Earth (2012–2013), and an aerial color photo mosaic at 30 cm spatial resolution (2005). The reason for the use different sources was to ensure that the interpretation of forest cover was consistent between datasets. Moreover, for management units logged after 2005 the aerial photo mosaic and the forest cover assessment were inadequate. We assessed forest permanence for 422 management units, beginning in 1989. We only considered management plans where we were able to record the logging report in our FRD, therefore, we were certain that selective logging operations occurred. Since the FRD was based on the recovery of archival information in different conditions (e.g., incomplete documents), there may be management units that do not have a logging report but actually were harvested.
Figure 1. Location of forest management plans in Costa Rica (black dots) for five Conservation Areas based on the Forestry GIS: Huetar Norte Conservation Area (ACAHN), Coordillera Volcanica Central Conservation Area (ACCVC), Tortuguero Conservation Area (ACTO), La Amistad-Caribe Conservation Area (ACLA-C) and Osa Conservation Area (ACOSA); the darker areas in the map represent the forest cover for the year 2005. In general, forest management plans are located outside protected areas such as national parks and wildlife refuges (not shown here to avoid map clutter) in fragmented forests; the source for the original data is the National System of Conservation Areas archives of the regional offices, however, data presented here is based on work developed by [14,15]; areas for ACTO were provided by the regional office and rectified when necessary.
Forests 05 01777 g001
Table 1. Descriptive statistics calculated from management plans for five Conservation Areas in Costa Rica; the total property area uses the cadastral map information, while the managed area (forest stand), productive area and protected zone is defined by the Forest Manager.
ACAHNTotal Property AreaManaged AreaProductive AreaProtected Zone
Mean125.745.735.66.3
Median79.130.725.01.8
Standard deviation210.647.435.211.6
Coefficient of variation1.71.01.01.8
ACCVC
Mean97.040.028.18.7
Median68.331.520.04.1
Standard deviation94.333.825.813.8
Coefficient of variation0.970.80.91.6
ACLA-C
Mean69.537.126.59.5
Median49.225.017.44.0
Standard deviation64.241.528.118.2
Coefficient of variation0.91.11.11.9
ACOSA
Mean78.940.921.319.2
Median53.427.012.011.0
Standard deviation80.742.224.322.0
Coefficient of variation1.021.031.11.1
ACTO
Mean117.351.040.39.1
Median63.527.020.52.0
Standard deviation207.161.950.225.0
Coefficient of variation1.81.21.22.8
For each forest management unit in the FGIS we overlaid its polygon with the three datasets and visually analyzed the forest stand. Because the property units were digitized from the original forest management plans [15], geo-positional errors needed to be visually verified and manually corrected using ArcGIS 10.1 [23]. To improve geographical accuracy we revised the digitized units against a geocorrected cartographic dataset (1:50,000) for the country in the Costa Rica Transverse Mercator 2005 coordinate system. For each polygon, a PDF document of the original management plan was also used to compare the location of the forest as illustrated by the forest manager, when the full description of the land use/land cover was given. In cases that this map was not available, tabular data about forest cover area (in hectares) was used. Our exhaustive analysis aimed to avoid overestimating or underestimating the original forest cover included in the productive and protected zones within the management unit (total property area). As a last step for the forest permanence analysis, three categories were created to summarize our findings: agreement with the original plan, partial agreement with the original plan and no agreement with the original plan. The category of agreement with the original plan signifies that the forest unit encompasses the full forest extent originally mapped by the management plan, regardless of the area of the forest. A partial agreement indicates a reduction of the original forest cover, which suggests a reduction of the initial forest extent. Lastly, the category of no agreement with the original management plan, specifies a land-use change (e.g., from forest to cash crops such pineapple, bananas, etc.) (Figure 2). Because land-use change was prohibited after 1996, we paid special attention to cases that resulted in a ‘no match’ in terms of geo-location in order to avoid false-positives.
Figure 2. Process for assessing the permanence of the forest stand after selective logging. Geographic errors inherent in the coordinate transformation for Costa Rica and the on-screen digitization of archival documents were triple-checked with different datasets and distinct features on the ground when available (e.g., roads, rivers, etc.); this example is an agreement with the original management plan because the forest is still present in the management unit.
Forests 05 01777 g002
The second aspect of the spatial analysis was to assess the relationship between forest management location and landscape forest fragmentation. After aggressive deforestation that lasted until the mid-1980s [24], Costa Rican forest ecosystems outside of protected areas became highly threatened and fragmented [25,26]. It is therefore key to understand not only where forest management occurred, but also its linkage to forest spatial and landscape features (e.g., patch size, connectivity). Selective logging in fragmented landscapes is of special consideration because little is known about its effect at local and landscape levels for different biological groups [27,28]. As a first step to understand the location of selective logging units and the fragmentation patterns within each Conservation Area, we calculated forest fragmentation statistics (mean patch size, standard deviation, median patch size) using Fragstats 4.2. Further, we carried out a cluster analysis using a Multi-Distance Spatial Cluster Analysis (Ripley’s K Function) for the forest management units using ArcGIS 10.1. For the fragmentation analysis, we used the forest cover assessment for the year 2005 [22]. Because the large fragments include protected areas, we calculated the forested area not under protection (e.g., national parks, wildlife refuges) to determine the potential effective area for forest management and the location of management plans.
A first step for polycyclic management under the resolution is revising whether there is a previous management plan document (hard copy) in the regional office of the Forestry Authority of the State. Since there are inconsistencies in the historical records of the management plans in Costa Rica [15], the legislation provides a framework for management units with or without a previous management plan document. Under an existing record, the previous information serves as a baseline of comparison for the new plan and the development of an annual operational logging plan. Without a previous record, the forest manager has to follow the RIL guidelines stated in the forestry law resolution [18].
To conduct a preliminary analysis of the potential effect of forest logging and the 10–15 year second return established by the Code of Practices for polycyclic management, we calculated the probability distribution of the number of selectively logged trees per hectare extracted from the approved management plans. Then, we determined the best-fit probability density function, based on the AIC criterion, for each Conservation Area using Matlab 2014a. We compared the results of the density functions to that of a theoretical one modeled for low tree felling intensity (3–4 trees/hectare) assuming RIL operations [29]. Reduced-impact logging encompasses a series of controlled timber harvesting practices that aim to reduce the well-recognized deleterious effects of selective logging in the forest stand [30]. However, even under RIL with an average extraction of 6 trees/ha there still might be considerable damage to the canopy [29]. Although RIL (low or medium intensity) is not a common practice in Costa Rica, it provides us with a baseline against which we can compare the more conventional logging practices used in the country. We use the number of logged trees per hectare as a proxy for forest disturbance, under the assumption that a larger number of trees extracted per hectare using conventional logging techniques would increase both the collateral damage to the forest stand (e.g., tree felling, roads) and the time for vegetative compositional and structural recovery [21,31]. For instance, the minimum logging diameter in Costa Rica is greater than 60 cm in DBH, and the cutting intensity is a 60/40 ratio with 60% of the commercial volume available for harvesting and 40% left as remnants. We discuss the implication of current forest practices and the short time frame allocated for forest recovery from logging operations in Costa Rica.

3. Results and Discussion

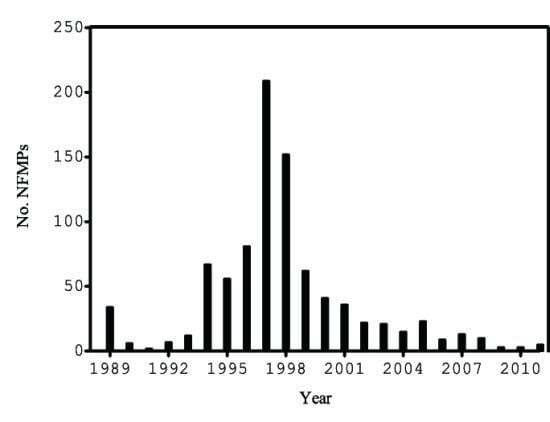
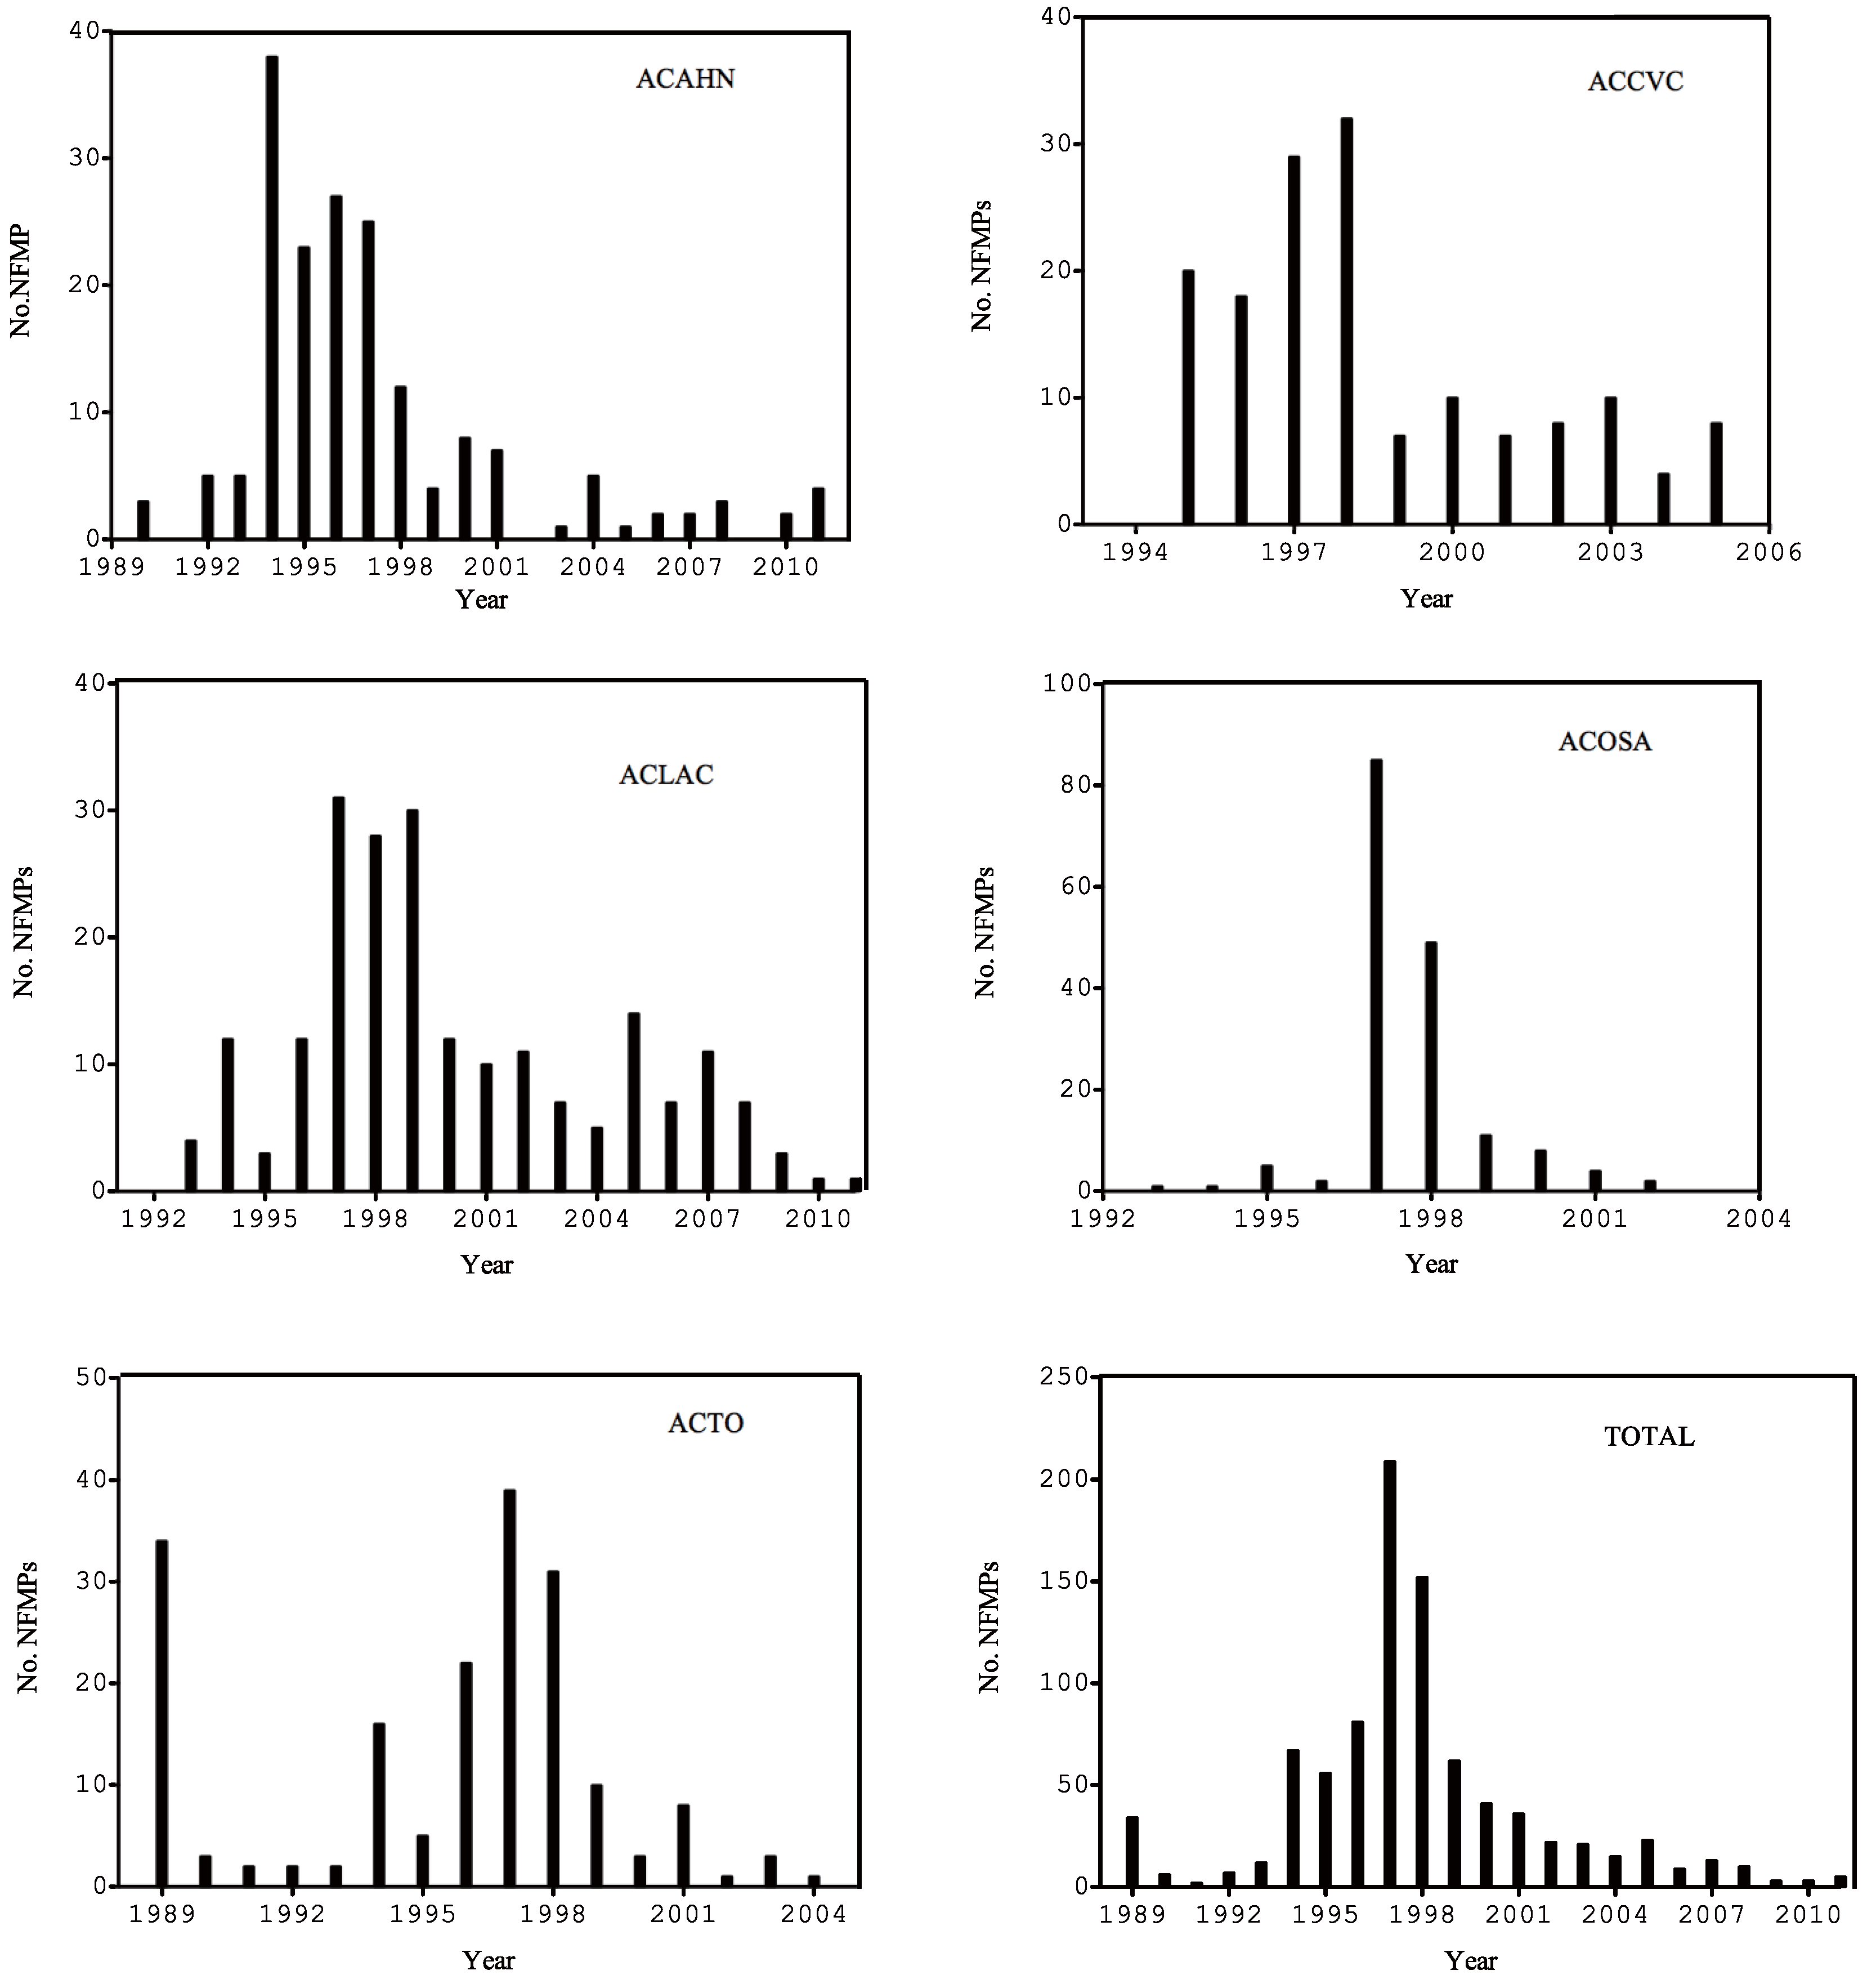
3.1. Historical Forest Management Trends

The average managed extent (ha) for selective logging units ranged from 51 hectares in ACTO to 37.1 hectares in ACLA-C, and is similar between the five conservation areas (Table 1). In comparison to other tropical countries with large tracks of continuous forest [32,33], forest areas in Costa Rica are small and highly variable in terms of size and topographic features. The total managed area encompasses a productive area where selective logging operations occur and protected zones, where selective logging is prohibited based on legal regulations (Forestry Law 7575). Our results indicate that protected zones are low in comparison to the area undergoing logging. The protected zones inside the management unit are the areas with steep slopes and within the buffer zones around water bodies. For instance, in ACAHN, the average productive area is 35.6 ha and the average protected zone is 6.3 ha while, in ACCVC, the protected zone represents 8.7 ha of the total managed area 28.1 ha. In the case of ACOSA, the average productive area is 21.3 ha and the average protected zone is 19.2 ha (Table 1). In both ACAHN and ACOSA, however, the standard deviation of the productive area is notably larger (24.3 ha and 22.0 ha, respectively) (Table 1) than within the other Conservation Areas. In the case of ACOSA, most of the forest management is carried out in areas of moderate to steep slopes [34], which may explain this difference compared to other conservation areas, where forests located in productive areas is larger.
Our trend analysis indicates a concentration of forest management activity between 1995 and 1999 in all Conservation Areas with a decline toward the early 2000s (Figure 2). This trend is even more noticeable when the total numbers of management plans in all Conservation Areas are summed (Figure 2). This result is consistent with the findings of [15], indicating the potential effect of the Forest Certificate of Payment for Natural Forest Management (known as CAFMA) established in 1994. The CAFMA program was established as an economic subsidy to promote forest management by supporting the preparation of forest management plans and the implementation of silvicultural treatments in natural forests. Nonetheless, this incentive started decreasing in 1999, country-wide, due to the negative effects of the forest management model on biodiversity as perceived by different groups (e.g., environmentalists and biologists) and the lack of auditing and control for approved management plans. For example, NGOs pressured the government for increased protection and reforestation, as forest management was perceived as “hidden deforestation” [35]. With a large number of management plans presented to the regional offices between 1996 to 1998, and a shortage of technical personnel to review the management plans in situ, many inconsistencies were found in the management plans that potentially negatively affected logging operations. For instance [36] found that in ACOSA 74.4% of the management plans had anomalies, such as incomplete documentation or a lack of rigor in the statistical analysis for the number of trees, the basal area, the volume and the sampling design of the inventory. In addition, poor mapping of tree locations was an issue. Parallel to the decline in CAFMA, the Payment for Environmental Services (PES) program was established in 1997 and financed private farmers’ conservation efforts. The PES program was widely apply in the country between 1998 and 2005, accounting for 91% of the area covered since 1998, and for 95% of the enrolled area by the end of 2005 [37]. As [38] states, subsidies to the forestry sector were politically unsustainable because of insufficient economic contributions from the forestry sector. Therefore, the PES program fulfilled the need in the country for protecting forest areas, while providing forest owners with an economic tool for conservation.

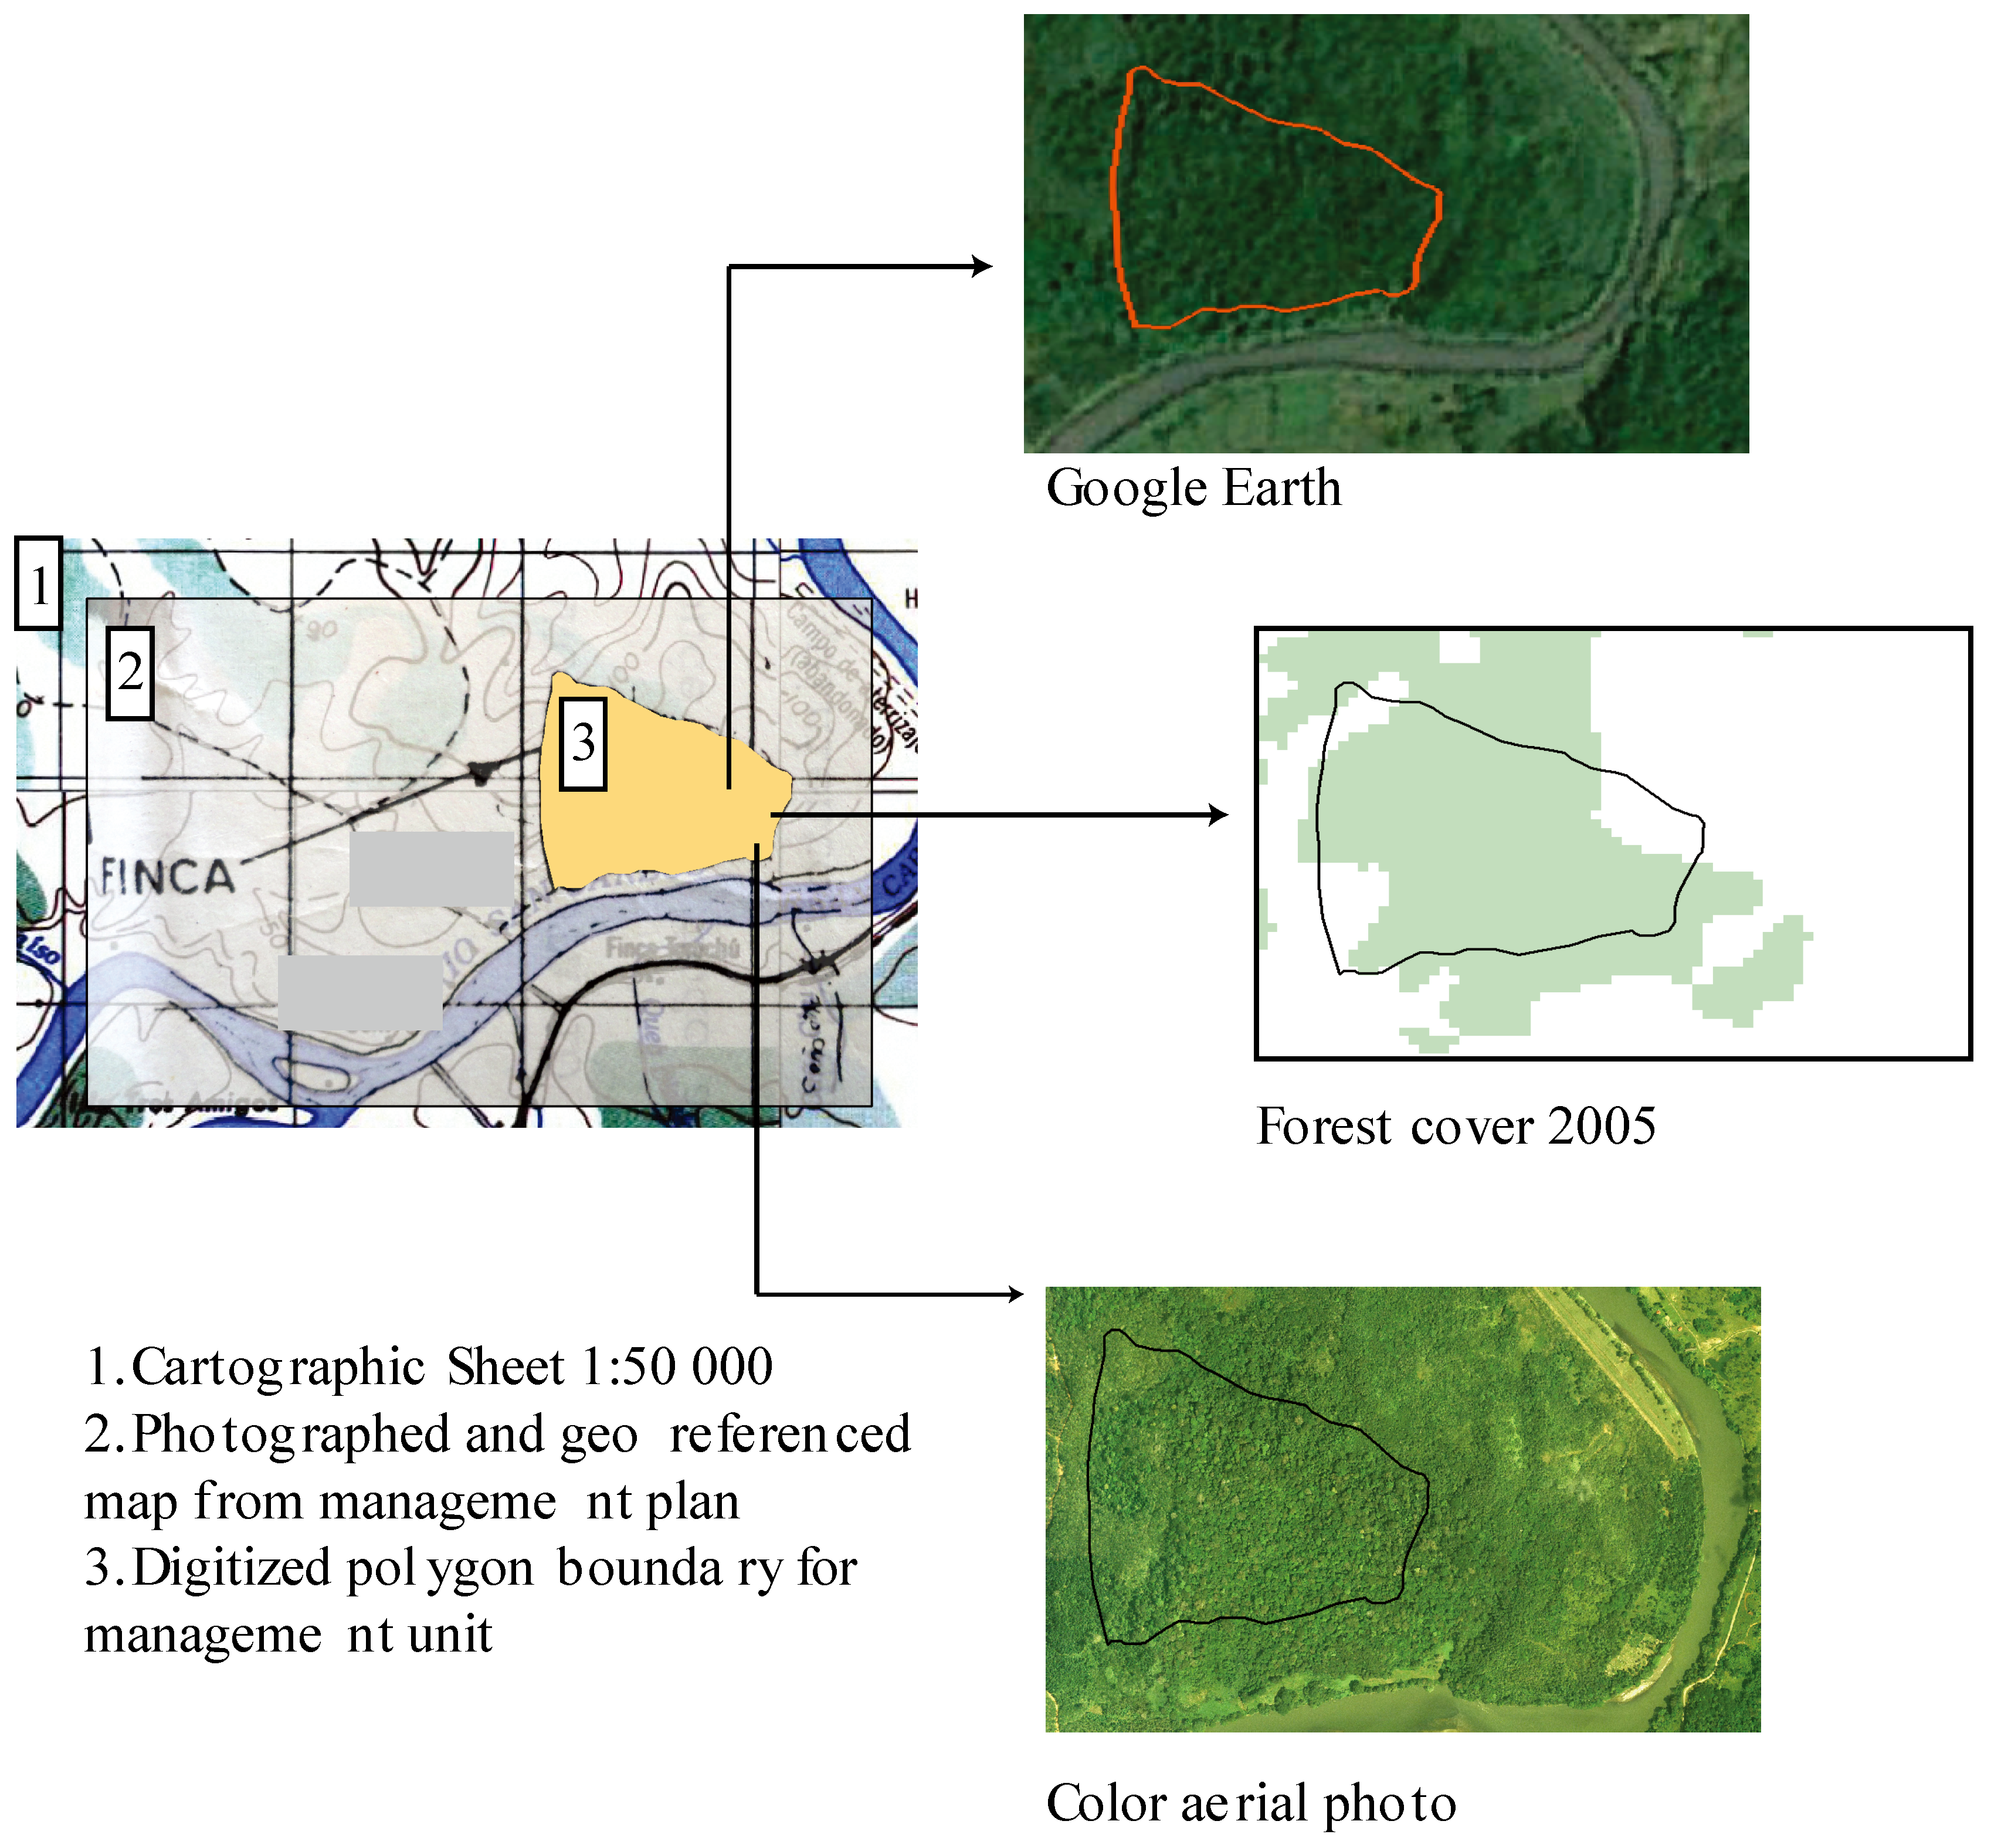
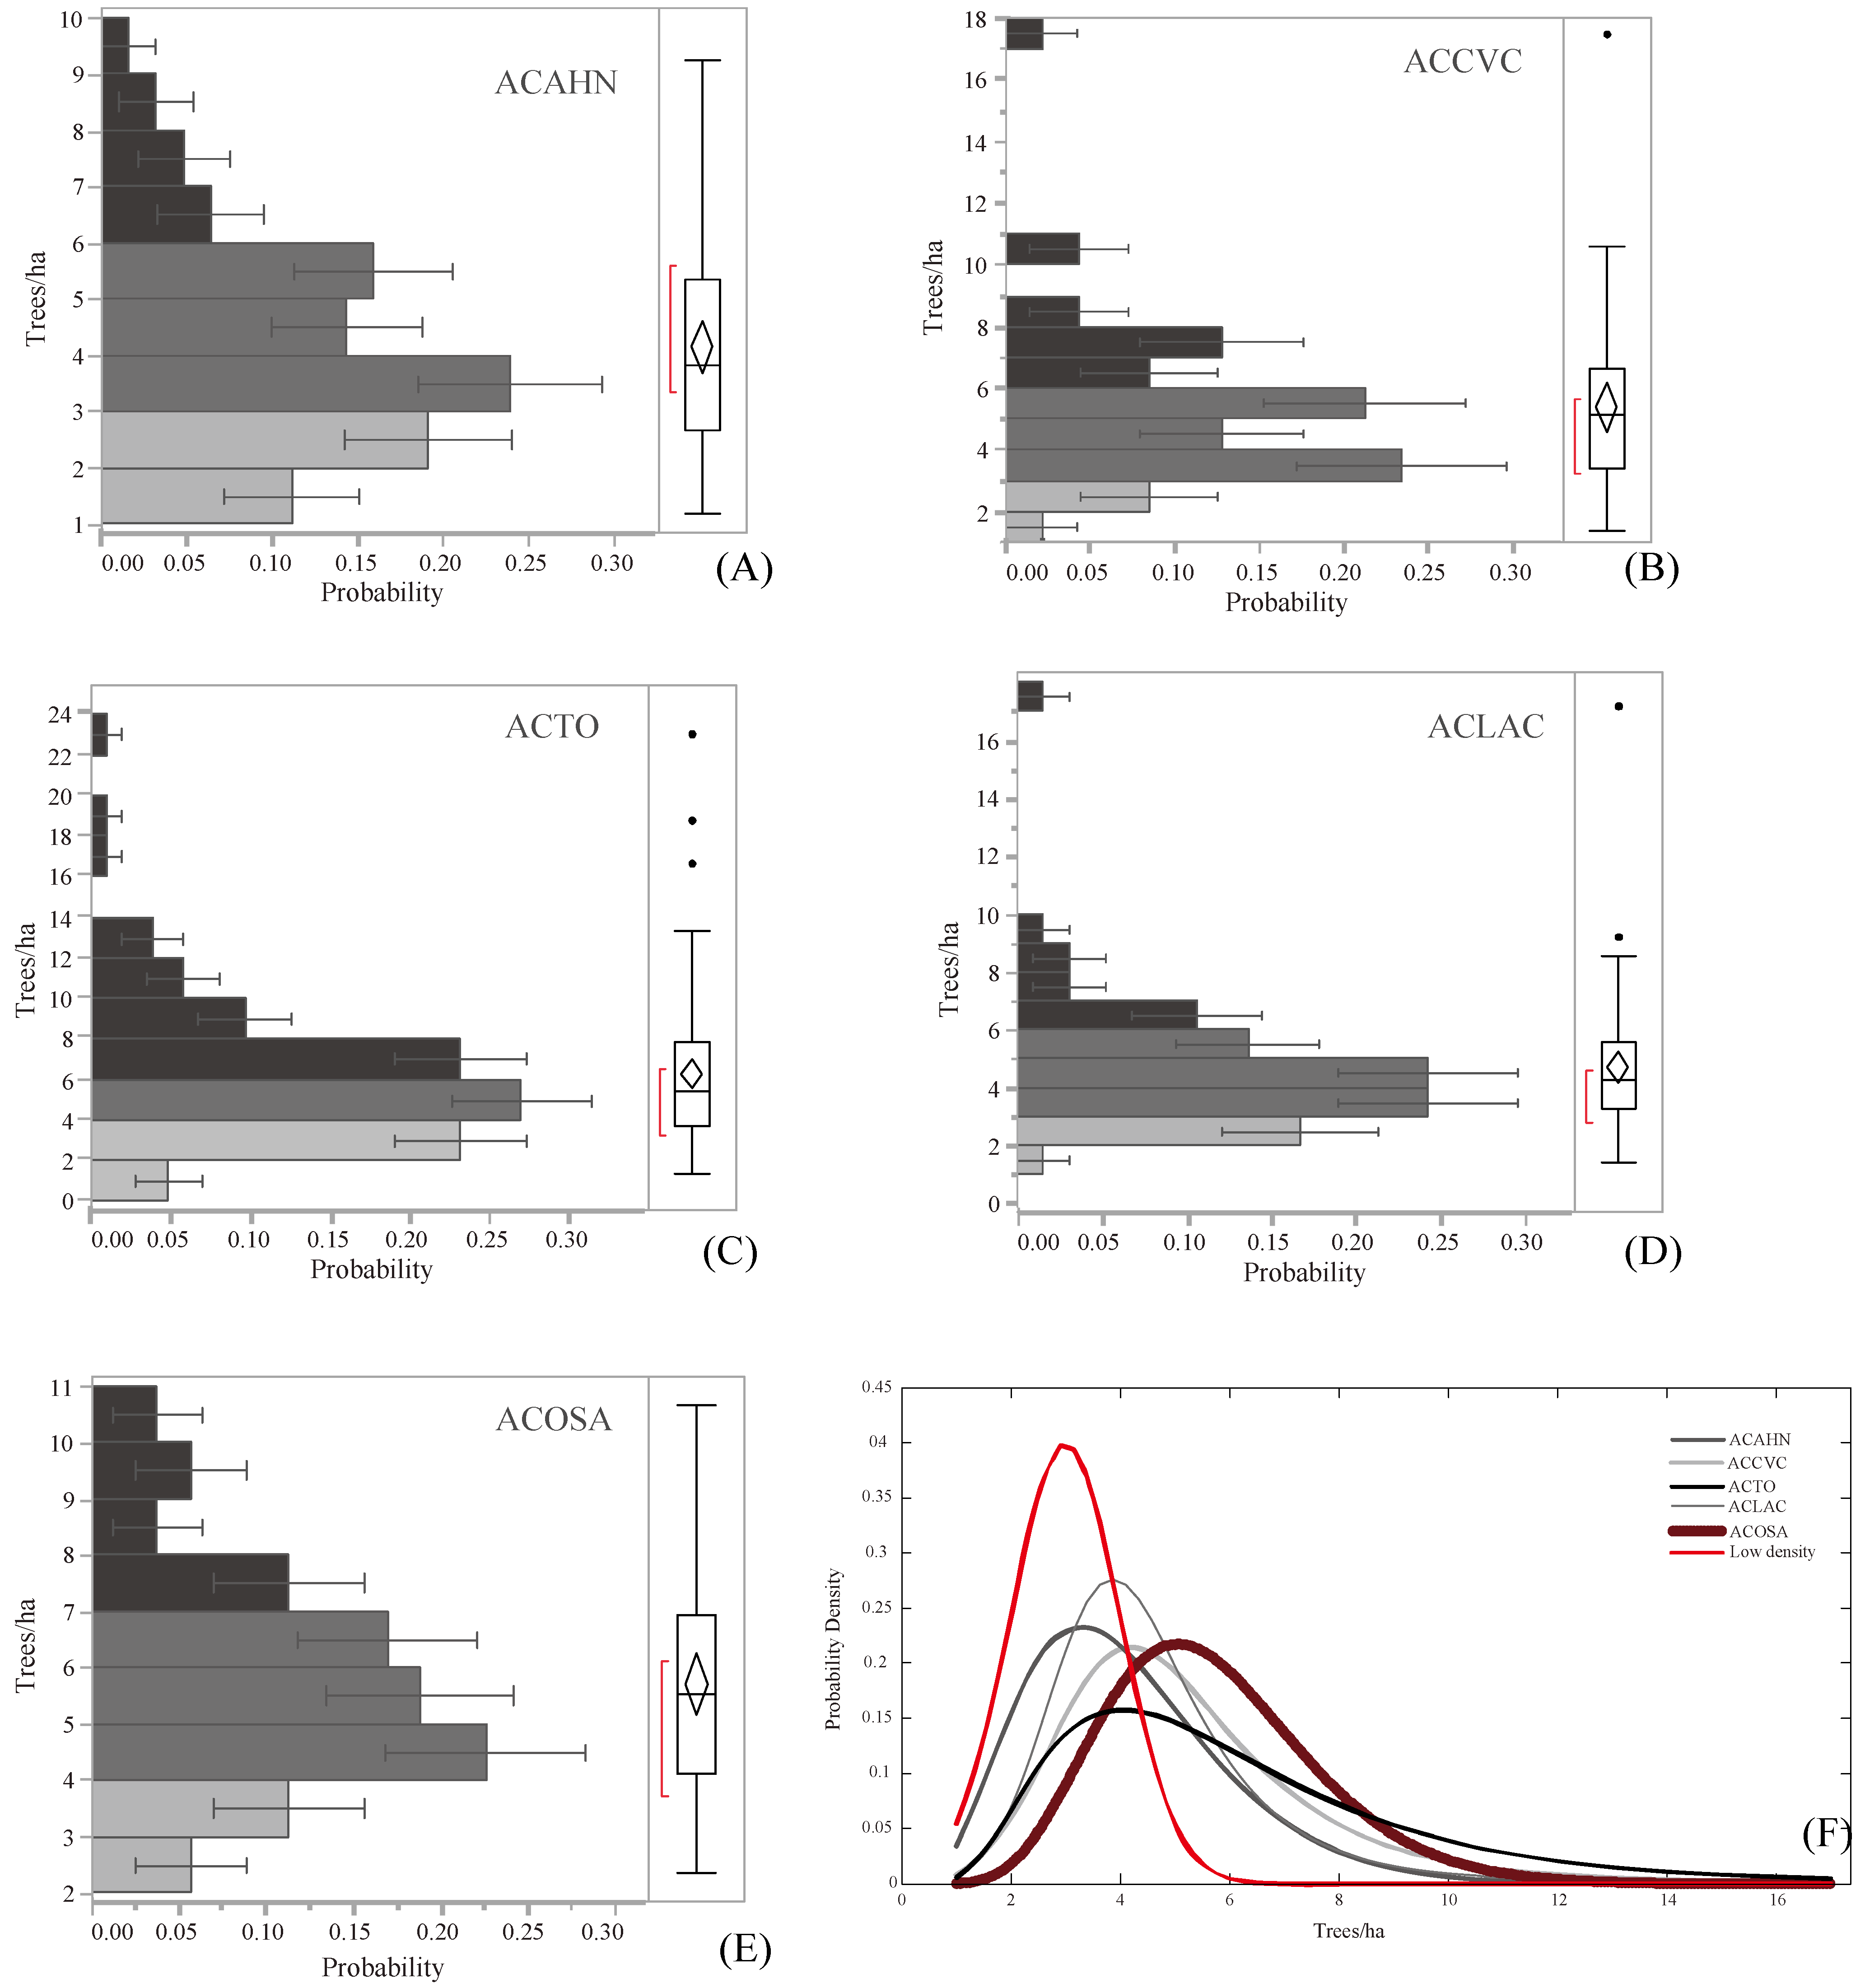
3.2. The Good: An Assessment of Forest Fate

Our assessment of forest fate indicates an agreement or partial agreement of the original forest extent in the management unit (i.e., forest still standing) for more than 90% of the forest units. The highest agreement in ACAHN where 90% of the forest management units retained their forest cover, while the lowest is in ACCVC and ACTO (Table 2). Three Conservation Areas (ACTO, ACLA-C, ACOSA) show a low percentage of forest conversion, 8% or less. Overall, our forest fate results indicate that most of the forest subject to selective logging maintains a forest cover after logging operations. In some instances, logging operations might have a negative impact on the ecosystem. For example, in a two million square kilometer area of the Brazilian Amazon [39] found that logging operations resulted in severe canopy damage and may have promoted deforestation (16% ± 1% of selectively logged areas were deforested within one year of logging and an annual deforestation rate of 5.4% for four years after timber harvests was found). Nevertheless, [40] found that natural forest concessions (parcels of natural forest leased out to companies to extract timber on a long term basis (>30 years)) in Kalimantan (Indonesian Borneo), have a similar impact on slowing forest cover loss than those provided by protected areas in comparison to expanding plantations. It is important to mention that in Costa Rica, natural forest management is small scale (Table 1) and is generally carried out by the owner of the property who contracts the services for timber extraction (from planning to harvest).
Table 2. Assessment of forest permanence after selective logging in five Conservation Areas in Costa Rica; the category agreement with original plan corresponds to a management plan that kept its original forest cover (aerial view analysis) after selective logging; a partial agreement with original plan corresponds to units that might have lost some forest area after logging (qualitative assessment), while no agreement with original plan are areas with no forest cover, meaning that the land use/land cover changed from forest to non-forest. Our analysis does not take into account the forest stand quality after logging (e.g., changes in vegetation species richness and structure); values are given in percentage of the total number of management plans used for the analysis and n corresponds to the number of management plans used for the analysis.
CategoryACAHN (n = 72)ACCVC (n = 57)ACTO (n = 161)ACLA-C (n = 74)ACOSA (n = 58)
Agreement with original plan (%)9070718481
Partial Agreement with original plan (%)1030211217
No Agreement with original plan (%)00842
A notable aspect of our analysis is that it only assesses the presence of forest cover and does not evaluate the quality of the forest stand after logging and its recovery through time. For instance, depending on the disturbance created by felling gaps and extraction roads, a long time may be needed for the recovery of the forest structure and tree species composition [21,41]. Moreover, studies show a high variability of responses to logging practices depending on the objective of the study (e.g., species chosen, spatial and/or temporal scales), the sampling design and the ecosystem [42].

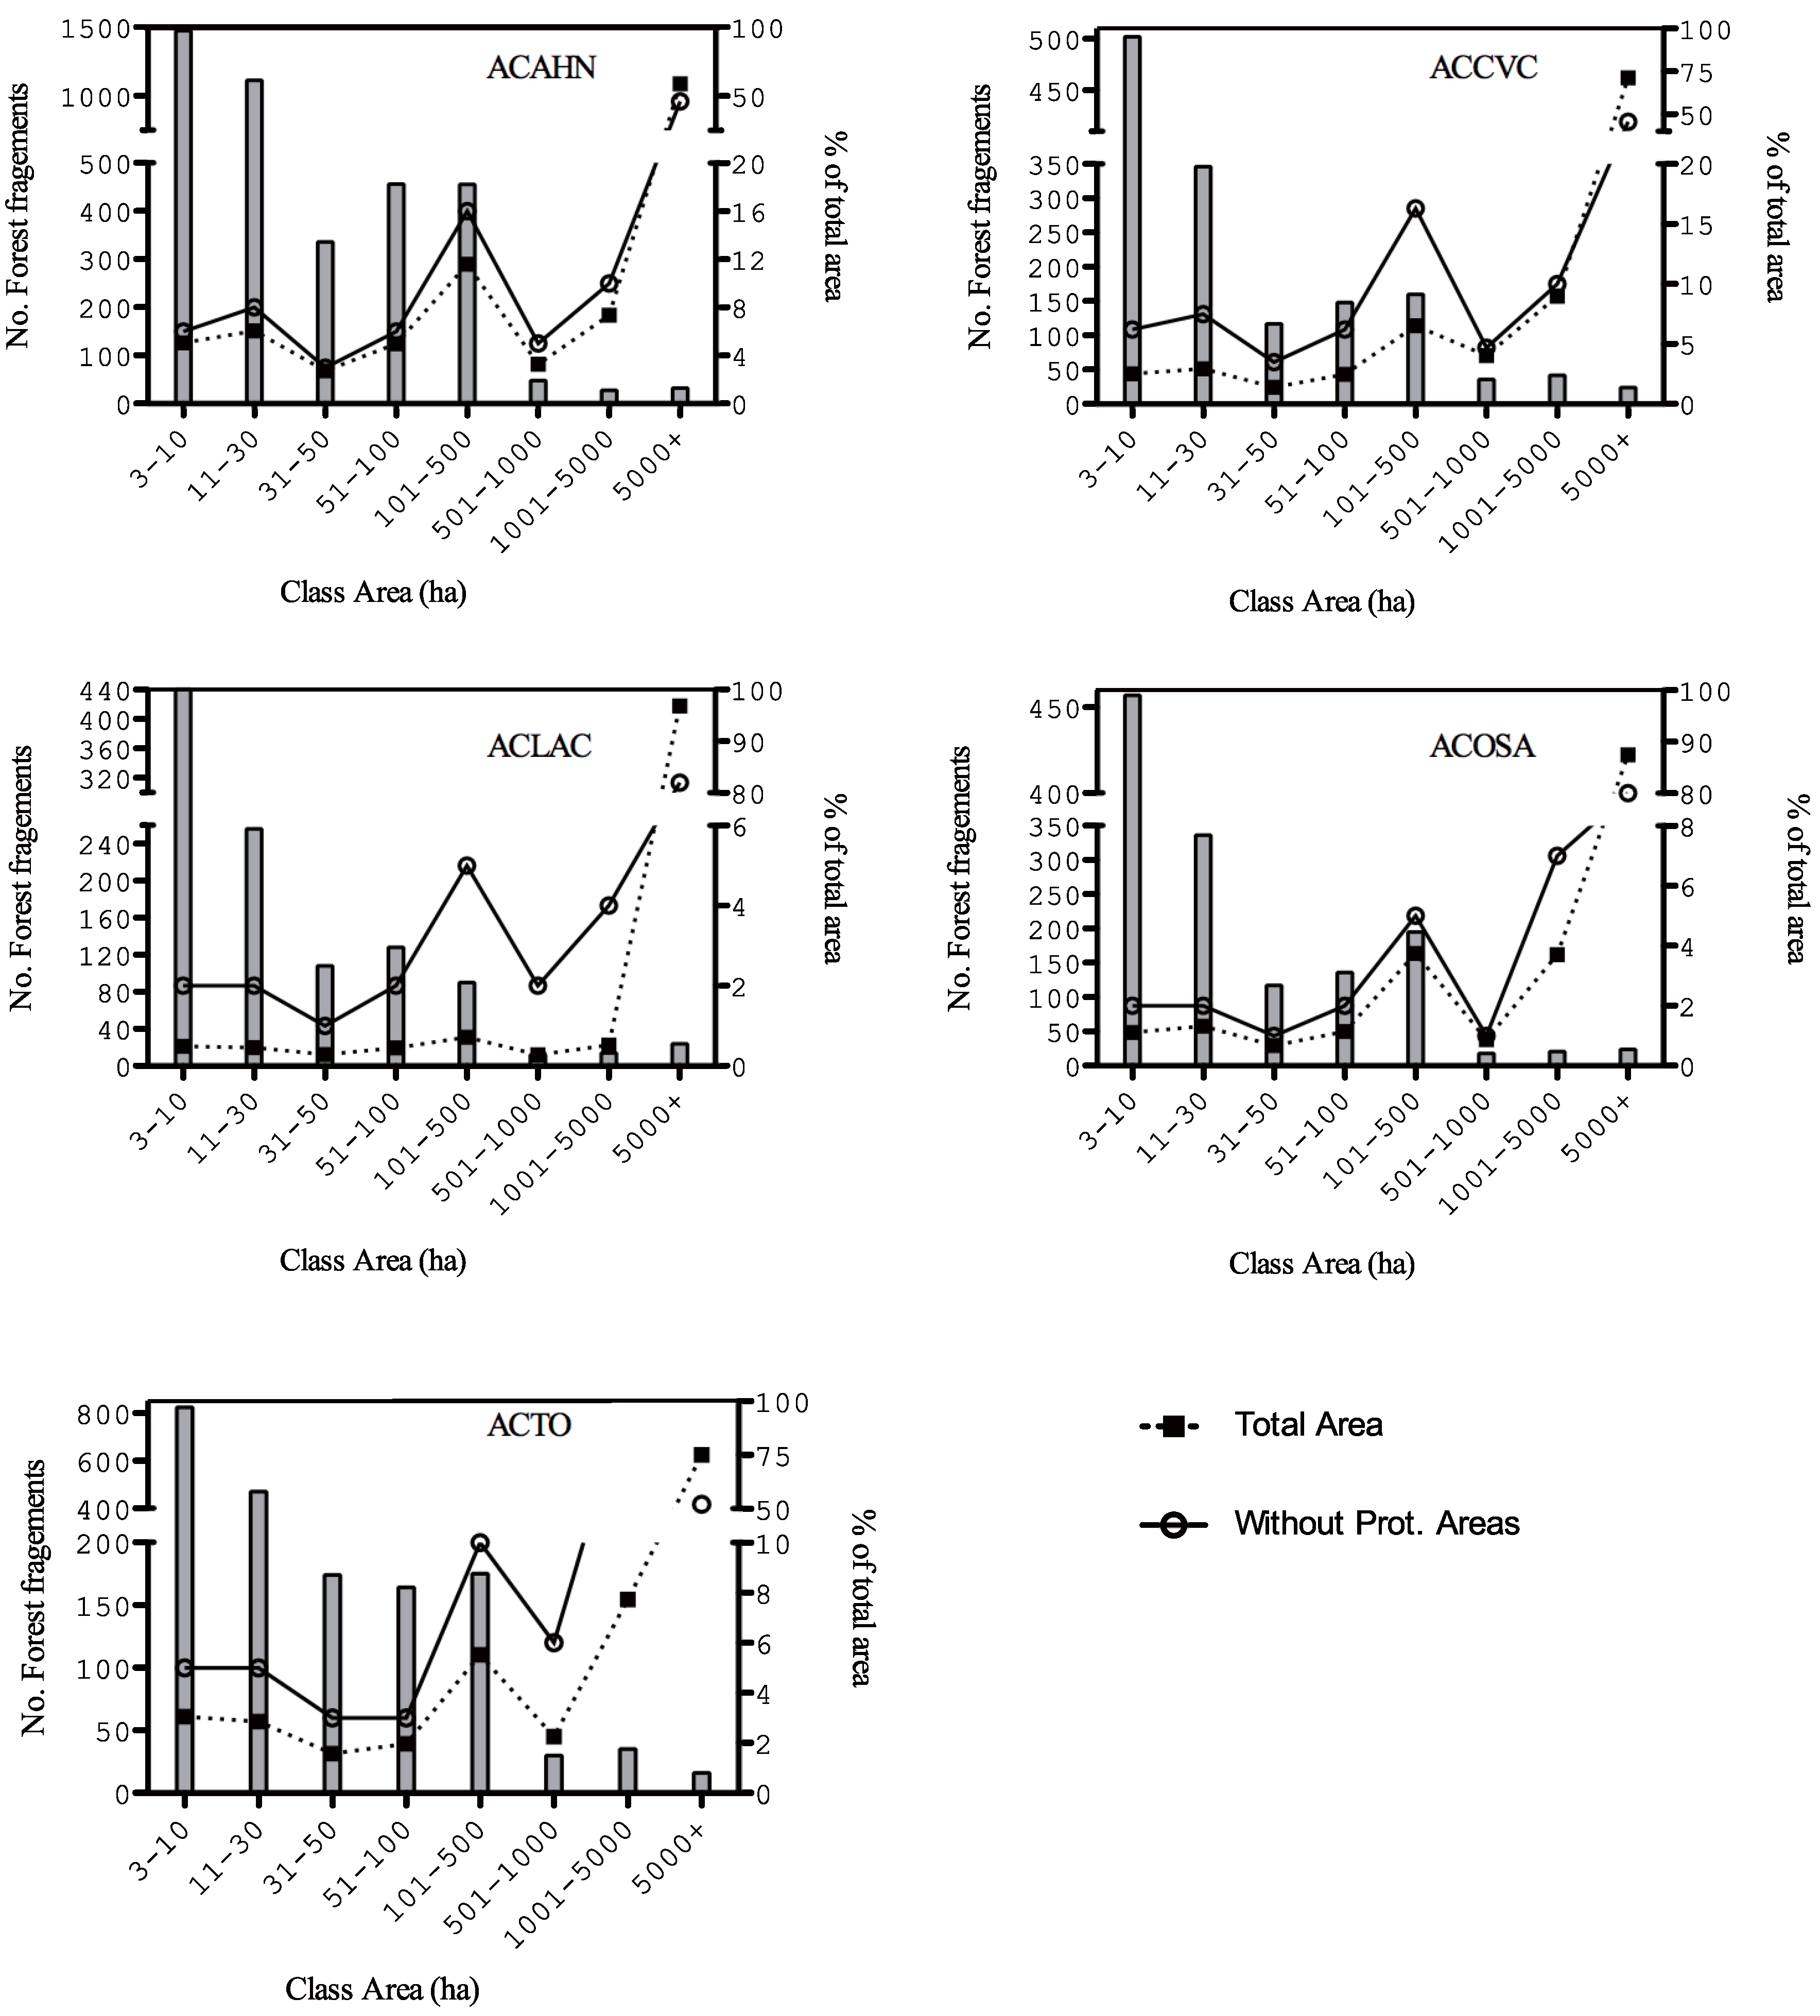
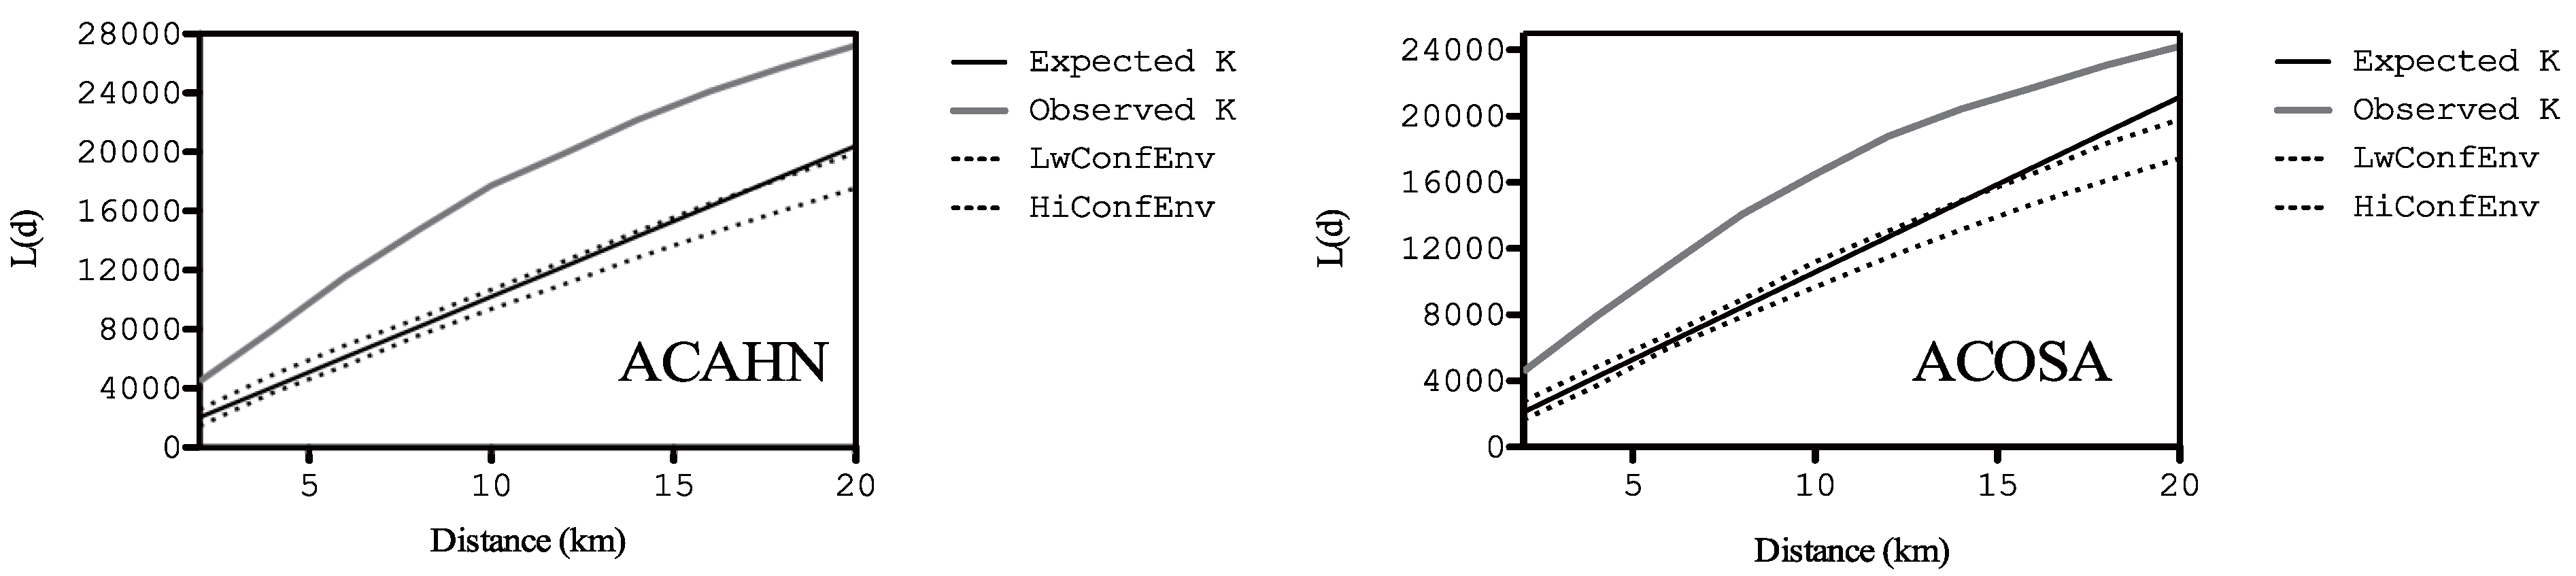
3.3. The Bad: Relationship between Forest Management Location and Forest Fragmentation

Fragmentation statistics for the different conservation areas show a larger number of forest fragments in ACAHN (2241) and ACTO (1144), but these forest areas collectively represent a lower percentage of the land (24% and 47%, respectively) (Table 3). An indication of continuous forest areas is given by the large patch index (LPI) and the percentage of the total forest area this patch represents. In ACLA-C, large forest fragments encompass 69.7% of the total forest area, whereas in ACAHN, the large forest fragments only account for 5.4% of the total forest area (Table 3). When evaluating the average and variability of fragment size, the mean patch area and standard deviation follow the same pattern as the LPI, indicating a high variability in the landscape across Conservation Areas. In terms of the geometric characteristics of the fragments in the landscape, the shape index average indicates very irregular forms of the forest fragments, with values ranging from 1.81 (ACAHN) to 2.08 (ACCVC) (Table 3). These patterns provide a clear overview of the landscape characteristics in these Conservation Areas. Our results are in agreement with previous studies that indicate a high degree of forest fragmentation in Costa Rica as a result of the rapid advance of the agricultural frontier during the 1970s and 1980s [13] and continued deforestation occurring at smaller scales in the last 15 years [43].
Table 3. Fragmentation statistics for five Conservation Areas in Costa Rica based on the Forest Cover Assessment 2005.
MetricACAHNACCVCACLA-CACOSAACTO
Forest Area (ha)159,846105,54446,6324220,991143,108
% Land2448755247
No. Patches22417616107081144
Large Patch Index5.427.469.738.932.1
Mean patch area (ha)67128553271117
Median patch area (ha)77566
Patch range (ha)36,27260,462432,294165,40898,044
Patch area stand. Dev.1069214014,87858322817
Shape Index Mean1.812.081.961.881.99
A more detailed depiction of the landscape in the different Conservation Areas is shown in Figure 3, which illustrates the distribution of the patch class areas as well as the percentage of total forest area of each class in the landscape. Although there are numerous small forest fragments in the landscape (3–10 ha), they represent less than 10% of the total forest area in all of the Conservation Areas. In addition, most of the large fragments (>5000 ha) contribute to a higher percentage of the forest area (>50%). Our results, not including the protected areas (e.g., national parks), show similar trends for all Conservation Areas, with a few large forest fragments accounting for a higher proportion (50%–80%) of the total forest area.
Figure 3. Historical trends of forest management plans presented to the regional offices for five Conservation Areas in Costa Rica and the total number of records across Conservation Areas; the sources for the original data are archives of the regional offices of the National System of Conservation Areas, however, data presented here was is following processed and analyzed by [14,15].
Forests 05 01777 g003
Our cluster analysis results indicate a high degree of spatial clustering for management plans in all Conservation Areas as illustrated in Figure 4 and Figure 5. A visual analysis for each Conservation Area indicated that forest management plans are located and clustered around the larger patches in the landscape, although there are many fragments of less than 100 ha scattered throughout each Conservation Area. Given that our average forest management unit is between 37 and 51 hectares, we do not have a specific explanation for the lack of selective logging in smaller patches (<100 ha) across the landscape, but it may be that these fragments do not provide the necessary volume and species required for logging operations. There is a substantial amount of evidence that smaller fragments in tropical areas have low species richness and are more affected by edge effects [44]. Moreover, in a study in southeastern Brazil, [45] found that fragment connectivity was highly correlated with the species richness of shade-tolerant species, with fragments of low connectivity containing a lower species richness of these shade-tolerant species. A second potential explanation is that many of these forest areas belong to small to medium landholders who might have chosen the Payments for Environmental Services program as a way to get an economic incentive for preserving their forest areas [46]. Regardless of the variable(s) that explains this pattern, these small forest fragments represent the last forest remnants in the agricultural matrix and their conservation value is significant for many services as well as for landscape connectivity.
Figure 4. Number of forest fragments (left y axis) and percentage of the total % forest area (right y axis) with and without protected areas (e.g., National Parks) for five Conservation Areas in Costa Rica; the class area (ha) represents intervals for different forest fragment sizes encompassing small forest fragments to very large continuous forest areas (5000+ has).
Forests 05 01777 g004
Figure 5. Multi-Distance Spatial Cluster Analysis (Ripley’s K Function) of forest management units for ACAHN (Northern Costa Rica) and ACOSA (Southern Pacific); the other three conservation areas also indicate a high degree of clustering at all spatial scales (Data not shown).
Forests 05 01777 g005

3.4. The Ugly: a Preliminary Discussion on Polycyclic Management in Costa Rica

Results indicate a higher probability of management plans extracting timber in the 5–7 trees/ha bins for the Conservation Areas, which is within the range of medium felling intensity conventional logging (Figure 6 A–E) [29]. For example, for ACOSA the highest probability for felling intensity is 5 trees/ha with 56% of the management plans falling into the 5 to 11 trees/ha potentially logged range (Figure 6F). In ACTO, the highest probability for felling intensity is 4 trees/ha but 72% of the management plans fall into the 4 to 24 trees/ha potentially logged range. Figure 6F clearly identifies the differences between the fitted function of trees per hectare potentially logged for each Conservation Area in comparison to a low intensity reduced-impact logging scenario, centered on 3 ± 1 trees per hectare [31]. These results also indicate that heavy intensity logging (≥6 trees/ha) may be present in all Conservation Areas to some extent (Figure 6). In the two Conservation Areas with the highest intensity felling, 38% (ACTO) and 42% (ACOSA) of the management plans potentially extracted six or more trees per hectare. Under a low felling intensity RIL scenario 48% of the management plans would extract between one and three trees per hectare. For the Conservation Areas only 5% (ACOSA) to 29% (ACAHN) of the potentially extracted trees fall under the low felling intensity scenario. It is important to note that RIL was not practiced in any of the Conservation Areas and we mention it here as a qualitative approximation of sustainable forest management [30]. In this case, we use numbers of trees per hectare as a proxy for forest disturbance based on the canopy damage that felling trees could cause and the gaps they create in the forest stand [21,39]. Given that forest logging operations focus on large adult trees (≥60 cm DBH) and are based on the extraction of 60% of the total commercial volume allowed by Costa Rican law in natural forest extractions (for all species) [47], it is likely that forest stands are highly affected by logging disturbance [21]. In this study, we do not take into account damage created by the felling of non-target trees and any additional disturbances created by skid roads and timber patios, where heavy machinery (e.g., D5 tractors) is commonly used for forest extraction, primary and secondary road construction [30]. As noticed by [29], most logging operations occurring in the tropical rainforest remain unplanned and are very destructive to the stand. Our preliminary assessment indicates Costa Rican forest extraction operations may not be and exception to this finding (Figure 6). Further analyses of our data will focus on analyzing information from the management plans to measure the total disturbance reported. Nevertheless, field evaluation and/or remote sensing might be necessary to have a more complete understanding of the damaging effects of logging practices in Costa Rican forests.
Figure 6. Probability distributions based on trees per hectare proposed to be logged for management plans in five Conservation Areas in Costa Rica (AE); light colors on the bars represent low logging densities (trees/ha); more intense gray color indicates conventional logging practices and dark gray bars very heavy logging; (F) shows a fitted probability density function for each Conservation Area compared to a low density logging fit (3 trees/ha).
Forests 05 01777 g006
The current Forestry Law and its Code of Practices for polycyclic management indicate a possible rotation cycle of 10–15 years after the first logging extraction. To the extent of our knowledge, there is no ecological, economic or social study that justifies this rotation cycle for the recovery of the forest stand, given the historical extraction practices and the potential damage caused by the conventional logging used in the country (Figure 6) (however, see [48]). As stated by Bonnell, et al. [41], the uncertainty in recovery times after selective logging would result in the establishment of inappropriate harvesting rates and/or a failure to achieve conservation targets. For example, in Uganda’s Kibale National Park, Bonnell, et al. [41] found that the recovery of basal area will take between 97 years, for moderately logged compartments, and 112 years, for heavily logged compartments. A plot level study in the eastern Brazilian Amazon indicates that, under conventional logging (5.6 trees per hectare) forest recovered only 77% of its original above-ground biomass stock 16 years after logging, and the biomass of all size classes decreased when compared to pre-logging levels [49]. More importantly, for large diameter individuals, trees >60 cm DBH only contained 48% of their previous biomass. At the regional level, a simulation study using geographical modelling found that, for a large area in the Brazilian Amazon, the loss of forest carbon due to selective logging lasts two to three decades following harvest, and the original live biomass would only recover after 100 years [50] without subsequent disturbances of the forest stand. As noticed by [51], in a meta-analysis of selective logging in tropical regions the decreases in timber yields after the first harvest from old-growth forests seem inevitable. For selectively logged forests to fully regain the volume of timber accumulated during the preceding centuries while using a 20–40 year harvest cycle, forest management practices would need substantial modification. This, we believe, is the case for Costa Rican forest management practices. A substantial modification to the new Code of Practices for polycyclic management needs to be implemented if forest management is to be a sustainable land use in future decades.
The Code of Practices for polycyclic management provides a framework with very specific guidelines for selective logging in areas with or without previous natural forest management plan records. For example, with the advancement of technology (e.g., GPS), there has been an effort to establish better geo-location of the management units, sampling plots, adult trees (>60 cm DBH) and protected zones. Previous management plans lack a consistent quality in their mapping efforts [15] and also showed bias towards higher biomass zones in the management unit [52]. This combination of factors potentially had an effect in the approval of the management plans by the Forestry Authority of the State, especially during the period of 1996–1998 where a large number of logging permits were requested and approved by the regional offices (Figure 3).
As a way to better understand part of the ecological processes in forest regeneration [53], the Code of Practices encompasses a classification based on the tolerance of vegetation to light regimes (short lived-sciophytes, long live sciophytes and heliophytes). This classification is therefore used as a proxy for understanding the densities (#trees/ha) of timber species (light hardwoods to hardwoods) and the economic value of these species in the forest stand [18]. This classification in combination with reference thresholds [54] adapted for each Conservation Area and their ecosystem characteristics would allow for specific management regimes in the forest stands and a better definition of logging intensities. An example of this threshold is the density of short-lived sciophytes, where they should not surpass 15% of the total number of trees >10 cm DBH in the forest stand, because it most likely indicates a less productive forest stand that is still under recovery.
For the most part, we believe the methodology presented in the new Code of Practices for polycyclic management uses ecological principles in combination with an already well-standardized methodology for collecting the biophysical characteristics of the forest unit [14]. Still, we argue that assuming that 10–15 years is enough for a forest to fully recover its structure and tree composition given the results obtained here, in terms of the number of trees logged per hectare under conventional logging (Figure 6F) and the very fragmented landscapes, might be insufficient for the long-term conservation of these complex forest ecosystems. Finally, we hope our results are taken as an opportunity to further research in forest management recovery after selective logging [21] in the country and other tropical regions with similar characteristics, as well as a chance for decision makers and stakeholders (e.g., NGOs, scientists, etc.) to understand natural forest management issues at a broader landscape scale.

4. Conclusions

Our study takes advantage of a fully developed and novel forestry geographic information system and relational database based on historical natural forest management data from Costa Rica. We provide a first analysis of the historical patterns of forest management in five Conservation Areas where selective logging has been a common land use. Forest management has very likely been influenced by policies in the country such as the incentives for forest management during the mid-1990s and a shift to the conservation of forest stands under the umbrella of the environmental services payment program. This shows the importance of the implementation of conservation policies in the country to forest management. On a positive note, it could be argued that forest management practices in the mid-1990s period might have helped to preserve the forest stands around Conservation Areas where logging was carried out, especially during the transition period with the law banning land-use changes (forest to non-forest) around 1996. A less positive aspect of forest management is the pressure of forest management around protected areas; we found a highly clustered pattern of management plans in these regions. This might be a consequence of the highly fragmented landscape matrix outside of continuous forest and the understanding that extremely patchy forest fragments may not be adequate for selective logging practices. Finally, we open a discussion on the rather ad hoc logging cycle of 10–15 years proposed by the Forestry Law, despite significant evidence of much longer forest recovery times in tropical regional undergoing conventional logging. Regardless of this negative finding, we recommend that sustainable forest management regulations and the implementation of reduced impact logging should be considered for reducing forest degradation in the country’s fragile and isolated ecosystems. This would allow the country to strengthen its REDD+ initiative and provide a better framework to understand forest practices at local and regional levels. Future research must focus on how to implement the UN-REDD+ program for establishing better sustainable forest management practices and develop a most needed research agenda to measure the carbon stocks and fluxes in selectively logged forests in Costa Rica.

Acknowledgments

We would like to thank Lic. Maria Isabel Chavarria from the Costa Rican Forestry Resources Information System (SIREFOR) office and Gilbert Canet from the National System of Conservation Areas (SINAC) for providing support and access to the forest management plan hard copies during previous stages of this project. In addition, the following directors of the sub-regional offices provided support regarding logistics and raw document access: ACAHN (Lic. Fausto A. Morales), ACLA-C (Ing. Roberto Hagges Channer and Ing. Victor Vega), ACCVC (Ing. Luis Fernando Salas-Sarkis), ACOSA (Ing. Pablo Astua) and ACTO (Lic. Laura G. Rivera-Quintanilla). Without their support, this project would have not been possible. Funding was provided by the Global Environment and Climate Change Center at McGill University (to Arroyo-Mora), the Department of Geography, the Natural Sciences and Engineering Research Council Canada, the Canada Foundation for Innovation (to Kalacska), the ESRI Inc. McGill Undergraduate GIS award, and the Rathlyn GIS Award (to Svob). We would like to acknowledge David Edwards and two anonymous reviewers whose valuable comments helped to improve this manuscript. Special thanks to the numerous students that actively participated in data collection, entry and cleaning.

Author Contributions

Pablo Arroyo carried out the majority of the data analysis and wrote the manuscript. Sienna Svob and Margaret Kalacska performed specific parts of the analysis and provided comments. Robin Chazdon reviewed the manuscript and provided valuable comments for the overall improvement of the manuscript.

Conflicts of Interest

The authors declare no conflict of interest.

References

  1. Rodrigues, A.S.L.; Andelman, S.J.; Bakarr, M.I.; Boitani, L.; Brooks, T.M.; Cowling, R.M.; Fishpool, L.D.C.; da Fonseca, G.A.B.; Gaston, K.J.; Hoffmann, M.; et al. Effectiveness of the global protected area network in representing species diversity. Nature 2004, 428, 640–643. [Google Scholar] [CrossRef] [PubMed]
  2. Chazdon, R.L. Ecology-tropical forests-log ’em or leave ’em? Science 1998, 281, 1295–1296. [Google Scholar] [CrossRef]
  3. Johns, A.G. Timber Production and Biodiversity in the Tropical Rain Forests; Cambridge University Press: Cambridge, UK, 1997. [Google Scholar]
  4. Cannon, C.H.; Peart, D.R.; Leighton, M. Tree species diversity in commercially logged bornean rainforest. Science 1998, 281, 1366–1368. [Google Scholar] [CrossRef] [PubMed]
  5. Dunn, R.R. Managing the tropical landscape: A comparison of the effects of logging and forest conversion to agriculture on ants, birds, and Lepidoptera. For. Ecol. Manag. 2004, 191, 215–224. [Google Scholar] [CrossRef]
  6. Douglas, I.; Spencer, T.; Greer, T.; Bidin, K.; Sinun, W.; Meng, W.W. The impact of selective commercial logging on stream hydrology, chemistry and sediment loads in the Ulu Segama rain forest, Sabah, Malaysia. Philos. Trans. Biol. Sci. 1992, 335, 397–406. [Google Scholar] [CrossRef]
  7. Nepstad, D.C.; Verssimo, A.; Alencar, A.; Nobre, C.; Lima, E.; Lefebvre, P.; Schlesinger, P.; Potter, C.; Moutinho, P.; Mendoza, E.; et al. Large-scale impoverishment of Amazonian forests by logging and fire. Nature 1999, 398, 505–508. [Google Scholar] [CrossRef]
  8. Broadbent, E.N.; Asner, G.P.; Keller, M.; Knapp, D.E.; Oliveira, P.J.C.; Silva, J.N. Forest fragmentation and edge effects from deforestation and selective logging in the Brazilian Amazon. Biol. Conserv. 2008, 141, 1745–1757. [Google Scholar] [CrossRef]
  9. Putz, F.E.; Blate, G.M.; Redford, K.H.; Fimbel, R.; Robinson, J. Tropical forest management and conservation of biodiversity: An overview. Conser. Biol. 2001, 15, 7–20. [Google Scholar] [CrossRef]
  10. Blaser, J.; Sarre, A.; Poore, D.; Johnson, S. Status of Tropical Forest Management 2011; ITTO: Yokohama, Japan, 2011; p. 418. [Google Scholar]
  11. McGinley, K.; Finegan, B. Criterios e indicadores para evaluar la sostenibilidad ecológica: Un conjunto integrado para bosques manejados en Costa Rica. Rev. For. Centroam. 2001, 34, 23–27. [Google Scholar]
  12. ITTO. Revised ITTO Criteria and Indicators for Sustainable Management of Tropical Forests Including Reporting Format; ITTO: Yokohama, Japan, 2005; p. 40. [Google Scholar]
  13. De Camino, R.; Segura, O.; Arias, L.G.; Perez, I. Costa Rica: Forest Strategy and the Evolution of Land Use; The World Bank: Washington, DC, USA, 2000; p. 151. [Google Scholar]
  14. Svob, S.; Arroyo-Mora, J.P.; Kalacska, M. The development of a forestry geodatabase for natural forest management plans in Costa Rica. For. Ecol. Manag. 2014. [Google Scholar] [CrossRef]
  15. Arroyo-Mora, J.P.; Chazdon, R.; Kalacska, M.; Obando, G.; Aguilar, L.; Salas, L.F. Development of a Forest Management GIS for Costa Rica, a Case Study for the Central Volcanic Cordillera Conservation Area: Management Trends, Lessons and Potential Uses in Ecological Research and Conservation Planning. In Proceedings of the XIII World Forestry Congress, Buenos Aires, Argentina; 2009. [Google Scholar]
  16. Nasi, R.; Putz, F.; Pacheco, P.; Wunder, S.; Anta, S. Sustainable forest management and carbon in tropical Latin America: The case for REDD+. Forests 2011, 2, 200–217. [Google Scholar]
  17. McGarigal, K.; Marks, B.J. Fragstats: Spatial Pattern Analysis Program for Quantifying Landscape Structure; U.S. Department of Agriculture, Forest Service, Pacific Northwest Research Station: Portland, OR, USA, 2005; p. 122.
  18. SINAC. Estandares de sostenibilidad para manejo de bosques naturales: Codigo de practicas. In Resolucion R-SINAC-021-2009; La Gaceta: San Jose, Costa Rica, 2009. [Google Scholar]
  19. Clark, D.A.; Piper, S.C.; Keeling, C.D.; Clark, D.B. Tropical rain forest tree growth and atmospheric carbon dynamics linked to interannual temperature variation during 1984–2000. Proc. Nat. Acad. Sci. 2003, 100, 5852–5857. [Google Scholar] [CrossRef] [PubMed]
  20. Phillips, O.L.; Aragão, L.E.O.C.; Lewis, S.L.; Fisher, J.B.; Lloyd, J.; López-González, G.; Malhi, Y.; Monteagudo, A.; Peacock, J.; Quesada, C.A.; et al. Drought sensitivity of the Amazon rainforest. Science 2009, 323, 1344–1347. [Google Scholar] [CrossRef] [PubMed] [Green Version]
  21. Arroyo-Mora, J.P.; Kalacska, M.; Chazdon, R.L.; Civco, D.; Obando, G.; Sanchum, A.A. Assessing recovery following selective logging of lowland tropical forests based on hyperspectral imagery. In Hyperspectral Remote Sensing of Tropical and Sub-Tropical Forests; Kalacska, M., Sanchez-Azofeifa, G.A., Eds.; Taylor and Francis Group-CRC Press: Boca Raton, FL, USA, 2008; pp. 193–212. [Google Scholar]
  22. Calvo-Alvarado, J.C.; Sanchez-Azofeifa, A. Estudio de Monitoreo de Cobertura Forestal de Costa Rica 2005; FONAFIFO: San Jose, Costa Rica, 2007. [Google Scholar]
  23. ESRI. Arcgis Desktop: Release 10.1, Environmental Systems Research Institute: Redlands, CA, USA, 2011.
  24. Arroyo-Mora, J.P.; Sánchez-Azofeifa, G.A.; Rivard, B.; Calvo, J.C.; Janzen, D.H. Dynamics in landscape structure and composition for the Chorotega region, Costa Rica from 1960 to 2000. Agric. Ecosyst. Environ. 2005, 106, 27–39. [Google Scholar]
  25. Sánchez-Azofeifa, G.A.; Harriss, R.C.; Skole, D.L. Deforestation in Costa Rica: A quantitative analysis using remote sensing imagery. Biotropica 2001, 33, 378–384. [Google Scholar]
  26. Sanchez-Azofeifa, G.A.; Rivard, B.; Calvo, J.; Moorthy, I. Dynamics of tropical deforestation around national parks: Remote sensing of forest change on the Osa Peninsula of Costa Rica. Mt. Res. Dev. 2002, 22, 352–358. [Google Scholar] [CrossRef]
  27. Hanson, T.; Brunsfeld, S.; Finegan, B. Variation in seedling density and seed predation indicators for the emergent tree Dipteryx panamensis in continuous and fragmented rain forest. Biotropica 2006, 38, 770–774. [Google Scholar] [CrossRef]
  28. Guariguata, M.R.; Claire, H.A.; Jones, G. Tree seed fate in a logged and fragmented forest landscape, northeastern Costa Rica1. Biotropica 2002, 34, 405–415. [Google Scholar] [CrossRef]
  29. Sist, P.; Ferreira, F.N. Sustainability of reduced-impact logging in the eastern Amazon. For. Ecol. Manag. 2007, 243, 199–209. [Google Scholar] [CrossRef]
  30. Putz, F.E.; Sist, P.; Fredericksen, T.; Dykstra, D. Reduced-impact logging: Challenges and opportunities. For. Ecol. Manag. 2008, 256, 1427–1433. [Google Scholar] [CrossRef]
  31. Sist, P.; Mazzei, L.; Blanc, L.; Rutishauser, E. Large trees as key elements of carbon storage and dynamics after selective logging in the eastern Amazon. For. Ecol. Manag. 2014, 318, 103–109. [Google Scholar] [CrossRef]
  32. ITTO. Status of Tropical Forest Management 2005; ITTO: Yokohama, Japan, 2007. [Google Scholar]
  33. Asner, G.P.; Knapp, D.E.; Broadbent, E.N.; Oliveira, P.J.C.; Keller, M.; Silva, J.N. Selective logging in the Brazilian Amazon. Science 2005, 310, 480–482. [Google Scholar] [CrossRef] [PubMed]
  34. Phillips, P.L. Key Vegetation Types for the Osa Peninsula, Costa Rica; Center for Space Research, The Nature Conservancy: Austin, TX, USA, 1993; p. 20. [Google Scholar]
  35. Miranda, M.; Dieperink, C.; Glasbergen, P. Costa rican environmental service payments: The use of a financial instrument in participatory forest management. Environ. Manag. 2006, 38, 562–571. [Google Scholar]
  36. Barrantes, G.; Jiménez, Q.; Lobo, J.; Maldonado, T.; Quesada, M.; Quesada, R. Evaluación de Los Planes de Manejo Forestales Autorizados en el Período 1997–1999 en la Península de Osa. Cumplimiento de Normas Técnicas, Ambientales e Impacto Sobre el Bosque Natural; Fundación Cecropia: San Jose, Costa Rica, 1999. [Google Scholar]
  37. Pagiola, S. Payments for environmental services in Costa Rica. Ecol. Econ. 2008, 65, 712–724. [Google Scholar] [Green Version]
  38. Daniels, A.E.; Bagstad, K.; Esposito, V.; Moulaert, A.; Rodriguez, C.M. Understanding the impacts of Costa Rica’S pes: Are we asking the right questions? Ecol. Econ. 2010, 69, 2116–2126. [Google Scholar]
  39. Asner, G.P.; Broadbent, E.N.; Oliveira, P.J.C.; Keller, M.; Knapp, D.E.; Silva, J.N.M. Condition and fate of logged forests in the Brazilian Amazon. Proc. Natl. Acad. Sci. USA. 2006, 103, 12947–12950. [Google Scholar] [PubMed]
  40. Gaveau, D.L.A.; Kshatriya, M.; Sheil, D.; Sloan, S.; Molidena, E.; Wijaya, A.; Wich, S.; Ancrenaz, M.; Hansen, M.; Broich, M.; et al. Reconciling forest conservation and logging in Indonesian Borneo. PLoS One 2013, 8. [Google Scholar] [CrossRef] [PubMed]
  41. Bonnell, T.R.; Reyna-Hurtado, R.; Chapman, C.A. Post-logging recovery time is longer than expected in an east African tropical forest. For. Ecol. Manag. 2011, 261, 855–864. [Google Scholar] [CrossRef]
  42. Laufer, J.; Michalski, F.; Peres, C.A. Assessing sampling biases in logging impact studies in tropical forests. Trop. Conserv. Sci. 2013, 6, 16–34. [Google Scholar]
  43. Fagan, M.E.; DeFries, R.S.; Sesnie, S.E.; Arroyo, J.P.; Walker, W.; Soto, C.; Chazdon, R.L.; Sanchun, A. Land cover dynamics following a deforestation ban in northern Costa Rica. Environ. Res. Lett. 2013, 8, 034017. [Google Scholar] [CrossRef]
  44. Turner, I.M. Species loss in fragments of tropical rain forest: A review of the evidence. J. Appl. Ecol. 1996, 33, 200–209. [Google Scholar] [CrossRef]
  45. Metzger, J.P. Tree functional group richness and landscape structure in a Brazilian tropical fragmented landscape. Ecol. Appl. 2000, 10, 1147–1161. [Google Scholar] [CrossRef]
  46. Zbinden, S.; Lee, D.R. Paying for environmental services: An analysis of participation in Costa Rica’S PSA program. World Dev. 2005, 33, 255–272. [Google Scholar] [CrossRef]
  47. Valverde, O. Application of a timber extraction vulnerability index in a humid tropical forest. Rev. For. Mesoam. Kuru 2006, 3. [Google Scholar]
  48. Howard, A.F. A linear programming model for predicting the sustainable yield of timber from a community forest on the Osa Peninsula of Costa Rica. For. Ecol. Manag. 1993, 61, 29–43. [Google Scholar] [CrossRef]
  49. West, T.A.P.; Vidal, E.; Putz, F.E. Forest biomass recovery after conventional and reduced-impact logging in Amazonian Brazil. For. Ecol. Manag. 2014, 314, 59–63. [Google Scholar] [CrossRef]
  50. Huang, M.; Asner, G.P. Long-term carbon loss and recovery following selective logging in Amazon forests. Glob. Biogeochem. Cycles 2010, 24, GB3028. [Google Scholar] [CrossRef]
  51. Putz, F.E.; Zuidema, P.A.; Synnott, T.; Peña-Claros, M.; Pinard, M.A.; Sheil, D.; Vanclay, J.K.; Sist, P.; Gourlet-Fleury, S.; Griscom, B.; et al. Sustaining conservation values in selectively logged tropical forests: The attained and the attainable. Conserv. Lett. 2012, 5, 296–303. [Google Scholar] [CrossRef]
  52. Svob, S.; Arroyo-Mora, J.P.; Kalacska, M. An assessment of wood density and aboveground biomass variability using pre-felling inventory data in Costa Rica. Carbon Balance Manag. 2014; Under review. [Google Scholar]
  53. Finegan, B. Pattern and process in neotropical secondary rain forests: The first 100 years of succession. Trends Ecol. Evol. 1996, 11, 119–124. [Google Scholar] [CrossRef] [PubMed]
  54. Finegan, B.; Delgado, D.; Hayes, D.J.; Gretzinger, S. El monitoreo ecológico como herramienta de manejo forestal sostenible: Consideraciones básicas y propuesta metodológica con énfasis en bosques de alto valor para la conservación certificados bajo el marco del fsc. Recur. Nat. Ambiente 2004, 42, 29–42. [Google Scholar]

