1. Introduction
There has been considerable debate about how to define and measure forest degradation in the context of the United Nations Framework Convention on Climate Change (UNFCCC) policy on Reduced Emissions from Deforestation and forest Degradation (REDD+) [
1,
2]. Many contrasting views have been presented on this subject [
3,
4,
5,
6] and it has even been suggested that a definition is not required [
7].
An important part of the discussion on the definition of forest degradation at the international level has assumed that it is necessary to establish thresholds and/or indicators that allow forests in non-Annex I countries to be classified as degraded or non-degraded; on the grounds that such a system is required for the purpose of generating carbon credits under REDD+ [
8]. However, the estimation of net greenhouse gas (GHG) emissions implies not only the identification of areas that have been subject to degradation in a given period but also the assessment of the annual rate of loss of carbon stocks within these forests, which requires more than simple thresholds, as it implies quantification of degradation over space and time. In addition, REDD+ schemes are required to assess more than just carbon stocks, so projects are expected to demonstrate positive outcomes in terms biodiversity and local livelihoods.
Thompson
et al. [
9] have called for a broad definition of degradation that includes five criteria, of which carbon storage is only one. They emphasise that forest degradation is a wide and complex concept that can be quantified using several indicators that range from those focused on biodiversity to those most linked to stored carbon. Variation in the definitions proposed for forest degradation is highly dependent on the interests of the corresponding stakeholders. Until now, the climate change mitigation aims of REDD+ have given the highest priority to carbon storage, even though concerns have been raised that if this is the sole focus of REDD+ it could promote actions that have a negative effect on biodiversity [
10]. Even though a more integrated approach is desirable, it is not clear that a multi-criteria definition of degradation, with the associated complexity of its indicators, would satisfy the requirements for monitoring REDD+ projects in which funding is primarily linked to demonstrated improvements in carbon stocks compared with the case of “business-as-usual”. Therefore, in this paper we focus on the application of the kind of broad framework proposed by Thompson
et al. [
9] for an operational definition relevant to the less developed countries that have an immediate need to develop quantitative carbon-based forest degradation methods applicable at the landscape level.
Considerable uncertainty remains about the amount of GHG emissions that can be linked to forest degradation and the amount of degraded forest worldwide. It is estimated that around 850 million hectares of tropical forests are degraded [
11]. Depending on how it is defined and what drivers are considered in the analysis, forest degradation was estimated to represent a wide range of between 10% and 40% of the 1.4 PgC y
−1 of the estimated net carbon emissions from tropical forests between 1990 and 2010 [
12]. By analysing regional-scale emissions derived only from wildfires and unsustainable logging, several other studies have estimated values over a similar range between 22% and 57% of the total forest GHG emissions [
13]. These estimates would probably further increase if other degradation processes such as extensive cattle grazing and unsustainable fuel wood collection were also included, indicating that forest degradation could be an even larger source of GHG emissions. These figures must be regarded with some scepticism; mainly because the methodology used by individual countries to calculate area of forest degradation varies greatly. Also, most countries have very poor data on carbon stocks, as few have carried out systematic national forest inventories on a regular basis.
Even though its contribution to GHG emissions is probably substantial, degradation has implicitly been held to be of secondary importance compared with deforestation and most early REDD+ projects have focused on avoiding deforestation [
14]. In general, deforestation and forest degradation result from very distinct drivers, and are brought about by different groups of actors [
15]. Typically, deforestation occurs when a single actor makes a conscious decision to change forest to another land use. While it is wrong to make an inherent link between logging and degradation (as there is evidenced that planned forest management using reduced-impact logging recover carbon and will reduce carbon emissions [
16,
17]), degradation does often result from poorly regulated or managed logging or other unregulated extractive activity often carried out at a small-scale by many actors. In the context of REDD+ degradation has been grouped together with deforestation, but in terms of monitoring it has more features in common other “within-forest” activities (sustainable forest management and enhancement of forest C stocks) [
18]. In some cases degradation and deforestation are causally linked, e.g., creation of access routes for either illegal or legal timber extraction can increase the probability of subsequent deforestation through conversion of forest to agricultural land.
The availability of forest monitoring methods suitable to assess forest degradation is especially critical in certain countries. For instance, Mexico has experienced a much reduced deforestation rate during the last five years but has very high levels of human disturbance in its forests. The field survey of the National Forest Inventory of Mexico records indicators of human or natural disturbance for each plot in the field (e.g., stem damage due to fire, presence of tree stumps, grazing, illegal logging). In a simple analysis of these data we have found that a very high proportion of the inventory plots (70%–80%) do have one or more of these disturbance indicators recorded. Although this does not provide a reliable quantification of the intensity or extent of degradation, it does provide evidence of how important it is for countries such as Mexico to monitor forest degradation. As forest degradation may contribute an increasing proportion of net GHG emissions from forest land there is an urgent need for the development of operational approaches to quantify degradation for incorporation into REDD+ schemes. This will depend on having an unambiguous and operational definition of degradation based on measurable indicators. However, it has proven extremely difficult to find a definition that meets this criterion and that is appropriate to different geographical scales, as well as satisfying the perspectives and needs of different actors [
3].
This paper therefore aims to advance the definition and measurement of forest degradation within the context of the REDD+ discussions, following three main ideas:
Assessing the gap between international discourse on forest degradation and the practicalities involved in monitoring it at national and local levels.
Identifying the key elements that are necessary to assess forest degradation in both the national and the local contexts.
Proposing a new framework for the operationalization of a definition and quantification approach to forest degradation at a local level for early REDD+ projects and for national REDD+ programmes.
The approach taken in this study is first to examine the reasons why forest degradation has not yet been clearly defined and how this contributes to the considerable difficulties in finding adequate methods to measure it (
Section 2). After reviewing the international attempts at reaching a definition, in
Section 3, we take the case of Mexico and discuss what is possible both for definition and measurement of degradation (
Section 4 and
Section 5), summarising our conclusions in
Section 6.
2. The Challenges Involved in Defining Forest Degradation
The absence of agreed definitions and clear criteria hinders global capacity for REDD+ policy and project development, as countries have not been able to assess the area of degraded forest or the level of its degradation in consistent ways. There are a number of reasons for the difficulties in adopting clear and consistent definitions, including the differences in perspectives and management goals amongst actors, the challenge of defining the counter-factual (what would the biomass density be if the forest were not degraded) when the natural condition and dynamics of forest ecosystems are so variable, and human disturbance impacts on forest vary so much in their intensity, spatial extent and frequency. An underlying challenge is the fact that ecosystems vary greatly in their capacity to recover to a pre-disturbance state, and complex transitions occur throughout the disturbance phases [
19].
2.1. Forest Degradation Can Only Be Defined Relative to a Benchmark
An assessment of forest degradation necessarily implies a comparison, either with a previous state or with a contemporaneous reference condition (a benchmark), as proposed by Thompson
et al. [
9]. The first is analogous to standard measures of deforestation that compare forest cover at the end of a period with that at the beginning. However, in a practical project context, it is very rare that data are available of earlier biomass stock levels, or the condition of the forest during a previous period or before any human impacts took place. In the case of comparison with a contemporaneous benchmark, the problem for degradation assessment is to define, identify and measure an appropriate benchmark or reference condition; a challenge directly analogous to that faced in ecological restoration or when trying to determine the degree of “naturalness“ of managed forests.
There is a lot of subjectivity and assumptions in the use of concepts such as “natural”, “primary”, “intact”, “pristine” or “virgin” forests, all of which are associated with the concept of a reference condition [
20]. For example, Cadman [
4] proposed using “intact forest” as the reference (for any given ecotype/species mix), in which case any forest that has a carbon stock lower than that of “intact forest” should be considered degraded. However, use of this term does nothing to solve the fundamental problem of defining which forest falls within this category: in reality there are huge natural spatial and temporal variations in carbon stocks within forests in the same region or landscape, linked to differences in structure, productivity and species composition, due to variation in biophysical conditions (hydrology, soil,
etc.) and long-term natural, as well as anthropogenic, disturbance regimes. In addition such terms as “naturalness” or “intact” are likely to be very difficult to apply in practice: they have been a highly contested concepts, with some observers arguing that none of the world’s forests are natural (on the basis that all global forest has a history of human influence to a greater or lesser degree [
21]). It seems very unlikely that adequate agreement could be reached about which indicators or thresholds should be used to define whether a given area of forest should be classified as “natural”, “intact” or “primary”.
Definition of reference conditions or benchmarks using more pragmatic criteria needs to be based on understanding of the properties, patterns and processes of forest ecosystems, taking into account their complex dynamics. At a landscape level forests both heavily and lightly influenced by humans exist in a shifting mosaic of patches with variation in species composition, structure and biomass-carbon stocks. To some extent these patches may represent the successive phases of forest stand development [
22] (
Figure 1). An analysis of this mosaic and its land-use history should enable identification of areas that have been least subject to human disturbance for the longest time and which contain patches representing the range of forest development phases including old-growth, which would then be appropriate to use as the reference condition or benchmark. These can then be contrasted with the areas subject to greater human impact. The furthest extreme will be those areas that, while still meeting the criteria of being “forest”, have been most recently subject to intensive or frequent human disturbance and show attributes that depart widely from the benchmark. It is important to recognise that, while this approach assumes that the landscape includes areas with a range of levels of degradation, it does not depend on the least degraded areas being completely free of human impact.
Figure 1.
Forest succession curve (modified from Eckert
et al. [
23]).
Figure 1.
Forest succession curve (modified from Eckert
et al. [
23]).
A requisite for the selection of benchmarks based on chronosequences is to have an indication of the range of natural variation (RONV) of carbon stocks and other forest attributes,
i.e., the range of values that would occur even without major human disturbance. Benchmarks should reflect the variation in potential stocking rates of different non-degraded areas. For example, even within a given vegetation type, sites higher up the slope with thinner soils, and those with an aspect receiving lower rainfall or greater wind exposure, are likely to have lower potential stocking levels than those in sheltered sites at the base of slopes receiving higher rainfall. Once the natural range of variation is known, information on land-use history and degradation agents that are acting locally should be used to classify areas into degradation level categories, and to estimate which areas are gaining or loosing carbon stocks. It is key to understand the processes and landuse history that are acting over the forest, to avoid for example misclassifying areas under reduced impact logging as degraded when compared with the benchmark, when in reality they are areas that are gaining carbon [
17].
The identification of a range of possible values by comparing forest stands over space, is interpreted as corresponding to the changes that may occur in a single stand over time (chronosequence). While this classical approach to research on vegetation succession is subject to serious criticism because of its underlying assumptions (e.g., [
24,
25,
26]), there is good empirical evidence that it can work in tropical forest landscapes (e.g., Chai
et al. [
27]). Even if it depends on potentially unreliable assumptions, as pointed out by Johnson and Miyanishi [
26] and Quesada
et al. [
28], the chronosequence is the most suitable approach for assessing the relation of current forest state and attributes to land use history in the usual situation where long-term monitoring has not been carried out. The relationship is especially strong for basal area and biomass accumulation, as demonstrated by Chazdon
et al. [
25], suggesting its potential usefulness (provided that the assumptions are carefully considered) in assessing and predicting carbon stocks.
In its application, this approach leads to the assumption that there is a convergence of forest condition during the process of recovery: if a degraded area (as shown on the left hand side of the succession curve,
Figure 1) is not further disturbed but allowed to recover naturally, it will eventually store similar amounts of carbon, and be able of delivering the same level of other ecosystem services, as areas of this forest type under similar biophysical conditions that have never been disturbed. While the uncertainty in this assumption must be acknowledged, it may offer the only realistic option to evaluate what carbon sequestration gains will result from elimination or reduction of human practices that are causing biomass loss.
There is likely to be a strong scale-dependency in these applications. While stage of forest recovery can be assessed for a given patch or stand of forest, this is much harder at the scale of a landscape, which will be composed of patches of a wide range of degradation/recovery states. If the landscape is clearly sub-divided into a defined classification system of degradation and recovery states, it would then be possible to use a threshold to classify the landscape as a whole based on the proportion of its patches/area that is in a degraded state. However, there may be a problem with applying the same threshold level between different landscapes. With increasing knowledge of the complex properties of ecosystem dynamics it is clear that forest recovery may not be a linear process over time and landscapes may be subject to regime shifts, following which they may remain in an altered state for a long time [
29]. It is also important to recognise that the process of forest recovery is not simply the inverse of degradation, it may follow a different trajectory (e.g., towards a novel ecosystem state).
2.2. Degradation Is a Process Which Is Best Assessed at the Level of the Landscape
Forest degradation is both a state (“degraded forest”) and a process (“degradation of forest”) [
2], and in reality it can only be assessed adequately over whole landscapes (or series of management units), that could be defined in terms of property boundaries or coherent landscape units, depending on the activities involved. In many tropical areas, much of the forest is in a state of transition as a result of the combination of human activities and natural processes. This means that some areas may be recovering and increasing their carbon stocks, while others are losing them, as a result of cyclical agricultural practices, which include a woody fallow (
i.e., secondary forest) phase or sustainable timber management, or as a result of periodic natural events such as fires. Such mosaics are very common in populated tropical forests [
30]. It is the overall carbon budget of each coherent landscape/management unit that should be assessed, not individual patches of forest within the unit, so that the temporary losses and gains are averaged out.
A wider geographical scale encompassing the range of management activities across the landscape needs to be used to assess whether it is suffering from net degradation, but defining the scale and boundaries of such units is very difficult, as the team charged by the IPCC with defining degradation has reported [
3]. It would require on-the-ground knowledge of the organisation of forest use, specific to each area. It is partly for this reason that Minang and Van Noordwijk have suggested that, not only degradation, but all forest carbon budgeting should be done at a landscape level, in a nested system of MRV) [
31]. In areas dominated by small-scale peasant agriculture, particularly shifting agriculture, where formal property boundaries may be difficult to map, it may make more sense to assess degradation over landscape units that represent the typical agricultural practices; these would be on the order of ±5000 ha [
9]. In areas that are subject to timber extraction (sustainably managed or not), an approach using property or concession boundaries may give a more accurate picture.
2.3. Biomass Loss Is Difficult to Quantify
In strict carbon accounting terms, degradation will only occur in a forest area if its rate of biomass loss is higher than the natural re-growth rate. As is well known, biomass assessment
per se is an inaccurate and imprecise process unless very expensive, detailed inventory is conducted [
32]. Determining loss and re-growth rates is a complex task that requires long-term observations and intensive research which are not usually available in developing countries [
33], or alternatively good statistical records (the “gain-loss” method). Unsustainable selective logging, slash-and-burn agriculture, fuel-wood collection, charcoal extraction and grazing, that are the main activities that induce gradual loss of carbon stocks, vary greatly and render generalizations difficult [
34].
2.4. Fluctuations in Forest Carbon Also Reflect Natural Causes
Tropical forests are dynamic systems, that gain and loose biomass as part of natural cycles driven by disturbance events (fires, storms, floods, droughts and pests
etc.), that makes it difficult to establish strictly which losses are due to the influence of human activities [
18]. During these cycles there will be temporary reduction in carbon stocks that do not imply persistent loss [
35]. However, there can also be positive feedback between natural and anthropogenic disturbances, which can promote further loss of carbon stocks. Establishing whether or not this loss is human-induced is difficult in many cases, for example, there is often a higher frequency of forest fires and increased vulnerability to drought after logging events, related to forest fragmentation [
36]. International negotiations and voluntary markets related to REDD+ will have to deal with the fact that there is an intrinsic level of uncertainty due to such natural causes [
19,
37,
38].
2.5. Gray Areas between Deforestation and Degradation
It is not clear if some effects of human interventions should be considered to be deforestation or forest degradation or a component of normal forest management. For example, if trees are clear-felled but forest immediately starts to regrow, this would generally be classified as degradation. However, if crops are temporarily cultivated and then farming is abandoned, for what length of time would this need to occur before the impact is classified as deforestation? Then, if classified as deforestation, at what point during subsequent secondary forest regrowth would the area be classified as degraded forest? This is an extremely critical point, especially in terms of slash-and-burn agricultural systems, because it seriously affects carbon accounting statistics. Depending on how woody fallow lands are viewed in this regard, forest degradation may account for anything between 10% and 40% of forest carbon emissions, while deforestation will represent between 10% and 90% [
12]. If an area is defined as deforested only if it remains without trees for at least 20 years, then a great deal of what has been labelled “deforestation” should instead be categorised as “degradation”.
2.6. Lack of Historical Data on Forest Carbon Stocks for Baselines
In order to evaluate possible reduction in GHG emissions both for deforestation and forest degradation, a baseline is required. A baseline or reference emissions level (REL) is built on rates of degradation (and deforestation) over a given historical period against which emissions due to future degradation can be compared. To build a baseline both emission factors (which for REDD+ are estimated as the amount of carbon that is lost per hectare per year as a result of degradation [
3]) and activity data (
i.e., the area that is affected by degradation and changes in this area over time) are needed.
In the case of deforestation, emission factors are calculated by assessing the total carbon stock per hectare that would be lost, in one go, if the area were deforested. With degradation, estimation of the emission factors is more complicated, as illustrated in recent work by Pearson
et al. [
39] that developed an accounting method to estimate emission factors from selective logging of tropical forests. To this complexity, it must be added that baselines will require knowledge of the past annual rate of loss of carbon stock due to degradation in any given forest (e.g., in tonnes per hectare per year), so that the reduction due to the corresponding REDD+ activities can be compared with this.
Although significant advances have been achieved (see for current status of methods [
32,
33,
40]), determining activity data for degradation remains challenging, as explained in the next Section.
2.7. The Capability of Remote Sensing for Detection of Forest Degradation Is Limited
Methods have long been developed using remote sensing to classify forest cover change between forest and non forest at a large scale, as for example required for reporting to the FAO’s decadal Forest Resources Assessment. There has been no comparable development of methods to meet the greater challenge of quantifying forest degradation, and this inertia has led institutions to stick to the tried-and-tested approach of basing forest change assessments solely on deforestation. The spatial extent of degradation, and thus the rate of its expansion, is much more difficult to observe than deforestation using remote sensing data [
40]. It is particularly challenging to detect the intensity of degradation at any given point and assess the rate at which forests are losing carbon. Optical remote sensing faces a fundamental problem, that is that changes in canopy cover are not a direct measure of total biomass, or of degradation that is occurring to the forest below the canopy surface level (e.g., fuelwood collection or grazing) [
41,
42]. Important advances have been made in detecting the area impacted by selective logging in the Brazilian Amazon, by means of spectral mixture analysis (SMA) e.g., [
43,
44]. This method allows detection of canopy damage by assessing the combination of green vegetation, soil and non-photosynthetic vegetation found in each pixel. However, such studies have mostly been performed in Brazil on relatively flat and extensive terrain, with logging predominantly carried out at an intensity of 10–40 m
3 ha
−1. Such conditions strongly enhance the detectability of the signal, and the success of these techniques where logging has occurred in more topographically complex terrain or in other types of forests, with less uniform canopy or with a more patchy or diffuse pattern has not been demonstrated.
A further constraint with low frequency monitoring using these optical remote sensing methods is that the kind of activities that cause detectible changes to the canopy cover, e.g., selective logging, may be missed or under-estimated if the resulting canopy gaps are rapidly filled within a few years (at least in part) by in-growth of the canopies of the adjacent trees or recovery of a lower stature of canopy through natural regeneration (but without full recovery to previous biomass levels, which will take several decades). Calculating degradation based on area estimates of logging or other degradation activity may also lead to underestimates since tree density change might exceed area change [
45]. Monitoring systems need to take such factors into account, e.g., in terms of their frequency. Integrating optical remote sensing with lidar (which is discussed in
Section 4.1.3) has produced interesting results; however its cost is currently prohibitive. None of these remote sensing methods will meet the degradation monitoring need without having sufficient ground data and information on the historical context.
3. Definitions of Forest Degradation in the International Context
A pre-requisite to defining forest degradation in the international context is an accepted definition of “forest”. There are many (hundreds of) forest definitions [
46], in part because of the wide range of purposes for which they are designed, from administrative-legal to land use planning, forest cover monitoring, biodiversity conservation and carbon budgeting [
5,
40]. What should and should not be considered to be a forest is controversial [
47]. International organizations have produced a series of definitions to meet their own needs, and individual countries and institutions have adjusted definitions to their specific interests as illustrated by the case of Mexico in
Table 1.
Table 1.
Forest attributes used to define what is classified as “Forest” by relevant international policy bodies and Mexican national entities.
Table 1.
Forest attributes used to define what is classified as “Forest” by relevant international policy bodies and Mexican national entities.
| Institution | Minimum crown cover (%) | Minimum area (ha) | Minimum height (m) | Species/Vegetation type |
|---|
| IPCC GHG for land use, land-use change and forestry (LULUCF) | Countries can decide on a threshold between 10%–30% (or similar stocking level) at maturity. | ≥0.05–1.0 | Countries can decide on a value above ≥2–5 (at maturity in situ) | Includes closed or open forest, young natural stands and forest plantations that have the potential to reach 2–5 m Includes harvested forest that is below 10%–30% canopy cover where they are considered to be temporarily unstocked. |
| FAO | ≥10% (at maturity) | ≥0.5 | ≥5 (at maturity in situ) | Does not include areas predominantly under “non-forest” land use such as agriculture or urban |
| CBD- Convention for Biological Diversity | ≥10% | ≥0.5 | ≥5 | Only includes “natural” forest. Excludes areas under “non-forest” land use such as agriculture |
| Mexico (under the Kyoto Protocol) | ≥30% | ≥1.0 | ≥4 | Includes agricultural land and tree plantations |
| INEGI-Mexican National Institute of Statistics and Geography | >10% | ≥25 (medium resolution, most of the country) ≥1.6 (area detectable using high resolution) | Not specified | Not clearly specified |
| CONAFOR-Mexican National Forestry Commission | >10% (at maturity) | ≥0.5 | >5 | Excludes trees in agricultural lands, parks and gardens |
Most countries, for purposes of international agreements, follow the FAO definition [
1]. In this, forests are defined on the basis of thresholds values for three quantitative criteria: crown cover, area and height, all of which can be related to biomass and carbon stocks. However, the reference area to measure such criteria, mainly canopy cover, is usually not defined which results in major uncertainty in forest cover estimates [
48]. Another problem with thresholds is that some tree-dominated land uses are classified as forest whereas others are classified as non-forest, through the application of commodity-based definitions of “land use” by FAO and other organisations. Thus tree plantations whose primary use is timber are classified as forest; but tree plantations whose primary use is harvesting of fruit (e.g., orchards or oil palm) are classified as non-forest, even though there may be no biophysical difference between these types of plantation. In the case of agroforestry systems, which involve joint production of timber and agricultural products, the classification by land use is particularly arbitrary. For the purposes of REDD+ there has been controversy about whether the increase in carbon stocks in such agroforestry systems, e.g., planting of shade trees, should be eligible for credits or not, and therefore whether increases in trees in such systems should count as a reduction in forest degradation. As a further complication, actions that increase the agricultural productivity of agroforestry systems can contribute positively to REDD+ by reducing pressure for additional deforestation to increase agricultural land area [
49]. There are many other examples of such grey areas about what should be classified as forest under REDD+ (and therefore would need to be monitored for degradation), that have not yet been resolved.
It is evident that improvements in the clarity and completeness of forest definitions are needed in the context of international climate change mitigation programmes because this has a major impact on the estimation of the areas that are reported as deforested or degraded [
50]. The same holds for defining forest degradation. As we explained in
Section 2.2, there is no easy way of fixing temporal or spatial criteria for degradation without specific reference to individual management units. The result is that it is generally agreed among parties that for the purposes of climate change mitigation, forest degradation simply involves lowering of carbon stocks in forests, in areas that are classified as forests [
1].
Definitions of degradation used by the major agencies involved in REDD+, however, vary widely (
Table 2). At one extreme the Convention for Biological Diversity (CBD) considers loss of biodiversity as the main sign of degradation. At the other end of the scale organizations directly concerned with carbon crediting systems (such as Voluntary Carbon Standard (VCS) and UNFCCC) favour definitions based solely on carbon stock loss. This relates to the need for a water-tight accounting system if credits are to be marketed. A possible resolution to this difficulty may be provided by the promulgation of “safeguards” tailored to the requirements of REDD+. Safeguards have received considerable attention in recent negotiations in response to concerns that other environmental and social values might be sacrificed to maximise carbon values. Conditions might be introduced such that degradation may be officially defined in terms of carbon loss, but credits would not be issued if there is evidence that there have been large biodiversity losses (or negative social impacts) associated with REDD+ interventions. This does not, however, resolve the problem of whether the definition of degradation should be based solely on carbon loss, or also include some reference to the "naturalness" of the forest [
7], which in the end is largely a political decision.
Table 2.
Definitions of forest degradation proposed by relevant international policy bodies concerned with forestry.
Table 2.
Definitions of forest degradation proposed by relevant international policy bodies concerned with forestry.
| Agency | Definition | Source | Main focus |
|---|
| FAO | Reduction in the capacity of forest to provide goods and services | FAO 2002 & FAO 2008 | Ecosystem services approach |
| SBSTA/UNFCCC workshop on defining and measuring degradation for REDD | Proposal that degradation should be defined in terms of comparison with intact forest of the same vegetation type: “Forest degradation is the reduction of the carbon stock in a natural forest, compared with its natural carbon carrying capacity, due to the impact of all human land-use activities”. | Cadman (2008/2009) | Carbon content |
| IPCC | A direct human-induced long-term loss (persisting for X years or more) of at least Y% of forest carbon stocks (and forest values) since time T and not qualifying as deforestation or an elected activity under Article 3.4 of the Kyoto Protocol 1 | IPCC 2003a. | Carbon content |
| ITTO | Long-term reduction of the overall potential supply of benefits from the forest, including wood, biodiversity and other products or services. Also, a direct human-induced loss of forest values (particularly carbon), likely to be characterized by a reduction of tree crown cover. Routine management from which crown cover will recover within the normal cycle of forest management operations is not included. | ITTO 2002
ITTO 2005 | Ecosystem services |
| CAN | From a climate change perspective, forest degradation needs to be defined to include the impact of all human land-use activity that reduces the current carbon stock in a natural forest compared with its natural carbon carrying capacity. | Mackey et al. [51] | Carbon content |
| VCS | The persistent reduction of canopy cover and/or carbon stocks in a forest due to human activities such as animal grazing, fuelwood extraction, timber removal or other such activities, but which does not result in the conversion of forest to non-forest land (which would be classified as deforestation), and falls under the IPCC 2003 Good Practice Guidance land category of “forest remaining forest”. | VCS 2011 | Carbon content |
4. Definitions of Forest Degradation for Mexico
In Mexico, as mentioned above, a large part of both the temperate and the tropical forests appears to be, to a greater or lesser extent, degraded. Much of the degradation is the result of unsustainable extraction of wood products, shortening of slash-and-burn cycles, and allowing cattle to graze within the forests. These drivers of degradation typically result in a landscape mosaic in which part of the forest area has lost biomass stock, part is depleted but stable, and other parts are recovering their biomass stocks, with the net result that the landscape’s average stock is at levels below those expected in forests undisturbed by human uses.
Mexico has adopted the agreements and definitions established by FAO in the context of the Kyoto protocol, but has also made important advances towards developing a legal framework to regulate climate change related activities, including those in the forestry sector. In this context two different regulatory frameworks have proposed definitions relating to forest degradation: the Law on Climate Change and the Law on Sustainable Development of Forests [
53,
54].
Both of these laws refer to forest degradation as a reduction in delivery of ecosystem services, however, the Climate Change Law only refers clearly to carbon sequestration services in relation to a reference value that reflects conditions in areas where no human interventions have occurred. On the other hand, the amendments to the Sustainable Development of Forests Law, which were made in the same year, present a wider view, referring to a reduction in the capacity to deliver ecosystem services, which is likely to be more difficult to measure and evaluate. To our knowledge, there have as yet been no challenges to this inconsistency in definitions, and we therefore have to assume that for purposes of reporting to UNFCCC, Mexico will apply the definition made in the Climate Change Law. There are, however, also inconsistencies relating to other aspects of the Mexican definition of forests and degradation, which we consider in discussing the operationalization of the degradation element of REDD+ below.
4.1. Elements to Be Considered in the Definition and Measurement of Forest Degradation in Mexico
4.1.1. The Canopy Cover Element in the Definition of Forest
As noted
Section 3, UNFCCC requires a definition of forest that relies on threshold values, of which canopy cover is the key element. The choice of a threshold value for canopy cover will, to a large extent, determine which areas in Mexico are allowed to participate in REDD+ activities. Mexican forest law states that a vegetation type is considered forest until the point at which it falls below a tree canopy cover threshold of 10%, while, for the purposes of the Kyoto Protocol, it has adopted a 30% canopy cover threshold. This was probably to enable the promotion of CDM projects, which can only be carried out in areas which are not forest. This difference in definitions has so far not been resolved and it is not clear which one will pertain for the case of REDD+.
In the context of REDD+, however, the definition of canopy cover threshold has important implications [
50]. If Mexico assumes a 30% threshold, any open forests and woody vegetation formations with canopy cover below this level (such as matorrales (scrubland)) would be ineligible. By the same reasoning, clearance of such open formations would not be counted as deforestation, and loss of biomass density within them would not be counted as degradation, against the national reference emissions level. A key question in this regard is whether areas that currently have a tree canopy cover between 10% and 30% do so as a result of past degradation processes (which could perhaps be reversed) or as a result of natural ecological characteristics. This has important implications for the selection of the minimum canopy cover threshold for REDD+. It would be important first to consider whether low carbon density ecological zones such as the matorrales offer any real opportunities to increase Mexico’s carbon stocks. Because of the cost of monitoring land areas for carbon stock changes in national REDD+ inventories it would be efficient to exclude from the forest definition those ecosystems with low potential for loss or gain in carbon stocks associated with changes in tree canopy cover. However, for the case of degraded ecosystems that currently have a low tree canopy cover, but have good potential for increase in carbon stocks through project interventions (e.g., tree planting or forest protection) it would be useful to include them within the forest definition so that such projects can be monitored as part of the REDD+ process. Additional information on the rate of potential carbon stock gains and monitoring costs is required to assess this trade-off. If areas with canopy cover down to 10% are included in the area to be monitored for REDD+ this would approximately double the area to be monitored compared with a minimum threshold of 30%. Knowledge of the proportion of total project costs comprised by monitoring [
55] would then enable calculation of what value from carbon stock gain from these areas would be required to generate a net benefit. It may well be that some ecosystems with 10%–30% tree canopy cover are in biodiversity hotspots and should in any case be protected for that reason, but it is questionable whether REDD+ is the most appropriate instrument to do this.
4.1.2. The Area Element and the Estimation of Degradation Activity Data
In Mexico, as in many other countries, there is a mismatch between what area is actually observed and what is defined as forest by law. At a national scale and on an annual basis, forest areas are mapped based on coarse resolution images (
i.e., MODIS). This implies that the minimum area that can be identified is 6.25 ha, which is validated with mid-resolution imagery (
i.e., Landsat or SPOT) [
56]. The minimum forest area defined by law (1 ha,
Table 1) cannot therefore be observed using this technology, although with the use of high resolution images, the area observable could be brought down to 0.5 ha [
57]. When resolution is increased, the forest loss estimates may change significantly. For example, when comparing deforestation estimates between 1993 and 2010 derived from mid-resolution Landsat data with aerial photos for 2003 and high resolution SPOT 5 images for 2007 in a small area in Northwestern Mexico, the estimates of deforested area were increased by a factor of three, because many smaller patches of forest clearance could be seen when using higher resolution technology [
58]. The same general effect will hold for estimates of areas that are degraded. However, use of higher resolution technology implies much higher costs, not only for the images but for the skilled work in analysis [
59].
In the near future, a finer scale approach may be feasible using very high resolution images such as those from the RapidEye satellite, because Mexico, through its National Commission for Knowledge and Use of Biodiversity (CONABIO), has recently obtained full national coverage for 2010 and 2011. It is expected that with the higher spatial resolution of RapidEye data (>6.5 m) it will be possible to map areas where canopy cover is increasing or decreasing (
i.e., to obtain the activity data for degradation) [
60,
61]. Mexico plans to continue to receive updated RapidEye image data (
http://www.blackbridge.com/rapideye/), but it will be at least 10 years before enough images are acquired in order to be able to construct baselines at a national scale for changes in area of deforestation and degradation [
62]. Thus in the short term, Landsat, in combination with MODIS and SPOT, will continue to be the backbone of national monitoring systems for land cover change detection, since it provides data over the last four decades at medium resolution and is relatively cheap [
63]. This means that, for the time being, the
de facto minimum measurable unit that could potentially be used in the construction of a baseline for change in area of degradation will be based on pixel spatial resolution over a range of 10–250 m, that is probably too coarse to detect most degradation activities. Although interesting results have been achieved for the impacts of logging and fires in rainforest by combining different remote sensing data sources [
13,
44,
60,
64], it is still challenging to identify and estimate the areas of forest that are losing carbon stocks due to other types of degradation, such as slash-and-burn agriculture, grazing within the forest, and extraction of fencing poles and fuelwood, which are the most common causes of degradation in Mexico [
17,
65]. Considerable uncertainty remains in assessing activity data on forest degradation due to activities that do not produce obvious changes on canopy cover [
66].
Despite the spatial limitations of image data, several attempts have been made to assess activity data for forest degradation in Mexico. In the past, for the purposes of reporting greenhouse gas inventories, the amount of secondary forests was equated to the amount of degraded forest land, based on land cover maps derived from Landsat imagery [
67]. Apart from the fact that identification of secondary forest from such images is difficult, such that misclassifications are common, this procedure is flawed on several counts: first, it assumes that there is no change in carbon stocks within the forest classified as non-secondary (
i.e., “primary”) that remain classified as primary (which is unlikely), and secondly it implies that stocks are permanently decreased in secondary forest. Following the classification made by ITTO [
11] secondary forest (we used the term secondary forests here, with the meaning that is commonly used in Latin America) usually results from clear felling of “primary” forest or other degraded forest, followed by natural regeneration; in which case the secondary forests are actually increasing in stock (unless subject to a severe on-going disturbance regime), and under REDD+, should be accounted as “re-growth” or “forest enhancement”. Meneses-Tovar [
56] attempted to define the areal extent of forest degradation in Mexico using the changes in NDVI from low resolution imagery (500 × 500 m MODIS data) and the plots from the National Forest Inventory. This work first obtained an average NDVI value over a five year period (2000–2005) for each vegetation type to derive a regression model using the above-ground biomass values from more than 15,000 National Forest Inventory Plots. Dry season (15 February–15 April) NDVI values for subsequent years were calculated for each plot. An increase, decrease or stable value of the dry NDVI was associated with biomass gains or loss. Although this study was valuable for establishing trends that helped understanding which plots have suffered biomass loss or gains and where these areas were located, due to its coarse spatial resolution it does not allow a proper quantification of biomass change nor to establish if these losses were due to human-related activities.
Bonilla-Moheno
et al. [
68] used the EVI (enhanced vegetation index) derived from MODIS (at 250 m resolution) to assess biomass losses at the level of municipalities in Mexico [
68]. However, although time series comparison of these indices allowed the identification of broad areas with reduced biomass levels, the resolution level is coarse (too coarse to superimpose an overlay for management units, for example). Moreover, it is not possible to distinguish clearly losses that are due to degradation from those that are due to deforestation, nor to directly quantify the biomass changes involved.
Other efforts have been made with medium spatial image resolution to make the quantification on the basis of changes in canopy cover. Velazquez
et al. [
57] proposed the definition of areas subjected to degradation in Mexico as those in which tree canopy cover had dropped by more than 30%, e.g., from 70% to 40% [
57], simply because this is the minimum which they felt could be reliably detected using a sequential series of Landsat images. However, the difference in biomass levels between a forest with 70% cover and one with 40% is huge. If degradation is to be included in REDD+, a much finer approach would be needed.
4.1.3. The Ability to Detect Changes in Biomass Stocks over Time and Data Availability for Baseline
As explained in
Section 2.6, there is a lack of historical data for forest degradation on emissions factors (losses of biomass per hectare overtime). It is doubtful whether the losses of biomass per hectare over time (emissions factors) due to forest degradation can be accurately quantified solely using optical or radar remote sensing, even with high resolution data, since optical data do not measure biomass directly and tend to saturate on high biomass ecosystems [
69,
70]. The same would hold for aerial photos, even high resolution photos taken from low flying unmanned aircraft (UAVs).
Recently, however, the remote sensing field has seen advances in assessing AGB by combining different types of optical sensors with lidar and/or radar data, which are able to sense and record forest structure metrics (e.g., maximum canopy height) and penetrate both cloud and canopy cover. Such surveys have been made at a national level for relatively small countries (e.g., Panama) with a high level of accuracy [
71] and allow quantification of a reference level of forest carbon stocks. This offers great potential for future monitoring of stock level change, although carrying this out for large areas of forest would be very expensive with current technology [
59].
Mexico would, ideally, need to carry out regular lidar surveys in combination with intensive field sampling to calibrate the lidar data in order to assess changes in carbon stocks. The costs of such a monitoring system will be large, but need to be compared with the benefit of improved assessment not only of changes in carbon stock, but also for other ecosystem services that could be linked to this remote sensing data. However, it will be many years before enough data are generated to create a credible baseline or reference emissions level, and therefore before carbon credits could be claimed for avoided or reduced degradation on this basis.
The best current approach to gathering adequate emissions factor data would be to base biomass density assessments largely on ground-level measurements that can later be used to analyze remote sensing data. Mexico has a well developed framework for monitoring its forest resources. The National Forest Inventory is based on about 23,000 permanent plots, set out on a regular grid of 5 km across all forests in the country, i.e., an average of one plot per 2500 ha of forest. The plots are sampled once every five years and provide invaluable data on the forest attributes, structure, composition and state of the different types of forest at a national level. When averaged over whole ecosystems, these data provide a good picture of national trends of losses and gains of biomass within forests, and set the distribution of biomass values that occur in each eco-zone. However, the Inventory does not provide sufficient data to gain a definitive picture of degradation at local (landscape) levels. For this, much more intensive ground-level survey work would be needed.
5. Operationalizing the Assessment of Degradation at the Landscape Level
5.1. Use of Local Forest Inventories
In areas where REDD+ pilot actions will be implemented intense monitoring will be required to access their impact [
18]. Accounting for carbon emissions coming from forest degradation could require methods that are extremely time consuming and complicated, especially those related to timber harvesting as explained in Griscom
et al. [
72] and Pearson
et al. [
39]. Such detailed accounting, though desirable, will not be feasible to implement at a landscape level at different sites across the country, because it requires a high level of expertise. However, the results of local forest inventories done by communities have proved to be of comparable quality to those done by experts [
65] and could be used to assess forest degradation.
Forest owners could be expected to carry out regular ground-level surveys of biomass stock in the forests which they register under the REDD+ programme; monitoring could be considered as part of the management requirements. In Mexico, around 59% of all forest is owned by
ejidos (communal agrarian settlements) or communities [
73], and is (at least in principle) managed communally; most of the remainder is in the hands of small property owners. It is hoped that the management practices they would need to follow under REDD+ would first reduce rates of degradation and then reverse them as forest enhancement takes place. Therefore, these surveys need to be designed to enable a sufficiently accurate assessment of the levels of degradation and enhancement within the property boundaries to quantify these management effects as a basis for reporting and payments. To enable this, communities and other land owners participating in REDD+ activities could be trained to carry out simplified forest surveys of aboveground biomass. Several projects, such as “Kyoto: Think Global, Act Local” [
74] have provided data and experienced to developed detailed field manuals (e.g., Honorio
et al. [
75], GOFC-GOLD [
40]) on how to design surveys and which variables to measure to assess forest resources, however there also need to be mechanisms to verify the resulting data [
76,
77]. Such extensive community-based monitoring would give a much denser coverage of data than is currently available from the National Forest Inventory, and enable an analysis at the level of management units, of which areas are losing carbon stocks, which are degraded but stable and which areas are gaining stocks (
Table 3).
Table 3.
Suggested activities under REDD+ appropriate to counter different phases of forest degradation.
Table 3.
Suggested activities under REDD+ appropriate to counter different phases of forest degradation.
| Category | Process | REDD + Mitigation aim | Means of achieving this goal |
|---|
| Degrading | Losing biomass and carbon annually due to human activities in which extraction or loss exceeds natural growth rates | Avoid further degradation
When this is achieved, forest enhancement | Sustainable forest management, conservation, extended slash-and-burn cycles (especially woody fallow phase), restriction of off-take of different forest products, e.g., through quotas, removal of cattle. |
| Degraded but stable | With a low level of carbon, but small rate of losses or gains | Forest enhancement | Possibly through replanting if insufficient soil seed bank, seed rain or root stock exists for natural regeneration or sprouting. Fencing, removal of cattle. |
| Degraded or deforested but already recovering naturally | Forest regrowth or secondary succession. | In principle, this may not be credited under REDD+ because it is occurring naturally (it is not additional). However, rate of C accumulation may be increased through additional REDD+ measures | Stimulate faster regrowth by forest protection from further disturbance, eliminating sources of loss, enrichment planting etc. |
At a national level, this information would not only be useful to assess current emission rates, but also to help determine the relative success of different REDD+ interventions in reducing emissions, because it can be directly linked to the drivers. Ground surveys could include information on land use history and the current use, such as amount of cattle, unsustainable logging or estimates of fuelwood collection, which could improve knowledge of the relationship between human activities and the observed biomass in an area. In addition to quantifying carbon stocks, ground surveys have the potential to inform national policy on the state of other ecosystems services that are lost when forests become degraded.
Although it may be many years before the entire forest area of Mexico is included under REDD+ (since participation is voluntary) such local surveys would strongly reinforce knowledge about biomass stock levels and how they are changing as a result of REDD+, both at the local and, when summed, at the national level. Given adequate quality filters, local inventories could also serve as ground truth data for remote sensing analysis that will in turn reduce the uncertainty of the carbon estimates at regional and national levels. The combination of local inventories with high resolution remote sensing or lidar could help to develop a nested national MRV system. There is, however, no way that a historical baseline or reference emission level for degradation could be developed from these contemporary data. Rather, their value would be in creating the baseline for future assessment of carbon stock changes and calculation of resulting carbon credits. Given that such a large proportion of Mexico’s forests are degraded, this “room-to-grow” may in reality be the country’s greatest opportunity for carbon crediting under REDD+.
This kind of community-based “bottom-up” analysis of forest degradation would greatly benefit from the establishment of benchmarks which provide locally relevant indicators of carbon stocks for natural forest and forest under different conditions of contemporary or previous use and disturbance which lead to degradation of carbon stocks.
5.2. The Benchmark Approach
As described in more detailed in
Section 2.2, we propose that a degradation scale could be made for regions that are relatively homogeneous in terms of natural ecosystem, biophysical conditions and land use, using a chronosequence approach. A gradient from least-degraded areas (the benchmark) to highly disturbed sites, with some range of uncertainty for each level can be established (as illustrated for two contrasting cases in
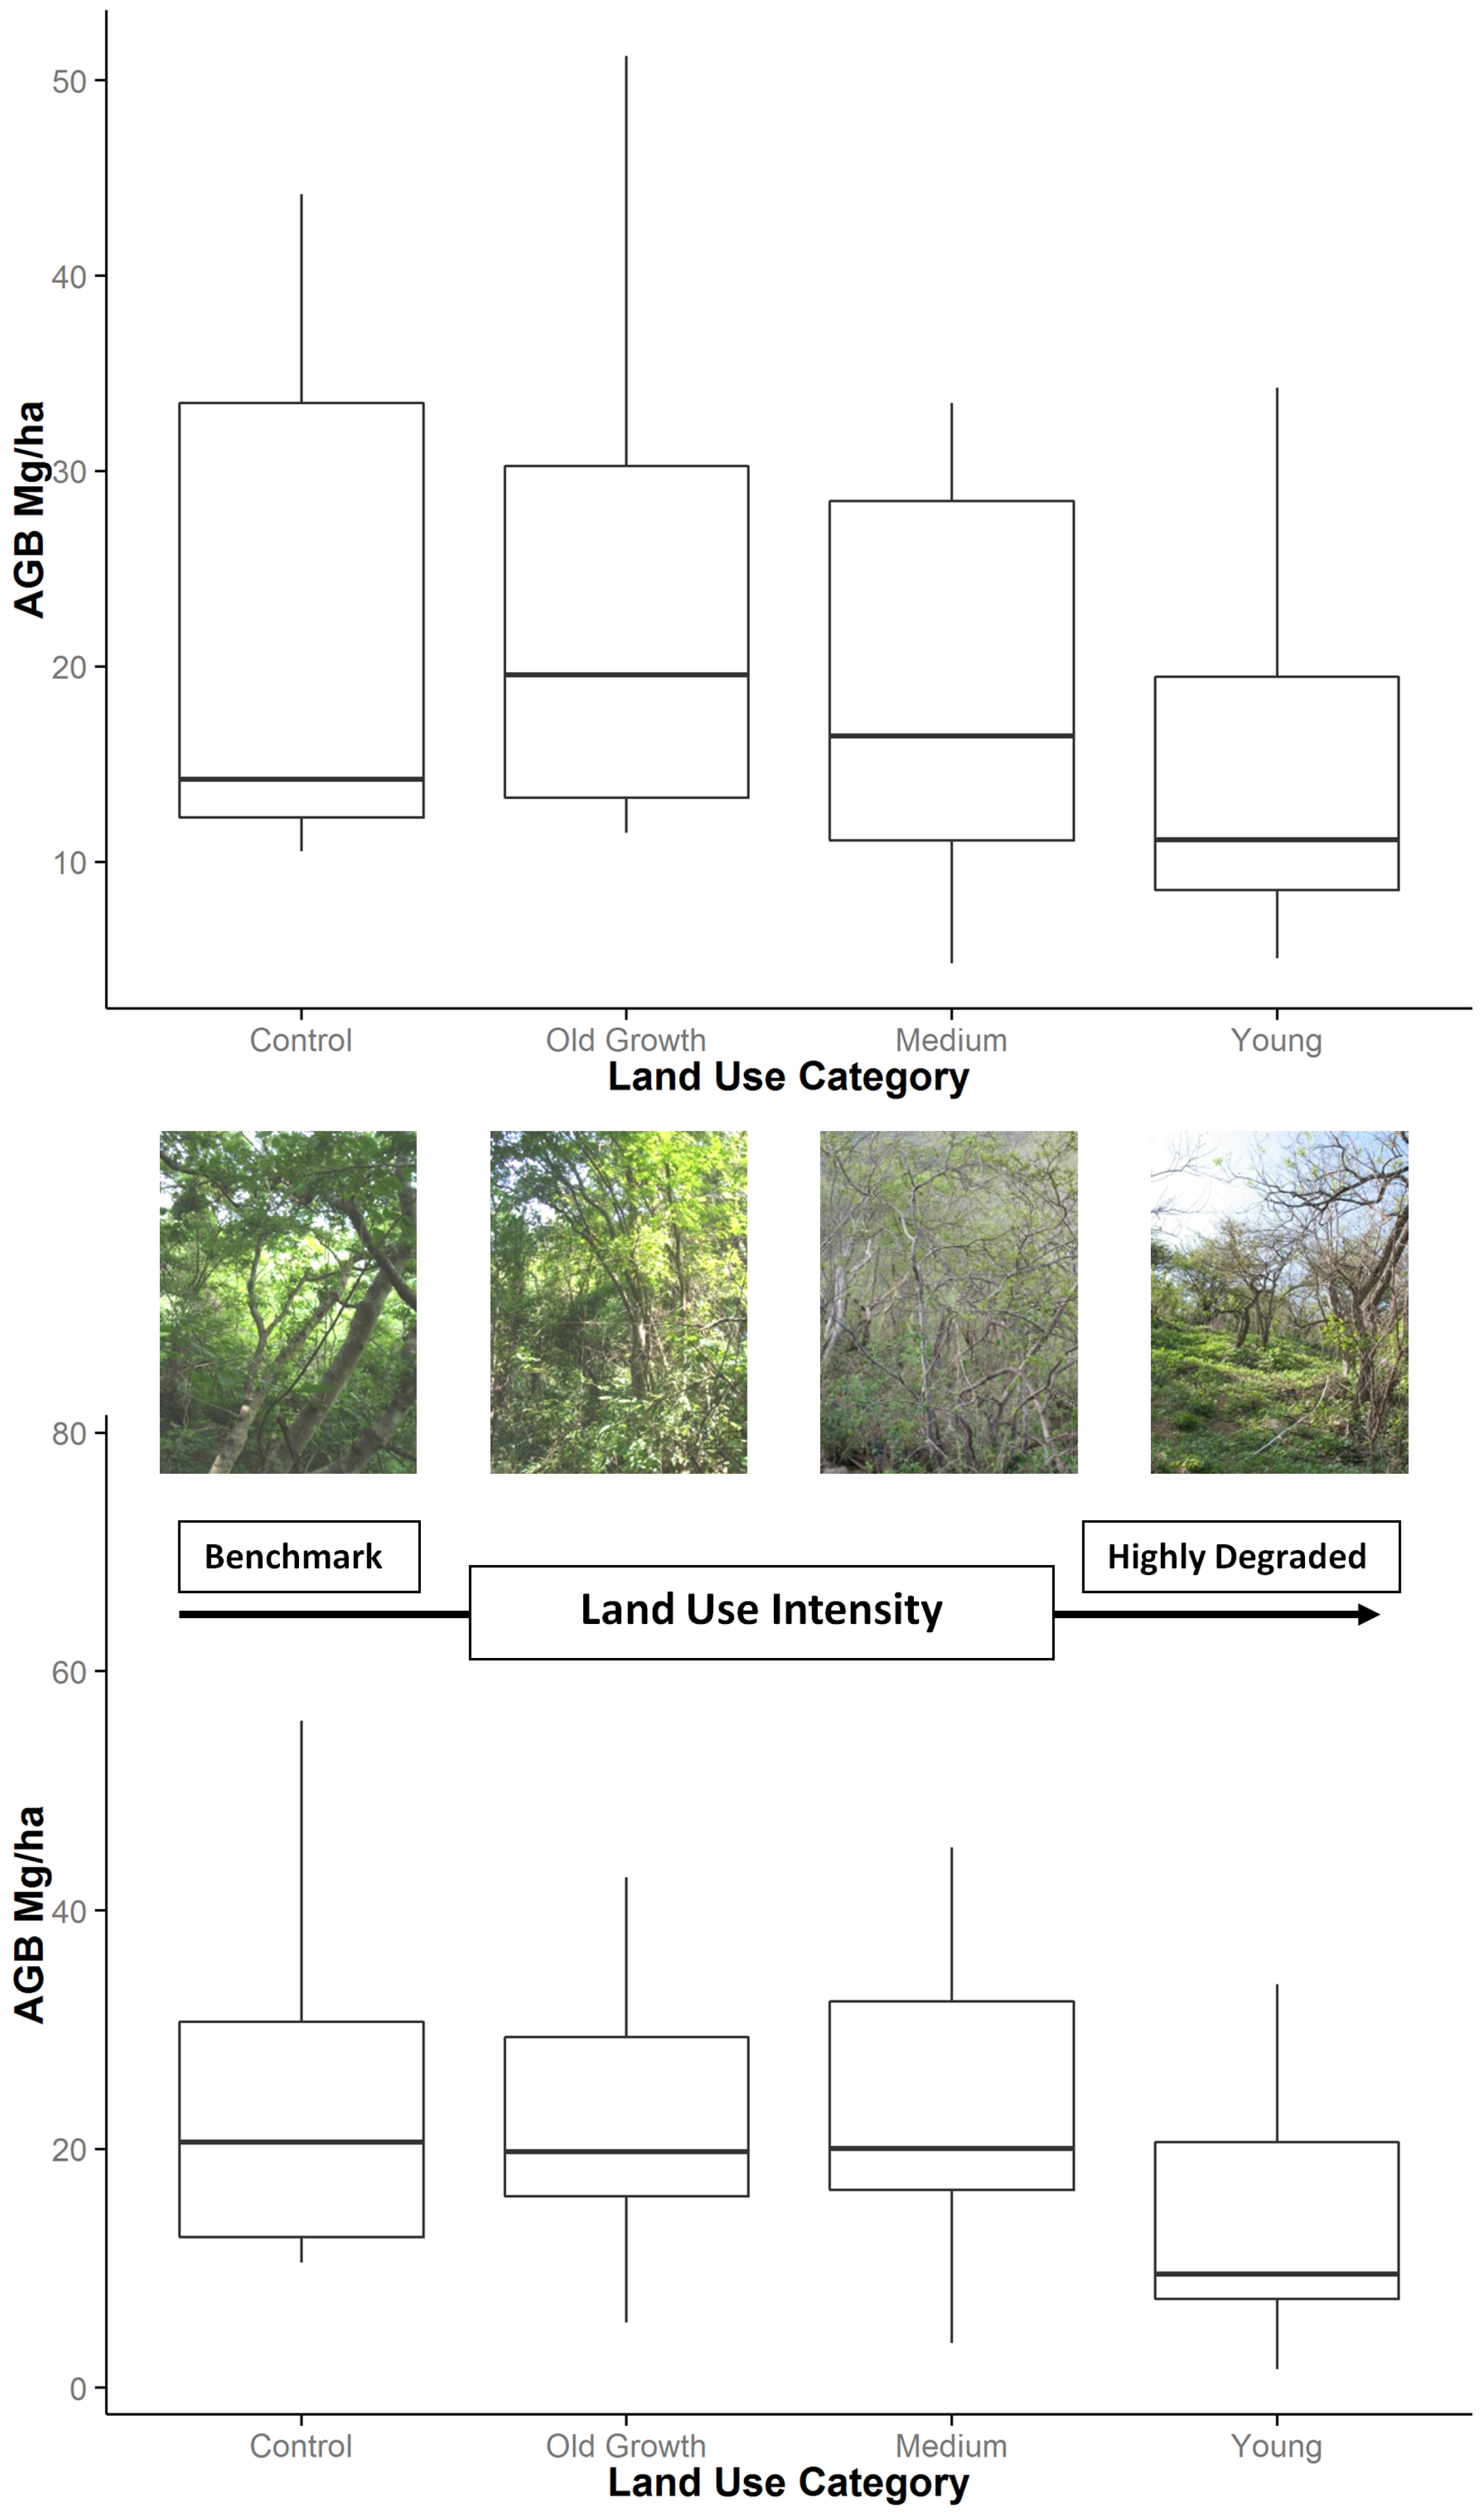
Figure 2). The range in values for the benchmark is important to reflect the variation with site environment (e.g., linked to vegetation type, topography and soils) in potential above-ground biomass stocking rates of areas without major human disturbance impacts.
The first step in operationalizing this approach would be to decide on the size of the region within which the benchmark would be applied. For Mexico, a possible approach would be to work at the watershed level, as watersheds tend to be made up of landscape units with relatively similar sets of biophysical characteristics, and moreover in some cases they are the spatial basis of governance units, e.g., in Jalisco State where a number of inter-municipal juntas uniting up to 20 spatially contiguous municipalities have been created. These associations are already taking a strong lead in early actions for REDD+ in Mexico, particularly in Jalisco and Yucatán. A second step is to stratify the landscape into homogeneous units based on biophysical characteristics and then carry out the local forest inventories (see
Section 5.1). Selecting an adequate number of strata is not straightforward in most cases and it requires an in-depth knowledge of the area characteristics.
Figure 2.
Aboveground biomass for tropical dry forests grouped in four land use categories according to altitude: (a) 1200–1700 (n = 47); (b) 900–1200 (n = 54) for the Junta Intermunicipal de la cuenca del Rio Ayuquila, Jalisco, Mexico. Land use categories are defined according to time since last clearance: Control = no clearance (Benchmark), Old Growth = more 40 years (D1), Medium = 10–20 years (D2), Young = less than 6 years (D3-highly degraded). The error bars show the maximum and minimum value for each category and the box corresponds to first and third quartile, the centreline is the median value.
In Jalisco a first attempt to apply the benchmark concept was undertaken for the Junta Intermunicipal de la cuenca del Rio Ayuquila (JIRA), one of the REDD+ pilot areas selected by the Mexican Government. In this case a detailed forest inventory was carried out in the tropical dry forests area (“selva baja”) [
78], where the main forest degradation drivers are slash-and-burn agriculture and grazing. Previously, the communities (
ejidos) used to practice slash and burn all over the communal area. Currently only specific areas are allocated for this type of agriculture, this has allowed forest regrowth, but at the same time has intensified the use of certain areas. If the data from four communities’ plots are classified based on the land use history and altitude, as the basis to create homogeneous units, it is possible to distinguish four levels of degradation as shown in
Figure 2. In this case it will be feasible to distinguish highly degraded areas in comparison with the benchmark; assessing intermediate categories (D2–D3) will be more difficult because there is a notable overlap between categories as shown by the error bars, especially for lower altitudes. This indicates that a more detailed classification, using biophysical variables such as slope, aspect or smaller altitudinal ranges, should be attempted, to reduce this variability.
The complexity of ecosystems and their dynamics makes the establishment of benchmarks difficult. However, with limited current capabilities and data constraints, the benchmark approach is still likely to be the best to help assessment of degradation and forest enhancement for the early implementation of REDD+. This will enable the design and monitoring of REDD+ activities to tackle the anthropogenic disturbance processes causing degradation, either through interventions to stop the processes or through behaviour change of the actors involved [
15,
79]. By using local inventories linked to degradation drivers, a benchmark system could also serve to scale up evaluation of the performance of REDD+ actions to evaluate the impact of REDD+ policy interventions on carbon stock changes [
80].
Finally, as more information becomes available, benchmarks can be compared and refined and historical baselines could, in the long run, be developed using them. Simple characteristics can be used by projects as guidelines for classifying areas into different degradation levels, e.g., the percentage of the forest that is under slash-and-burn agriculture. For logged forests, Sasaki
et al. [
81] have proposed that the number of trees above the minimum diameter at breast height for legal harvesting that are found in an area could be used as an indicator of the state of degradation. Recent evidence has shown how important large trees are in the total carbon pool [
82].
6. Conclusions
There are a number of reasons why defining forest degradation in a consistent and operational manner is complex. As a consequence, the result of any assessment of degradation is likely to be very dependent on the scale to which the definition applies. Given the multiple temporal scales of natural change in forest condition, the absence of adequate historical data with which to define the range of conditions that may exist in non-degraded (the counter-factual) is a particular constraint. The efficacy of a definition will depend on the consistent reliability of the indicators that can be applied to it, but there has been a serious lack of research to test this. Thus, all definitions present challenges and stakeholders in the international policy development process and the voluntary carbon markets will have to deal with the intrinsic level of uncertainty associated with the process of forest degradation, and continuously seek improvements in the operational definition. In the absence of a perfect system, practical solutions need to be developed that will enable countries such as Mexico at least to get started with the process of national scale REDD+ monitoring. To assist with this, the primary goal of this paper was to propose an operational definition and system of measurement, contextualized for the case of Mexico.
Assessment of degradation (as well as deforestation) for REDD+ requires a definition of forest in terms of thresholds, and we suggest that the minimum threshold for tree canopy cover should be 30% because this encompasses the types of degraded forest which have the most chance of increased carbon stocks with improved management. Although there is undoubtedly a need in Mexico for habitat protection and restoration of some areas with a lower level of tree canopy cover, we believe that this could be better achieved by other conservation instruments and policies. Mexico’s forest law is clear that agricultural plantations do not count as “forests”, but it is not yet clear whether trees introduced as a result of the promotion of sustainable agroforestry practices will be eligible for crediting under a national REDD+ programme.
When it comes to identifying areas that are degraded, and change in these areas over time (i.e., “degradation activity data”), we suggest that it is not possible at present to construct a baseline or reference emission level, that is relevant to most types of degradation in Mexico, based solely on remotely sensed data. This is primarily because the available high resolution images, although they are useful in identifying areas which appear to be degraded now, and have good potential to track changes in these in the future, are too recent to provide sufficient historical coverage. In addition, data from the national forest inventory are also too recent to be used to determine past degradation levels. Meanwhile, low- and mid-resolution remotely sensed images, which have been available for longer, are far too coarse in resolution to allow sufficiently accurate identification of areas that are degrading. As degradation frequently occurs as a cyclic phenomenon over a management unit (e.g., over forest areas used by a community of small farmers for slash-and-burn agriculture or for repeated commercial unsustainable timber harvesting) it needs to be assessed in an aggregated way at the management unit level or over the whole landscape. In Mexico appropriate units could be an ejido, community or small private property, or perhaps a landscape unit that captures a relatively homogeneous pattern of local forest uses across multiple ejidos.
Currently available remote sensing data and methodological approaches do not permit accurate quantification of the rate of loss of biomass within degrading forests (which would form the basis for the estimate of emission factors), as they only observe canopy cover. Historical optical satellite data can only estimate activity (area) data, not tree biomass stock per hectare. Biomass stocks can be estimated with lidar and intense field sampling, but as there are no historical lidar images available it is not yet possible to construct a baseline against which to compare future measurements to assess loss and gain of forest biomass. The Mexican national forest inventory, which does provide data on biomass stocks, has records going back only to 2004 or 2007 with only one re-measurement in most cases. Currently, this is not sufficient for construction of a baseline for degradation emissions data (for which data from more than 10 years would be needed). Moreover, the inventory plots are so widely spaced that they cannot be used to assess stock change at the forest management unit level. At this scale the best future solution may be inventories made by landowners or communities themselves, as an integral component of their REDD+ management activities.
At present it will be very difficult for Mexico to make claims for reduction in emissions from degradation. This will have to wait until sufficient data are available to construct an appropriate baseline or reference emission level. However, to the extent that technology permits assessment of increases in forest biomass over the coming decade (e.g., evidence at national level from the national forest inventory, and possibly lidar data from particular sites of REDD+ interventions), these could be expressed in terms of tonnes of carbon and credited as forest enhancement, that does not fundamentally require a baseline.
We propose that, in the meantime, a local level, a bottom-up approach will be needed, not only to assess forest degradation emissions effectively, but more importantly to assess the effectiveness of different REDD+ interventions which aim to reduce degradation. For this, the setting up of benchmarks, which reflect local conditions over relatively homogeneous areas, would be invaluable. The use of benchmarks needs to be well informed by an understanding of the dynamic processes that are occurring in each forest assessed, in order to prevent the unjustified assumption that if the degradation agent is removed forest will follow a determined successional path. Under current capabilities, the use of benchmarks is likely to offer the only realistic option for evaluation of the impacts of REDD+ activities on forest degradation.

 and
and 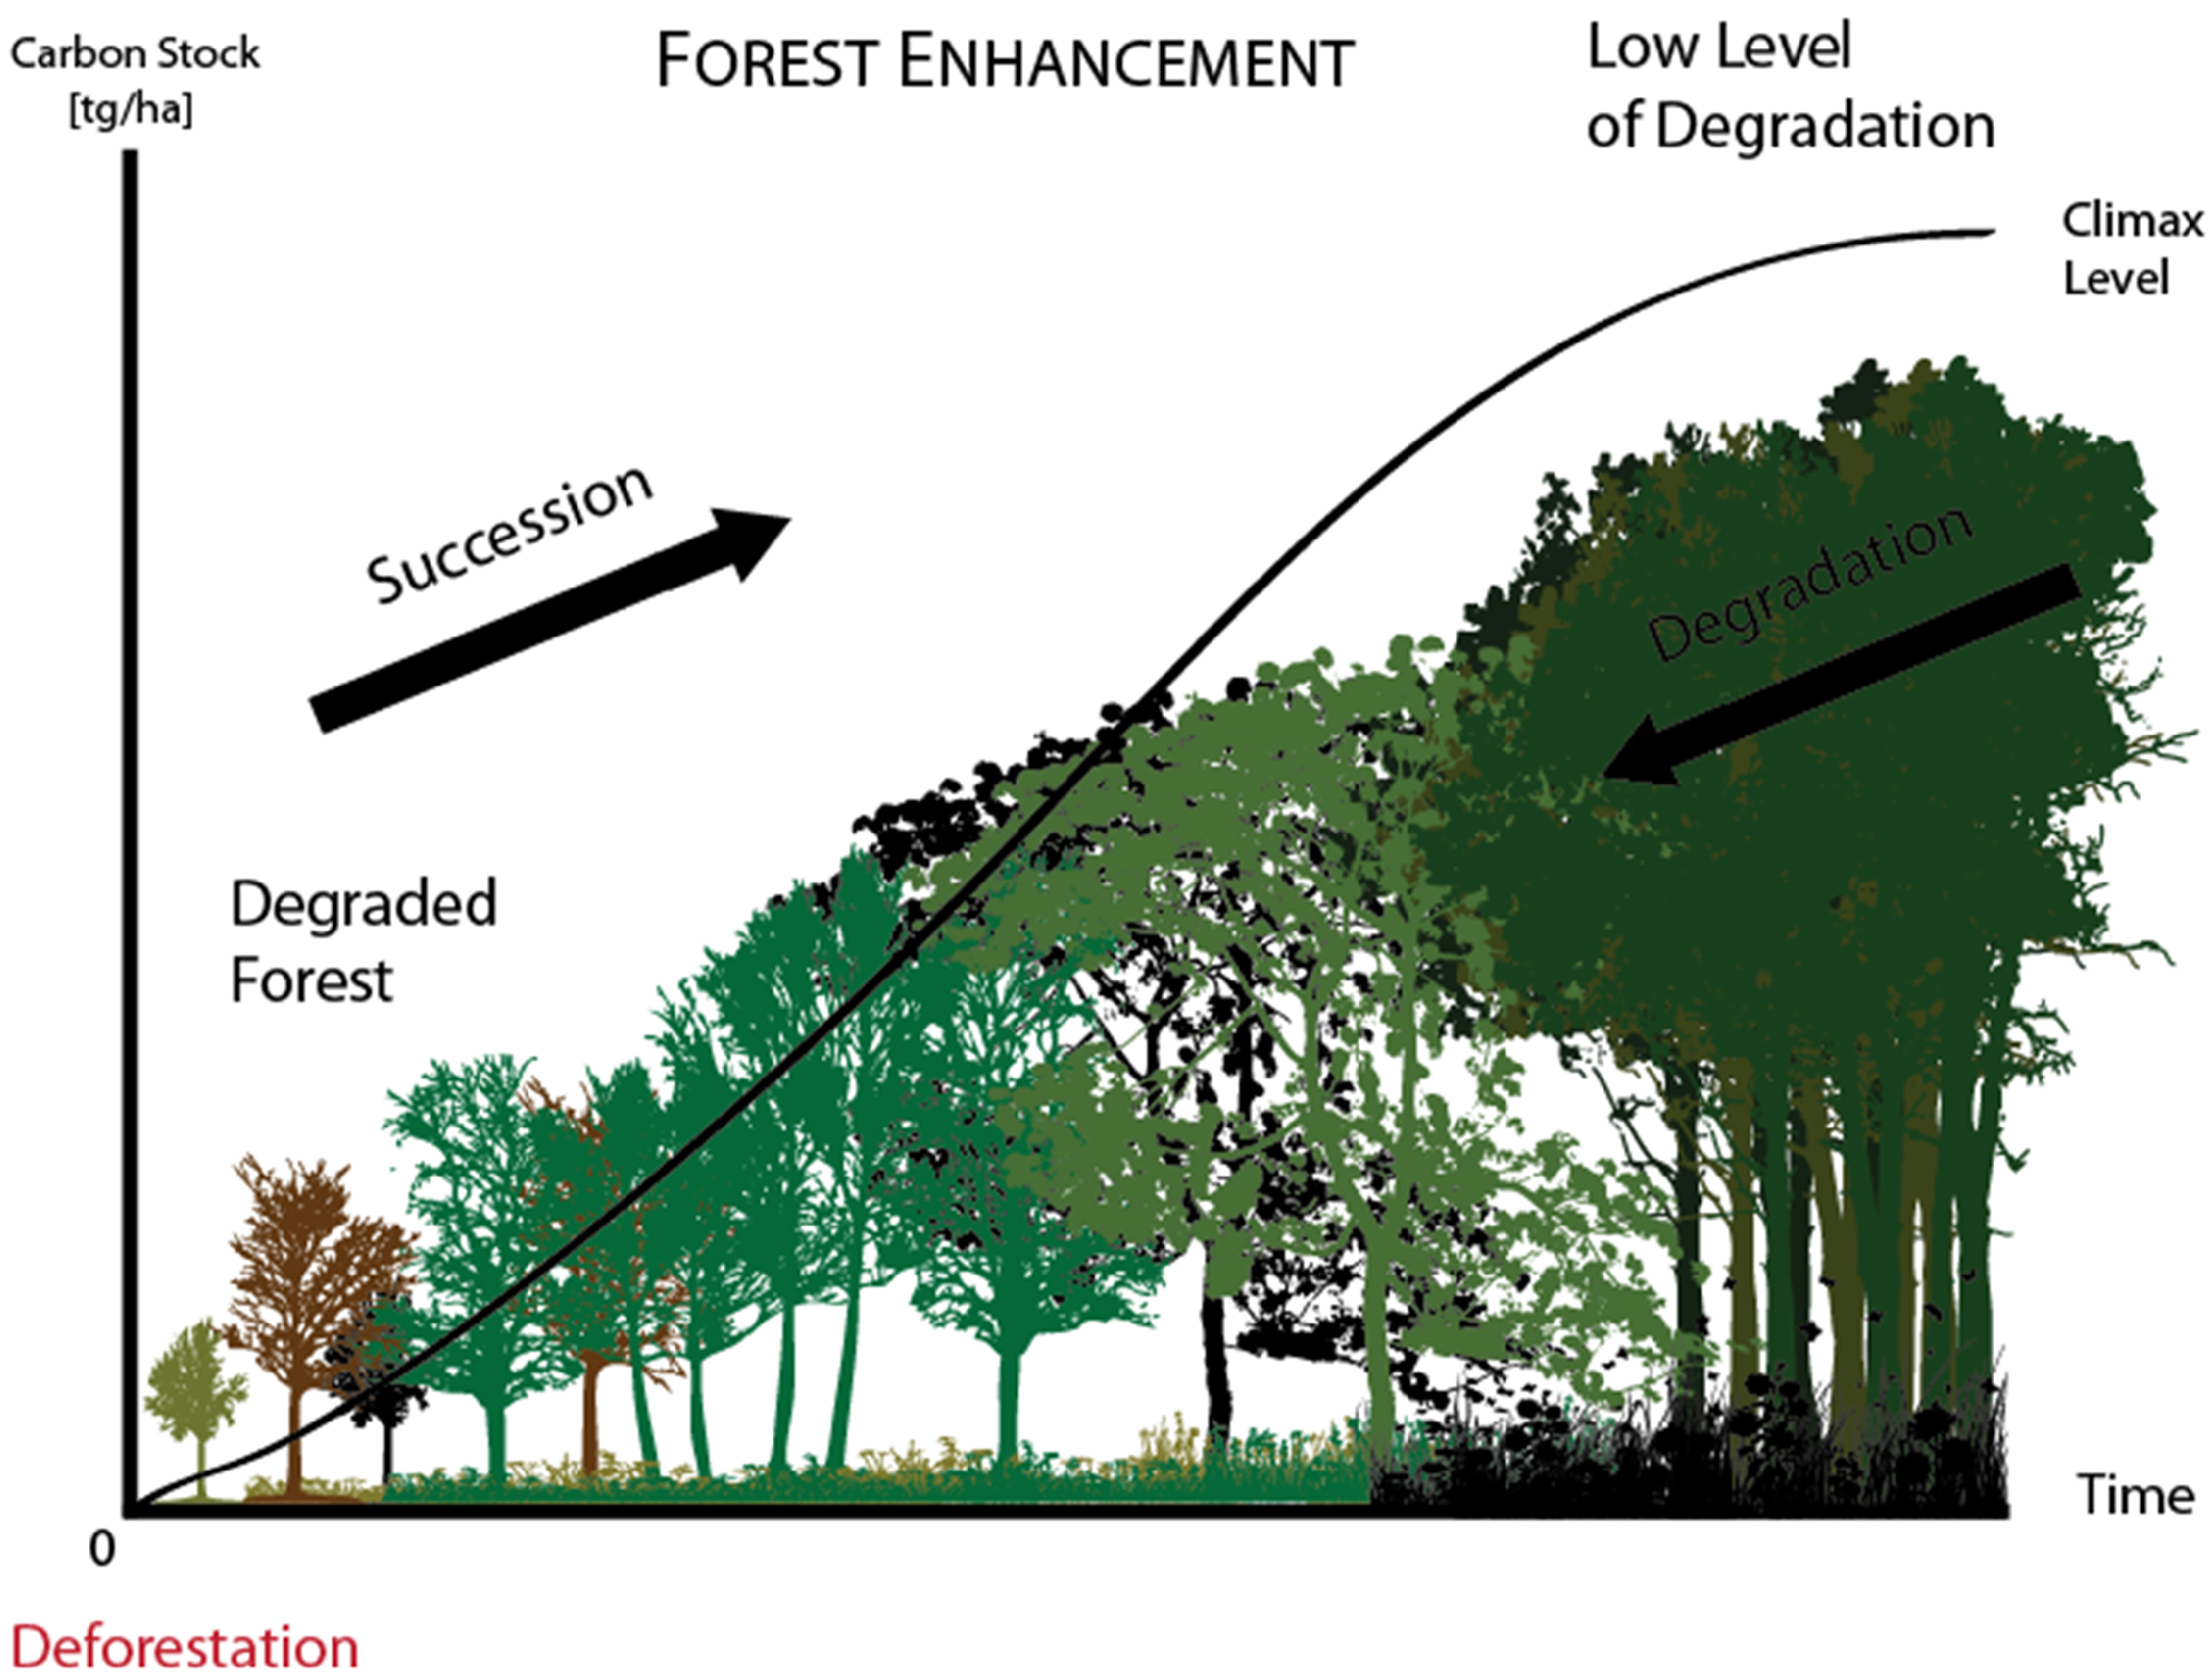

