Article

Soil Organic Carbon in Particle Size and Density Fractionations under Four Forest Vegetation-Land Use Types in Subtropical China

1
Key Laboratory for Forest Carbon Cycling and Carbon Sequestration of Zhejiang Province, Zhejiang A&F University, Lin'an 311300, Zhejiang, China
2
School of Environment and Resources, Zhejiang A&F University, Lin'an 311300, Zhejiang, China
3
Department of Renewable Resources, University of Alberta, Edmonton, AB T6G 2E3, Canada
*
Authors to whom correspondence should be addressed.
Forests 2014, 5(6), 1391-1408; https://doi.org/10.3390/f5061391
Submission received: 21 January 2014 / Revised: 19 April 2014 / Accepted: 29 May 2014 / Published: 17 June 2014

Abstract

:
Data on the effect of vegetation and land use type on soil organic carbon (SOC) distribution in particle-size and density fractions in the subtropical forest region in China will improve our understanding of the C sequestration potential of those different vegetation-land use types. We quantified SOC in particle size (coarse, medium and fine) and density fractions (light and heavy) under four types of common forest vegetation-land uses: an evergreen broad-leaf forest, a pine forest, a managed chestnut forest and an intensively managed bamboo forest in subtropical China. The SOC in the 0–20 and 20–40 cm soil layers was the highest in the bamboo forest (31.6–34.8 g·C·kg−1), followed by the evergreen broad-leaf forest (10.2–19.9 g·C·kg−1), the pine forest (8.5–13.6 g·C·kg−1) and the chestnut forest (6.3–12.2 g·C·kg−1). The SOC was largely in the coarse fraction under the evergreen broad-leaf, pine and bamboo forests, while it was largely in the fine fraction in the chestnut forest, suggesting that SOC in the chestnut forest was likely more stable than that in the other forest vegetation-land use types. The SOC in the light fraction under the four forest vegetation-land use types ranged from 1.4 to 13.1 g·C·kg−1 soil, representing 21%–37% of the total organic C; this suggests that the majority of the SOC was in the better protected, heavy fraction. We conclude that forest vegetation-land use type (and the associated management practices) influenced SOC distribution in particle size and density fractions in the studied subtropical forests in southeastern China.

1. Introduction

The global soil carbon (C) stock is approximately 2,500 Pg, among which, 70% exists as soil organic C (SOC) in the top 1 m of the soil; therefore, the SOC plays an important role in the C cycle in terrestrial ecosystems and in the global C balance [1,2,3]. The SOC concentration is an indicator of soil fertility and strongly affects soil physical and biological properties [2,4,5]. In forest ecosystems, SOC concentration is strongly affected by the type of forest vegetation and management regimes, in addition to being affected by biophysical factors, such as climate, hydrology and parent geological material [2].
The SOC pool can be characterized by the distribution of C in different soil particle size and density fractions [6,7]. Physical fractionation methods are commonly used, since they help to understand the dynamics, structure and function of SOC [8,9,10]. Size fractionation separates soil particles based on their size. In soil particle size fractionation, the SOC distribution in particle sizes is typically evaluated in the coarse (250–2000 μm), medium (53–250 µm) and fine (<53 µm) fractions [11,12,13,14,15]. The concentration and stability of SOC in different size fractions are different and are closely related to the content of silt and clay particles in the soil [16,17].
The SOC associated with sand-sized particles (53–2000 μm) comes from partly decomposed dead plant and animal materials that have a relatively low turnover time, which is between the turnover times of active and passive C pools [18,19]. This fraction of SOC is more sensitive to land management when compared with total SOC and better suited to predict changes in soil quality [20,21,22]. The SOC associated with silt and clay particles is relatively stable, due to physical protection, and provides a good measure of the physical protection capacity of the soil, which is positively related to the silt and clay content in the soil [23].
Density fractionation is used to separate SOC into the light (LF) and heavy fractions (HF) [7]. The SOC in the LF, with a density of <1.6–2.0 g·cm−3, is not firmly associated with soil particles and consists mostly of free organic matter (fOM) and pieces of plant residues. The SOC in the LF has a high C:N ratio and a relatively low turnover time. The LF typically has between 20% and 30% SOC, which is formed by the decomposition of plant residues [11]. The SOC in the HF with a density of >1.6–2.0 g·cm−3 exists as organo-mineral complexes and is associated with soil mineral particles. Compared to the LF, organic C in the HF is less sensitive to land management changes, but represents the soil’s long-term C sequestration capacity [24,25].
Most studies on particle size or density fractions have been focused on changes under different land use management [26,27]. Few have studied the effect of different forest types on SOC in particle size or density fractions [28]. In this paper, we studied the SOC distribution in both soil particle size and density fractions under four forest vegetation-land use types: an evergreen broad-leaved forest, a pine (Pinus massoniana) forest, a managed Chestnut (Castanea mollissima) forest and an intensively managed bamboo (Phyllostachys praecox) forest in southeast China. Those forest vegetation-land uses represent the most common types of forest vegetation-land use that cover plantations (some have high economic value), as well as natural forests in subtropical China [29,30]. The objective of this study was to determine the influence of forest type on soil total organic C concentration, C concentration indifferent particle size and density fractions and their spatial distributions in the soil profile. We hypothesize the following: (1) The total SOC storage will be higher in the intensively managed bamboo forest, followed by the natural evergreen broad-leaf forest, then the secondary pine forest and the managed chestnut forest. Such trends of SOC storage were affected by the high amount of organic mulch applied in the bamboo forest that increase SOC storage and the disturbance in the secondary pine forest and managed chestnut forest that decrease SOC storage. (2) SOC fractions in the fine particle-size fraction and in the HF will be higher in the evergreen broad-leaf forest, followed by the pine forest, the bamboo forest and the managed chestnut forest. The above relationships would reflect the effect of the type and frequency of disturbance on SOC stability. The data from this study will help us understand the range of SOC distribution in particle size and density fractions in subtropical forests and provide opportunities for long-term soil C sequestration through managing for different vegetation-land use types in forest ecosystems in subtropical China.

2. Materials and Methods

2.1. Location and Forest Types

This study was conducted on four forest types located in Linglong mountain (119°42' E, 30°14' N; elevation: 353 m), in the municipality of Lin’an, Zhejiang Province, China. The area has a subtropical monsoon climate, with a mean annual temperature of 15.8 °C and a mean annual precipitation of 1424 mm in the study area. The coldest month is January, and the hottest month is July; the area has 1939 daylight hours and 236 frost-free days a year. The soil was developed on a parent geological material derived from tuff. The dominant soil in the study area belongs to a Ferralosol in the Chinese system of soil classification [31] or a Ferralsol in the FAO soil classification system [32].
The experimental sites were selected based on similar parent material, soil type, aspect, slope gradient, slope position and elevation. However, the experimental sites had different land-use history and management practices. The four forests were located within 5 km of each other. Details of the four forest types studied are as follows:
(1)
An evergreen broad-leaved forest, which is a climax community in the study area. The dominant species were Cyclobalanopsis glauca, Castanopsis sclerophylla, Schima superba and Castanopsis eyrei. The stand was approximately 25 years old and had 70% canopy closure, with trees having an average diameter at breast height (DBH) of 14.3 cm. The dominant understory species were Litsea cubeba, Lindera glauca, Camellia fraternal and Cleyera japonica; they provided about 70% ground cover.
(2)
A pine forest that had an average canopy cover of 55%–75%, with trees older than 20 years and a DBH of 10–13 cm. The dominant understory species were Camellia fraterna, Vaccinium bracteatum and Symplocos stellaris.
(3)
A managed chestnut forest, which was converted from an evergreen broad-leaved forest or coniferous forest through clearcutting and planting. The chestnut forest was 14 years old, and the trees had a mean DBH of 14.4 cm. The stands were planted at a density of 415 trees per hectare. The stands were managed with 2–3 times of weeding/cultivation and 3 fertilizer applications per year. The rate of fertilizer application was 1 kg per tree per year with an NPK compound fertilizer (N:P2O5:K2O = 15:15:15).
(4)
An intensively managed bamboo forest, which was converted from a young evergreen broad-leaved forest in 1997 by clearcutting and planting. At the time of this study, the forest was 14 years old and had 1500 bamboo plants per hectare. The bamboo plants in the stands had a mean DBH of 3.5 cm. Before 2002, the bamboo forest was managed by annual tillage and fertilization (application of urea at 450 kg·ha−1·y−1 and an NPK compound fertilizer (N:P2O5:K2O = 15:15:15) at 600 kg·ha−1·y−1). After 2002, intensive management practices were used to enhance bamboo growth and bamboo shoot production. In the intensive management regime, organic materials (straw and rice chaff) were applied from November 20 to December 10 every year to cover the soil surface to increase soil temperature and maintain soil moisture content in the winter. This (mulching) involves placing 10–15 cm of rice straw at the soil surface, followed by adding 10–15 cm of rice husk. The annual rate of application was equivalent to 40 t·ha−1 of rice straw and 55 t·ha−1 of rice husk, with an approximately total annual input of 35 t·C·ha−1 [33]. The undecomposed organic residues were removed in April or May of the following year. Fertilization occurred in May, September and just before the application of the mulch material in early winter. The annual fertilizer application rates were 2.25 t·ha−1 compound fertilizer (N:P:K = 15:15:15) and 1.125 t·ha−1 urea (46% N). The land was tilled after the fertilizer application to mix the fertilizer into the soil.

2.2. Soil Sampling and Analyses

Three 20 × 20-m experimental plots were established in each forest vegetation-land use type in March, 2010. The forest-land use type was not replicated, but the soil type and landscape attributes were similar among the four forest types, and the differences reported in this paper are attributed to the effect of vegetation-land use type. Soil samples were collected at 2 depths (0–20 and 20–40 cm) from 3 soil profiles in each plot. A composite soil sample was obtained by combining samples collected from the same plot and depth. After the soil samples were brought into the laboratory, they were air-dried and passed through a 2-mm sieve after removing coarse fragments and roots.

2.2.1. Soil Particle Size Fractionation

A 30-g (oven-dry weight basis) air-dried soil sample (sieved through a 2-mm screen) was weighed into a beaker, then deionized water was added to the soil sample to achieve a soil:water ratio of 1:5 (v:v). The content in the beaker was thoroughly mixed and ultrasonicated (at 300 W) for 15 min using a KQ-500DE (250–500 W) ultrasonic unit that was manufactured by Ultrasonic Equipment Ltd. in Kunshan City (Jiangsu Province, China). Each sample was then transferred onto a set of sieves (250- and 53-μm sieves); the soil was separated into different particle size fractions under slowly running water. The sample was washed until the water flowing out of the 53-μm sieve was clear. The soil in the <53-μm fraction was recovered by allowing the soil to settle out; after the top clear solution was decanted, the remainder was dried in an oven at 60 °C. Three size fractions were obtained: the coarse size (>250 μm) fraction with non-protected particulate organic matter (cPOM, everything retained on the 250-µm sieve), the microaggregate fraction (250–53 μm) and the silt-clay fraction (<53 µm). All fractions were dried in a 60 °C oven, weighed and ground to <53 μm. The C concentration was determined by the method described below; the data allow the calculation of the C concentration in different particle size fractions and the distribution of SOC in different particle size fractions as a proportion of the total soil organic C [11,12,13,14].

2.2.2. Soil Density Fractionation

The SOC was separated into the LF and HF using NaI following the method described in Tan et al. [34]. To do that, 50 mL NaI (aqueous sodium iodide, adjusted to a density of 1.8 g·cm−3) and 10 g (oven-dry basis) of air-dried soil samples that had passed through a 2-mm sieve were placed into a 100-mL centrifuge tube. A density of 1.8 g·cm−3 is one of the most commonly used cut-off densities in past studies [35]. The sample mixture was hand shaken for 30 s to ensure that the soil was fully saturated/mixed with water and was then treated ultrasonically for 15 min (300 W) using a KQ-500DE (250–500 W) ultrasonic unit that was manufactured by Ultrasonic Equipment Ltd. in Kunshan City (Jiangsu Province, China), followed by centrifugation for 15 min (3500 r·min−1). The solution was decanted and filtered on a 20-mm nylon to obtain and separate the LF. The above steps were repeated 3 times. The LF retained on the filter paper was washed with 100 mL of 0.01 mol·L−1 CaCl2 and then with 200 mL deionized water. For the above initial wash, CaCl2 was used, as the CaCl2 was more effective in removing the heavy NaI. The LF retained on the filter paper was then dried at 60 °C and weighed. The soil remaining in the centrifuge tube was washed twice with 100 mL of 0.01 mol·L−1 CaCl2, and was then washed 10 times with deionized water. The soil was also dried in a 60 °C oven and weighed. The organic C concentration in the bulk soil and the HF was determined by the method described below, and the difference between the two was the organic C concentration in the LF. It is recognized that the organic C concentration in the LF was likely somewhat overestimated when the “by difference” method was used, because some organic C was likely lost from the HF to the LF. The optimum intensity of dispersion would be related to the type of soil and the stability of contained aggregates, and the results between different studies are more comparable when the same conditions are applied [36,37].

2.2.3. Methods for pH, Organic C and N Determination

Soil pH was determined in a 1:2.5 (w:v) soil to distilled water ratio using a pH meter. Soil organic C concentrations in the soil samples were determined by the wet oxidation method of Walkley and Black, using potassium dichromate (K2Cr2O7) and concentrated H2SO4. The sample-reagent mixture was gently boiled at 170 °C for 30 min to ensure complete oxidation of the organic C, with the excess Cr2O72− titrated with ferrous ammonium sulfate to determine the amount of organic C in the sample [38,39]. The total N concentration in the above digest was determined using a semi-micro Kjeldahl method [39].

2.3. Statistical Analyses

All data reported in this paper are based on means of three replications. Statistical analyses were performed using Microsoft Excel 2003 and DPS (Data Processing System) version 7.05 [40]. Data were analyzed with one-way ANOVA and Duncan’s multiple range test to compare the effect of forest vegetation-land use type on SOC in the different soil particle size or density fractions (α = 0.05).

3. Results

3.1. Soil Chemical Properties under Different Forest Vegetation-Land Use Types

The soils under the studied forest vegetation-land use types were all acidic, with soil pH ranging from 4.10 to 4.62 among the two soil layers (Table 1). Even though the absolute soil pH values were somewhat similar, they were significantly different between vegetation-land use types and soil layers. The highest SOC concentration in the 0–20-cm soil layer was found in the bamboo forest soil (34.78 g·C·kg−1), which was 1.75-, 2.55- and 2.86-times the SOC concentration in the broad-leaf, pine and chestnut forests, respectively (Table 1).
The total SOC concentration decreased with soil depth. Compared with the 0–20-cm soil layer, the total SOC in the 20–40-cm soil layer in the broad-leaf and chestnut forests had the largest decline (both at 49%), followed by the pine forest (38%) and the bamboo forest (9%); however, among the forest vegetation-land use types, the bamboo forest soil still had the highest total SOC concentration in the 20–4-cm soil layer (Table 1).
The dominant size fraction in both the 0–20- and 20–40-cm soil layers in the studied forest soils was the coarse fraction, except in the 20–40-cm layer in the chestnut forest, which had the highest proportion of medium and fine fractions (Table 1). The content of the coarse fraction was greater in the 20–40 than in the 0–20 cm soil depth. While the chestnut forest soil had the highest fine fraction in both soil layers, the proportion of the fine fraction increased with depth.
The proportion of the soil mass in the LF was significantly higher, while that in the HF was lower in the bamboo forest than in the other three forest vegetation-land use types in both soil layers. No significant difference was observed in the other three types of forest soils, and the LF decreased while the HF increased with depth (Table 1).
Table 1. Soil properties under different forest vegetation-land use types and soil depths (n = 3).
Soil Depth (cm)Forest TypepHSOC (g·kg−1)Total N (g·kg−1)Particle Size Fractions (Mass %)Silt-ClayDensity Fractions (Mass %)
Coarse SandFine SandLight FractionHeavy Fraction
0–20Broad-leaf forest4.32 (0.05) b19.89 (2.76) b1.31 (0.03) b65.1 (1.9) ab18.8 (2.9) a15.5 (4.7) c3.5 (0.3) b93.6 (0.9) a
Pine forest4.47 (0.05) a13.62 (0.55) b0.88 (0.01) d67.2 (3.3) a18.5 (0.8) a14.0 (2.8) c2.5 (0.2) c95.6 (0.7) a
Chestnut forest4.10 (0.05) c12.17 (1.90) b1.05 (0.29) c48.1 (0.6) c21.9 (1.3) a29.5 (1.8) a1.5 (0.1) d94.3 (0.4) a
Bamboo forest4.32 (0.05) b34.78 (8.36) a2.21 (0.04) a62.2 (1.9) b13.8 (2.9) b23.2 (1.5) b6.5 (0.5) a86.1 (2.9) b
20–40Broad-leaf forest4.54 (0.07) b10.20 (0.99) b0.64 (0.03) b46.2 (2.3) b25.8 (1.0) a26.9 (1.3) b1.2 (0.1) b95.1 (0.4) a
Pine forest4.62 (0.07) a8.51 (1.45) b0.35 (0.02) c59.6 (1.7) a18.2 (0.4) b21.0 (2.1) c0.9 (0.1) bc96.6 (0.6) a
Chestnut forest4.36 (0.05) c6.25 (0.08) b0.63 (0.02) b33.5 (1.2) c20.9 (2.2) b44.3 (1.6) a0.5 (0.01) c94.7 (0.5) a
Bamboo forest4.12 (0.05) d31.56 (10.09) a1.81 (0.01) a41.3 (2.9) b27.7 (1.4) a28.9 (4.4) b5.0 (0.7) a88.7 (1.7) b
Note: Values presented are means and standard deviations (in brackets). Within each depth, values for each parameter followed by different lowercase letters were significantly different among the forest vegetation-land use types at p < 0.05; SOC: soil organic C.

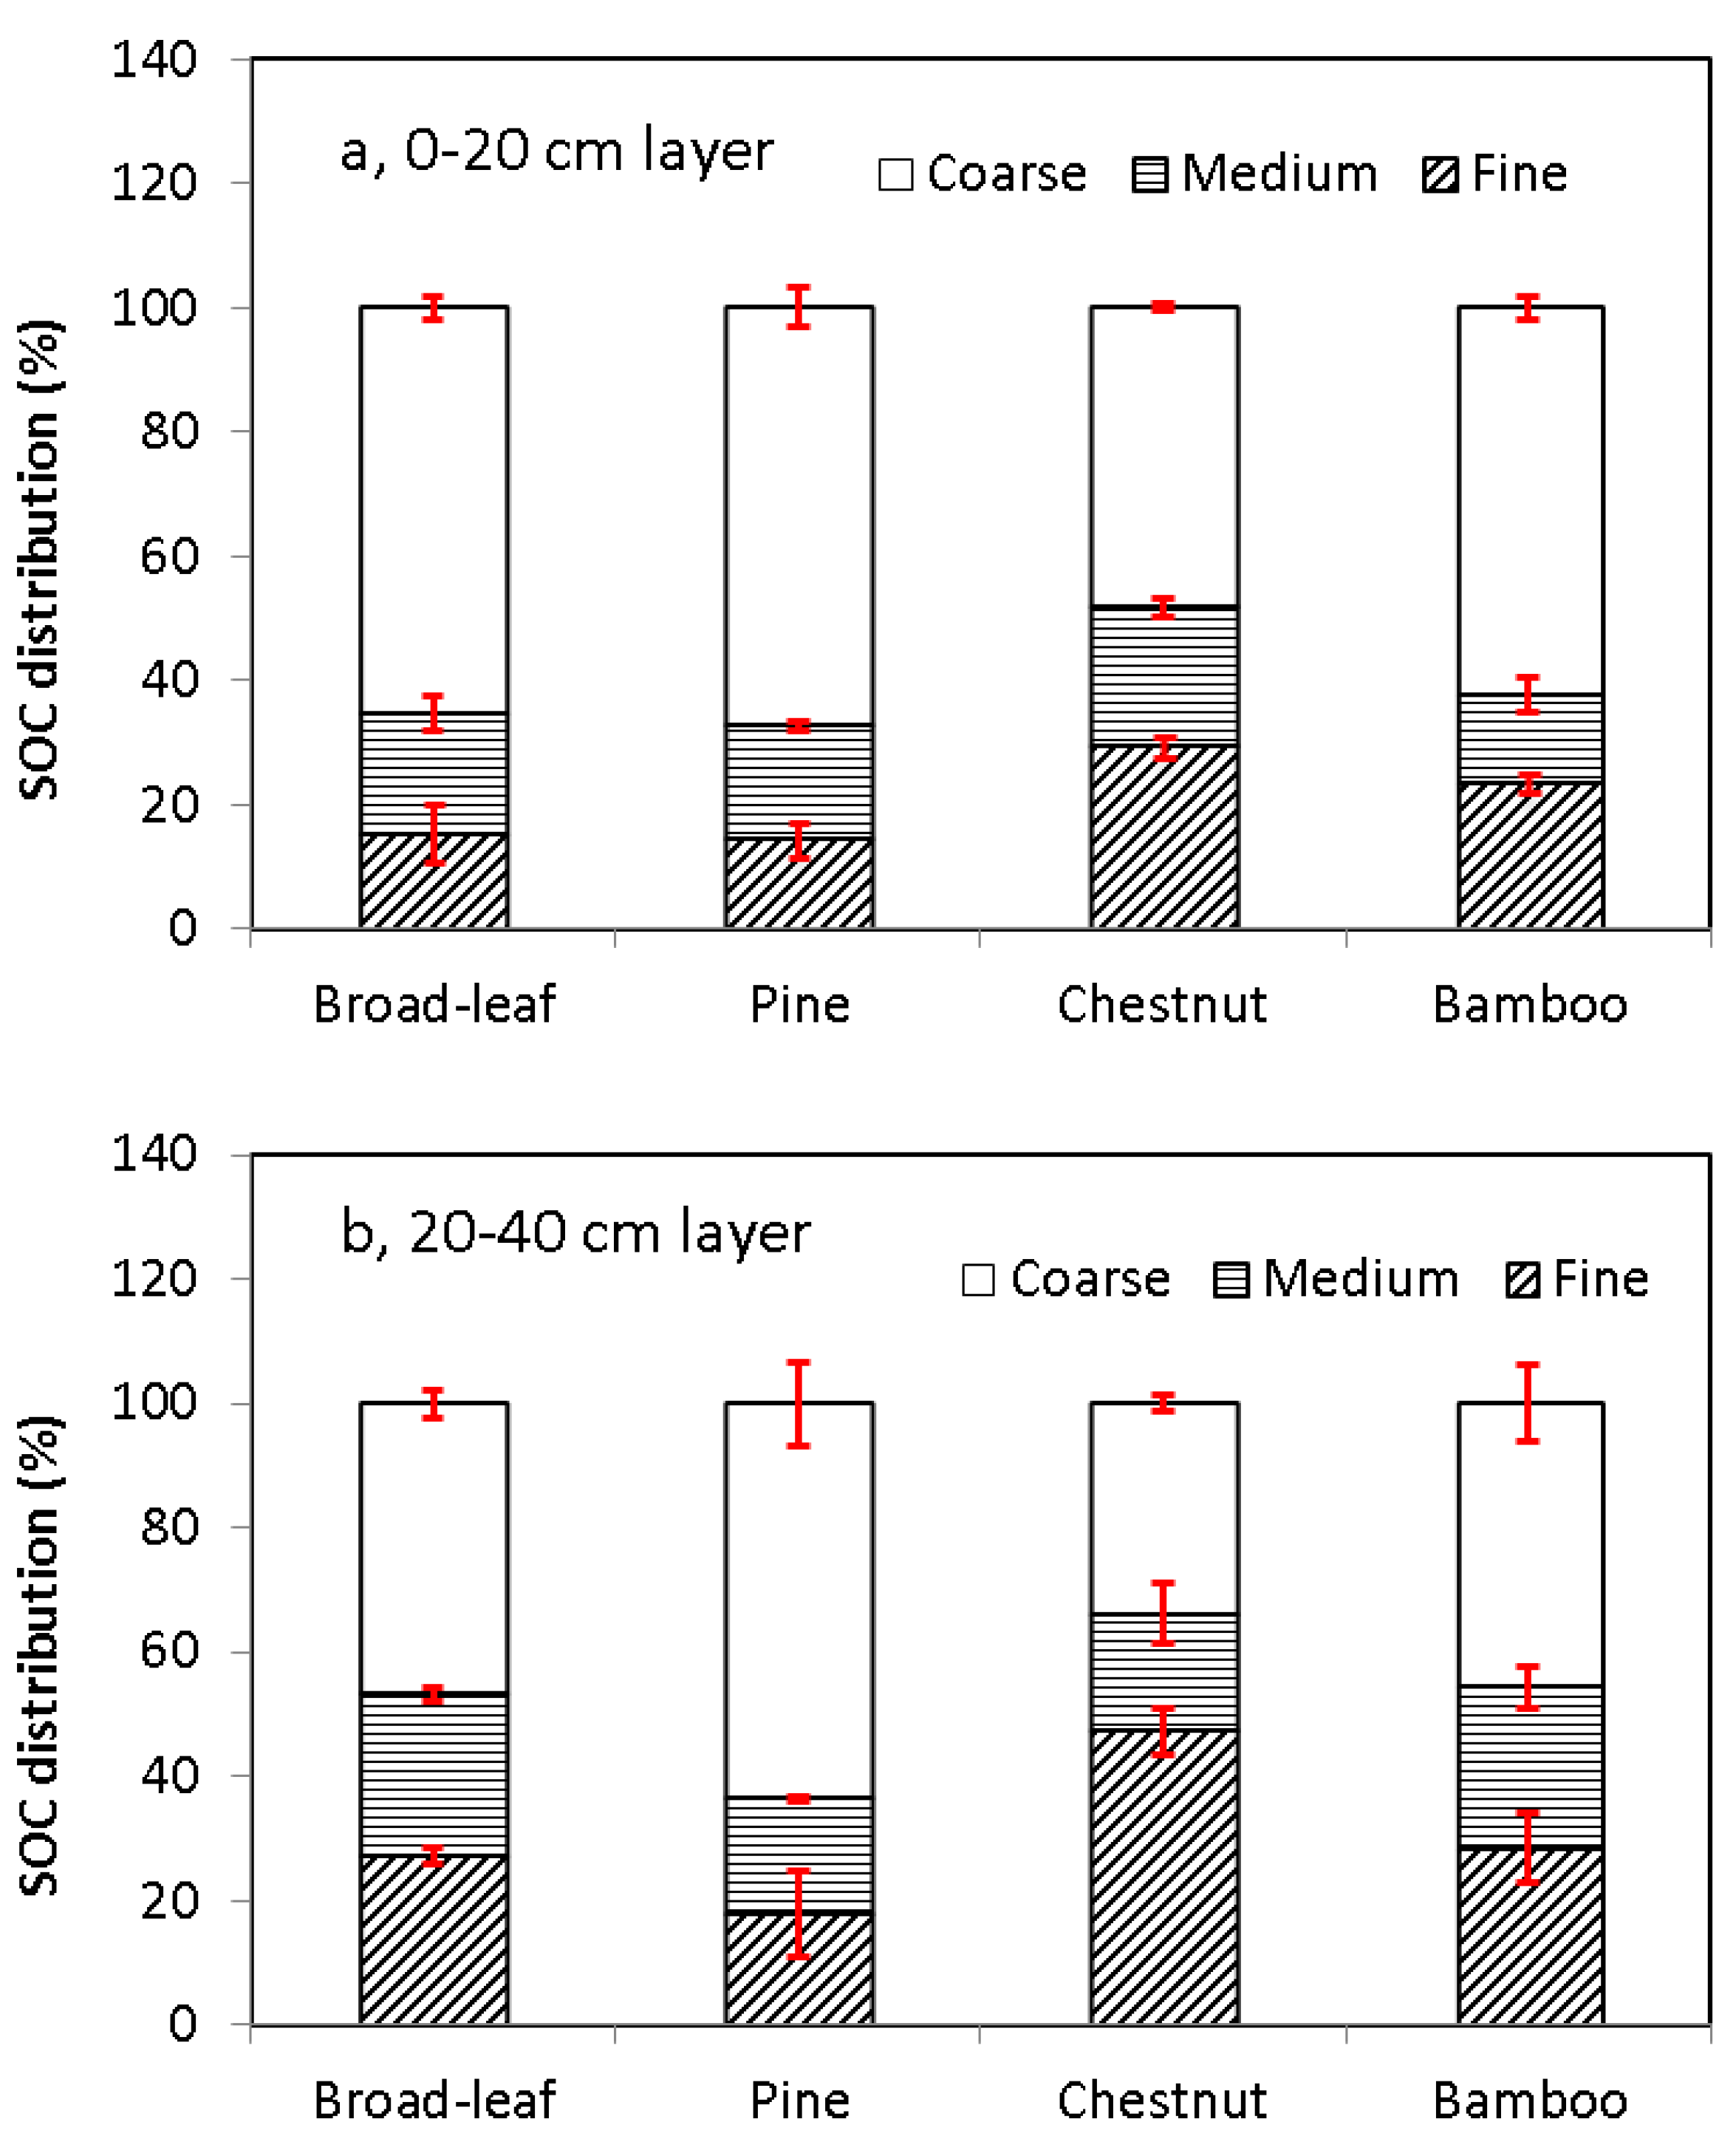
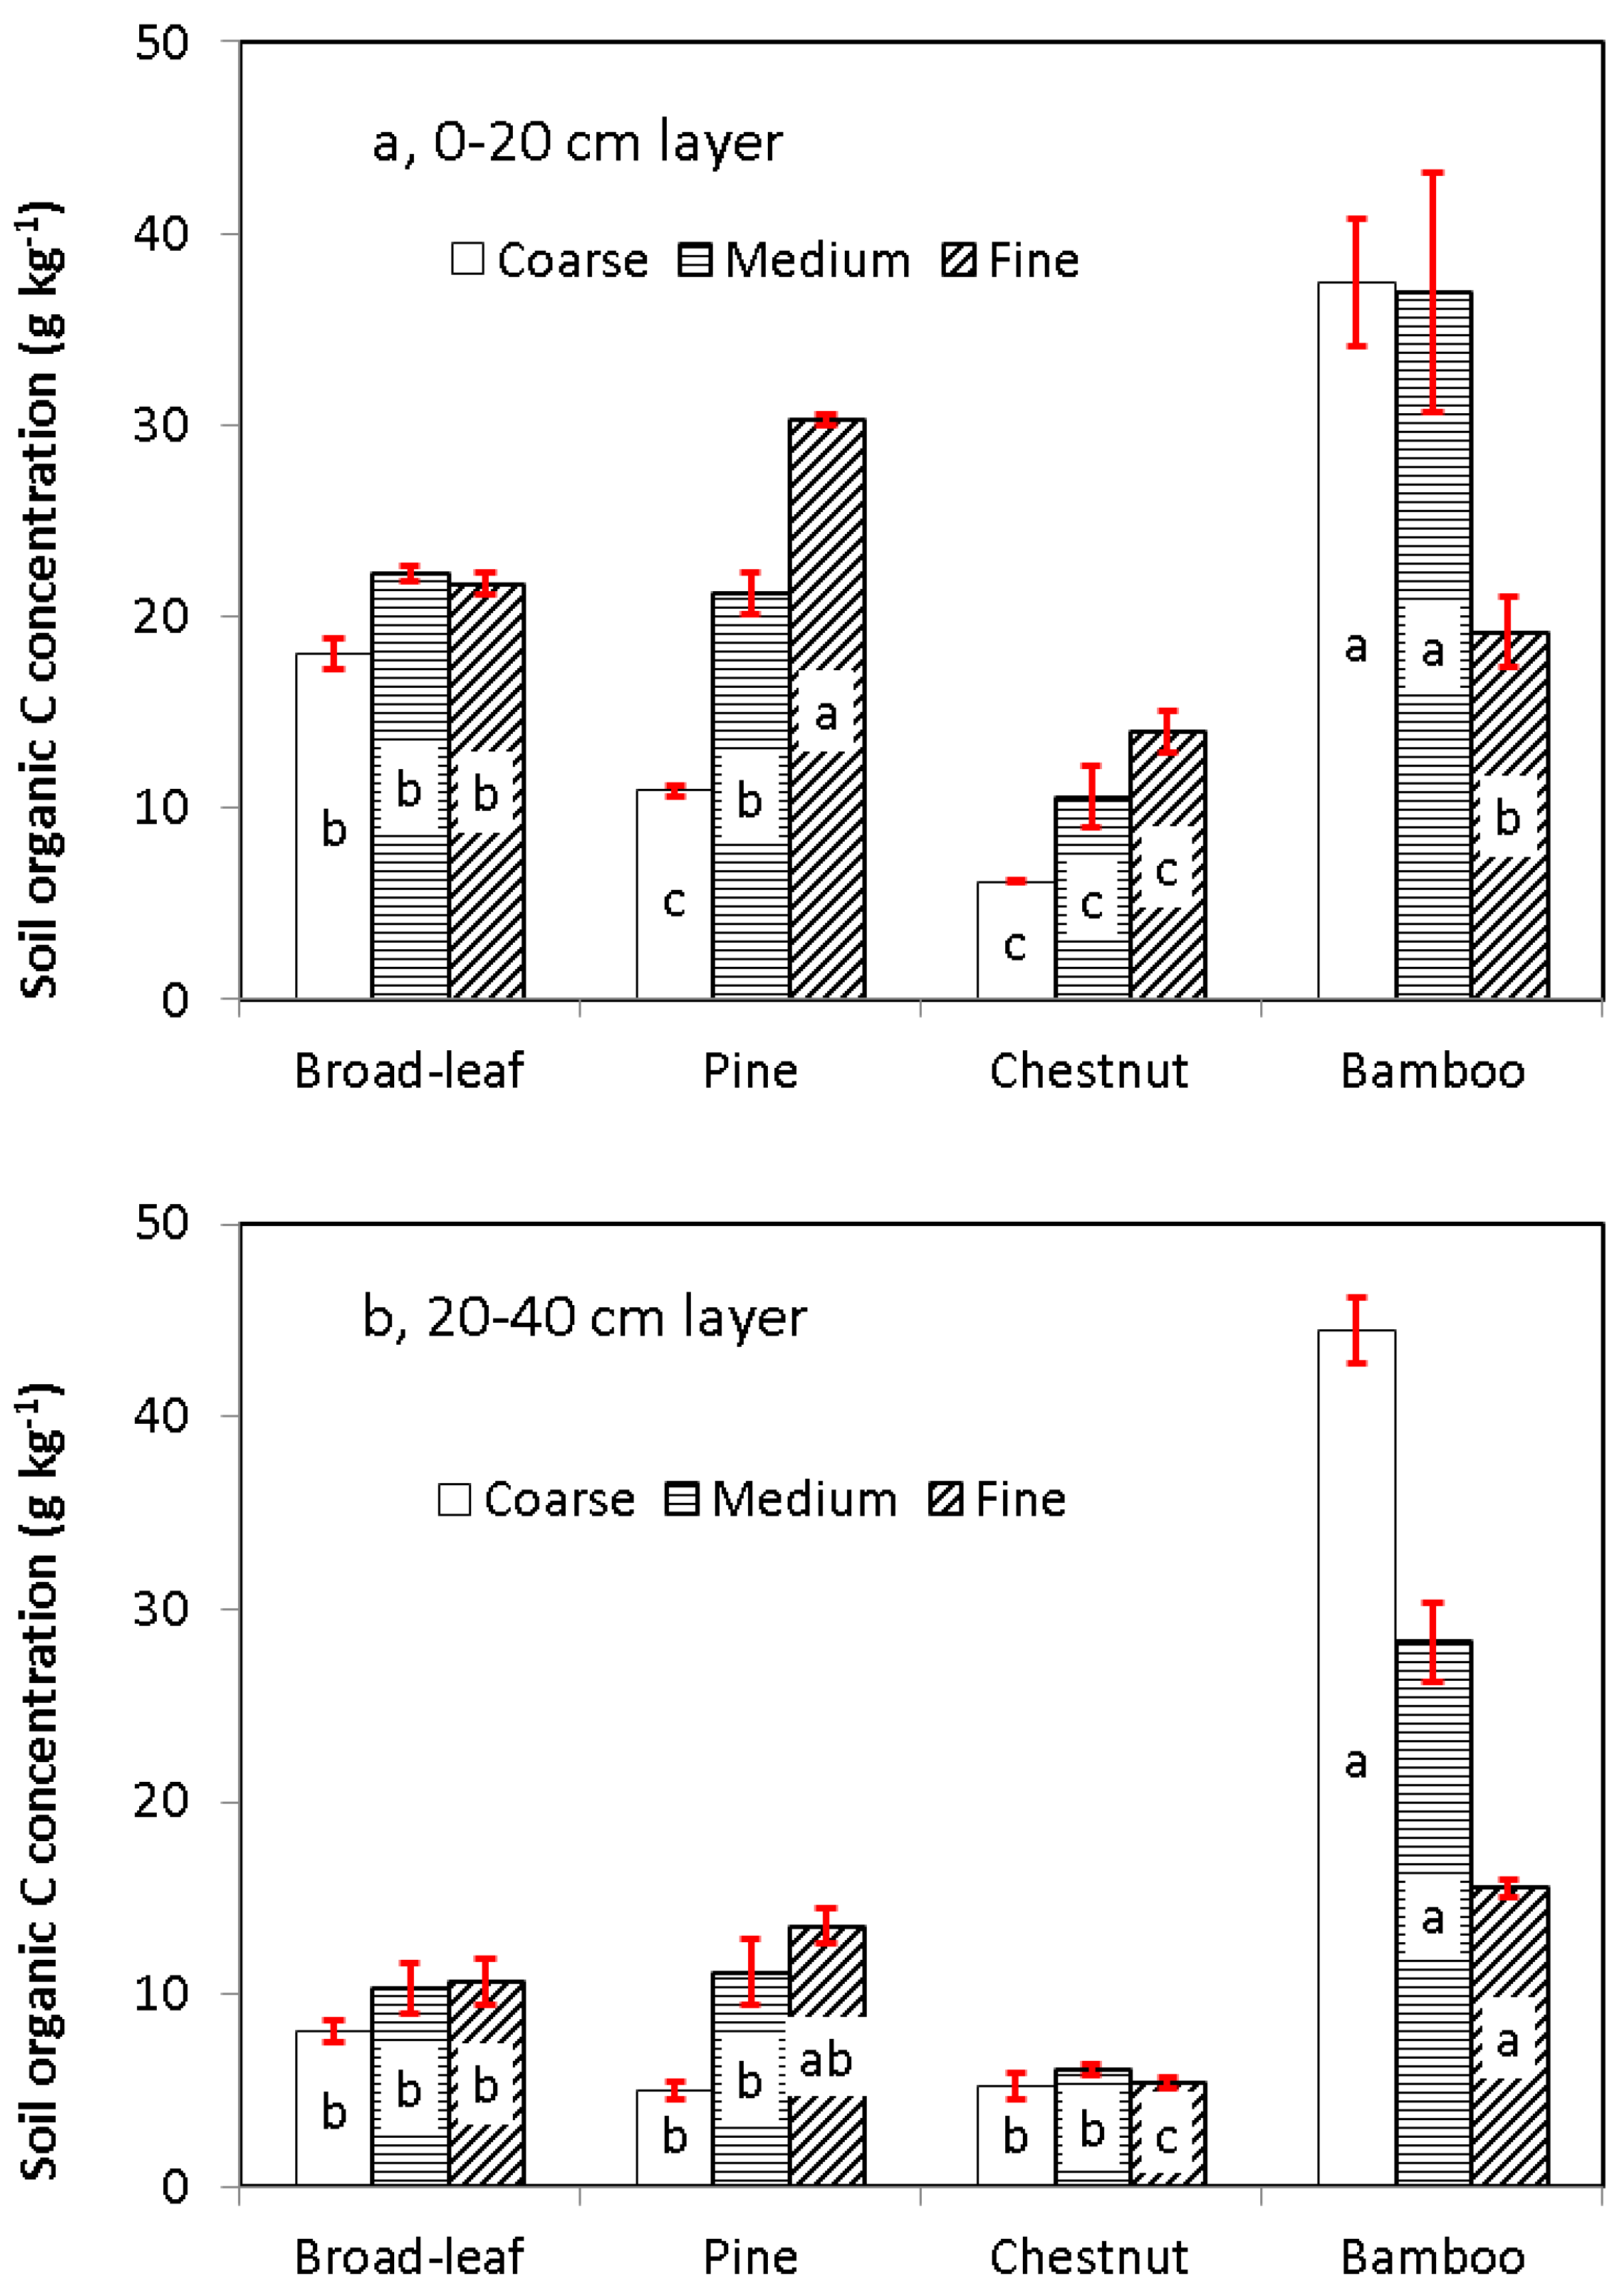
3.2. Distribution of Soil C in Particle Size Fractions

In the 0–20-cm soil layer, the SOC concentration in the coarse- and medium-sized fractions was greater in the bamboo than in the other three forest types (Figure 1). In the bamboo forest, SOC was higher in the coarse- and medium-sized fractions than in the fine fraction, but in the pine forest, the order was fine > medium > coarse fraction (Figure 1). No difference in SOC concentration among the size fractions was found in the broad-leaf and chestnut forests (Figure 1). The SOC concentration in the various fractions decreased with depth regardless of the forest type, except for the coarse fraction in the bamboo forest (Figure 1).
Figure 1. Soil organic carbon associated with different particle size fractions in the (a) 0–20-cm layer and (b) 20–40-cm layer under four types of forest vegetation-land use. Concentrations are per soil fraction mass. Means labeled with different lowercase letters are different between the vegetation-land use types within each particle size fraction. The three size fractions are coarse (>250 μm), medium (250–53 μm) and silt-clay fractions (<53 μm).
Forests 05 01391 g001
Taking the SOC concentration and the particle size distribution (Table 1) together, we found that most of the SOC was associated with the coarse fraction (c-SOC) in the broad-leaf, pine and bamboo forests (ranging from 47.3% to 71.1%), except only 31.5% was in the coarse fraction in the chestnut forest soil (Figure 2). In the chestnut forest, the majority of the SOC (~45%) was distributed in the fine fraction. The SOC associated with the medium fraction (m-SOC) was similar (21.7% to 25.4%) among broad-leaf, pine and chestnut forests, while the bamboo forest soil had the lowest fine fraction of SOC (f-SOC) concentration (15.4%) (Figure 2).
Figure 2. Mean SOC distribution (%) in particle size fractions in the (a) 0–20-cm soil layer and (b) 20–40-cm soil layer under four types of forest vegetation-land use. The three size fractions are coarse (>250 μm), medium (250–53 μm) and silt-clay fractions (<53 μm).
Forests 05 01391 g002
The c-SOC in the 20–40-cm soil layer was lower than that in the 0–20-cm layer. The c-SOC in the 20–40-cm soil layer was higher than SOC in any other size fraction in all vegetation-land use types other than in the chestnut forest soil (Figure 2). In contrast, the SOC distribution in the other size fractions increased with depth (Figure 2). A large increase (66%) was observed in SOC in the medium size fraction in the 20–40-cm soil layer as compared with the 0–20-cm layer in the bamboo forest soil.

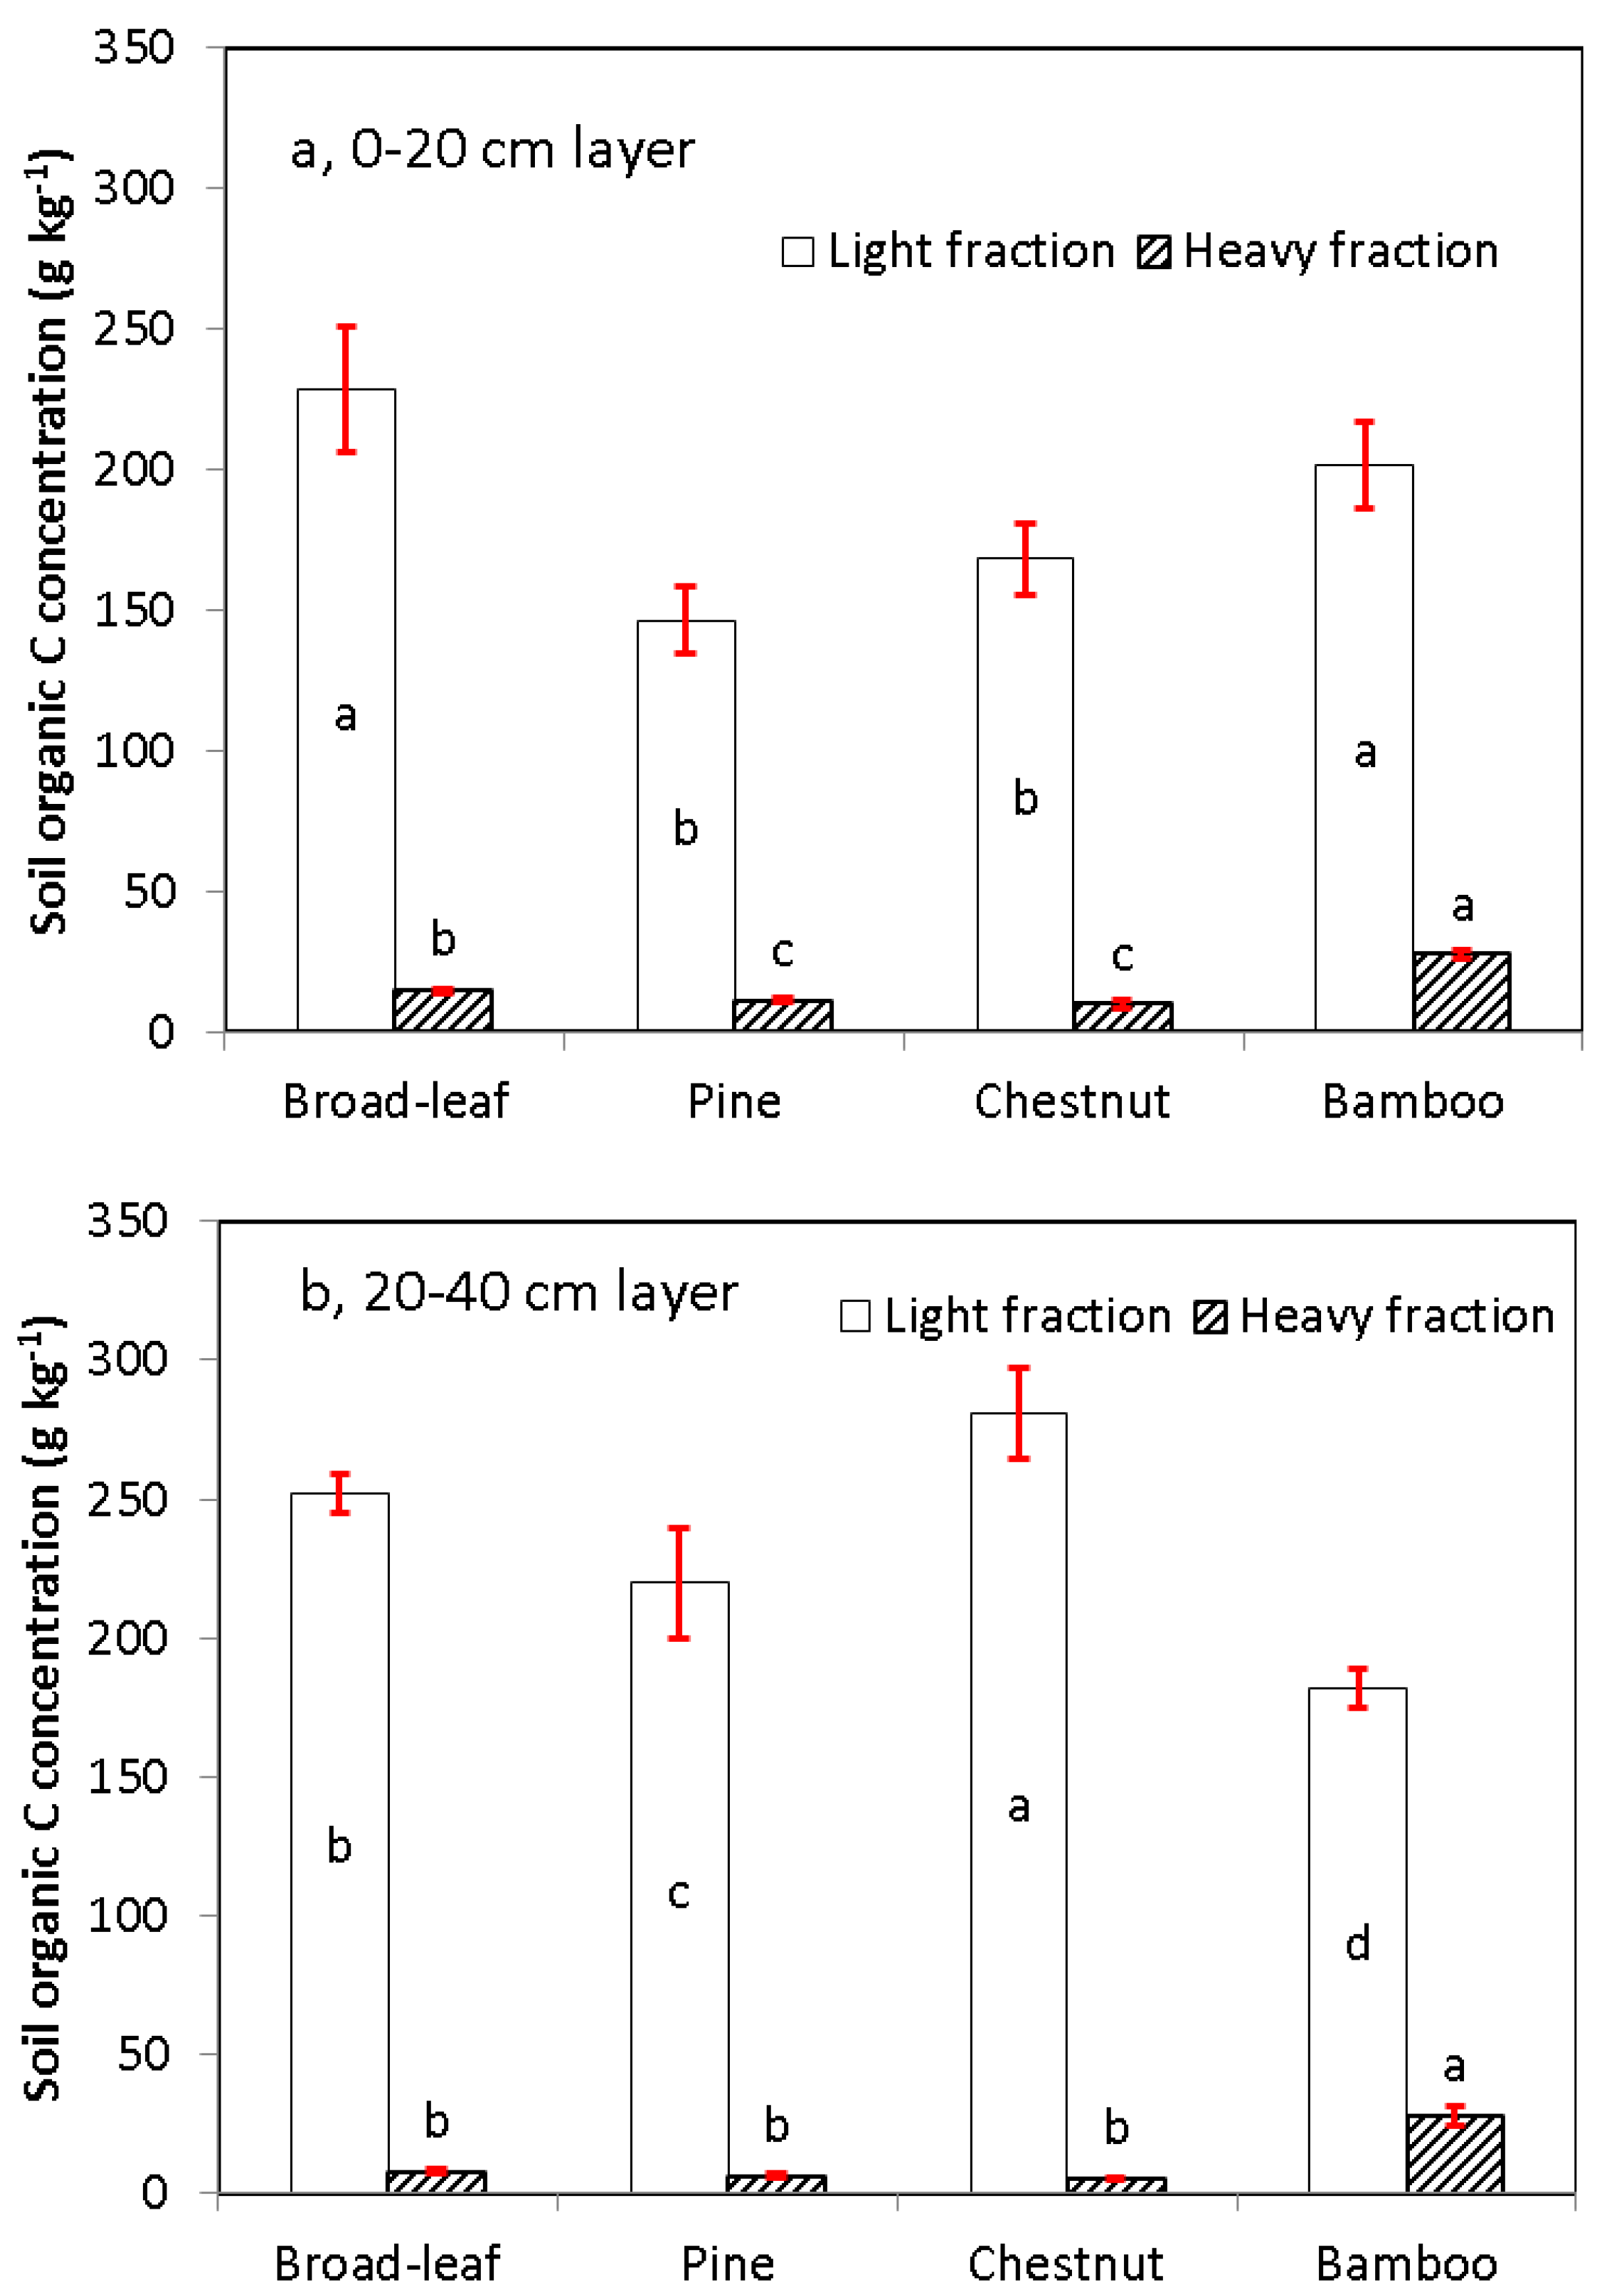
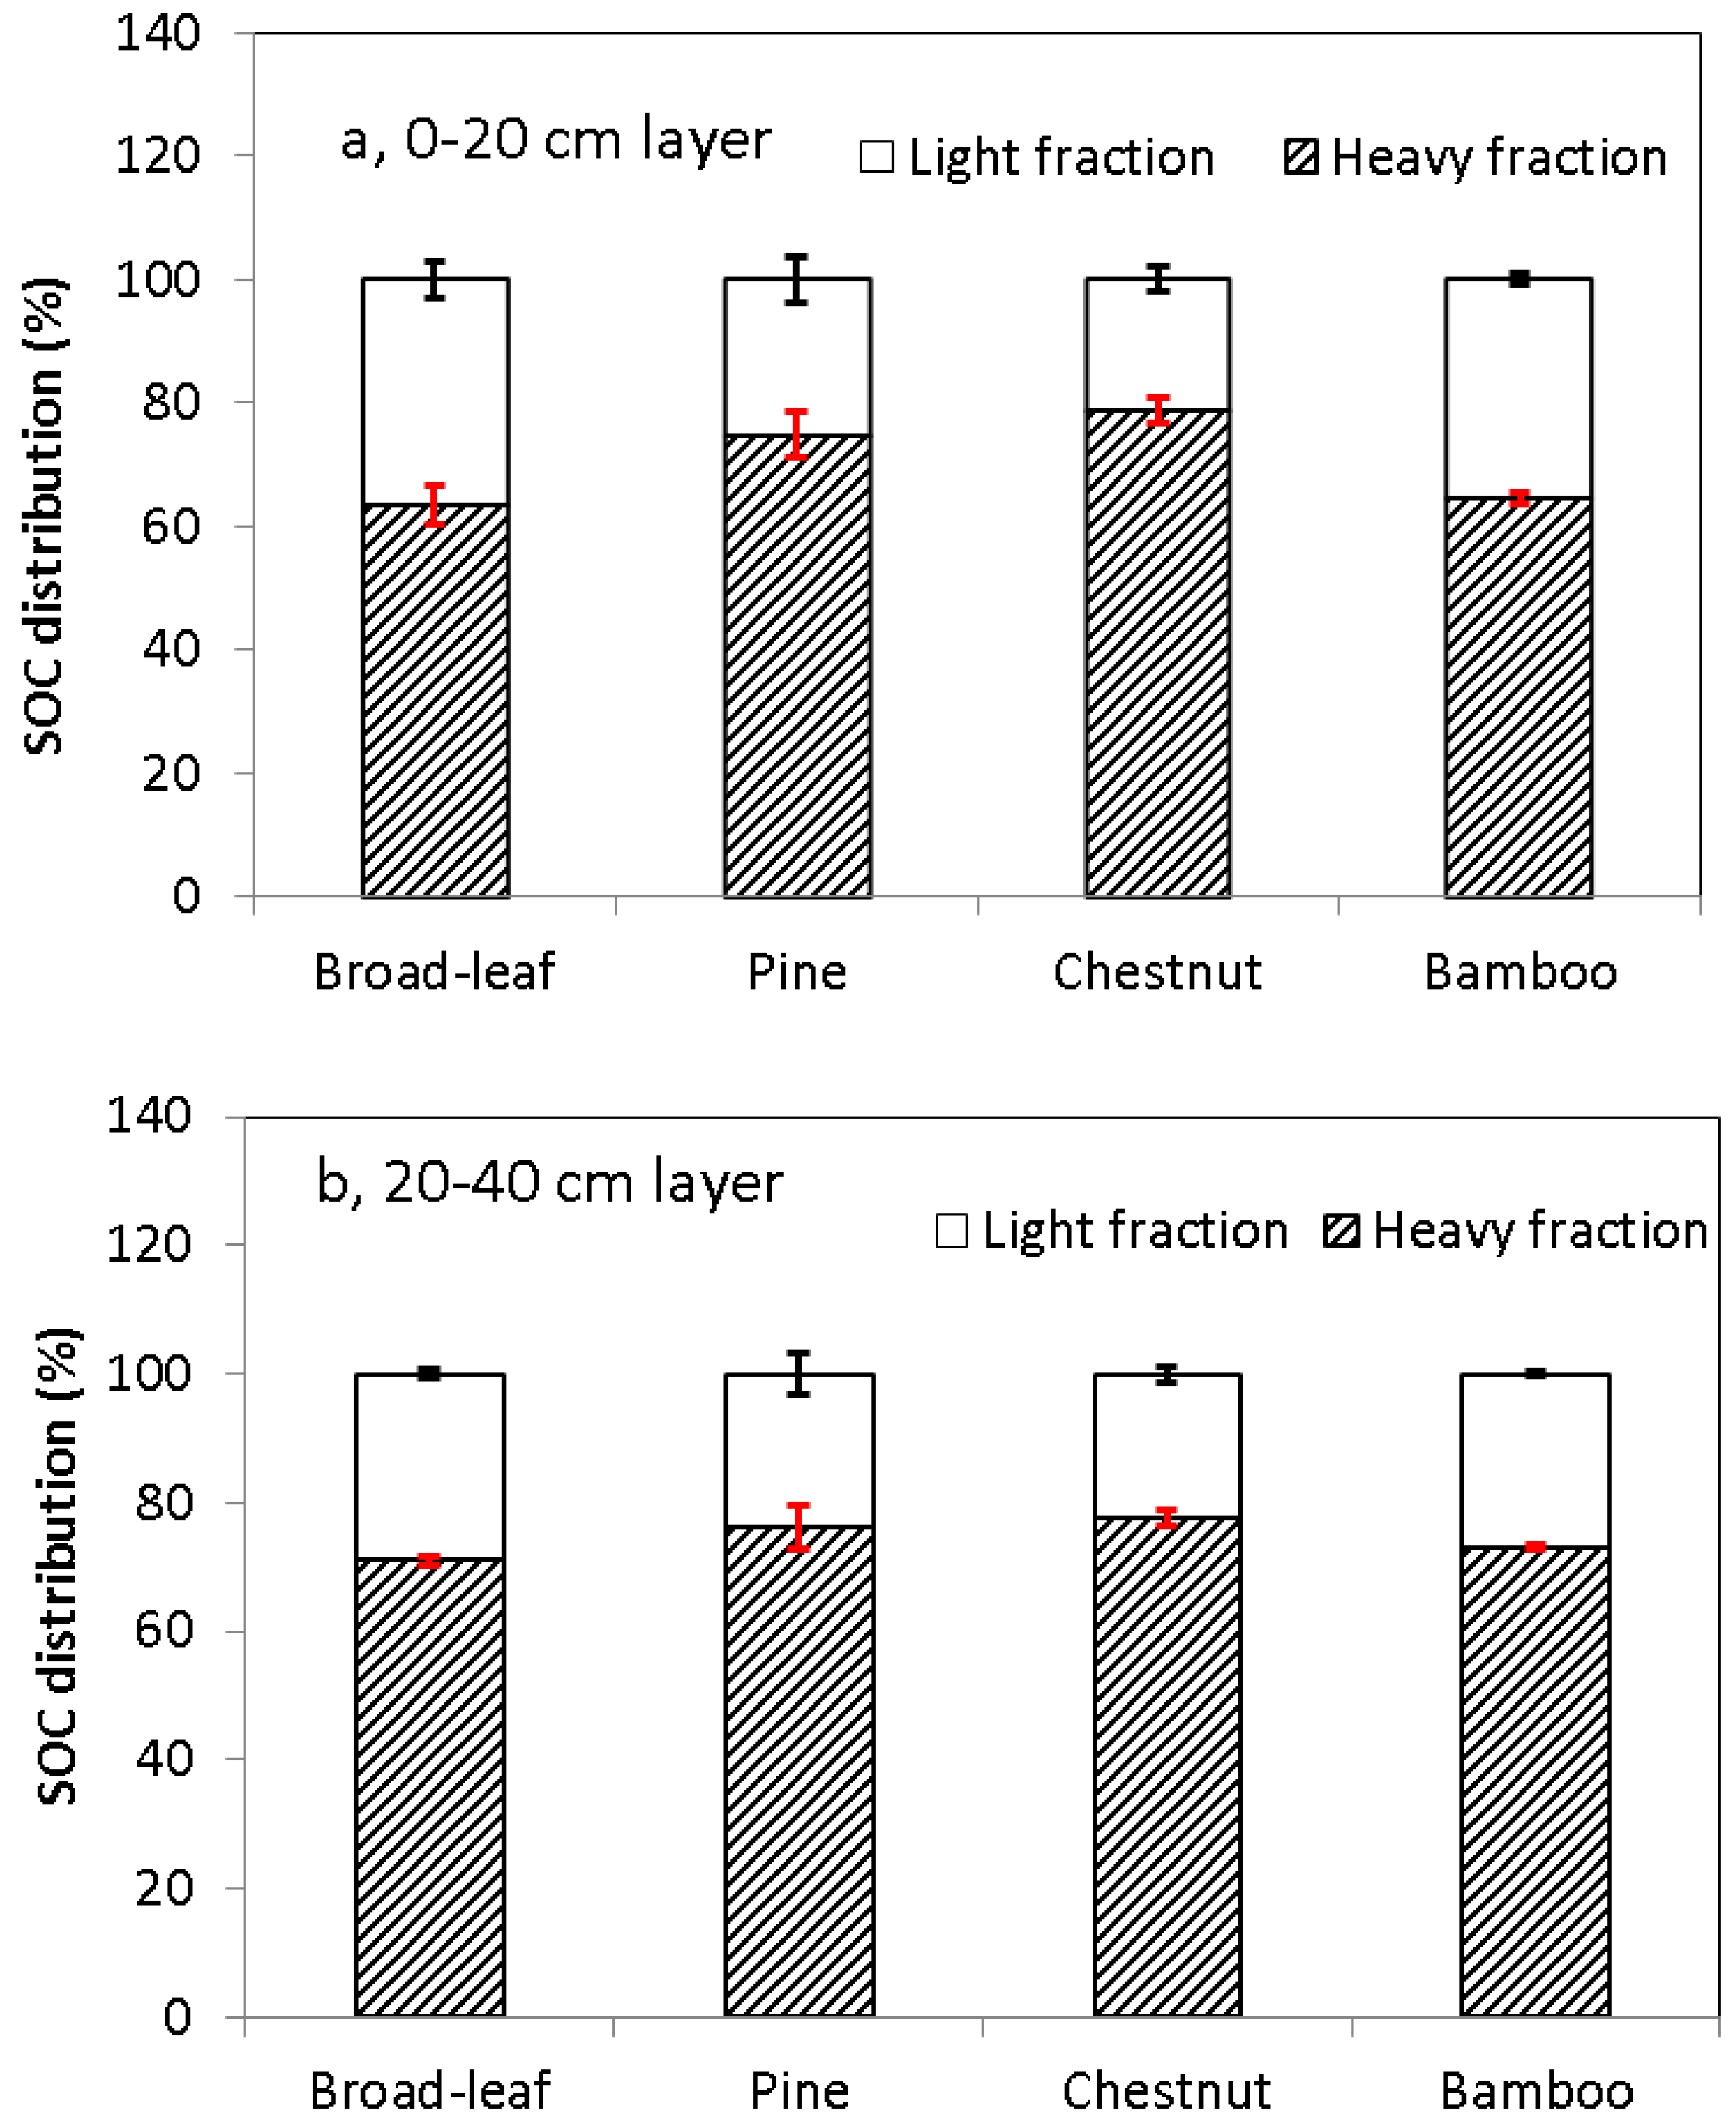
3.3. Soil Organic C in the Light and Heavy Fractions

In the 0–20-cm layer soil, the SOC concentration in the LF was higher in the broadleaf and bamboo than in the pine and chestnut forests, and the SOC in the HF had the following order: bamboo forest > broadleaf forest > pine and chestnut forest (Figure 3). In the 20–40-cm soil layer, the light fraction C (LF-C) concentration had the following order: chestnut forest > broadleaf forest > pine forest > bamboo forest (Figure 3). Heavy fraction C (HF-C) in the bamboo forest soil slightly decreased in the 20–40-cm soil layer when compared with the top soil layer, while the other three soils had an over 40% decrease. The LF-C to total SOC ratio in the 0–20-cm soil layer of broad-leaf and bamboo forest soils were 36.5% and 35.6%, respectively, which were slightly higher than those in the other two vegetation-land use types (Figure 4). The HF-C to total SOC ratio ranged from 63.5% to 78.8%, and this ratio increased in the 20–40-cm soil layer of the studied forest soils, except in the chestnutforest soil, which had almost the same ratio in both layers (Figure 4).
Figure 3. Soil organic carbon in light and heavy fractions in the (a) 0–20-cm layer and (b) 20–40-cm layer under four types of forest vegetation-land use. Soil organic C concentrations are per soil fraction mass. Means labeled with different lowercase letters are different between the vegetation-land use types within each density fraction.
Forests 05 01391 g003
Figure 4. Mean distribution of organic carbon in light and heavy fractions in the (a) 0–20-cm soil layer and (b) 20–40-cm soil layer under four types of forest vegetation-land use.
Forests 05 01391 g004

4. Discussion

4.1. Forest Vegetation-Land Use Type Affected Soil C in Particle Size Fractions

Physical protection is one of the main mechanisms for soil C stabilization that is directly related to soil texture and structure [41,42]. The C associated with soil particles, especially clay- and silt-sized particles, has reduced accessibility for enzymes and microbial organisms, lowering the C turnover rate [43,44]. Thus, soils with higher clay and silt contents would sequester more SOC than soils with less fine fractions, even when the amount of OM input was the same. However, the capacity of physical protection for SOC stabilization is not unlimited according to research conducted in the Harden region in the Netherlands [23]. Carter et al. [45] studied soils in eastern Canada and found that C in the <50-μm fraction (g·C·kg−1 Soil) = 9.04 + 0.27 × % particles <50 μm. Based on this equation and the percent of particles distributed in the <50-μm size fraction in our soils, we consider that the capacity for physical protection in the four vegetation-land use types has not been exceeded, as the amount of organic C distributed in that size fraction determined for our soil was less than the values calculated using the equation.
Soil C concentration may largely depend on belowground and underground biomass production and input through litter fall, root exudation and the addition of plant residue [46,47,48]. The most interesting result regarding SOC concentrations in the different particle size fractions is the very high SOC concentration in the coarse fraction in the bamboo forest (Figure 1). This likely indicated the impact of the large quantities of mulching material applied on SOC incorporation into the coarse fraction; the SOC concentration in those intensively managed bamboo forest soils have been found to increase quickly over time [30]. Our data indicate that most of the large amount of SOC accumulated in the bamboo forest soil was present in the relatively unstable coarse fraction and is subject to mineralization. The higher SOC concentration in the fine fraction in the bamboo forest relative to that in the other forest soils (Figure 1) likely resulted from cultivation through which the SOC-rich surface material had been incorporated into the deeper layers. The surprisingly high SOC concentration in the fine fraction in the pine forest relative to other forest types (Figure 1) indicated that the product of soil organic matter decomposition was more stable in the pine forest.

4.2. Forest Vegetation-Land Use Type Affected Soil C in Soil Density Fractions

The range of SOC in the LF (146 to 281 g·C·kg−1 of fraction, Figure 3) in our study is similar to the 256–296 g·C·kg−1 in the LF reported in Barrios et al. [49], 170–49 g·C·kg−1 in Shen et al. [50] and 191–252 g·C·kg−1 in Xu et al. [51]. The SOC concentration in the LF was much higher than that in the HF (5–28 g·C·kg−1) or in the bulk soil (5–34 g·C·kg−1).
The ratio of LF-C to total SOC (21.2%–36.5%) in this study is within the range of 4%–60% suggested by Boone [52]. Among the investigated forest soils, the broad-leaf forest soil had the largest LF-C, followed by bamboo, pine and chestnut forest soils. The ratio of LF-C to total SOC was 25.3% in the pine forest soil, which was similar to that of the Pinus Massoniana forest soil in Changting in Fujian province [53] and the Slash pine soil in Florida in the United States [54], lower than that of soils in Dahurian larch, Quercus liaotungensis [55] and natural pine forests [56]. However, the ratio was higher than that in soils under American five-leaved pine and Acer saccharum Marsh soil. The LF-C to total SOC ratio in the surface layer in the chestnut forest soil was 21.2%, which was similar to the chestnut forest soil in Changting, Fujian province [53]. This significant difference in soils with different forest stands may be caused by: (1) the density of the fractionation liquid used [57]; (2) the soil dispersion; and (3) the geographic location, altitude, climate, soil type, vegetation, land management and sampling date.
The LF-C to total SOC ratio was both higher in the broad-leaf and bamboo forest soils (Figure 3). The broad-leaf forest had a more complex community structure and richer plant species diversity. This forest type had large aboveground biomass and had greater amounts of litter fall, which was the main source of LF-C in the forest ecosystem, leading to the greater LF-C concentration in the broad-leaf forest. The LF in the bamboo forest soil came from anthropogenic input, the straw and rice chaff placed on the soil surface to increase soil temperature during winter; the large quantities of mulching material placed on the soil surface increased the LF-C concentration in the surface layer. The chestnut forest soil had the lowest LF-C concentration, because of the relatively young forest age; the young trees produced little litter fall. In addition, there was almost no understory in this forest type because of tillage and weed control. The tillage practices likely increased the mineralization rates of the soil organic matter as compared with the other three forest soils. Tillage and weed control would substantially reduce the physical protection on LF-C [58].
In this study, we found that bamboo forest soil had much higher HF-C (27.71 g·C·kg−1) than the other three forest soils. This may be caused by long-term mineral fertilizer application, as well as straw and rice chaff coverage during winter; the decomposition of the mulching material provided an abundance of organic acids for complexation with soil mineral particles and the formation of HF-C [59,60]. The HF-C to total SOC ratio was 63.5%–78.8% in the four forest soils. The HF-C was the main component of SOC, which was important for the maintenance of soil fertility and for soil C sequestration [61].

4.3. Land Management Affected SOC Distribution

Land management practices can markedly affect the content and distribution of SOC in different vegetation types [29,46,62,63]. Among the four forest vegetation-land use types studied in this research, the broad-leaf and pine forests were natural forests with long rotations and were minimally affected by human activities. Even though the SOC concentration was relatively low in those forest soils, the percent of SOC associated with silt-clay fractions was high in both forest soils. The chestnut and bamboo forests were plantation forests with different land use management practices, which had significantly different C distribution patterns. The chestnut forest was operated with tillage and weeding, thus having the smallest aboveground biomass and litter fall. In addition, the chestnut forest was the youngest stand. The soil under this forest vegetation-land use had the lowest LF-C, HF-C and SOC in the different particle size fractions.
The bamboo forest was managed by intensive farming, with the soil surface covered by straw and rice chaff each winter, resulting in high LF-C and HF-C. However, the SOC distribution is as LF-C, and c-SOC was high in the bamboo forest under intensive farming; both SOC types belong to labile C pools with a fast turnover rate and poor stability. They would be more sensitive to land use management than the total SOC [61,64]. Soil C stability is considered high when it exists as HF-C or in the fine fraction of SOC. Furthermore, there was a close relationship between HF-C and SOC in the fine fraction, with a small percentage of SOC in the fine fraction and most of the SOC in the coarse fraction as LF-C [9]. Thus, increasing the silt-clay content would increase the organic C stability in the soil. While the silt-clay content in a soil is difficult to alter, the silt-clay content among the different soils is affected by the parent material, land use, vegetation type and management practices, resulting in differences in the degree of the stabilization of organic C in the soil.

5. Conclusions

The SOC concentration and its distribution in different particle size and density fractions were affected by vegetation-land use type and the associated management regime in four common forest land use types in subtropical China. Soil total organic C decreased in the order bamboo forest > broad-leaf forest > pine forest > chestnut forest, reflecting both the effect of vegetation-land use type and the intensive forest management practice in the bamboo forest. Intensive farming in the bamboo forest where a large amount of organic mulch material was added to the soil surface annually caused the bamboo forest soil to have the highest total SOC among the forest types studied. On the other extreme, disturbance from tillage and weed control without external organic matter input in the young chestnut forest likely led to the lowest total SOC and its distribution in the different particle size and density fractions. The SOC was mostly distributed in the coarse fraction in both studied soil layers in all studied forest soils, except in the chestnut forest soil, in which the SOC was mostly distributed in the silt and clay fractions (Figure 2). This study indicates that it is possible to use vegetation-land use type and management practices to influence the size and distribution of SOC in different soil fractions to alter the ecological services of forests.

Acknowledgments

The authors wish to acknowledge the funding from the Natural Science Foundation of China (No. 31270667), and the key Fund of Science and Technology of Zhejiang Province (No: LZ12C16003). SXC and LS were supported by the Natural Sciences and Engineering Research Council of Canada (NSERC).

Author Contributions

Suyun Shang and Peikun Jiang designed the experiment. Suyun Shang, Zhaoliang Song and Juan Liu collected and analyzed the data. Suyun Shang, Peikun Jiang and Scott X. Chang prepared the Tables and Figures. Suyun Shang, Peikun Jiang, Scott X. Chang and Lei Sun wrote part of the manuscript.

Conflicts of Interest

The authors declare no conflict of interest.

References

  1. Post, W.M.; Emanuel, M.R.; Zinke, P.J.; Stangenberger, A. Soil carbon pools and world life zones. Nature 1982, 298, 156–159. [Google Scholar] [CrossRef]
  2. Eswaran, H.; van den Berg, E.; Reich, P. Organic carbon in soils of the world. Soil Sci. Soc. Am. J. 1993, 57, 192–194. [Google Scholar] [CrossRef]
  3. Batjes, N.H. The total C and N in soils of the world. Eur. J. Soil Sci. 1996, 47, 151–163. [Google Scholar] [CrossRef]
  4. Karlen, D.L.; Rosek, M.J.; Gardner, J.C.; Allan, D.L.; Alms, M.J.; Bezdicek, D.F.; Flock, M.; Huggins, D.R.; Miller, B.S.; Staben, M.L. Conservation reserve program effects on soil quality indicators. J. Soil Water Conserv. 1999, 54, 439–444. [Google Scholar]
  5. Smith, O.H.; Petersen, G.W.; Needelman, B.A. Environmental indicators of agroecosystems. Adv. Agron. 2000, 69, 75–97. [Google Scholar]
  6. Yonekura, Y.; Ohta, S.; Kiyono, Y.; Aksa, D.; Morisada, K.; Tanaka, N.; Tayasu, I. Soil organic matter dynamics in density and particle-size fractions following destruction of tropical rainforest and the subsequent establishment of Imperata grassland in Indonesian Borneo using stable carbon isotopes. Plant Soil 2013, 372, 683–699. [Google Scholar] [CrossRef]
  7. Teklay, T.; Chang, S.X. Temporal changes in soil carbon and nitrogen storage in a hybrid poplar chronosequence in northern Alberta. Geoderma 2008, 144, 613–619. [Google Scholar] [CrossRef]
  8. Golchin, A.; Oades, J.M.; Skjemstad, J.O.; Clarke, P. Soil structure and carbon cycling. Aust. J. Soil Res. 1994, 32, 1043–1068. [Google Scholar] [CrossRef]
  9. Six, J.; Guggenberger, G.; Paustian, K.; Haumaier, L.; Elliott, E.T.; Zech, W. Sources and composition of soil organic matter fractions between and within soil aggregates. Eur. J. Soil Sci. 2001, 52, 607–618. [Google Scholar] [CrossRef]
  10. Olk, D.C.; Gregorich, E.G. Overview of the symposium proceedings, “Meaningful pools in determining soil carbon and nitrogen dynamics”. Soil Soc. Am. J. 2006, 70, 967–974. [Google Scholar] [CrossRef]
  11. Cambardella, C.A.; Elliott, E.T. Methods for physical separation and characterization of soil organic fractions. Geoderma 1993, 56, 449–457. [Google Scholar] [CrossRef]
  12. Guggenberger, G.; Christensen, B.T.; Zech, W. Land use effects on the composition of organic matter in particle-size separates of soil (I): Lignin and carbohydrate signature. Eur. J. Soil Sci. 1994, 45, 449–458. [Google Scholar] [CrossRef]
  13. Christensen, B.T. Physical fractionation of soil and structural and functional complexity in organic matter turnover. Eur. J. Soil Sci. 2001, 52, 345–353. [Google Scholar] [CrossRef]
  14. Chefetz, B.; Tarchitzky, J.; Deshmukh, A.P.; Hatcher, P.G.; Chen, Y. Structural characterization of soil organic matter and humic acids in particle-size fractions of an agricultural soil. Soil Sci. Soc. Am. J. 2002, 66, 129–141. [Google Scholar] [CrossRef]
  15. Arevalo, C.B.M.; Chang, S.X.; Bhatti, J.S.; Sidders, D. Mineralization potential and temperature sensitivity of soil organic carbon under different land uses in the Parkland region of Alberta, Canada. Soil Sci. Soc. Am. J. 2012, 76, 241–251. [Google Scholar] [CrossRef]
  16. Dalal, R.C.; Mayer, R.J. Long-term trends in fertility of soil under continuous cultivation and cereal crop-ping in southern Queensland, IV. Loss of organic carbon from different density fractions. Aust. J. Soil Res. 1986, 24, 301–309. [Google Scholar] [CrossRef]
  17. Li, J.J.; Zhao, X.; Pan, T.H. Influence of land use on soil labile organic carbon. J. Soil Water Conserv. 2011, 25, 147–151. [Google Scholar]
  18. Mills, R.T.E.; Tipping, E.; Bryant, C.L.; Emmett, B.A. Long-term organic carbon turnover rates in natural and semi-natural topsoils. Biogeochemistry 2014, 118, 257–272. [Google Scholar] [CrossRef]
  19. Baisden, W.T.; Parfitt, R.L.; Ross, C.; Schipper, L.A.; Canessa, S. Evaluating 50 years of time-series soil radiocarbon data: Towards routine calculation of robust C residence times. Biogeochemistry 2013, 112, 129–137. [Google Scholar] [CrossRef]
  20. Cambardella, C.A.; Elliott, E.T. Particulate soil organic matter changes across a grassland cultivation sequence. Soil Sci. Soc. Am. J. 1992, 56, 777–783. [Google Scholar] [CrossRef]
  21. Chan, K.Y. Soil particulate organic carbon under different land use and management. Soil Use Manag. 2001, 17, 217–221. [Google Scholar] [CrossRef]
  22. Fang, H.J.; Yang, X.M.; Hang, X.P. Spatial distribution of particulate organic carbon and aggregate associated carbon in topsoil of a sloping farmland in the Black Soil region, Northeast China. Acta Ecol. Sin. 2006, 26, 2847–2854. [Google Scholar]
  23. Hassink, J.; Whitmore, A.P.; Jaromir, K. Size and density fractionation of soil organic matter and the physical capacity of soils to protect organic matter. Eur. J. Agron. 1997, 7, 189–199. [Google Scholar] [CrossRef]
  24. Jiang, Y.; Dou, S. Effect of organic materials application on the properties of humic substances in organo-mineral complexes of soils I. Effect of organic materials on the organo-mineral complexation and forms of humus. Acta Pedol. Sin. 1987, 24, 97–104. [Google Scholar]
  25. Yang, X.M.; Zhang, X.P.; Fang, H.J. Importance of agricultural soil sequestering carbon to offsetting global warming. Sci. Geogr. Sin. 2003, 23, 101–107. [Google Scholar]
  26. Mujuru, L.; Mureva, A.; Velthorst, E.J.; Hoosbeek, M.R. Land use and management effects on soil organic matter fractions in Rhodic Ferralsols and Haplic Arenosols in Bindura and Shamva districts of Zimbabwe. Geoderma 2013, 209, 262–272. [Google Scholar]
  27. Meyer, S.; Leifeld, J.; Bahn, M.; Fuhrer, J. Land-use change in subalpine grassland soils: Effect on particulate organic carbon fractions and aggregation. J. Plant Nutr. Soil Sci. 2012, 175, 401–409. [Google Scholar]
  28. Yu, Y.F.; Lu, L.X.; Du, H.; Peng, W.X.; Zeng, F.P.; Song, T.Q. Distribution of organic carbon and aggregation of calcareous soil in different forest types. Acta Bot. Boreali-Occident. Sin. 2013, 33, 1011–1019. [Google Scholar]
  29. Li, Y.F.; Zhang, J.J.; Chang, S.X.; Jiang, P.K.; Zhou, G.M.; Shen, Z.M.; Wu, J.S.; Lin, L.; Wang, Z.S.; Shen, M.C. Converting native shrub forests to Chinese chestnut plantations and subsequent intensive management affected soil C and N pools. For. Ecol. Manag. 2014, 312, 161–169. [Google Scholar] [CrossRef]
  30. Li, Y.F.; Jiang, P.K.; Chang, S.X.; Wu, J.S.; Lin, L. Organic mulch and fertilization affect soil carbon pools and forms under intensively managed bamboo (Phyllostachys praecox) forests in southeast China. J. Soils Sediments 2010, 10, 739–747. [Google Scholar] [CrossRef]
  31. State Soil Survey Service of China. In Chinese Soils; China Agricultural Press: Beijing, China, 1998. (In Chinese)
  32. IUSS Working Group WRB. World Reference Base for Soil Resources 2006; World Soil Resources Reports No. 103; FAO: Rome, Italy, 2006. [Google Scholar]
  33. Zhou, G.M.; Jin, A.W.; He, J.C.; Wang, A.G. The influence of cultivation techniques used in covered protected plots on the high-yield property of Lei bamboo plantation for edible shoots. J. South-Cent. For.Univ. 1999, 19, 52–54. (In Chinese) [Google Scholar]
  34. Tan, Z.; Lal, R.; Owens, L.; Izaurralde, R.C. Distribution of light and heavy fractions of soil organic carbon as related to land use and tillage practice. Soil Tillage Res. 2007, 92, 53–59. [Google Scholar] [CrossRef]
  35. Griepentrog, M.; Schmidt, M.W.I. Discrepancies in utilization of density fractionation along with ultrasonic dispersion to obtain distinct pools of soil organic matter. J. Plant Nutr. Soil Sci. 2013, 176, 500–504. [Google Scholar] [CrossRef]
  36. Cerli, C.; Celi, L.; Kalbitz, K.; Guggenberger, G.; Kaiser, K. Separation of light and heavy organic matter fractions in soil-Testing for proper density cut-off and dispersion level. Geoderma 2012, 170, 403–416. [Google Scholar] [CrossRef]
  37. Crow, S.E.; Swanston, C.W.; Lajtha, K.; Brooks, J.R.; Keirstead, H. Density fractionation of forest soils: Methodological questions and interpretation of incubation results and turnover time in an ecosystem context. Biogeochemistry 2007, 85, 69–90. [Google Scholar] [CrossRef]
  38. Nelson, D.W.; Sommers, L.E. Total Carbon, Organic Carbon, and Organic Matter. In Methods of Soil Analysis, 2nd ed.; Sparks, D.L., Page, A.L., Helmke, P.A., Loeppert, R.H., Soltanpour, P.N., Tabatabai, M.A., Johnston, C.T., Sumner, M.E., Eds.; American Society of Agronomy: Madison, WI, USA, 1996; pp. 961–1010. [Google Scholar]
  39. Lu, R.K. Analytical Methods for Soil Agrochemistry; Chinese Agricultural Science and Technology Publishing House: Beijing, China, 2000. (In Chinese) [Google Scholar]
  40. Tang, Q.Y.; Zhang, C.X. Data Processing System (DPS) software with experimental design, statistical analysis and data mining developed for use in entomological research. Insect Sci. 2013, 20, 254–260. [Google Scholar] [CrossRef]
  41. Johnsen, K.H.; Samuelson, L.J.; Sanchez, F.G.; Eaton, R.J. Soil carbon and nitrogen content and stabilization in mid-rotation, intensively managed sweetgum and loblolly pine stands. For. Ecol. Manag. 2013, 302, 144–153. [Google Scholar] [CrossRef]
  42. Carrington, E.M.; Hernes, P.J.; Dyda, R.Y.; Plante, A.F.; Six, J. Biochemical changes across a carbon saturation gradient: Lignin, cutin, and suberin decomposition and stabilization in fractionated carbon pools. Soil Biol. Biochem. 2012, 47, 179–190. [Google Scholar] [CrossRef]
  43. Jenkenson, D.S.; Hart, P.B.S.; Payner, J.H.; Pary, L.C. Modeling the turnover of organic matter in long-term experiments at Rothamsted. Intecol. Bull. 1988, 15, 1–8. [Google Scholar]
  44. Van Veen, J.A.; Kuikman, P.J. Soil structure aspects of decomposition of organic matter by microorganisms. Biogeochemistry 1990, 11, 213–233. [Google Scholar] [CrossRef]
  45. Carter, M.R.; Angers, D.A.; Gregorich, E.G.; Bolinder, M.A. Characterizing organic matter retention for surface soils in eastern Canada using density and particle size fractions. Can. J. Soil Sci. 2003, 83, 11–23. [Google Scholar] [CrossRef]
  46. Zhang, J.J.; Li, Y.F.; Chang, S.X.; Jiang, P.K.; Zhou, G.M.; Liu, J.; Wu, J.S.; Shen, Z.M. Understory vegetation control affected greenhouse gas emissions and labile organic carbon pools in an intensively managed Chinese chestnut plantation. Plant Soil 2014, 376, 363–375. [Google Scholar] [CrossRef]
  47. Hu, Y.L.; Zeng, D.H.; Chang, S.X.; Mao, R. Dynamics of soil and root C stocks following afforestation of croplands with poplars in a semi-arid region in northeast China. Plant Soil 2013, 368, 619–627. [Google Scholar] [CrossRef]
  48. Zhang, T.; Li, Y.F.; Chang, S.X.; Jiang, P.K.; Zhou, G.M.; Liu, J.; Lin, L. Converting paddy fields to Lei bamboo (Phyllostachys praecox) stands affected soil nutrient concentrations, labile organic carbon pools, and organic carbon chemical compositions. Plant Soil 2013, 367, 249–261. [Google Scholar] [CrossRef]
  49. Barrios, E.; Buresh, R.J.; Sprent, J.I. Organic matter in soil particle size and density fraction from maize and legume cropping systems. Soil Biol. Biochem. 1996, 28, 185–193. [Google Scholar] [CrossRef]
  50. Shen, Y.; Zhang, X.P.; Liang, A.Z.; Fang, H.J.; Yang, X.M. Spatial distribution of density fractions of soil organic carbon at a sloping farmland of a Black soil. Chin. J. Soil Sci. 2008, 39, 1023–1029. [Google Scholar]
  51. Xu, S.Q.; Cui, S.Y.; Chen, F.; Xiao, X.P.; Zhang, H.L. Effect of tillage on content of density fractions of paddy soil organic carbon and its spatial distribution. J. Agro-Environ. Sci. 2011, 30, 127–132. [Google Scholar]
  52. Boone, R.D. Light fraction soil organic matter: Origin and contribution to net nitrogen mineralization. Soil Biol. Biochem. 1994, 26, 1459–1468. [Google Scholar] [CrossRef]
  53. Xie, J.S.; Yang, Y.S.; Xie, M.S.; Chen, G.S.; Yang, Z.J.; Huang, S.D. Effect of vegetation restoration on soil organic matter of light fraction in eroded degraded Red soil in subtropics China. Acta Pedol. Sin. 2008, 45, 170–177. [Google Scholar]
  54. Strickland, T.C.; Sollins, P. Improved method for separating light and heavy fraction organic material from soil. Soil Sci. Soc. Am. J. 1987, 51, 1390–1393. [Google Scholar] [CrossRef]
  55. Wu, J.G.; Zhang, X.Q.; Wang, Y.H.; Xu, D.Y. The effect of land use changes on the distribution of soil organic carbon in physical fractionation of soil. Sci. Silvae Sin. 2002, 38, 19–29. [Google Scholar]
  56. Liu, L.X.; Wang, J.C.; Liu, J.X.; Wang, X. Analytical study of biochemical properties and ability to protect organic-carbon on Chinese pine forest Gray Cinnamon forest soil in Ziwulin Mountain, Northwest China. J. Soil Water Conserv. 2010, 24, 94–99. [Google Scholar]
  57. Ladd, J.N.; Amato, M. Studies of nitrogen immobilization and mineralization in calcareous soils—IV. Changes in the organic nitrogen of light and heavy subfractions of silt-and fine clay-size particles during nitrogen turnover. Soil Biol. Biochem. 1980, 12, 185–189. [Google Scholar]
  58. Williams, A.; Xing, B.S.; Veneman, P. Effect of cultivation on soil organic matter and aggregate stability. Pedosphere 2005, 15, 255–262. [Google Scholar]
  59. Yin, Y.; Cai, Z.C.; Qin, S.W. Dynamics of fluvo-aquic soil organic matter fractions under long-term fertilization. Chin. J. Appl. Ecol. 2005, 16, 875–878. [Google Scholar]
  60. Shi, J.P.; Zhang, F.D.; Lin, J. Effect of long-term fertilization on organo-mineral complex status in soils. Plant Nutr. Fertil. Sci. 2002, 8, 131–136. [Google Scholar]
  61. Swanston, C.W.; Caldwell, B.A.; Homann, P.S.; Ganio, L.; Sollins, P. Carbon dynamics during a long-term incubation of separate and recombined density fractions from seven forest soils. Soil Biol.Biochem. 2002, 34, 1121–1130. [Google Scholar] [CrossRef]
  62. Li, Y.F.; Zhang, J.J.; Chang, S.X.; Jiang, P.K.; Zhou, G.M.; Fu, S.L.; Yan, E.R.; Wu, J.S.; Lin, L. Long-term intensive management effects on soil organic carbon pools and chemical composition in Moso bamboo (Phyllostachys pubescens) forests in subtropical China. For. Ecol. Manag. 2013, 303, 121–130. [Google Scholar] [CrossRef]
  63. Baritz, R.; Seufert, G.; Montanarella, L.; van Ranst, E. Carbon concentrations and stocks in forest soils of Europe. For. Ecol. Manag. 2010, 260, 262–277. [Google Scholar] [CrossRef]
  64. Yang, Y.S.; Xie, J.S.; Sheng, H.; Chen, G.S.; Li, X. The impact of land use/cover change on soil organic carbon stocks and quality in mid-subtropical mountainous area of southern China. Acta Geogr. Sin. 2007, 62, 1123–1131. [Google Scholar]

