Simulation of Quaking Aspen Potential Fire Behavior in Northern Utah, USA

1
Forest Service, Rocky Mountain Research Station, Forest Inventory and Analysis, 507 25th Street, Ogden, UT 84401, USA
2
Environment and Natural Resources Institute, University of Alaska-Anchorage, Anchorage, AK 99508, USA
*
Author to whom correspondence should be addressed.
Forests 2014, 5(12), 3241-3256; https://doi.org/10.3390/f5123241
Submission received: 14 November 2014
/
Revised: 3 December 2014
/
Accepted: 4 December 2014
/
Published: 15 December 2014
(This article belongs to the Special Issue Climate Change and Forest Fire)
Abstract
:Current understanding of aspen fire ecology in western North America includes the paradoxical characterization that aspen-dominated stands, although often regenerated following fire, are “fire-proof”. We tested this idea by predicting potential fire behavior across a gradient of aspen dominance in northern Utah using the Forest Vegetation Simulator and the Fire and Fuels Extension. The wind speeds necessary for crowning (crown-to-crown fire spread) and torching (surface to crown fire spread) were evaluated to test the hypothesis that predicted fire behavior is influenced by the proportion of aspen in the stand. Results showed a strong effect of species composition on crowning, but only under moderate fire weather, where aspen-dominated stands were unlikely to crown or torch. Although rarely observed in actual fires, conifer-dominated stands were likely to crown but not to torch, an example of “hysteresis” in crown fire behavior. Results support the hypothesis that potential crown fire behavior varies across a gradient of aspen dominance and fire weather, where it was likely under extreme and severe fire weather, and unlikely under moderate and high fire weather. Furthermore, the “fire-proof” nature of aspen stands broke down across the gradient of aspen dominance and fire weather.
1. Introduction
Quaking aspen (Populus tremuloides Michx.) (hereafter aspen) stands are an important forest type in the intermountain region of the United States [1]. Recently, increased study of aspen stand dynamics, particularly “sudden aspen decline” [2] has led to a large body of literature suggesting aspen loss is due partly to a reduction of stand-replacing disturbances as the result of grazing, 20th century fire suppression, an extremely moist 20th century, and subsequent succession [3,4,5]. It is assumed that fire was an integral driving process in historic aspen stand dynamics [6]; however, the role of fire likely varies between seral and stable aspen stands. While seral stands eventually succeed to conifer-dominated stands in the absence of disturbance, stable aspen stands can remain in aspen cover for multiple centuries [7,8]. Although commonly naturally regenerated via fire [9,10] aspen stands are often described as “fire-proof” [11,12], which presumably refers to the low flammability of aspen in general. Failing to understand the seral-stable dichotomy in aspen fire ecology has resulted in this paradoxical characterization of aspen-dominated stands. In this paper, we use simulation modeling to quantify potential fire behavior across a gradient of seral aspen stand dominance in order to increase understanding of aspen ecology and management.
Aspen ecosystems are inordinately important, serving as biodiversity hotspots [13,14] and aesthetic resources. The documentation of decline in western North America landscapes has fueled research focused on the causes of the decline [15], but also on what might be done to maintain aspen, i.e., regeneration ecology. Typical aspen stands in western North America regenerate via suckering following catastrophic fire [10,16] and other disturbances. Vegetative reproduction following fire has been cited as an adaptation to frequent disturbance [17] and fire suppression is commonly implicated in the loss of aspen stands [1]. It is also important to note that aspen reproduction is not limited to suckering [18,19]. However, many seral aspen stands have shifted to conifer dominance via succession in the absence of disturbance [20,21]. In the continued absence of disturbance, aspen can be lost from the stand and subsequent fire might not result in aspen regeneration. Furthermore, climate warming is likely to influence aspen mortality directly [22] but also to influence disturbance regimes (e.g., fire, [23]), which could potentially alter the regeneration ecology of aspen and effect its distribution on the landscape.
The “fire-proof” nature of some aspen stands may simply be from observations of stable aspen stands or young seral aspen stands that have yet to accumulate the necessary understory fuel loads (i.e., herbaceous, coarse woody debris, understory shade tolerant trees) to carry fire and over time, as fuel loading increases, more extreme (i.e., stand-replacing) fire behavior becomes possible. Fires in aspen stands are often limited by surface fuel moisture and fuel loading, and typically occur when understory fuels are sufficiently dry to carry a surface fire [12]. Fire is further limited in some aspen stands due to the lack of ladder fuels represented by shade-tolerant understory trees [12]. This critical link, often measured in terms of stand canopy base height (CBH), provides the continuity between the surface and canopy fuels necessary to carry a surface fire into the crowns [24,25]. Additionally, the canopy bulk density (CBD), or volume of canopy biomass in aspen stands is thought to be much less than in conifer stands [16,25]; CBD is a critical driver for crown fire spread [25,26]. Under conditions of sufficient wind speed, it is possible for a surface fire to ignite an individual tree crown (torching), or to be carried into multiple tree crowns (crowning). Torching index (TI) is the wind speed necessary to move a surface fire into the canopy (crown fire initiation), and crowning index (CI) is the wind speed necessary to move a fire throughout the canopy once it is already there (crown fire propagation) [27]. The possibility of both TI and CI are commonly expressed as critical wind speeds, derived from empirical weather data. That is, the wind speed necessary to carry a surface fire into the canopy at a specific percentile of fire weather (e.g., 99th percentile), and given the fuel characteristics of the stand. Consequently, a highly flammable stand will have low TI and CI while a “fire-proof” stand will have high TI and CI.
The purpose of this study was to develop a better generalization of fire behavior in seral aspen stands by quantifying how potential fire behavior (characterized as CI and TI) is influenced by a multitude of factors that describe potential differences in fuel type and configuration (e.g., relative species composition, basal area, fuel loading). For example, as the proportion of aspen in a stand decreases, shade-tolerant conifers in the overstory and understory, and therefore CBD increases, surface fuel loads increase, and CBH decreases, which ought to result in a reduced (more likely) torching index (TI). Designing, testing and measuring actual fire behavior is plagued with often insurmountable logistics and, as a result, simulation modeling has been widely implemented as a useful comparative tool [28,29,30,31,32]. As with all modeling, there are serious potential shortcomings that warrant caution when relying on these models [33]. Regardless, the results of fire behavior modeling are an important part of multiple lines of evidence for fire behavior and ecology in aspen stands that also include professional judgment and actual fire observations. We used the modeling approach to explore potential fire behavior in aspen stands, indicated by simulated CI and TI, as a function of aspen dominance (aspen composition). We hypothesized that, at relatively high proportion of aspen, potential fire behavior would be low whereas, at a relatively low proportion of aspen, potential fire behavior would be higher.
2. Methods
2.1. Study Sites
We selected 32 plots from four stands that ranged in aspen composition from 0% to 100% to test the hypothesis that fire behavior is influenced by composition (Table 1). Stands were located in northern Utah in the Wasatch Mountain Range at approximately 41.31° N, 111.37° W. Elevation at the study sites varied from 2300 to 2450 m. All stands were on north-facing aspects with slope generally between 20% and 45%. Although stand basal area (BA m2·ha−1) and species composition were variable, all plots were located in a landscape where abundant aspen- and conifer-dominated stands are within 100 m of pure aspen. One of the stands was selectively logged in ca. 1970–1975. In addition to aspen, other species included white fir (Abies concolor (Gord. & Glend.) Lindl. Ex Hildebr.), subalpine fir (Abies lasiocarpa (Hook.) Nutt.), Douglas-fir (Pseudotsuga menziesii var. glauca (Mirb.) Franco) and Engelmann spruce (Picea engelmannii Parry ex. Engelm.).

Table 1.
Range of stand and site attributes for the study plots classified by aspen dominance (percent aspen basal area): low, 0%–33%; medium, 34%–66%; high, 67%–100%.
| Attribute | Low (n = 14) | Medium (n = 7) | High (n = 11) |
|---|---|---|---|
| Percent Aspen (% basal area) | 0–31 | 35–57 | 75–100 |
| Aspen Basal Area (m2·ha−1) | 0–3.1 | 1.9–5.6 | 3.7–19.5 |
| Total Basal Area (m2·ha−1) | 4.9–19.4 | 4.3–11.1 | 4.9–19.5 |
| Estimated Fuel Loading (Mg·ha−1) | 54.4–110.7 | 66.1–126.4 | 65.2–76.2 |
| Canopy Base Height (m) | 2.4–8.5 | 0.6–4.6 | 1.2–8.2 |
| Canopy Bulk Density (kg·m−3) 1 | 0.028–0.221 | 0.027–0.137 | 0.056–0.206 |
| Understory Stocking (stems ha-1) | 0–9386 | 556–8756 | 2964–17043 |
1 Canopy bulk density estimated using equations in [34].
2.2. Field Methods
We used variable-radius plots to inventory overstory and understory trees (basal area factor = 4.6 m2·ha−1 held constant across plots). For each overstory tree >12.7 cm in diameter at breast height (DBH), DBH, height (HT), and height to the lowest live branch were measured. In addition, species and status (live or dead) were recorded. An increment core was taken from trees on each plot and used for determination of site index [35] and to measure diameter increment, which is used to calibrate FVS (Forest Vegetation Simulator) to local conditions and improve the accuracy of model simulations [36]. Understory trees were tallied by species and HT class on fixed 0.00135 ha−1 plots.
2.3. Fuel Loading
Fuel loading at each plot was estimated by using aspen photo series [11] and assigning plots to particular fuel models [37]. We cross-walked [11] aspen photos to fuel models [37] by comparing fine fuel loading, major fire carrier (herbaceous, shrubs, small trees), coniferous and deciduous BA, and quantity of coarse fuel loading. To further test the validity of fuel model designations, we compared our designations with the fuel model assignments from baseline runs of FVS-Fire and Fuels Extension (FFE) simulations, which used overstory and understory tree characteristics to estimate one of the original fuel models [38]. We evaluated our fuel model choices against the model selection in FVS-FFE. When they matched with our determinations it provided secondary evidence of our fuel model choice. Otherwise, we revisited and double-checked before final fuel model designations were made by FVS-FFE.
2.4. Fire Weather Data
Empirical fire weather data from the Otter Creek National Oceanic and Atmospheric Administration, Remote Automated Weather Station in northern Utah (2183 m asl, 41.75 N, 111.28 W) was used because of its proximity to the study sites. Otter Creek was the closest station to our study area, although the dominant vegetation at the station was sagebrush (Artemisia spp.). We defined four fire weather scenarios: moderate (80%); high (90%); severe (95%); and extreme (99%). For a hypothetical fire season spanning 1 May through 31 October, wind speeds, fuel moisture content, and temperature were calculated for each scenario based on an energy release component using Fire Family Plus [39] (Table 2). Wind speeds were converted from standard 10-min averages to probable maximum 1-min wind speeds [40]. The extreme category (99%) was developed to help interpret possible scenarios of future fire weather, which is projected to become warmer (higher temperature), and more variable (e.g., potentially higher wind speeds) [41].
| Variable | 80th Percentile | 90th Percentile | 95th Percentile | 99th Percentile |
|---|---|---|---|---|
| (Moderate) | (High) | (Severe) | (Extreme) | |
| Maximum Temperature (°C) | 27.7 | 28.8 | 30.5 | 32.2 |
| 1-h Fuel Moisture (%) | 3.3 | 2.5 | 2.1 | 1.4 |
| 10-h Fuel Moisture (%) | 3.9 | 3.0 | 2.6 | 1.8 |
| 100-h Fuel Moisture (%) | 6.1 | 5.1 | 4.4 | 3.3 |
| 1000-h Fuel Moisture (%) | 7.9 | 7.3 | 7.0 | 5.1 |
| Herbaceous Fuel Moisture (%) | 3.3 | 2.5 | 2.1 | 1.4 |
| Woody Fuel Moisture (%) | 71.6 | 66.9 | 65.3 | 51.3 |
| Wind Speed (km·h−1) 1 | 34 | 37 | 40 | 48 |
1 Wind speed converted from standard 10-min averages to probability maximum 1-min wind speeds [40].
2.5. Data Analysis
Overstory and understory inventory data, fuel models, and fire weather data for each of four scenarios were entered into the Utah Variant (version 0824, revision 5/7/13) of the Forest Vegetation Simulator [42]. The FuelCalc keyword was invoked so that CBD estimates incorporated both softwood and hardwoods. FVS was used in combination with the Fire and Fuels Extension (FFE) [25] to simulate potential fire behavior of the stands. FVS calculates tree and stand structural and compositional variables on a plot-by-plot basis before exporting the data to the FFE, which uses stand-level variables to simulate potential fire behavior [25,36]. Calculations of stand CBD, CBH, and surface fuel loads are each used to predict fire behavior, e.g., CI, TI, and flame lengths (m). We focused on CI and TI, which were used to evaluate the four fire weather scenarios by grouping the individual plot stand data and FVS-FFE simulation results into classes of aspen dominance (proportion of total stand BA that was aspen): low, 0%–33%; medium, 34%–66%; and high, 67%–100%. Simulated CI and TI means were calculated for each class and compared against the wind speed thresholds for each of the four fire weather scenarios.
Because CBD and CBH are presumed to exert primary control on FFE predictions of CI and TI, respectively, we assessed differences between them for each aspen composition class using ANOVA followed by a Tukey HSD test with significance indicated at the α = 0.05 level. Residuals were inspected to ensure independence, constancy of error variance, and normality. Then to test for the effects of aspen composition on potential fire behavior, we subjected the CI and TI results from the extreme fire weather scenario to a conditional inference tree regression analysis using binary recursive partitioning [43,44]. The stop criterion for a binary split was based on a p-value less than 0.05. We explored the effect of: conifer basal area, total basal area, overstory density, understory density, surface fuel load, canopy base height, and canopy bulk density (Table 1) on predicted CI and TI. Because CI and TI are mathematically related to CBD and CBH [34], respectively, we re-ran the regression tree with and without these predictors and assessed relative change in model performance using the root mean squared error (RMSE).
3. Results
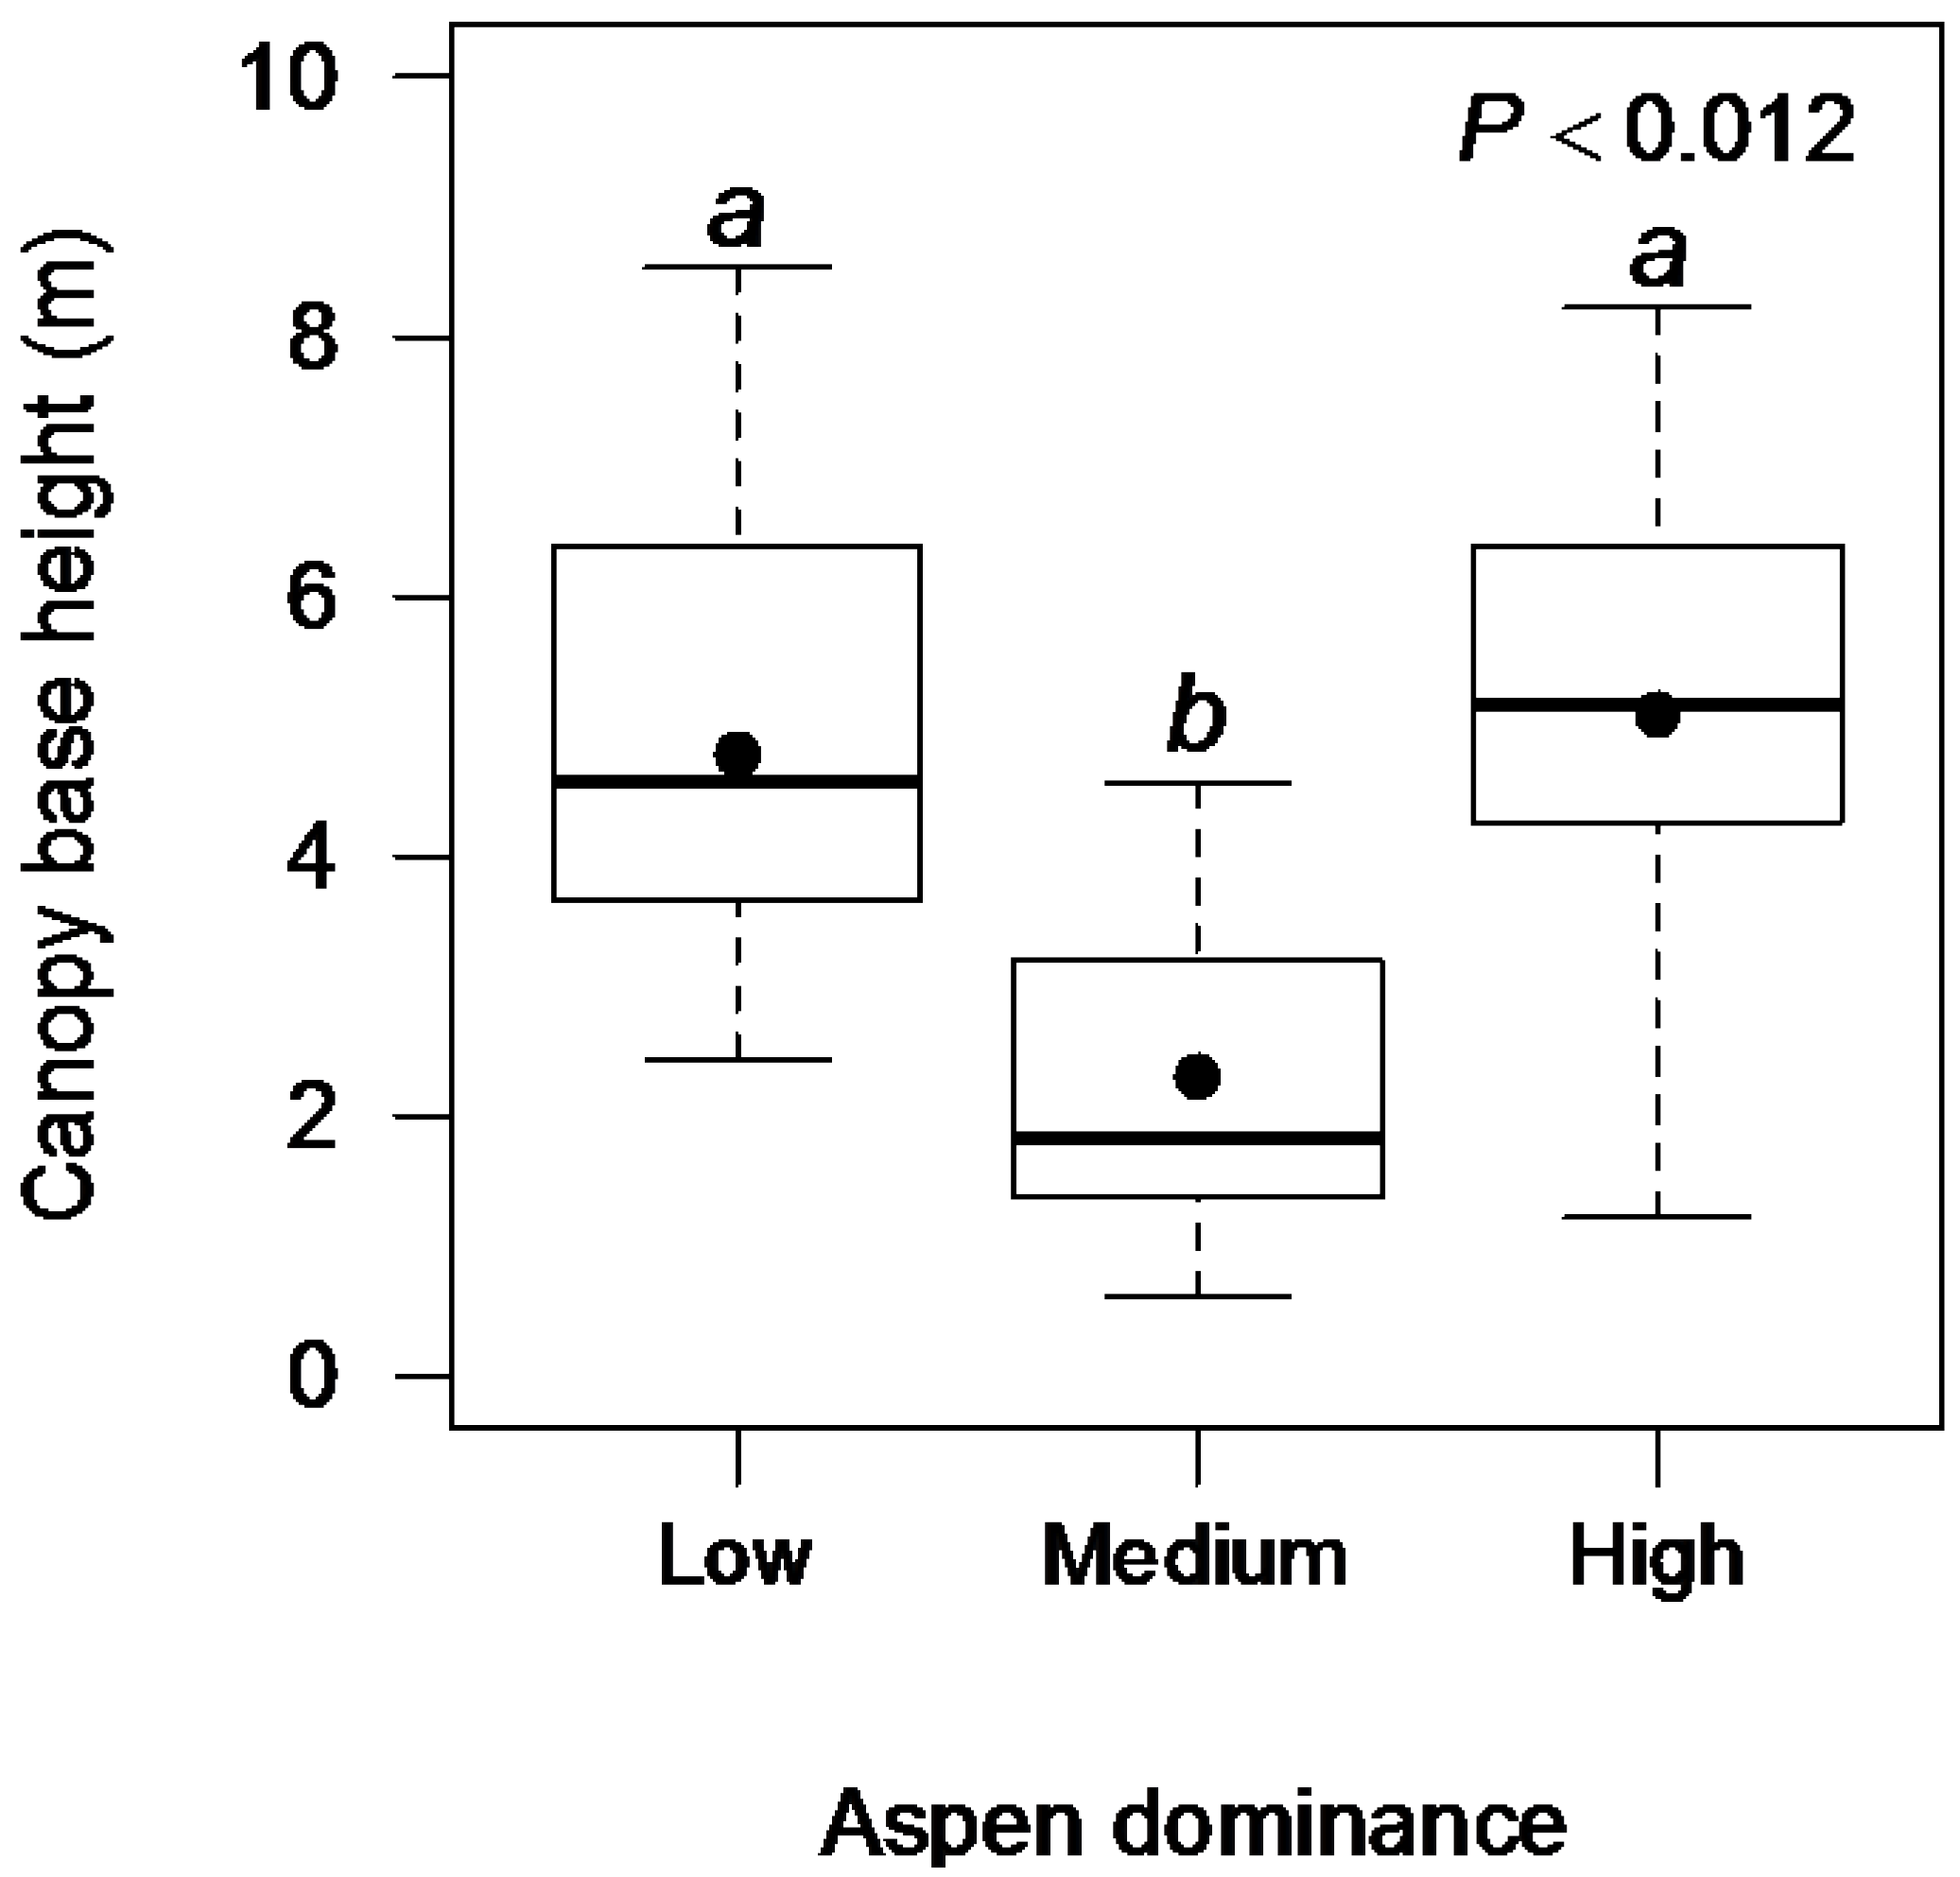
Mean CBH exhibited nonlinear behavior over the aspen dominance classes. The purest aspen stands (high class) had the highest CBH, followed by the low class, although the difference was not significant (p = 0.915, Figure 1). The medium class exhibited significantly lower CBH than the low class (p < 0.023) and the high class (p < 0.014, Figure 1). Mean CBD decreased from low to medium aspen dominance, however the difference was not significant (p < 0.076) and there was no difference in CBD between medium and high aspen dominance (Figure 2).
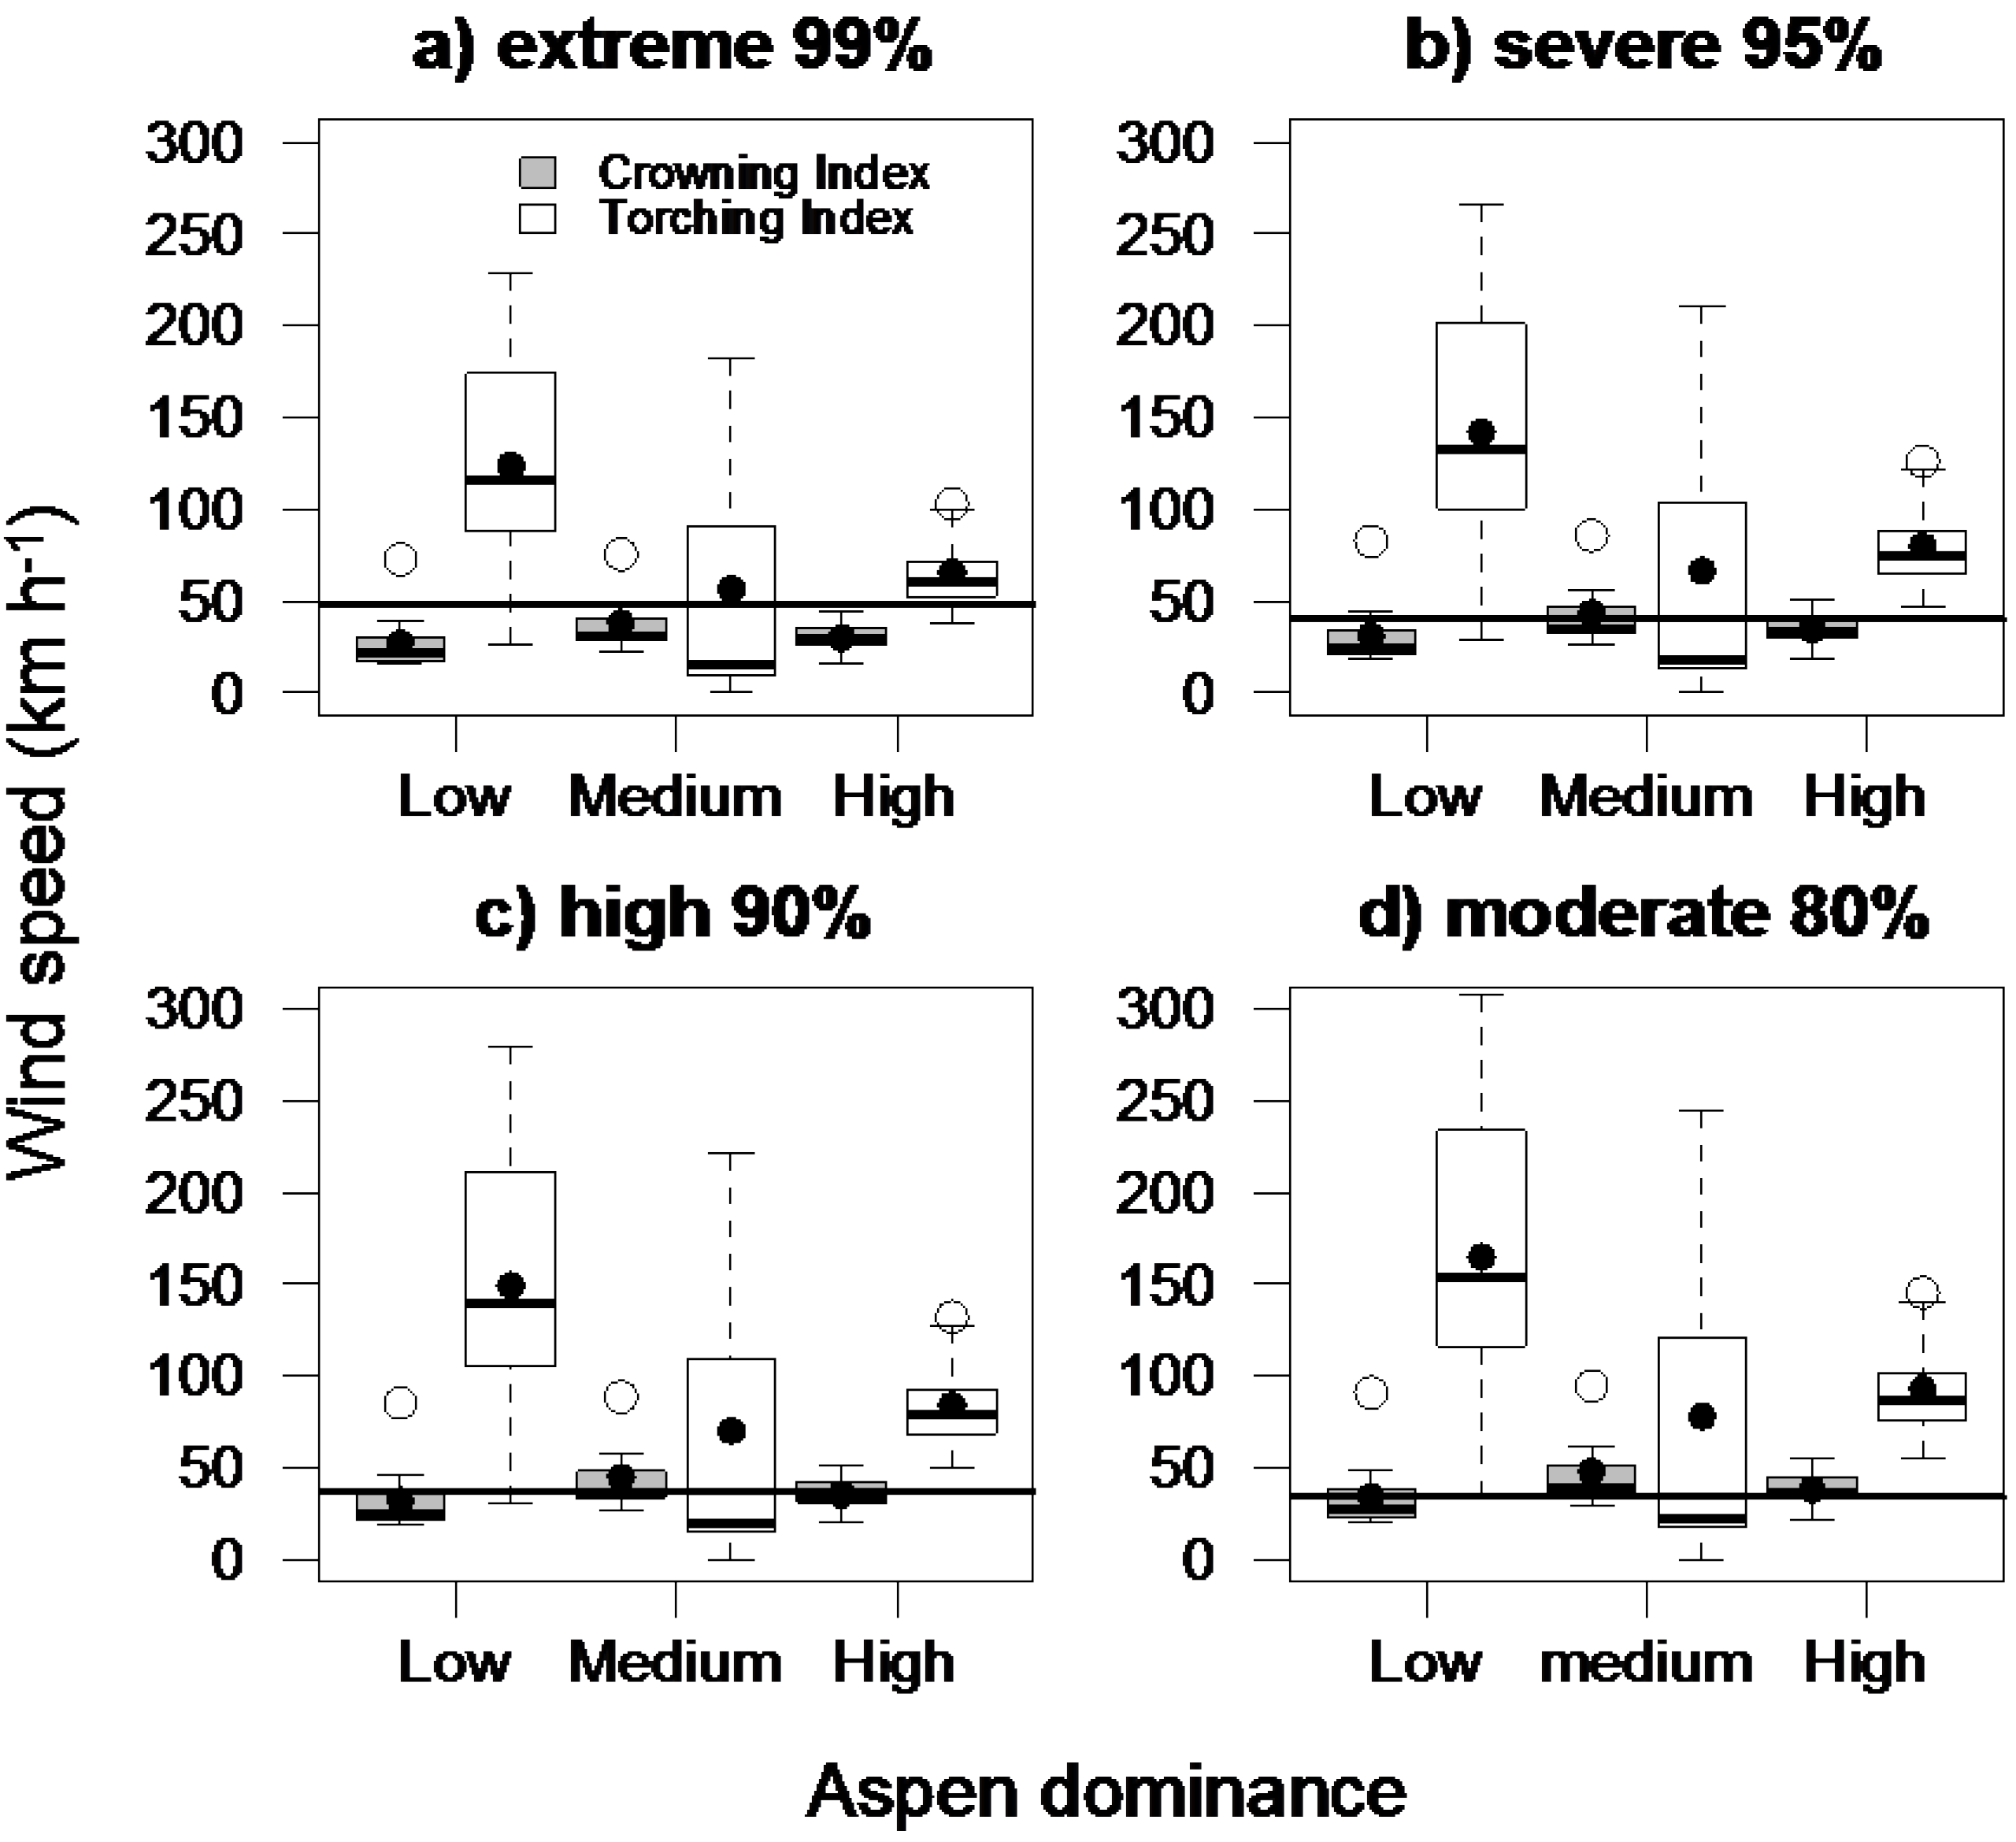
Under the extreme weather scenario, all stands regardless of aspen dominance had CIs that were well below the wind speed threshold making the possibility of crown fire likely (Figure 3a). In contrast, TIs fell primarily above the wind speed threshold indicating torching was generally unlikely. The exception was for medium aspen dominance where the interquartile range of TIs overlapped the threshold. Results for the severe weather scenario mirrored the extreme with one important exception, mean CIs for medium aspen dominance class fell above the wind speed threshold (Figure 3b). Under the high weather scenario a stand with medium aspen dominance was unlikely to exhibit crown fire, but was likely to exhibit torching (Figure 3c). Also, the interquartile range of CIs for the high aspen dominance class under this scenario overlapped the wind speed threshold, which suggested the likelihood of mixed crown fire. Only under the moderate fire weather scenario was crowning unlikely, primarily for the medium and high aspen dominance classes (Figure 3d).
Figure 1.
Canopy base height (m) for three aspen dominance classes. For each box plot the box represents the 1st and 3rd quartiles, whiskers denote 1.5 times the interquartile range, the heavy horizontal line inside the boxes indicates the median, filled circles indicate the mean, and unfilled circles indicate outliers. Different letters denote significant differences at the 95% level using a Tukey HSD test. Aspen dominance classes: low, 0%–33%, medium, 34%–66%, and high, 67%–100%.

Figure 2.
Canopy bulk density (kg·m−3) for three aspen dominance classes. For each box plot the box represents the 1st and 3rd quartiles, whiskers denote 1.5 times the interquartile range, the heavy horizontal line inside the boxes indicates the median, filled circles indicate the mean, and unfilled circles indicate outliers. Different letters denote significant differences at the 95% level using a Tukey HSD test. Aspen dominance classes: low, 0%–33%, medium, 34%–66%, and high, 67%–100%.
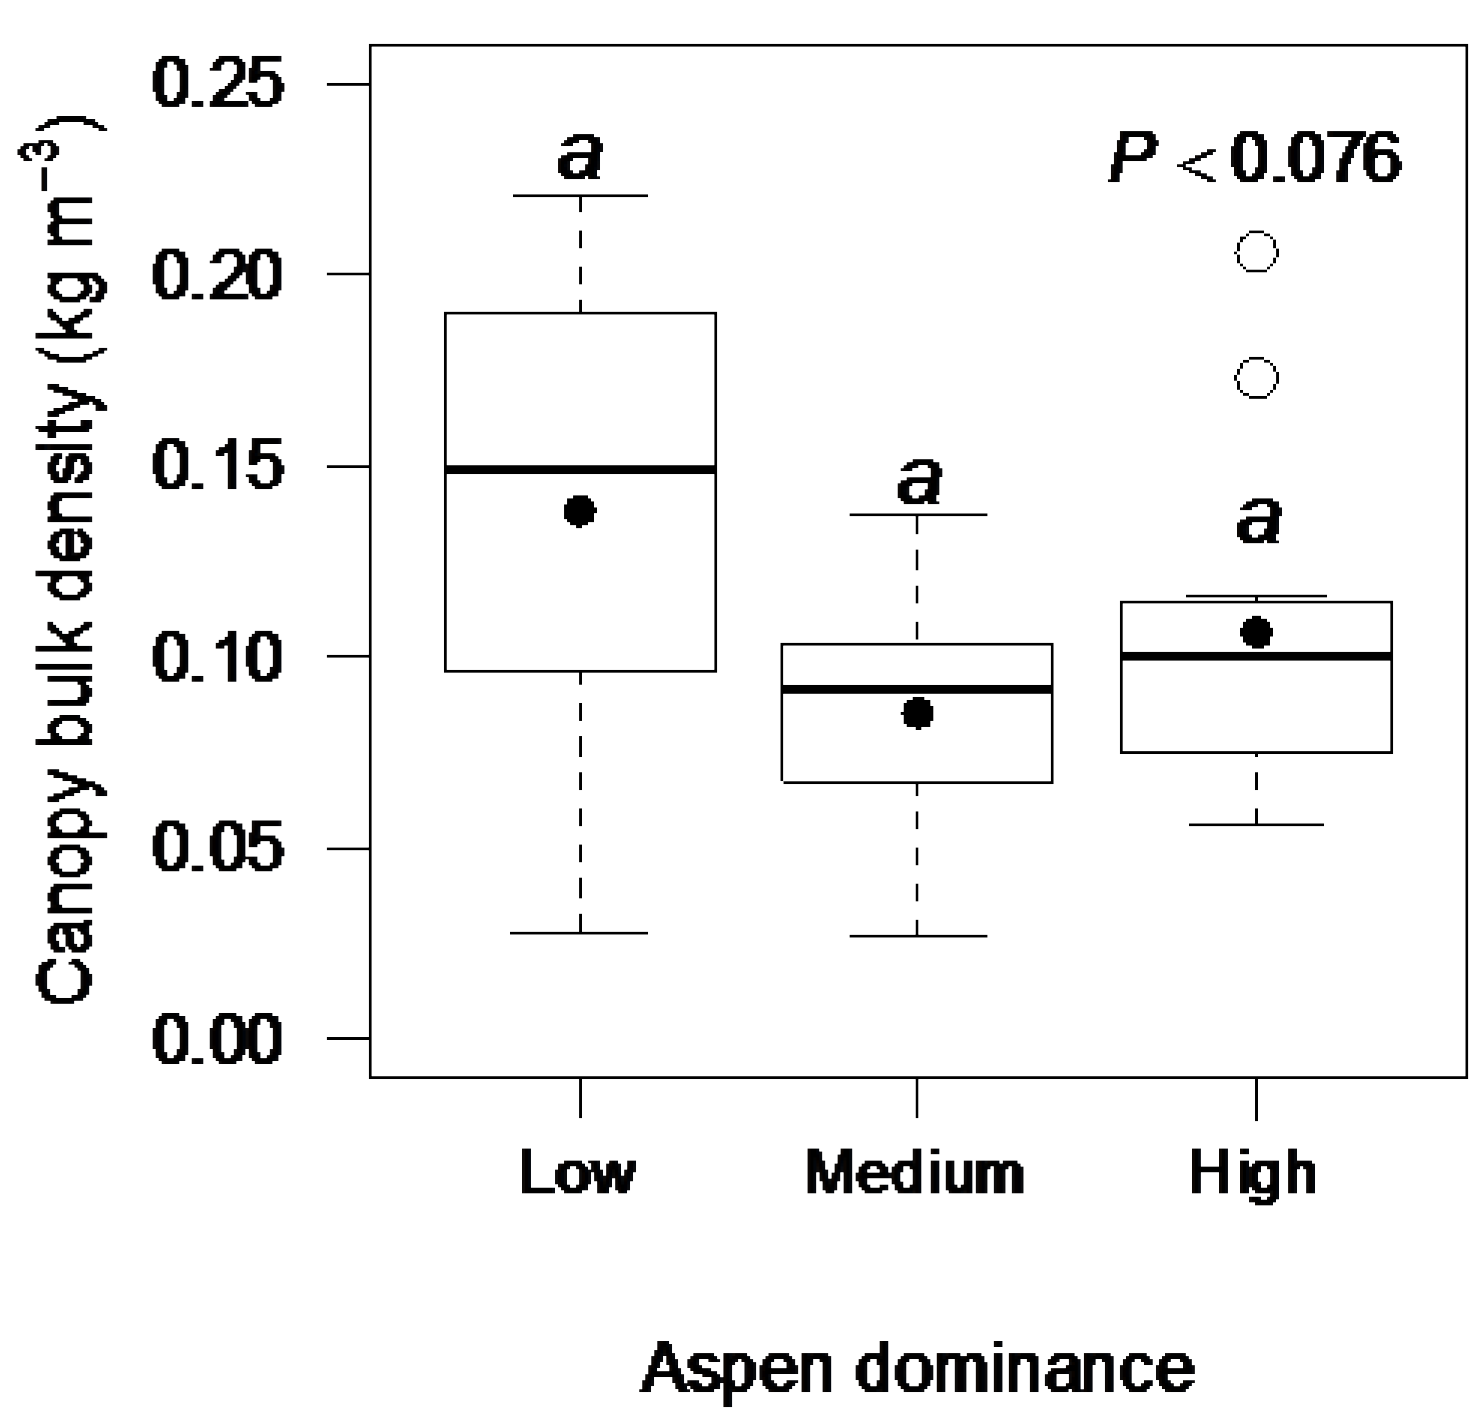
Figure 3.
Wind speeds (km·h−1) indicating crowning (CI) and torching (TI) indices across three aspen dominance classes and four fire weather scenarios. For each box plot the box represents the 1st and 3rd quartiles, whiskers denote 1.5 times the interquartile range, the heavy horizontal line inside the boxes indicates the median, filled circles indicate the mean, and unfilled circles indicate outliers. Horizontal bar indicates threshold wind speed based on fire weather data below which extreme fire behavior is likely. Aspen dominance classes: low, 0%–33%, medium, 34%–66%, and high, 67%–100%.

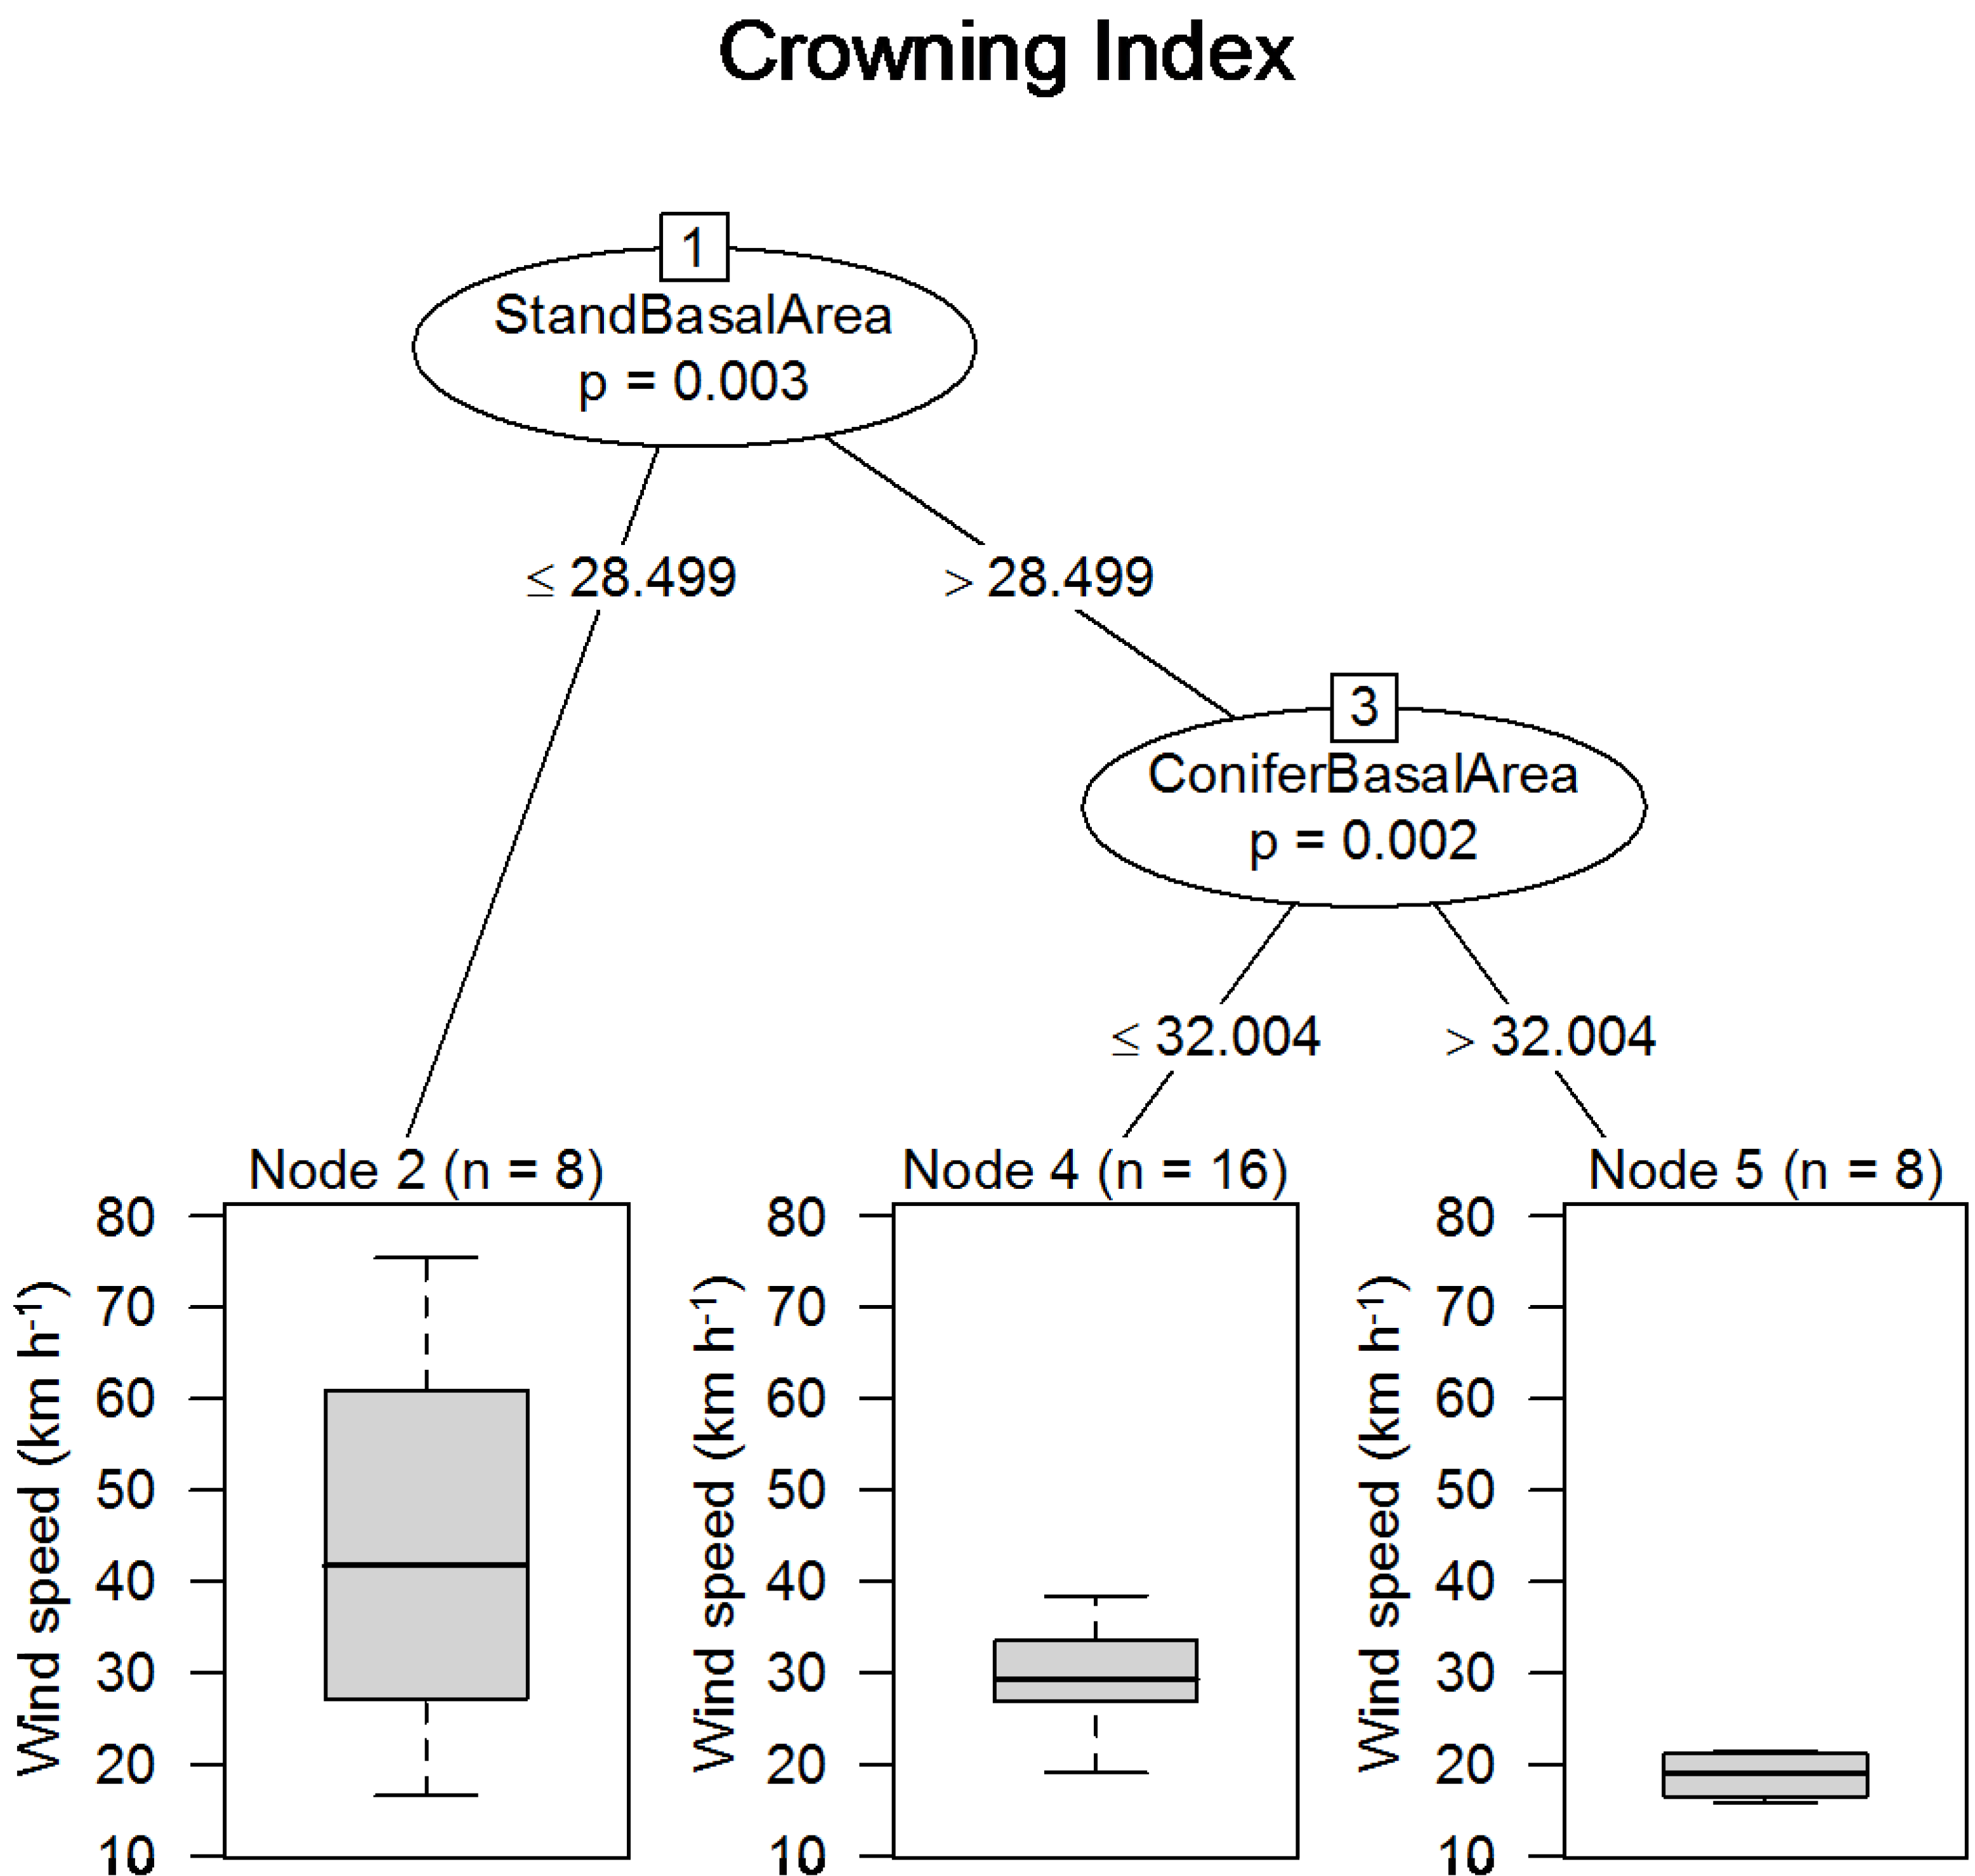
When CBD was removed as an independent variable, model fit was marginally reduced (RMSE decreased to 7.48 from 10.68): however, regression tree analysis revealed the variation in CI under extreme fire weather was significantly split at ~28.5 m2 stand BA. Stands with <28.5 m2 stand BA had the highest CI, stands with >28.5 m2 stand BA were subsequently significantly split based on conifer BA. Stands with >28.5 m2 stand BA and <32.0 m2 conifer BA had higher CIs, while those with >28.5 m2 stand BA and >32.0 m2 conifer BA exhibited the lowest CIs (Figure 4).
Figure 4.
Classification tree results suggested two significantly different groups that influence crowning index: stand basal area and conifer basal area.
Figure 4.
Classification tree results suggested two significantly different groups that influence crowning index: stand basal area and conifer basal area.

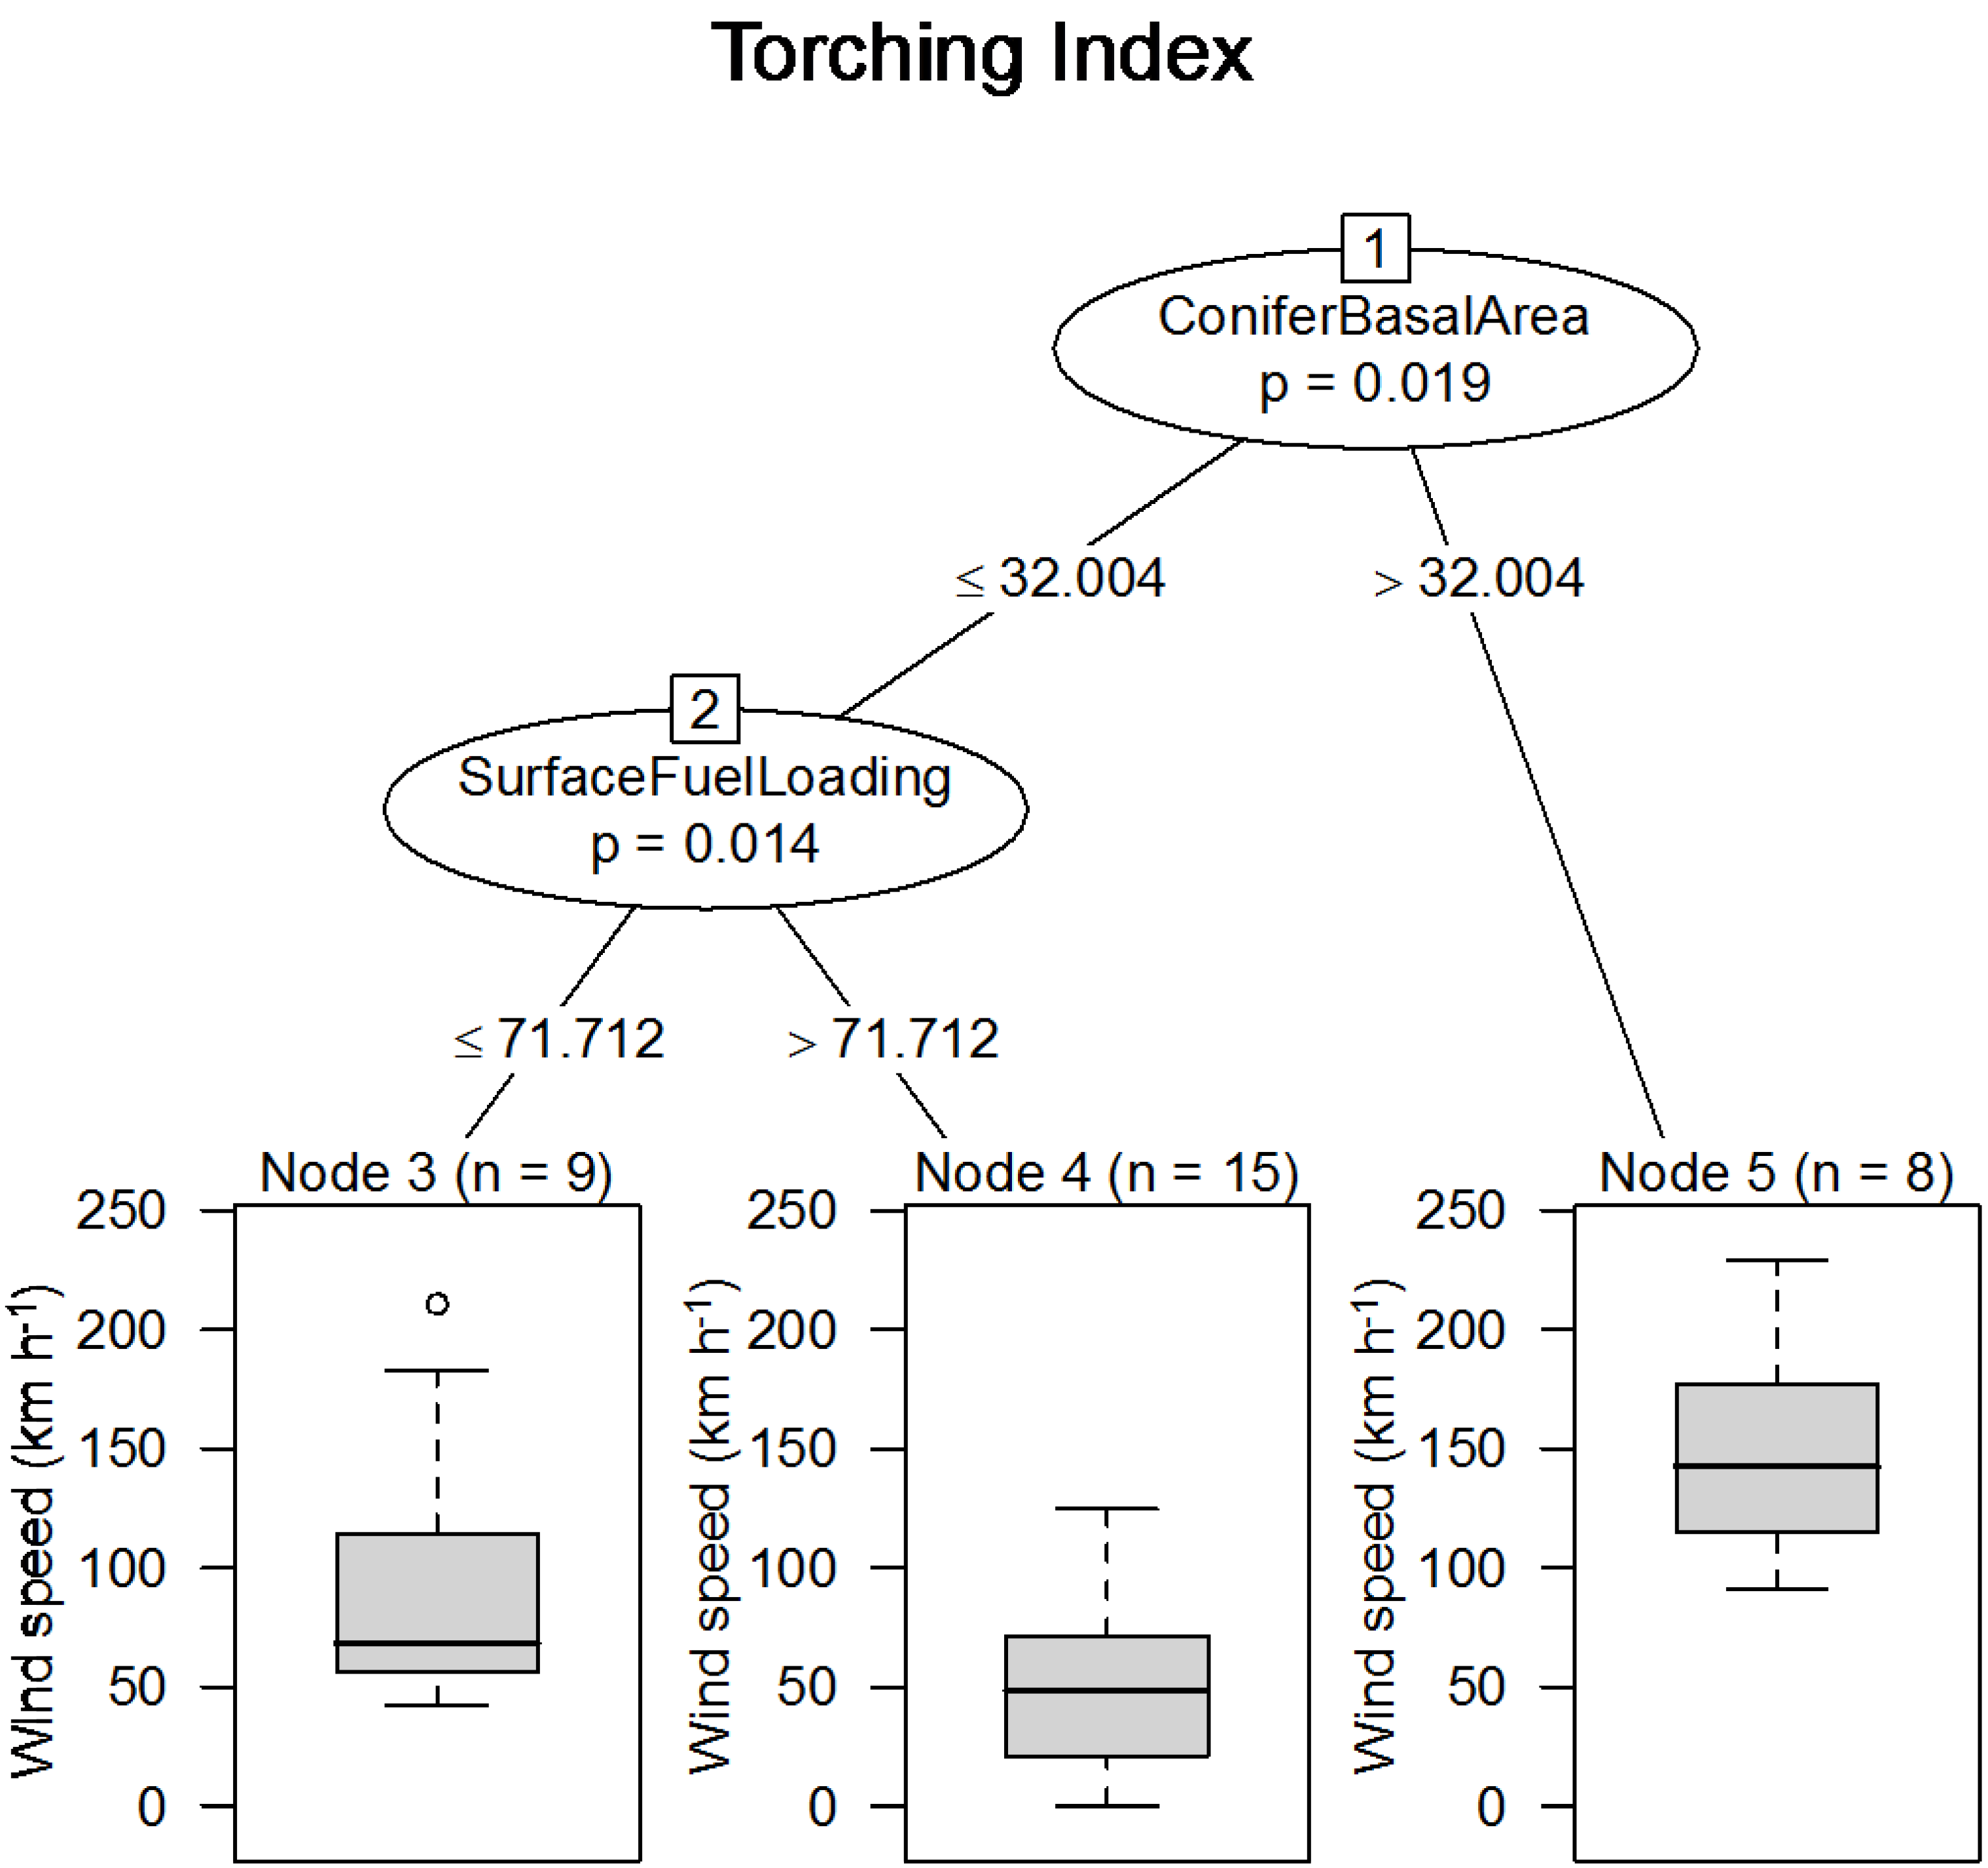
When CBH was removed as an independent variable model fit was reduced (RMSE decreased to 44.65 from 49.64); however, regression tree analysis revealed the variation in TI under extreme fire weather was split significantly at 32.0 m2 conifer BA. Plots with >32.0 m2 conifer BA had the highest TIs, and were therefore unlikely to exhibit torching fire behavior. Stands with <32.0 m2 conifer BA were subsequently split based on their surface fuel load. Stands with <71.7 t·ha−1 surface fuel loading had significantly higher TIs than stands with >71.7 t·ha−1 surface fuel loading, which exhibited the lowest TIs (Figure 5).
Figure 5.
Classification tree results suggested two significantly different groups that influence torching index: conifer basal area and surface fuel loading.
Figure 5.
Classification tree results suggested two significantly different groups that influence torching index: conifer basal area and surface fuel loading.

4. Discussion
Consistent with previous studies, simulations of crowning and torching potential fire behavior across a range of fire weather scenarios showed that as fire weather becomes more extreme so does the likelihood for crowning fire behavior [29,41,45]. Also consistent with fire behavior modeling in other systems and with other models [46], the likelihood of crown fire behavior increased as the dominance of deciduous (aspen) species decreased, however, this result was only manifest in the moderate and high fire weather scenarios. Under severe or extreme fire weather crowning fire behavior was predicted regardless of species composition. In contrast, the results for torching fire behavior (TI) were less straightforward. Only in the medium aspen dominance class was torching predicted, otherwise TIs were well above the wind speed threshold regardless of fire weather scenario. Results from simulation studies such as this one are not necessarily conclusive, and must be scrutinized in terms of previous work, including simulations, observations, and with respect to potential model shortcomings [33].
The patterns of CI among stands differing in aspen dominance for each fire weather scenario were strongly inversely related to CBD estimates (Figure 1 and Figure 2). Because FFE predicts CI nonlinearly from CBD [25], it follows that crowning fire behavior would become increasingly unlikely as the CBD of the stand decreases. This observation was bolstered by the regression tree analysis that showed stand BA, and secondarily conifer BA, also had an important influence on potential fire behavior. These results do not corroborate previous observations that aspen stands are “fire-proof”. Rather, they show the importance of fire weather on the likelihood of crowning, and then show that only under conditions of a relatively pure, open aspen stand (lowest stand BA, and lower conifer BA) does CI increase enough that crowing is unlikely [47]. For example, it has been suggested that stands of deciduous trees had structural and fuel attributes that make them much less flammable than conifer stands, where high foliar moisture content, relatively little resins or oils, and high coarse woody debris decomposition rates potentially influence fire behavior [48,49].
Considerable variability in fire potential has also been described in deciduous and mixedwood stands, and has been partially attributed to hardwood phenology, such that the canopy mitigates the influence of weather on fuels and therefore results in strong seasonal differences in fire behavior [50]. Phenological attributes of our aspen stands were likely acting on the estimates of potential fire behavior but these were not specifically measured. Furthermore, aspen phenology and extreme fire weather potentially interact, where the temporal co-occurrence of a full leaf-out aspen canopy and extreme fire weather might make severe fire behavior less likely when compared to pre-leaf-out or post-leaf-drop [50]. To detect these potential differences would require seasonally explicit analyses using a modeling approach different than that possible in FFE. In contrast, the variability in CBD estimates due to the relative proportion of coniferous/deciduous composition among our study stands was controlled by invoking the FuelCalc keyword, which allows FVS-FFE users to choose whether or not hardwoods are included in the estimation of CBD. When using FVS-FFE, any study or management action focused on hardwood species should necessarily include this option. Regardless, when holding fire weather classes constant, our assessment allowed us to ascertain roughly where the relatively rare “fire-proof” nature of aspen stands broke down across the gradient of aspen dominance, and fire weather scenarios.
The pattern of TI across aspen dominance predictably mirrored the pattern of CBH. The low and high aspen dominance classes had diminished torching potential, while the intermediate class was the most likely to exhibit torching. Because TI is driven primarily by CBH, which were composed of mostly fire-prone conifers in this study (i.e., deep-crowned with low CBHs and high leaf areas), it is likely that changing stand dynamics due to succession from aspen to conifers resulted in lower CBHs primarily in the medium dominance stands. Our analysis also showed that TI was secondarily driven by conifer BA and surface fuel loads. Interestingly, the regression tree bifurcated into similar conifer BA groups as indicated by the regression tree on CI. Strong conifer dominance resulted in the highest TIs, likely a result of a lack of understory ladder fuels in the conifer stands. The significant surface fuel loading groups, indicated when conifer BA <32.0 m2, showed higher surface fuel loads resulted in lower TIs than the lower surface fuel group. It is likely this pair of splits in the regression tree analysis effectively characterized the intermediate aspen dominance class. These results suggest a dynamic interplay between stand CBH, conifer BA, and surface fuel loading influences TI. Stands intermediate in aspen dominance, presumably succeeding to conifers, had more subcanopy trees resulting in lower CBHs. In combination with relatively high surface fuel loads (71.3 t·ha−1), stands from the medium class were most likely to exhibit torching fire behavior, but these fires were unlikely to become crown fires.
A concerning result in the low and medium dominance classes were TIs predicted as much higher than observed wind speeds, including the 99th percentile. Although not physically possible, these excessive wind speeds are instructive in that they indicate the impossibility of torching, and indicate “hysteresis” in potential fire behavior sensu [27]. The hysteresis phenomenon results in the qualitative description of “conditional” fire behavior where crown-to-crown spread is predicted to be likely in the absence of torching, due to insufficient fuel loads, low surface flame lengths or high CBHs. In this situation crown fire behavior is possible if the fire originates from outside the modeled stand. However, because CBHs were so high, a surface fire is unlikely to transition to crowning in the modeled stand. Closed-canopy, simple structured conifer forests have been suggested as candidates where hysteresis might be simulated by FFE [27]. Furthermore, although the understory trees are not directly taken into account in calculating CBH or surface fuel loading, we suspect the conspicuous lack of understory trees in many of our aspen stands provides additional evidence that these densely stocked, closed-canopy stands with relatively high CBHs (Table 2) were unlikely to exhibit torching based on the FFE model constructs. When we also consider the low surface fuel loading and virtual lack of understory stocking it becomes clear the conditions in some of our aspen stands could result in hysteresis in potential fire behavior.
Hysteresis in crown fire behavior can be further understood based on the interacting nature of the dynamics between surface fuel loads and ladder fuels during fires. Fuel models, slope, moisture content, wind speed, and canopy cover are used to predict flame lengths in FFE [25,38,51]. One often-cited shortcoming with the surface fuel loading—CBH relationship is that, even when detailed fuel loading measurements are taken (i.e., [51]), they are ultimately reduced to a generalized fuel model [37,38]. Stylized fuel models simply include a set of fuel bed inputs for use in the Rothermel [52] surface fire spread model, model that greatly simplifies the herbaceous fuel component and homogenizes an inherently heterogeneous community. Recent work indicated strong shifts in the relative abundance of herbaceous fuel, which was controlled by overstory structure, across a stand structural gradient in California woodlands [49]. They concluded overstory structure was likely more important for fuel bed flammability than species composition, such as found in this study.
The apparent change in potential fire behavior as aspen dominance and severity of fire weather decreases were due to a combination of multiple factors previously noted for boreal deciduous forests [16]. The understory communities in aspen-dominated forests have much greater herbaceous undergrowth production and, as conifer dominance increases, the herbaceous production is reduced [7]. The increase of surface fire behavior in boreal mixedwood stands has been attributed to accumulation of surface fuel over time, as a result of increasing species replacement, or succession, from deciduous- to coniferous-dominated stands [16,53]. In addition, fuel load is positively correlated with time-since-fire [3,16] and should parallel increasing conifer composition. The decrease in quantity of undergrowth is likely due to shading by the conifers; however, such a large decrease in available surface fuels might partly explain why our results were variable in mixed-species stands where the surface fuel load is potentially limiting fire occurrence or torching probabilities. While fuel models (like FM5, grass understory) exist, generally fuel models do not directly take into account differences in undergrowth production and this is a need for future fire modeling refinements (among others, see [33]).
Although we modeled fire behavior in the range of aspen dominance for a typical “aspen site”, one possible trade-off with this approach is that the fire characterizations may not hold for other aspen types (e.g., stable types) or sites. However, the relationships for TI and CI with respect to the proportion of aspen in the stand were not inconsistent with conventional wisdom about fire behavior in aspen, and corroborated previous work on both observed fire severity and modeled potential fire behavior [16,46,54] in deciduous stands. However, in contrast to previous literature we specifically noted aspen-dominated stands were only rarely “fire-proof”, and conifer dominated stands were nearly always likely to exhibit crowning fire behavior, and the stands with intermediate aspen dominance had mixed results. In other words, both ends of the aspen dominance gradient exhibited predictable fire behavior, while the aspen stands in the medium class (34%–66% aspen BA) need further detailed study.
The implications of this simulation study for aspen forests of western North America are instructive for aspen management even though they are limited by evidence of actual fire behavior. For example, the extreme fire weather scenario was included explicitly to provide some modeled outcomes based on empirical data for possible fire behavior changes in a warmer climate future. If we assume that as climate warms “normal” fire weather will start to approach historical extremes that include higher temperature, drier fuels, and more variable wind speeds, then we can interpret the results of the extreme scenario as future business-as-usual. That is, under a warming climate scenario potential fire behavior will include much more crown fire behavior regardless of aspen dominance. Aspen forests, which have been observed to rapidly and readily regenerate after high-severity fires [55], might benefit from increased fire activity, particularly in areas that are currently dominated by conifers [56].
Acknowledgments
We wish to acknowledge the Ecology Center, the T.W. Daniel Endowment, and USDA-NRI Competitive Research Grant (2007-01475) for support of this study. The comments of James Long and Paul Rogers greatly improved this manuscript. This paper was written and prepared by a U.S. Government employee on official time, and therefore it is in the public domain and not subject to copyright.
Author Contributions
R.J.D. collected and analyzed the data and wrote the manuscript. A.J.F. procured funding, collected data, and wrote the manuscript.
Conflicts of Interest
The authors declare no conflict of interest.
References
- Bartos, D.L. Aspen. In Chapter 3 USDA FS; RMRS-GTR-202; USDA Forest Service: Washington, DC, USA, 2007. [Google Scholar]
- Worrall, J.J.; Egeland, L.; Eager, T.; Mask, R.A.; Johnson, E.W.; Kemp, P.A.; Shepperd, W.D. Rapid mortality of Populus tremuloides in southwestern Colorado, USA. For. Ecol. Manag. 2008, 255, 686–696. [Google Scholar] [CrossRef]
- Bartos, D.L.; Campbell, R.B.J. Decline of quaking aspen in the interior west-examples from Utah. Rangelands 1998, 20, 17–24. [Google Scholar]
- Elliott, G.P.; Baker, W.L. Quaking aspen (Populus tremuloides Michx.) at treeline: A century of change in the San Juan Mountains, Colorado, USA. J. Biogeogr. 2004, 31, 733–745. [Google Scholar] [CrossRef]
- Rogers, P.C.; Sheppard, W.D.; Bartos, D.L. Aspen in Sierra Nevada: Regional conservation of a continental species. Nat. Area J. 2007, 27, 183–193. [Google Scholar] [CrossRef]
- Barnes, B.V. Phenotypic variation of trembling aspen in western North America. For. Sci. 1975, 21, 319–328. [Google Scholar]
- Mueggler, W.F. Age distribution and reproduction of Intermountain aspen stands. West. J. Appl. For. 1989, 4, 41–45. [Google Scholar]
- Rogers, P.C.; Leffler, A.J.; Ryel, R.J. Landscape assessment of a stable aspen community in southern Utah, USA. For. Ecol. Manag. 2009, 259, 487–495. [Google Scholar] [CrossRef]
- Baker, F.S. Aspen reproduction in relation to management. J. For. 1918, 16, 389–398. [Google Scholar]
- Schier, G.A.; Campbell, R.B. Aspen sucker regeneration following burning and clearcutting on two sites in the Rocky Mountains. For. Sci. 1978, 24, 303–308. [Google Scholar]
- Brown, J.K.; Simmerman, D.G. Appraising fuels and flammability in western aspen: A prescribed fire guide. In USDA FS GTR-INT-205; USDA Forest Service: Washington, DC, USA, 1986. [Google Scholar]
- DeByle, N.V.; Bevins, C.D.; Fischer, W.C. Wildfire occurrence in aspen in the interior western United States. West. J. Appl. For. 1987, 2, 73–76. [Google Scholar]
- Madritch, M.; Greene, S.; Lindroth, R. Genetic mosaics of ecosystem functioning across aspen-dominated landscapes. Oecologia 2009, 160, 119–127. [Google Scholar] [CrossRef] [PubMed]
- LaRade, S.; Bork, E. Short Communication: Aspen forest overstory relations to understory production. Can. J. Plant Sci. 2011, 91, 847–851. [Google Scholar] [CrossRef]
- Worrall, J.J.; Rehfeldt, G.E.; Hamann, A.; Hogg, E.H.; Marchetti, S.B.; Michaelian, M.; Gray, L.K. Recent declines of Populus tremuloides in North America linked to climate. For. Ecol. Manag. 2013, 299, 35–51. [Google Scholar] [CrossRef]
- Hely, C.; Bergeron, Y.; Flannigan, M.D. Effects of stand composition on fire hazard in mixed-wood Canadian boreal forest. J. Veg. Sci. 2000, 11, 813–824. [Google Scholar] [CrossRef]
- Kemperman, J.A.; Barnes, B.V. Clone size in American aspens. Can. J. Bot. 1976, 54, 2603–2607. [Google Scholar] [CrossRef]
- Romme, W.H.; Turner, M.G.; Gardner, R.H.; Hargrove, W.W.; Tuskan, G.A.; Despain, D.G.; Renkin, R.A. A rare episode of sexual reproduction in aspen (Populus tremuloides Michx.) following the 1988 Yellowstone fires. Nat. Areas J. 1997, 17, 17–25. [Google Scholar]
- Long, J.N.; Mock, K. Changing perspectives on regeneration ecology and genetic diversity in western quaking aspen: Implications for silviculture. Can. J. For. Res. 2012, 42, 2011–2021. [Google Scholar] [CrossRef]
- Kulakowski, D.; Veblen, T.T.; Drinkwater, S. The persistence of quaking aspen (Populus tremuloides) in the Grand Mesa area, Colorado. Ecol. Appl. 2004, 14, 1603–1614. [Google Scholar] [CrossRef]
- Kurzel, B.P.; Veblen, T.T.; Kulakowski, D. A typology of stand structure and dynamics of quaking aspen in northwestern Colorado. For. Ecol. Manag. 2007, 252, 176–190. [Google Scholar] [CrossRef]
- Anderegg, W.R.L.; Berry, J.A.; Smith, D.D.; Sperry, J.S.; Anderegg, L.D.L.; Field, C.B. The roles of hydraulic and carbon stress in a widespread climate-induced forest die-off. PNAS 2011, 109, 233–237. [Google Scholar] [CrossRef] [PubMed]
- Shinneman, D.J.; Baker, W.L.; Rogers, P.C.; Kulakowski, D. Fire regimes of quaking aspen in the Mountain West. For. Ecol. Manag. 2013, 299, 22–34. [Google Scholar] [CrossRef]
- Van Wagner, C.E. Conditions for the start and spread of crown fire. Can. J. For. Res. 1977, 7, 23–34. [Google Scholar] [CrossRef]
- Rebain, S.A. The Fire and Fuels Extension to the Forest Vegetation Simulator: Updated Model Documentation; Internal Report; US Department of Agriculture, Forest Service, Forest Management Service Center: Fort Collins, CO, USA, 2010; p. 407. [Google Scholar]
- Cruz, M.G.; Alexander, M.E.; Wakimoto, R.H. Assessing canopy fuel stratum characteristics in crown fire prone fuel types of western North America. Int. J. Wildland Fire 2003, 12, 39–50. [Google Scholar] [CrossRef]
- Scott, J.H.; Reinhardt, E.D. Assessing Crown Fire Potential by Linking Models of Surface and Crown Fire Behavior; RMRS-RP-29; Rocky Mountain Research Station: Fort Collins, CO, USA, 2001; p. 59. [Google Scholar]
- Raymond, C.L.; Peterson, D.L. Fuel treatments alter the effects of wildfire in a mixed-evergreen forest, Oregon, USA. Can. J. For. Res. 2005, 35, 2981–2995. [Google Scholar] [CrossRef]
- Stephens, S.L.; Moghaddas, J.J. Experimental fuel treatment impacts on forest structure, potential fire behavior, and predicted tree mortality in a California mixed conifer forest. For. Ecol. Manag. 2005, 215, 21–36. [Google Scholar] [CrossRef]
- Stephens, S.L.; Moghaddas, J.J. Silvicultural and reserve impacts on potential fire behavior and forest conservation: Twenty-five years of experience from Sierra Nevada mixed conifer forests. Biol. Conserv. 2005, 125, 369–379. [Google Scholar] [CrossRef]
- DeRose, R.J.; Long, J.N. Wildfire and spruce beetle outbreak: Simulation of interacting disturbances in the central Rocky Mountains. Ecoscience 2009, 16, 28–38. [Google Scholar] [CrossRef]
- Klutsch, J.G.; Battaglia, M.A.; West, D.R.; Costello, S.L.; Negron, J.F. Evaluating potential fire behavior in lodgepole pine-dominated forests after a mountain pine beetle epidemic in north-central Colorado. West. J. Appl. For. 2011, 26, 101–109. [Google Scholar]
- Cruz, M.G.; Alexander, M.E. Assessing crown fire potential in coniferous forests of western North America: A critique of current approaches and recent simulation studies. Int. J. Wildland Fire 2010, 19, 377–398. [Google Scholar] [CrossRef]
- Reinhardt, E.D.; Crookston, N.L.; Rebain, S.A. The Fire and Fuels Extension to the Forest Vegetation Simulator and Addendum; RMRS-GTR-116; Rocky Mountain Research Station: Fort Collins, CO, USA, 2007; p. 220. [Google Scholar]
- Edminster, C.B.; Mowrer, H.T.; Sheppard, W.D. Site Index Curves for Aspen in the Central Rocky Mountains; RM-453; Rocky Mountain Research Station: Fort Collins, CO, USA, 1985; p. 4. [Google Scholar]
- Crookston, N.L.; Dixon, G.E. The forest vegetation simulator: A review of its structure, content, and applications. Comput. Electron. Agric. 2005, 49, 60–80. [Google Scholar] [CrossRef]
- Scott, J.H.; Burgan, R.E. Standard Fire Behavior Models: A Comprehensive Set for Use with Rothermel’s Surface Fire Spread Model; USDA FS RMRS-GTR-153; Rocky Mountain Research Station: Fort Collins, CO, USA, 2005; p. 72. [Google Scholar]
- Anderson, H.E. Aids to Determining Fuel Models for Estimating Fire Behavior; General Technical Report INT-122; Forest Range Experiment Station: Ogden, UT, USA; USDA Forest Service: Washington, DC, USA, 1982. [Google Scholar]
- Bradshaw, L.; McCormick, E. Fire Family Plus User’s Guide; General Technical Report RMRS-GTR-67WWW; Rocky Mountain Research Station: Ogden, UT, USA; USDA Forest Service: Washington, DC, USA, 2000. [Google Scholar]
- Crosby, J.S.; Chandler, C.C. Get the most from your windspeed observations. Fire Manag. Today 2004, 64, 53–55. [Google Scholar]
- Stephens, S.L.; Moghaddas, J.J.; Edminster, C.; Fiedler, C.E.; Haase, S.; Harrington, M.; Keeley, J.E.; Knapp, E.E.; McIver, J.D.; Metlen, K.; et al. Fire treatment effects on vegetation structure, fuels, and potential fire severity in western US forests. Ecol. Appl. 2009, 19, 305–320. [Google Scholar] [CrossRef] [PubMed]
- Forest Vegetation Simulator; Version 2.02; United States Department of Agriculture, Forest Service, Forest Management Service Center: Fort Collins, CO, USA, 2013.
- Hothorn, T.; Hornik, K.; Zeilis, A. Unbiased recursive partitioning: A conditional inference framework. J. Comput. Graph. Stat. 2006, 15, 651–674. [Google Scholar] [CrossRef]
- R; Version 3.1.1; A Language and Environment for Statistical Computing; R Foundation for Statistical Computing: Vienna, Austria, 2012; ISBN ISBN 3-900051-07-0.
- Roccaforte, J.P.; Fule, P.Z.; Covington, W. Wallace landscape-scale changes in canopy fuels and potential fire behavious following ponderosa pine restoration treatments. Int. J. Wildland Fire 2008, 17, 293–303. [Google Scholar] [CrossRef]
- Hely, C.; Flannigan, M.; Bergeron, Y.; McRae, D. Role of vegetation and weather on fire behavior in the Canadian mixedwood boreal forest using two fire behavior prediction systems. Can. J. For. Res. 2001, 31, 430–441. [Google Scholar] [CrossRef]
- Alexander, M.E.; Maffey, M.E. Predicting fire behavior in Canada’s aspen forests. Fire Manag. Notes 1993, 54, 10–13. [Google Scholar]
- Drever, C.R.; Drever, M.C.; Messier, C.; Bergeron, Y.; Flannigan, M. Fire and the relative roles of weather, climate and landscape characteristics in the Great Lakes-St. Lawrence forest of Canada. J. Veg. Sci. 2008, 19, 57–66. [Google Scholar] [CrossRef] [Green Version]
- Engber, E.A.; Varner, J.M.; Arguello, L.A.; Sugihara, N.G. The effects of conifer encroachment and overstory structure on fuels and fire in an oak woodland landscape. Fire Ecol. 2011, 7, 32–50. [Google Scholar] [CrossRef]
- Alexander, M.E. Surface fire spread potential in trembling aspen during summer in the boreal forest region of Canada. For. Chron. 2010, 86, 200–212. [Google Scholar] [CrossRef]
- Brown, J.K.; Oberheu, R.D.; Johnston, C.M. Handbook for Inventorying Surface Fuels and Biomass in the Interior West; General Technical Report INT-290; Forest Range Experiment Station: Ogden, UT, USA; USDA Forest Service: Washington, DC, USA, 1982; p. 48. [Google Scholar]
- Rothermel, R.C. A Mathematical Model for Predicting Fire Spread in Wildland Fuels; General Technical Report INT-115; Forest Range Experiment Station: Ogden, UT, USA; USDA Forest Service: Washington, DC, USA, 1972; p. 40. [Google Scholar]
- Cumming, S.G. Forest type and wildfire in the Alberta boreal mixedwood: What do fires burn? Ecol. Appl. 2001, 11, 97–110. [Google Scholar] [CrossRef]
- Wang, C.C. Fire severity in relation to canopy composition within burned boreal mixedwood stands. For. Ecol. Manag. 2002, 163, 85–92. [Google Scholar] [CrossRef]
- Keyser, T.L.; Smith, F.W.; Shepperd, W.D. Trembling aspen response to a mixed-severity wildfire in the Black Hills, South Dakota, USA. Can. J. For. Res. 2005, 35, 2679–2684. [Google Scholar] [CrossRef]
- Smith, E.A.; O’Loughlin, D.; Buck, J.R.; St. Clair, S.B. The influences of conifer succession, physiographic conditions and herbivory on quaking aspen regeneration after fire. For. Ecol. Manag. 2011, 262, 325–330. [Google Scholar] [CrossRef]
© 2014 by the authors; licensee MDPI, Basel, Switzerland. This article is an open access article distributed under the terms and conditions of the Creative Commons Attribution license (http://creativecommons.org/licenses/by/4.0/).
Share and Cite
MDPI and ACS Style
DeRose, R.J.; Leffler, A.J. Simulation of Quaking Aspen Potential Fire Behavior in Northern Utah, USA. Forests 2014, 5, 3241-3256. https://doi.org/10.3390/f5123241
AMA Style
DeRose RJ, Leffler AJ. Simulation of Quaking Aspen Potential Fire Behavior in Northern Utah, USA. Forests. 2014; 5(12):3241-3256. https://doi.org/10.3390/f5123241
Chicago/Turabian StyleDeRose, R. Justin, and A. Joshua Leffler. 2014. "Simulation of Quaking Aspen Potential Fire Behavior in Northern Utah, USA" Forests 5, no. 12: 3241-3256. https://doi.org/10.3390/f5123241