Article

Financial Dilemmas Associated with the Afforestation of Low-Productivity Farmland in Poland

by
Alina Źróbek-Różańska
1,*,
Andrzej Nowak
2,
Magdalena Nowak
2 and
Sabina Źróbek
3
1
Department of Economic and Regional Policy, University of Warmia and Mazury in Olsztyn, ul. Oczapowskiego 4/203, 10-724 Olsztyn, Poland
2
Department of Planning and Spatial Engineering, University of Warmia and Mazury in Olsztyn, ul. Prawocheńskiego 15, 10-724 Olsztyn, Poland
3
Department of Real Estate Management and Regional Development, University of Warmia and Mazury in Olsztyn, ul. Prawocheńskiego 15/117, 10-724 Olsztyn, Poland
*
Author to whom correspondence should be addressed.
Forests 2014, 5(11), 2846-2864; https://doi.org/10.3390/f5112846
Submission received: 10 September 2014 / Revised: 15 November 2014 / Accepted: 18 November 2014 / Published: 24 November 2014

Abstract

:
In Poland, 82% of forests are State-owned, and only 17% of forests constitute private property. Each year, forests are converted to other land-use types, mainly for road construction. The afforestation rate on privately-owned low-productivity land is decreasing steadily. The owners and perpetual usufructuaries of this kind of land are eligible to government subsidies to cover establishment expenditures in whole or in part, provided that the afforestation scheme complies with the local zoning plan or an outline planning permission. The above creates a dilemma for farmers—is this a profitable option of managing low-productivity land? Owners of small farms particularly often face such dilemmas. Owners of small farms, which consist of low-yield agricultural land, can be regarded as investors operating on the real estate market, but those investors have features characteristic of agricultural producers. This study relied on the net present value (NPV) criterion, which is popularly used to assess the effectiveness of investments on the real estate market. A financial feasibility assessment performed with the use of such method in view of afforestation statistics and the 5% discount rate on the Polish forest market revealed the highest increase in net cumulative cash flows in the first five years, followed by a gradual decrease in successive years. The first negative cash flow was reported in year 20. NPV would remain negative because farmers would be charged with periodic maintenance expenditures until the stand reaches harvestable age at approximately 40 years. The longer the investment period, the lower the profits, even if discount rate is excluded. Investments of the type are difficult to terminate because forests younger than 20 years are difficult to sell at a price that covers growing outflows. Afforestation projects are also influenced by other economic and non-economic factors. The paper validates the research hypothesis that afforestation is a long-term investment that delivers benefits for future generations.

1. Introduction

Forests are complex and renewable resources that fulfill many different roles. Above all, forests protect and co-create other natural resources. They shape the landscape, create recreational opportunities and deliver health benefits for humans. Forests have an important economic function by supplying timber, creating jobs and generating income [1], as well as providing various other life-supporting ecosystem services, such as water regulation and prevention of sedimentation [2]. Afforestation can significantly contribute to the revival of rural areas that are progressively degraded due to a decrease in the acreage of productive land, rapid urbanization and the adverse consequences of climate change. The above applies particularly to low-quality and low-yielding soils that could be used for non-agricultural purposes. In a free market economy where most land is privately owned, afforestation cannot be arbitrarily ordained. Every hectare of farmland, including land of the lowest quality class, entitles the owner to direct payments as a source of additional income, which is why the agricultural function is often maintained. Various incentives can be used to encourage woodland creation. The Polish Rural Development Program contains guidelines for improving the condition of the natural environment and rural areas. Pursuant to the provisions of Art. 43 of the Council Regulation (EC) No. 1698/2005, the support provided under Measures 221 and 223 includes establishment costs, maintenance premium for creating new forest (according to Polish law, forest is not equal to plantation- forest is protected by legal regulations and selling timber without permission from the forest inspectorate is strictly forbidden), and afforestation premium to compensate for the loss of income resulting from farmland conversion [3]. The above creates a dilemma for farmers—is this a profitable option of managing low-productivity land? Owners of small farms particularly often face such dilemmas. The average size of an agricultural holding (farm) in the EU-28 is 14.2 hectares. Almost one third (31.5% or 3.9 million) of all agricultural holdings in the EU-28 are situated in Romania, 75% of which are less than 2.0 hectares in size. A quarter of all agricultural holdings in the EU-28 are found in Italy (13.2%) and Poland (12.3%), where the average farm size is less than 10 hectares [4]. In Poland, there is a predominance of farms with an area of two to five hectares (31.9%), five—10 hectares (22.1%) and one to two hectares (19.4%) [5]. A typical European farmer is older than 40. Therefore, afforestation decisions are usually made by farmers who would not derive significant benefits from the sale of woodfuel or biomass [6]) or from large-scale production. Owners of small farms consisting of low-yield agricultural land (the minimum area of afforested land that is eligible for government subsidies is 0.5 ha, and there are plans to lower this requirement to 0.1 ha) can be regarded as investors operating on the real estate market, but those investors have features characteristic of agricultural producers.
The aim of this study was to identify factors that play the most important role in landowners’ decisions regarding afforestation. The determinants of the decision-making process were evaluated with regard to low-productivity land that had been used for agricultural production in the past and fulfills the requirements for conversion to non-agricultural use. Each rational decision requires an analysis of the relevant costs and benefits. The evaluated costs and benefits are financial, economic and non-economic in nature. Financial incentive programs are introduced in Poland to increase the profitability of afforestation schemes and encourage woodland creation. Therefore, Authors intended to highlight the calculations and analysis of relevant cash flows.
The value of net discounted cash flows resulting from particular forest investment was calculated with the use of the methods applied on the real estate market, taking into account the specificity of afforestation projects, discount rate and risk premium applicable to the Polish forestry market. The results were analyzed in view of other factors that influence afforestation decisions.
The structure of the paper was dictated by the complex and interdisciplinary character of the analyzed problem. Background information was presented to discuss the rate of afforestation, conditions for afforestation and financial incentives for woodland creation on the example of Poland. A decision-making algorithm was developed and applied with the use of statistical data and premium rates. The results were used to formulate conclusions and discussions.

2. Background

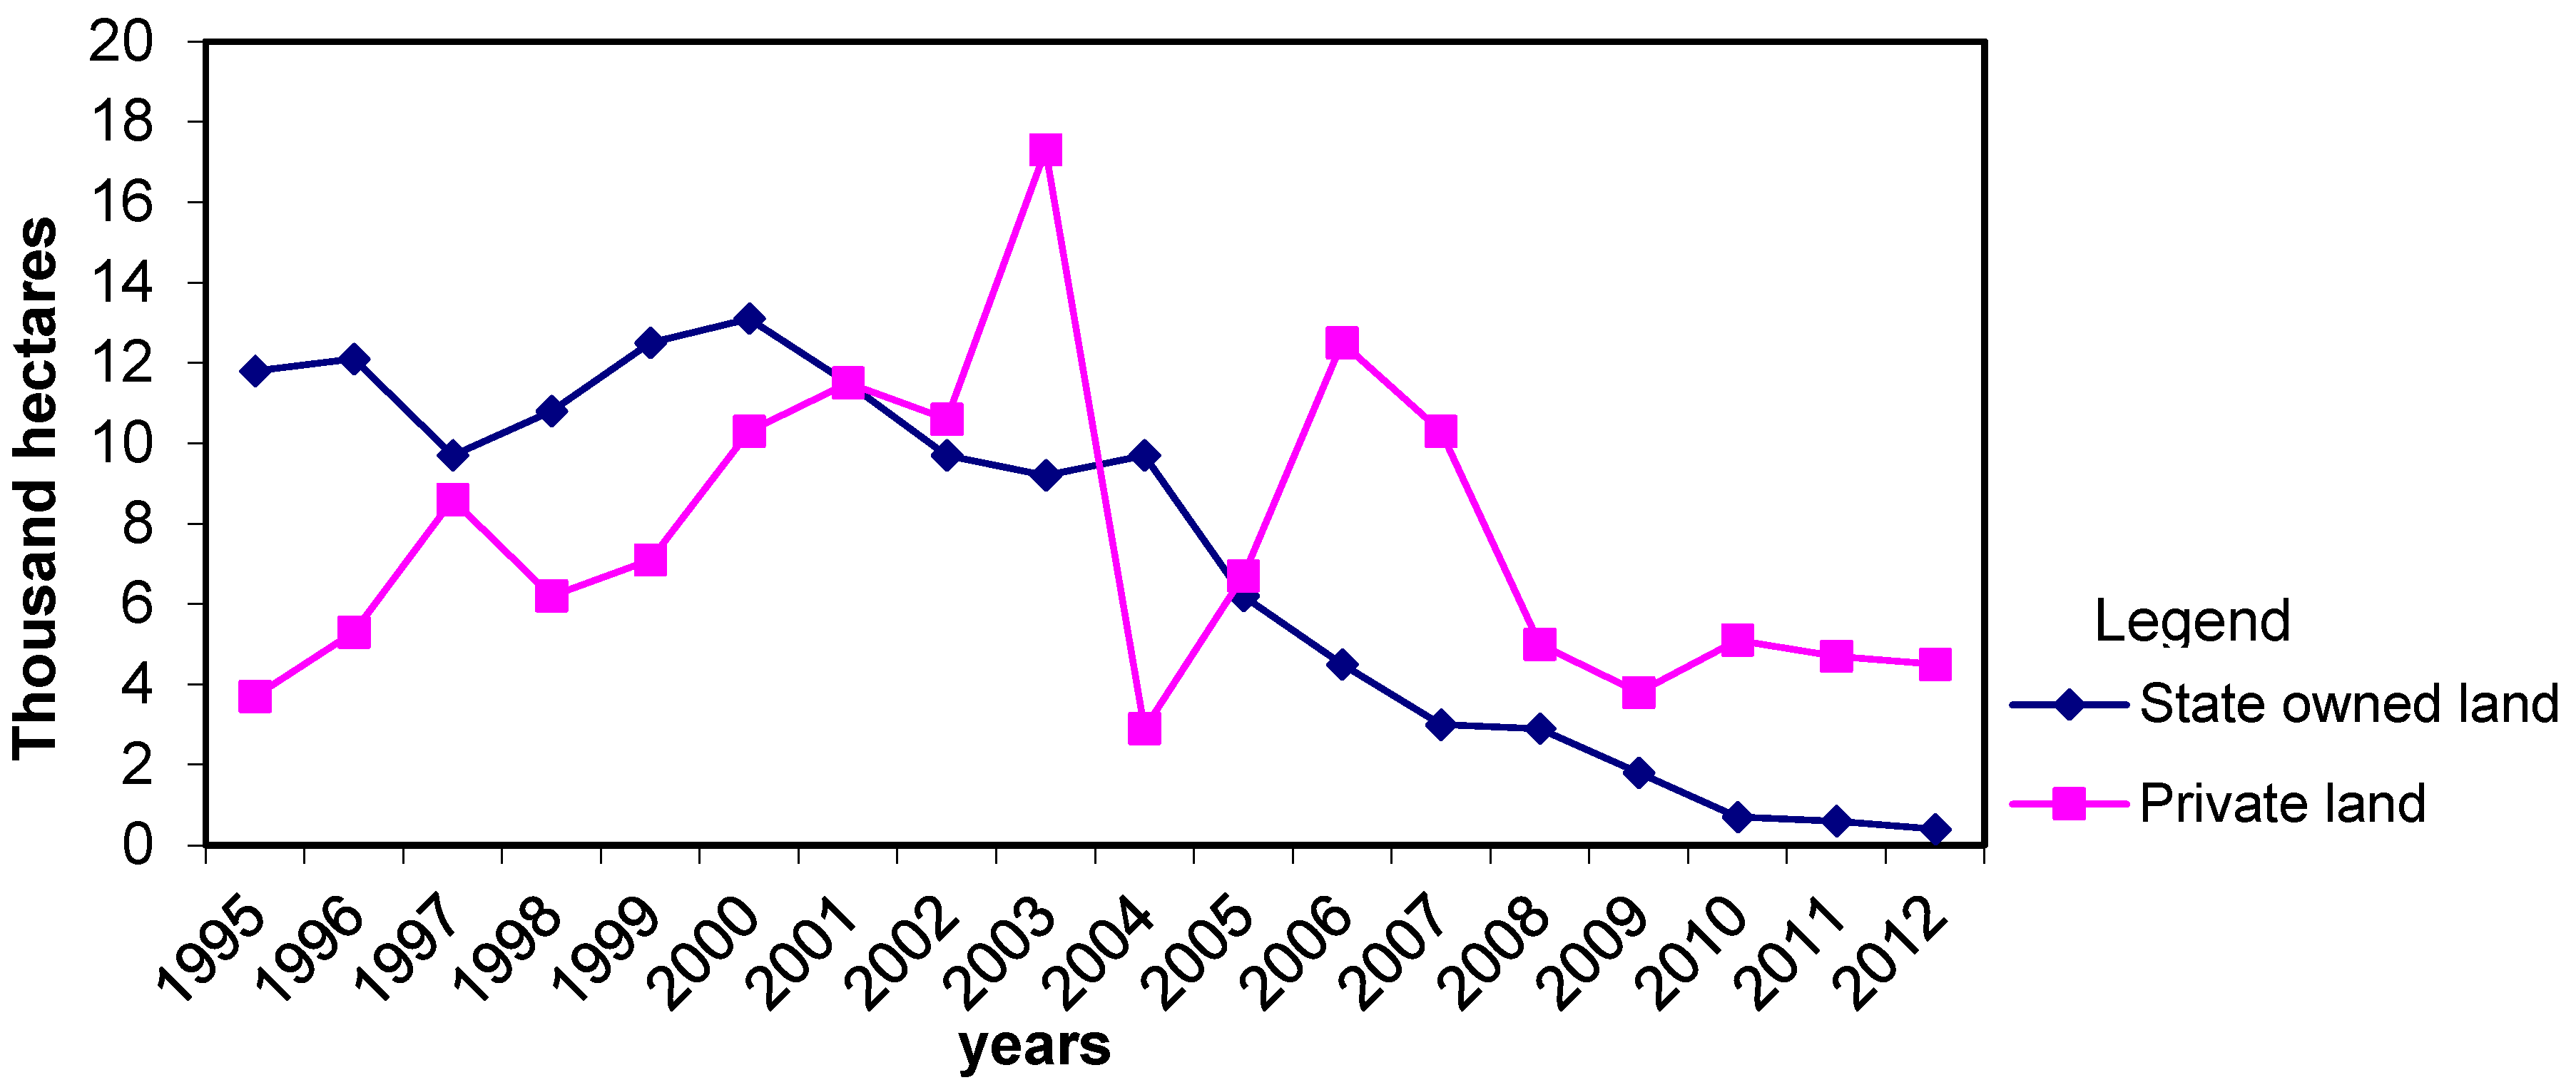
2.1. Afforestation Rate and Conditions for Afforestation in Poland

Farmland occupies around 61% of Poland’s territory, where soils of low (class V) and lowest (class VI) quality class account for approximately 34%. The income generated from poor quality farmland is very low, and it is exempt from income tax. There is a predominance of small farms, and more than 73% of agricultural holdings in Poland are smaller than 10 hectares. Those areas could be converted to non-agricultural purposes. Forests occupy 9,164,000 ha and account for 29.3% of Poland’s territory. In Europe, the average forest cover is estimated at 32%, and in the European Union—at 37.1% [7]. The highest forest cover is noted in countries with a high proportion of land that is unsuitable for purposes other than afforestation, such as mountains or swamps, including in Finland, Sweden, Austria, Belarus and Slovakia. Ukraine, Hungary, Romania, France and Great Britain have lower forest cover than Poland [8].
The majority of Polish forests constitute public property: 82% of forests are owned by the State, 1% is owned by local governments, while 17% constitute private property. The per capita forest area is 0.24 ha, and it is one of the highest in the region (per capita forest area exceeds 1.0 ha only in Finland, Sweden and Norway). Polish forests have a predominance of coniferous tree stands (mainly pine) that account for 70% of total forest area. The most widespread deciduous tree species are birches and oaks with a combined 15% share of Polish forests [8].
Changes in spatial development should be accompanied by an increase in forest cover, but each year, forests are converted to other land-use types, mainly for road construction. Changes in Poland’s afforestation rate since 1995 [9] are presented in Figure 1.
Figure 1. Rate of afforestation in Poland.
Forests 05 02846 g001
Source: Leśnictwo 2013.
In Poland, subsidy payments are available for afforestation of farmland. In 2004, the sharp drop in the afforestation rate of privately-owned land (Figure 1) resulted from a temporary suspension of subsidies. In successive years, the rate at which private land was afforested increased upon the implementation of an afforestation scheme under the Rural Development Program [10]. Poland’s afforestation rate has been decreasing steadily ever since it joined the European Union on 1 May 2004. One of the reasons for the above could be the growing opportunity cost of planting forests on agricultural land due to the loss of direct payments to farmers. Active farmers are also entitled to complementary national direct payments for specific crops or species of farm animals.
Polish afforestation schemes have to comply with the National Program for Increasing Forest Cover, which was developed by the Forest Research Institute and adopted by the Council of Ministers in 1995. The main aim of the Program is to increase Poland’s forest cover to 30% by 2020 and 33% by 2050 and to guarantee the optimal spatial and temporal distribution of afforestation programs in the country. However, program costs are not fully reimbursed by central budget funds that are earmarked for this purpose.
The key legislative act regulating afforestation is the Forest Act of 28 September 1991 where the increase in forest resources is regarded as one of the principles of forest economics. According to art. 14 of the Act, wasteland, farmland not suitable for agricultural production, farmland not used for agriculture and other types of land that are suitable for afforestation, including shifting sands, sand dunes, excavation spoil heaps, defunct sand, gravel, peat and clay excavation pits may be converted to forests. The owners and perpetual usufructuaries of land are eligible to government subsidies to cover establishment costs in whole or in part, provided that the afforestation scheme complies with the local zoning plan or an outline planning permission. In practice, private landowners who decide to plant trees pursuant to the provisions of the Forest Act are entitled to free seedlings (that account for 30%–40% of afforestation costs) and information about the recommended structure of the planted forest. The above provisions of the Forest Act continue to be applied in practice.

2.2. Legal Regulations for the Afforestation of Farmland with EU Financial Assistance

In 2007, the Minister of Agriculture and Rural Development issued a regulation on the detailed requirements and mode of granting financial support as part of the “Afforestation of agricultural and non-agricultural land” measure under the Rural Development Program for 2007–2013 [11]. The regulation significantly modified the previous requirements for granting financial aid to afforestation schemes. At present, landowners planning to embark on an afforestation scheme have to observe the following principles:
  • Forests established by agricultural producers have to be maintained over a period of 15 years, counting from the date of the first afforestation subsidy payment;
  • Land covered by the Natura 2000 network is not entitled to afforestation subsidy payments;
  • The minimum area of afforested land is 0.5 ha (there are plans to lower this requirement to 0.1 ha);
  • Permanent grasslands (meadows and pastures) are not entitled to afforestation subsidy payments (only arable land and orchards are eligible for financial aid);
  • The maximum area of afforested land has been limited to 20 ha per farmer throughout the RDP implementation period;
  • Afforestation premiums are paid over a period of 15 years, counting from the date of forest planting (there are plans to shorten this period to 12 years);
  • The applicants have to derive minimum 25% of total income from farming;
  • Subsidies are also available for woodland creation on non-agricultural land, including in areas undergoing ecological succession, where trees are not older than 20 years [12].
The subsidy rates for the afforestation of farmland are presented in Table 1.
Subsidy payments cover:
  • Establishment expenditures—this is a single payment that covers the expenditures associated with establishing and, optionally, fencing the forest, per hectare of afforested land. The payment is made in the first year after establishment;
  • Maintenance premium—this is a lump-sum payment that covers maintenance services per hectare of afforested land. The payment is made over a period of five years, counting from the date of forest planting (beginning from the second year);
  • Afforestation premium—this is a lump-sum payment that compensates for the loss of income resulting from farmland conversion. The payment is made annually over a period of 15 years, counting from the date of forest planting.
Table 1. Rates of financial support for the afforestation of low-productivity agricultural land, converted to EUR (Average exchange rate: 1 PLN = 0.24 EUR, according to the National Bank of Poland, retrieved on 9 September 2014).
No.Forms of supportTrees
ConiferousDeciduous
1Grant for: (EUR per hectare)
AAfforesting land with favorable configuration *11091258
BAfforesting slopes steeper than 12°13321495
CAfforesting land with favorable configuration using seedlings with Mycorrhiza helper fungi stimulating the root system1373998
DAfforesting slopes steeper than 12° using seedlings with Mycorrhiza helper fungi stimulating the root system15021169
EProtection against wild animals—two-meter-high wire net:(EUR)
- Per one hectare of fenced land622
- Per one running meter of fenced land1.6
2Maintenance premium: (EUR per hectare per year)
AMaintenance premium:
- Land with favorable configuration233
- Slopes steeper than 12°326
BProtection against animals:
- With repellents46
- With three pickets168
- With sheep wool67
3Forestry premium: (EUR per hectare per year)
379
* Plane areas with slope not steeper than 12°; Source: Rozporządzenie Ministra Rolnictwa i Rozwoju Wsi z dnia 19 marca 2009 r. w sprawie szczegółowych warunków...
Local offices of the Agency for the Restructuring and Modernization of Agricultural effect the above payments in line with the subsidy rates indicated in the above table and the afforestation plan developed by the forest inspector. At the time this manuscript was written, the Rural Development Program for the 2014–2020 was submitted for consultation to the European Commission.

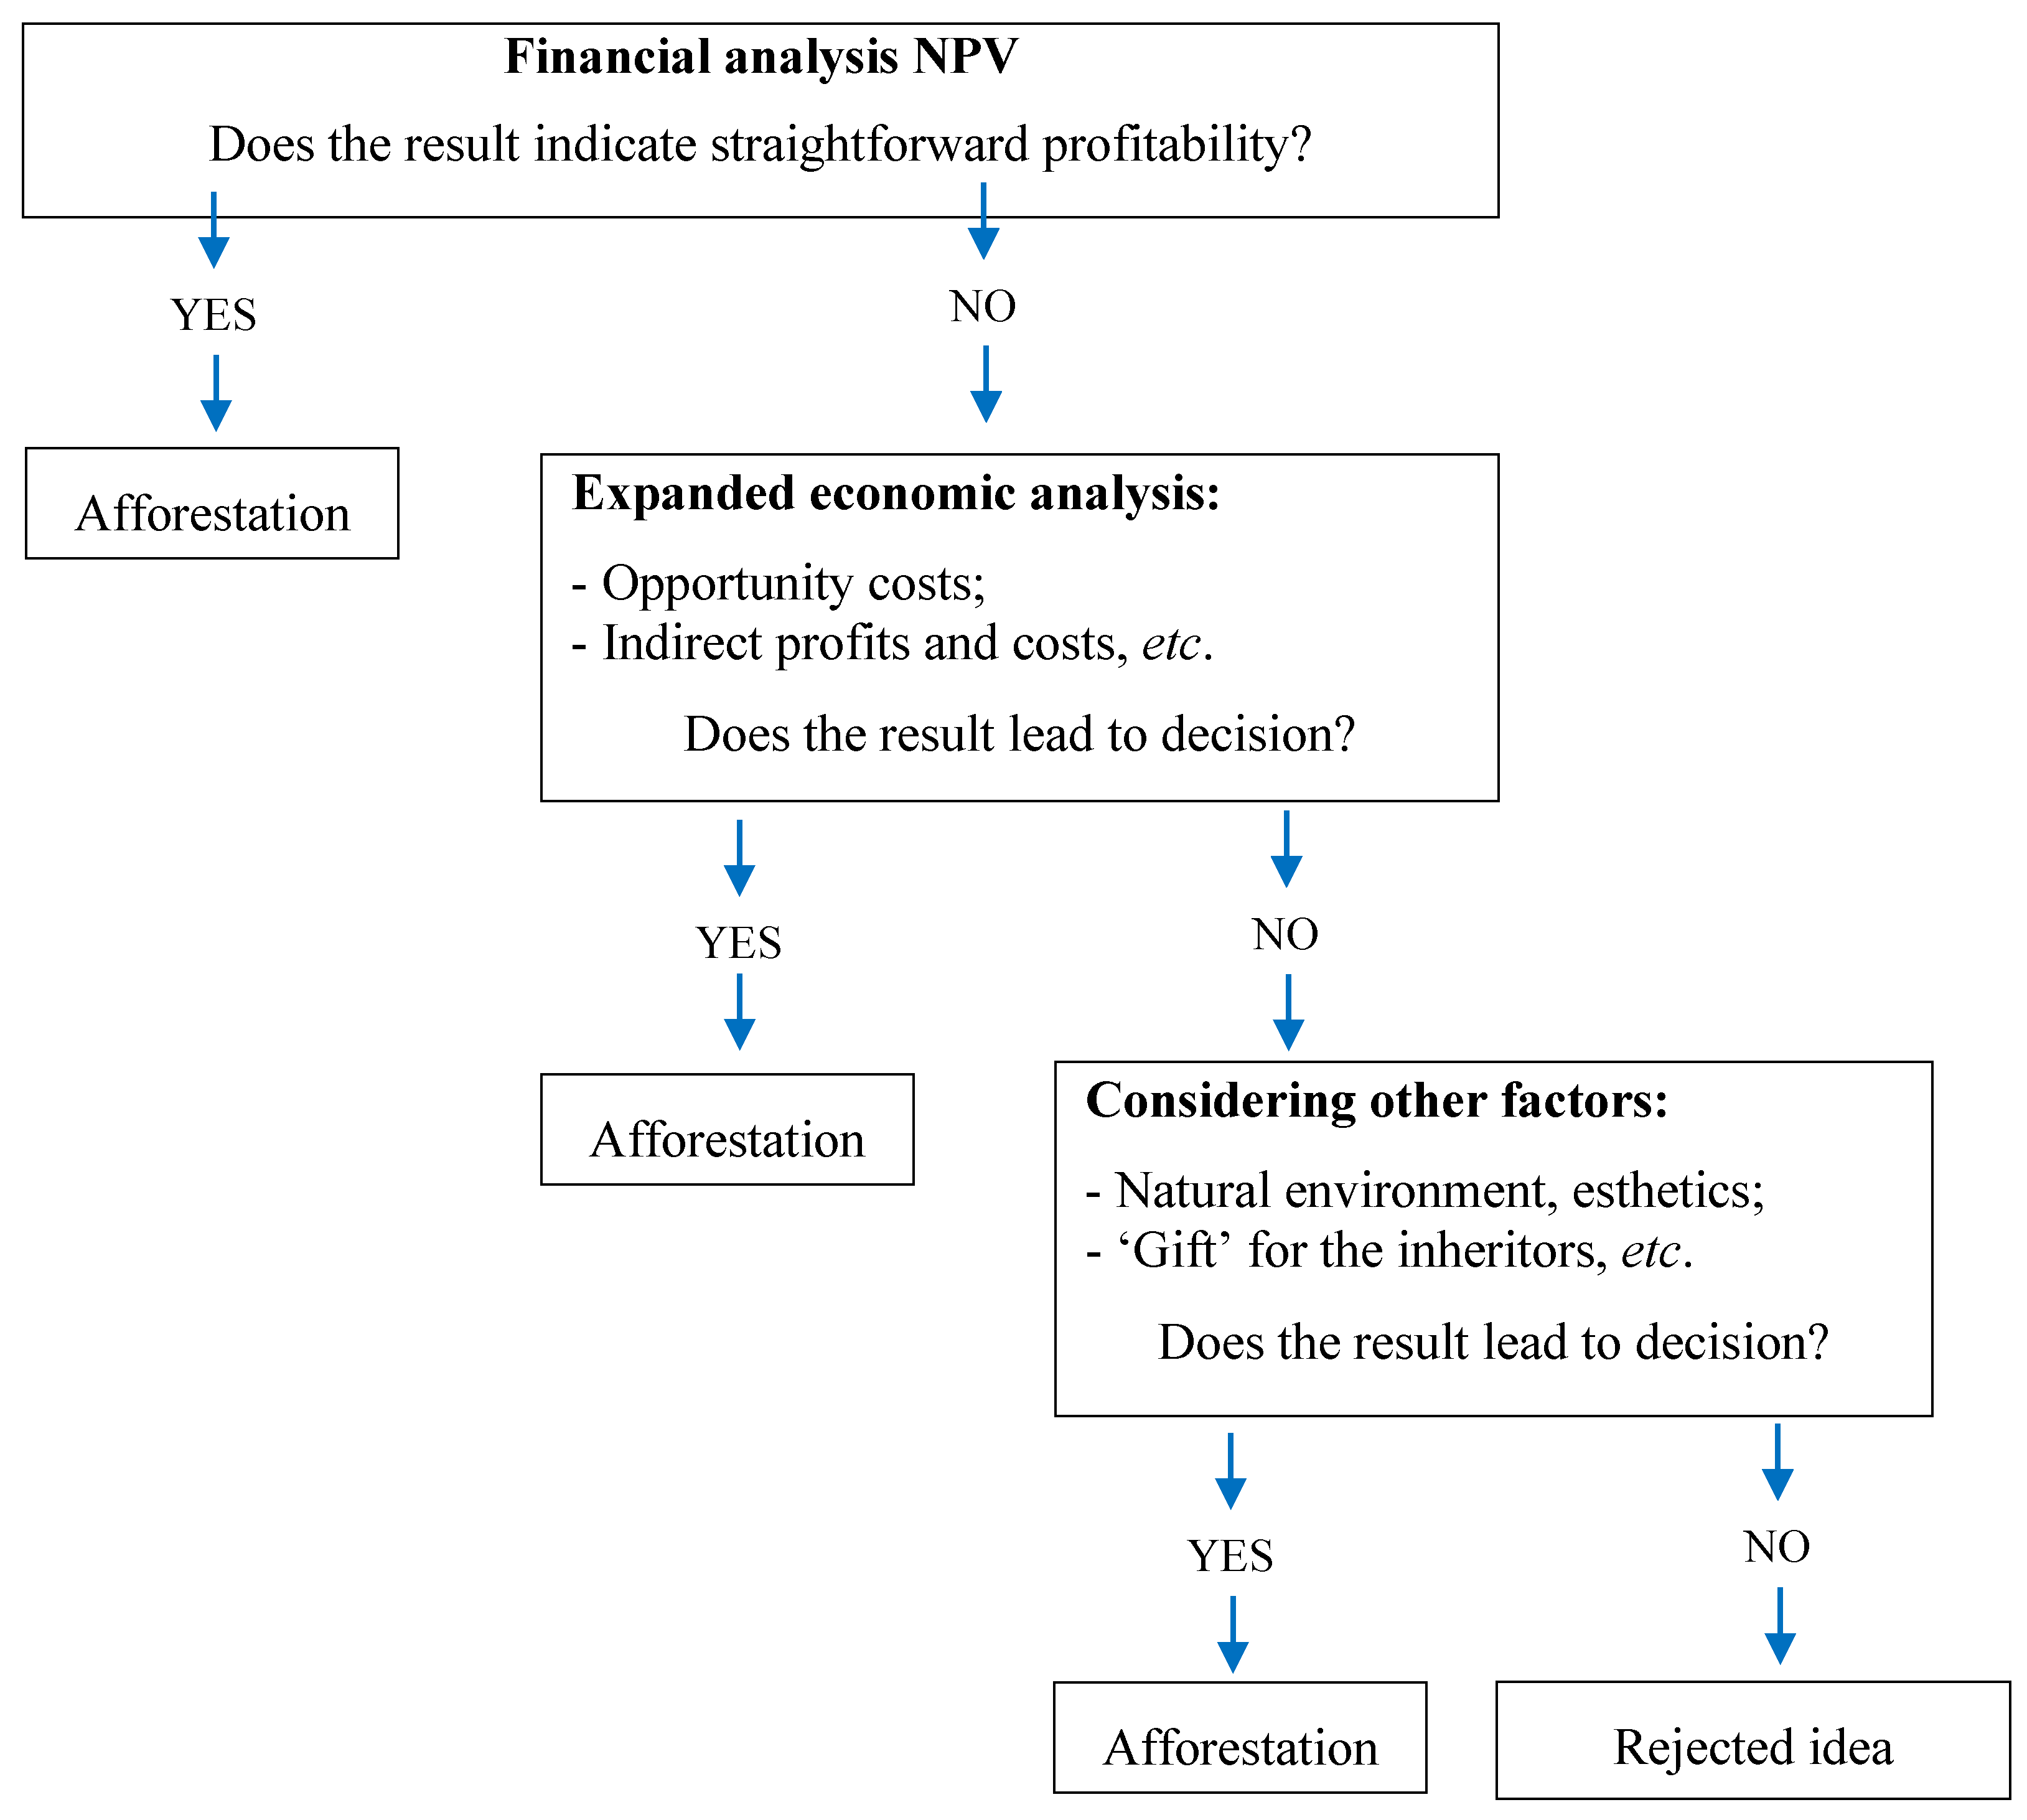
2.3. Decision Making Process on Afforestation

A decision on afforestation requires prior financial analysis and an evaluation of other economic and non-economic considerations. Cash flows that are directly linked with afforestation are examined in a financial analysis, whereas the remaining expenditures and benefits associated with woodland creation, including opportunity costs, are examined in an economic analysis [13,14]. Potential investors should also account for expenditures and benefits that are not quantifiable and may reflect subjective attitudes towards afforestation.
Each economic decision is made by various stakeholders (interested groups or persons) [15]. The decision-maker can be a natural person—a farmer who decides whether his land will be used for agricultural production or afforestation, which are two mutually exclusive purposes. The decision involves the conversion of an existing agricultural function into a new function, namely forest production. In areas where woodland creation is economically justified, financial incentives do not have to be offered because market mechanisms (profit maximization) provide sufficient motivation. In other areas, the factors that affect the decision-making process can be modified by offering various incentives that increase the return from afforestation investments. In the 1950s, Western European countries developed various political tools, such as grants, premiums and subsidies, to increase the appeal of afforestation schemes [16]. In the US, forestry incentive programs come generally in two broad categories: financial assistance (from preferential tax treatment to cost sharing) and technical assistance (consultants) [17]. In Ireland, the introduction of government and EU incentives for woodland creation in the 1980s contributed to an increase in afforestation rates [18]. Most new forests were planted on land that had been used for agricultural purposes. Therefore, landowners are sensitive not only to financial incentives, but also to factors that determine the profitability of alternative uses. Every decision is burdened with an opportunity cost, in this case—termination of agricultural production. In the United States, forest policy involves tools, such as technical support, education, financial incentives and legal regulations. Tax incentives play the most important role [19]. A study of the Spanish forest market covering 1993–2003 revealed that farmers who participated in afforestation schemes co-funded by subsidies earned 3% more than agricultural producers who chose not to convert their land to forests [16].
Farmers have different and complex value systems, and their motives for afforestation could vary significantly. In some cases, they decide to plant forests when land cannot be used for a better alternative purpose. In other cases, farmers’ decisions are motivated only by economic factors, such as the desire to maximize profit, generate satisfactory profit or obtain benefits other than economic gain [20]. Some farmers regard afforestation schemes as an investment that will benefit future generations (heirs), whereas others plant forests for environmental reasons. Forests can enhance the local landscape and increase the appeal of adjacent property. They are planted to preserve biodiversity, offer shelter to livestock and create new grounds for sports and recreation [21]. Forests serve as a source of fuel and generate savings for their owners.
An algorithm simulating decision-making with regard to afforestation of farmland is presented in Figure 2 (this process can be characterized by “step-by-step” evaluation, or alternatively can be characterized by simultaneous evaluation).
Figure 2. Algorithm for decision on afforestation.
Forests 05 02846 g002

3. Methods for Evaluating the Return from Afforestation

3.1. Financial Analysis

Financial analyses are performed with the use of the available computational methods. Dynamic methods appear to be most suitable for analyzing afforestation projects where benefits can be expected after a long time (trees have to reach the right size for timber production) and where the associated expenditures vary over time.
Simple capitalization rules are not highly useful in afforestation projects because forests do not generate fixed annual cash flows. Felled trees can be replaced with new stock, and the relevant expenses can be accounted for as annual operating outflows. This approach is generally used in valuations of plantations, such as vineyards and orchards, but it is not suitable for forests because trees take a long time to reach harvestable age.
Net Present Value (NPV) is one of the most popular indicators for determining the net present worth of cash flows associated with woodland creation. NPV is calculated as discounted total net inflows in each year of the project with the use of the below formula:
N P V = t = 0 n N C F t ( 1 + r ) t
Where: cash flows in t0—pre-establishment expenditures, such as special soil treatments required before afforestation; n—period of investment; NCFt—annual difference between cash outflows and cash inflows related to afforestation (see Table 2); r—discount rate.
In general, cash flows on the real estate market are calculated based on historical data, in view of fixed prices on the day of analysis (the market of goods and services associated with afforestation and the prices on that market are generally stable). Cash flows related to afforestation are simulated with the use of market data published by a territorially competent forest inspectorate. The discount rate is generally estimated based on data from similar markets. In Poland, when market data are insufficient, they have to be computed independently based on the applicable regulations [22]. The discount rate can be expressed as an additive function, where it is equal to the real discount rate rb (adjusted for inflation) plus the market risk premium K and the real estate risk premium kf [23]:
r d =   r b * ( 1 + k f r b ) + K
The real discount rate, i.e., the nominal discount rate rb adjusted for expected inflation ie, can be calculated with the use of the following formula:
r b =   r i e 1 + i e
The next step involves the estimation of the risk premium. One of the methods proposed in the literature is the probabilistic statistical method. This method assumes that the risk of investing in a given real estate can be estimated based on a scatter plot showing the distribution of possible profits around the expected value of property. Risk can be measured by standard deviation σ of a dependent variable, which expresses data scatter in absolute values, or the coefficient of variation VNPV, which is a relative indicator of data scatter around the mean. Auxilliary NPVs are calculated for three different scenarios: basic (B), optimistic (O) and pessimistic (P). They are calculated based on the same discount rate that does not account for the risk premium, the searched factor. The probability (p) of each scenario is estimated. The expected value E(NPV) can be calculated with the use of the below formula [23]:
E ( N P V ) =   p B N P V B +   p O N P V O + p P N P V P
Variance σ2 (NPV) and standard deviation σ(NPV) are determined.
σ 2 ( N P V ) = p B [ N P V B E ( N P V ) ] 2 + p O [ N P V O E ( N P V ) ] 2 + p P [ N P V P E ( N P V ) ] 2
And standard deviation:
σ ( N P V ) = σ 2 ( N P V )
The results are used to calculate the coefficient of variation VNPV, which determines the quotient (kf/rb) used in formula (2):
V N P V =   σ   ( N P V ) E   ( N P V )
The market investment risk is associated mainly with an absence of or a decrease in the demand for timber or an absence of prospective buyers interested in afforested land. The main risks associated with afforestation include fire, pests and higher than planned labor costs.

3.2. Other Factors Determining the Profitability of Afforestation Schemes

A number of important factors should be considered before financial analysis. Proceeds from the sale of timber (tree thinning during the project and tree felling at the end of the project) and government subsidies constitute cash inflows in an afforestation project. Market prices adjusted for inflation are generally used in financial analyses. According to Clinch [24], long-range forecasts for timber prices remain constant in real terms, and price expectations can be determined by current year’s and previous year’s prices. The expenses include establishment outflows, interplanting, fencing, roads and drains, maintenance outflows, expenditures associated with marking and measuring trees for thinning, labor, felling and transport.
The following facts should be taken into consideration in an analysis of afforestation profitability:
  • The inflows generated by forests are also influenced by soil quality class which determines the time required for trees to reach the right size for timber production (the average soil quality class for a given area, e.g. a municipality, is used in calculations);
  • Timber production benefits from economies of scale due to the presence of fixed expenditures and the fact that the amount of subsidies is determined by the size of the afforested area;
  • Expenses differ depending on whether the farmer owns or leases the afforested land, and whether the land has to be reclaimed after tree felling [25];
  • Discount rates vary for different types of investments and investors, e.g., the discount rate for a small farm that diversifies its production profile by planting several hectares of forests will be higher than the discount rate for a well-established enterprise with vast experience on the timber market and the capital market [14].

4. Case study—Detailed Assumptions and Results

The cash flows associated with afforestation were calculated for an afforested plot of land with an area of 5.00 ha (average area, without benefits from economies of scale) and favorable spatial configuration (slope of up to 12°), situated in northeastern Poland in the Region of Warmia and Mazury. The plot comprises arable land of soil quality class V and VI, i.e., lowest-yield farmland. The following species composition and forest structure (typical for forests in the analyzed region) are recommended by the afforestation plan: pine—3.50 ha, birch—0.70 ha, oak—0.50 ha and larch—0.30 ha. An area of 0.80 ha has to be fenced in with wire mesh to the height of 2 m to protect young trees from wild animals. In the remaining parts of the land, trees should be protected with repellent. The investor is an average Polish farmer who is older than 35 (in Poland, 85.3% farmers are older than 35 (the EU average is 93.6%), and most farmers in this group are older than 40. More than half (54%) of EU farmers are older than 45 [26]) and generates at least 25% of his income from agriculture. Detailed information about establishment, maintenance and protection expenditures and possible inflows (in 2013 prices) were calculated based on market prices quoted by the Stare Jabłonki Forest Inspectorate (territorially competent forest inspectorate.) (Table 2). Moreover, according to Polish law, trees cannot be cut down for approximately 90 years, therefore incomes from timber sale were not included.
Table 2. Inflows and outflows associated with afforestation according to the three scenarios (Basic, Optimistic and Pessimistic), in EUR.
No.SpecificationYear
Scenario—Basic012345678910111213141520
1.Inflows 811632523252325232523252189618961896189618961896189618961896
1.1.Afforestation grant—deciduous trees 1509
2.Afforestation grant—coniferous trees 4213
1.3.Fence premium 498
1.4.Maintenance premium without repellents 187187187187187
.Maintenance premium with repellents 11691169116911691169
1.6.Forestry premium 189618961896189618961896189618961896189618961896189618961896
1.7.Incomes from timber sale
2.Outflows 549616661666910636 1188912 1171912912 259259
2.1.Soil preparation 900
2.2.Cost of seedlings 5648484
2.3.Planting 2045307307
2.4.Maintenance—weed control 828828828636636
2.5Maintenance—early brushing 276
2.6.Maintenance—late brushing 259 259259
2.7.Protection against tree chewing 449
2.8Protection against bark stripping 912912 912912912
2.9.Fencing 0.80 hectare with 2 meter wire net 316
2.10.Transport 360168168
2.11.Protection against tree grub worms 3455
2.12.Cost of labor 274274274
3.0 (B).Net Cash Flow 2620158615862342261632527329841896725744744189618961637−259
Scenario—Optimistic Outflows
2.9.Fencing 5.00 h 1980
2.2.Cost of seedlings 5642828
2.3Planting 2045102102
2.7Protection against tree chewing
2.8.Protection against bark stripping
4.0(O)Net Cash Flow 50816421642234226163252164418961896163716561656189618961637−259
Scenario—Pessimistic Outflows
2.1.Soil preparation480900
2.10Transport 414192192
2.12Cost of labor 312312
5.0.(P)Net Cash Flow−4802566157915792342261632527329841896725744744189618961637−259
Source: own elaboration.
Market data for determining the discount rate were not available, and the discount rate was calculated as the sum of the real discount rate and the risk premium (formula 2). Woodland creation is a long-term investment, therefore, the nominal discount rate should be applied to the longest possible investments with minimum risk. Thus, we used 10-year Treasury bonds with annual return of 4% [27] (Floating interest rate), adjusted for the expected inflation rate of 1.1% for Poland [28]. Based on formula 3, the discount rate was determined at 2.9%.
The risk premium for afforestation was calculated using the methods and formulas presented in section 3. Three scenarios were analyzed: basic (B), optimistic (O) and pessimistic (P). The basic scenario reflects a typical situation described by Polish and EU regulations, and it involves average outflows associated with forest establishment and maintenance that are compliant with the afforestation plan developed by the forest inspector (Compliant with the provisions of RDP 2007–2013). In the optimistic scenario, the entire land plot was fenced in to protect young trees from wild animals, which increased outflows, but decreased the number of seedlings for interplanting and the relevant outflows by 5%, and eliminated the outflows associated with protecting seedlings from animals. The pessimistic scenario involves additional outflows related to the elimination of soil pests (one year before forest establishment, i.e. in year t = 0) and a 15% increase outflows related to transport and labor. Those scenarios produced different net cash flows (NCFs), in particular in the first five years of the project (Table 2).
The analysis covers a period of 20 years. This time frame was regarded as sufficient because EU funds will be available in the first 15 years of the project, additional outflows will not be incurred in years 16–19, and maintenance expenditures will appear in year 20. Beginning in year 13, when maintenance expenditures will be incurred (late brushing), NCFs will be identical for each scenario. In the basic scenario, standard outflows associated mainly with the protection of young trees against animals, will be borne until year 11. Those outflows are not incurred in the optimistic scenario, which explains higher cash flows in line 5.0 in Table 2. The data presented in Table 2 were used to determine the risk of investing in an afforestation project. The results (Table 3.) were used to calculate the discount rate for the financial analysis and the NPV for the project.
E(NPV) was calculated on the assumption that the basic scenario is characterized by the highest probability of success (p = 0.5), followed by the pessimistic scenario (p = 0.3) and the optimistic scenario (p = 0.2). Those values were determined based on the authors’ experience (Probabilities were evaluated on the basis of own researches (interviews) conducted among representatives of many forest inspectorates, who prepare afforestation plans for the farmers). Most landowners follow the basic scenario because it does not require additional soil treatments before tree planting or comprehensive fencing which significantly increases expenditures.
Table 3. Predicted net cash flows in subsequent years, for three scenarios (in EUR).
YearNCF for Three ScenariosDiscount Rate i at 5%Discounted NCF
BasicOptimisticPessimisticBasicOptimisticPessimistic
0 −480100 −480
1262050825660.952424954842444
21586164215790.9070143914891432
31586164215790.8638137014181364
42342234223420.8227192719271927
52616261626160.7835205020502050
63252325232520.7462242724272427
773216447320.71075201168520
898418969840.67686661283666
91896189618960.6446122212221222
1072516377250.61394451005445
1174416567440.5847435968435
1274416567440.5568414922414
131896189618960.5303100510051005
141896189618960.5051958958958
151637163716370.4810787787787
160000.4581000
170000.4363000
180000.4155000
190000.3957000
20−259−259−2590.3769−98−98−98
NPV18,06219,01617,519
The following values were obtained for the analyzed property in formulas 4–7 (Table 4):
Table 4. Calculation of the risk premium for afforestation (kf).
E(NPV)σ2(NPV)σ(NPV)VNPVkf
18,08912,815550.0030.009
The risk premium is kf = 0.009% and rd = 5.009% due to a very low risk premium for afforestation in the analyzed property. A 5% discount rate was applied in the case study. The previously calculated NPVs at r = 5% were used in subsequent analyses (Authors also performed a financial sensitivity analysis with different real discount rates. According to Jones Lang LaSalle report [29], the highest rates of return on the Polish real estate market reached at minimum 4% and maximum 8%. However, sensitivity analysis did not show significant differences in the NCF and NPV structure. Only noticeable difference was observed in the case of 8%—the impact of the risk was even smaller, what only confirmed previous assumptions).
Net cumulative discounted cash flows for the discussed scenarios were analyzed in five-year periods. Changes in NPVs between successive five-year periods were calculated (Table 5).
Table 5. Changes in NPVs between successive five-year periods (in EUR—during conversion from PLN to EUR numbers were rounded).
ScenarioBasicChangeOptimisticChangePessimisticChange
NPV for n years
00.009,2790.007,367−4809,216
59,2797,3678,736
5,2807,1055,280
1014,55914,47114,016
3,6004,6413,600
1518,15919,11217,615
−97−96−96
2018,06219,01617,519
The effectiveness analysis performed with the use of the NPV criterion produced the following results:
  • The expenses associated with afforestation will be covered from surplus EU funds until year 19 of the forecast (Table 2).
  • Discounted total net inflows for the forecast period of 20 years are highest for the optimistic scenario due to nearly twice higher net cash flow values in years seven and eight. Less satisfactory results were generated by the pessimistic scenario because afforestation took place on low-productivity farmland, and the expenses associated with soil preparation are not reimbursed. Those considerations should be taken into account by farmers in the decision-making process.
  • Low risk premium kf results from the low value of coefficient of variation VNPV (Table 4). This suggests that in financial assessments of afforestation projects in small farms, the discount rate should be based on observations of investment risk on a given real estate market.

5. Discussion and Conclusions

The afforestation of low-productivity farmland is of great economic and environmental significance, and the relevant knowledge is expanded in many countries around the world. Initiatives supporting the afforestation of privately-owned farmland play a particularly important role in the European Union due to growing environmental concerns. The 1992 reform of the Common Agricultural Policy introduced programs co-financed by the EU, which encourage woodland creation on low-yield farmland. Afforestation of farmland characterized by low productivity is a global issue that is investigated by research centers around the world and discussed in scientific journals. Most studies analyze the effectiveness of government programs supporting the afforestation of farmland. They are often based on the results of surveys addressing farmers, who are asked to describe the key drivers and the main obstacles in the afforestation process [16,20,21,30], or institutions supporting afforestation schemes [19]. Regression models are developed, and marginal effects of forestry subsidies are calculated [18]. Scientists investigate the correlations between afforestation and biomass utilization in the economy [31,32]. There are very few studies, however, which account for the fact that farmers who make planting decisions on low-productivity agricultural land are guided not only by a complex and individual set of values, but also by the results of profitability analyses concerning investments on the real estate market. Statistical data indicate that most planting decisions are made by owners of relatively small farms (under 10 hectares) who are older than 40. This information is rarely found in the literature, but it should be included in studies analyzing the profitability of farmland afforestation with a forecast period of 20 years, where the income generated from biomass is not included in cash flows (In forestry, biomass value is taken into account in stands that are 20-year-old and older. In 20 to 30-year-old stand, the value of harvested timber is equal to the cost of harvest operations).
The highest increase in net cumulative cash flows was observed in the first five years, followed by a gradual decrease in successive years of the project (Table 5). The first negative cash flow was reported in year 20. NPV would remain negative because farmers would be charged with periodic maintenance costs until the stand reaches harvestable age at approximately 40 years. Despite the above, cumulative cash flows would still be positive at a 5% discount rate. The longer the project, the lower the return on investment, therefore, the farmer should consider selling the afforestated land. Market research revealed that properties covered with forests younger than 20 years (forest plantations and thickets) are difficult to sell at a price that covers growing costs. The Polish forest market is generally limited.
A positive NPV is an indicator of financial profitability. However, it is up to the farmer to decide whether a positive NPV is sufficiently motivating to launch an afforestation project. The investor should confront the results of a financial analysis with other economic and non-economic factors in line with the mind map presented in Figure 2:
  • Afforestation of farmland can be integrated with agricultural production to deliver positive external effects.
  • In weakly developed regions and in areas affected by a crisis where agriculture is the only available source of income, afforestation could create new jobs during stand establishment, tree maintenance, timber preparation for sale (In Poland, farmers can achieve and sell timber after receiving permission from relevant forest inspectorate; usually only for the trees that are 90-120 years old), etc. [20].
  • Farmland conversion has an associated opportunity cost (loss of income resulting from farmland conversion). Several scenarios should be analyzed by simulating the benefits and costs of various decisions: (a) change in land-use type; (b) maintenance of farmland for agricultural use; (c) diversification of land-use types. This issue was not discussed in the study, and it could be the topic of a separate paper. However, average opportunity cost resulting from the loss of income from agriculture was calculated by Polish governmental institutions and is compensated by annual forestry premium.
  • Afforestation of considerable land areas could create additional sources of income from the sale of forest produce (mushrooms, berries) and recreational activities organized in the forest [25].
  • Afforestation projects could secure future pension stability or offer financial security for the investor’s heirs.
Regardless of economic considerations, the final decision on forest establishment is made by an individual who has specific preferences, therefore, it is also influenced by non-economic factors. A farmer may decide against afforestation if it stirs negative emotions associated with the abandonment of food production, low flexibility and a long time required to grow a forest, fear of loss of control over farmland, lifestyle changes and the need to fulfill complex administrative formalities to obtain subsidies and premiums. Moreover, an afforestation project involves risks associated with the long period of investment during which changes could take place in forest policy (In RDP 2007–2013, the afforestation premium was paid for 15 years, but in RDP 2014–2020, this period has been shortened to 12 years) and the macroeconomic environment. Other sources of uncertainty include natural factors (weather, fire, pests and disease), technological progress that changes demand for timber, changes in interest rates and labor costs. In some cases, forests are planted for esthetic and environmental reasons. Afforestation may also be regarded as a gift for heirs who can profit from the sale of timber when the stand reaches harvestable age.
The results of a financial analysis and the evaluated economic and non-economic factors confirm the research hypothesis that afforestation is a long-term investment that will generate benefits for future generations.

Acknowledgement

Funding was provided by the University of Warmia and Mazury in Olsztyn, Poland (the Faculty of Economic Sciences and the Faculty of Geodesy and Land Management).

Author Contributions

The authors contributed equally to this work.

Conflicts of Interest

The authors declare no conflict of interest.

References and Notes

  1. De Groot, R.S. Functions of Nature; Evaluation of Nature in Environmental Planning, Management and Decision-Making; Wolters-Noordhoff: Groningen, The Netherlands, 1992. [Google Scholar]
  2. Nguyen, T.T.; Pham, V.D.; Tenhunen, J. Linking regional land use and payments for forest hydrological services: A case study of Hoa Binh Reservoir in Vietnam. Land Use Policy 2013, 33, 130–140. [Google Scholar]
  3. The Ministry of Agriculture and Rural Development. Available online: http://www.minrol.gov.pl/pol/Wsparcie-rolnictwa-i-rybolowstwa/PROW-2007-2013/Dzialania-PROW-2007-2013/Os-2-Poprawa-srodowiska-naturalnego-i-obszarow-wiejskich/Zalesianie-gruntow-rolnych-oraz-zalesianie-gruntow-innych-niz-rolne (accessed on 29 July 2014).
  4. Eurostat. Agriculture, Forestry and Fishery Statistics; European Comission: Luxembourg, Germany, 2013, 2013 ed. p. 25. Available online: http://epp.eurostat.ec.europa.eu/cache/ITY_OFFPUB/KS-FK-13-001/EN/KS-FK-13-001-EN.PDF (accessed on 9 September 2014).
  5. Main Statistical Office of Poland. Agriculture in 2013; GUS: Warszawa, Poland, 2014; p. 127. [Google Scholar]
  6. Kolovos, K.; Kyriakopoulos, G.; Chalikias, M. Co-evaluation of basic woodfuel types used as alternative heating sources to existing energy network. J. Environ. Prot. Ecol. JEPE 2011, 12, 733–742. [Google Scholar]
  7. Main Statistical Office of Poland. Leśnictwo 2013; GUS: Warszawa, Poland, 2014; p. 341. [Google Scholar]
  8. State Forests General Directorate. Report on the Condition of Polish Forests 2012; DGLP: Warszawa, Poland, 2013; p. 85. [Google Scholar]
  9. The Ministry of Environment. National Program for Increasing Forest Cover; MŚ: Warszawa, Poland, 2003; p. 55. [Google Scholar]
  10. The Ministry of Agriculture and Rural Development. Draft for Rural Development Program 2014–2020; MRiRW: Warszawa, Poland, 2013; p. 380. Available online: http://www.arimr.gov.pl/fileadmin/pliki/dokumenty/Zarys_PROW_2014-2020_15042013.pdf (accessed on 9 September 2014).
  11. Regulation of the Agriculture and Rural Development Minister from 19 March 2009 on afforestation of agricultural and non-agricultural land measure under the Rural Development Program for 2007–2013. Available online: http://www.arimr.gov.pl/fileadmin/pliki/zdjecia_strony/204/kfl/Rozporzadzenie_2009.pdf (accessed on 20 November 2014).
  12. Regulation of the Council of Ministers from 11 August 2004. Available online: http://isap.sejm.gov.pl/DetailsServlet?id=WDU20041871929 (accessed on 20 November 2014).
  13. Nguyen, T.T.; Koellner, T.; Le, Q.B.; Lambini, C.L.; Choi, I.; Shin, H.; Pham, V.D. An economic analysis of reforestation with a native tree species: The case of Vietnamese farmers. Biodivers. Conserv. 2014, 23, 811–830. [Google Scholar]
  14. Gregsen, H.; Contreras, A. Economic Assessment of Forestry Project Impacts; World Bank United Nations Environemnt Programme: Rome, Italy, 1995. Available online: http://www.fao.org/docrep/008/t0718e/t0718e04.htm#bm04 (accessed on 30 July 2014).
  15. Lette, H.; de Boo, H. Economic Valuation of Forests and Nature: A Support Tool for Effective Decision-Making; Theme Studies Series/ (Forests, Forestry and Biodiversity Support Group); International Agricultural Centre (IAC): Wageningen, The Netherlands, 2002; p. 20. [Google Scholar]
  16. Marey-Perez, M.F.; Rodriguez-Vicente, V. Forest transition in Northern Spain: Local responses on large-scale programmes of field-afforestation. Land Use Policy 2009, 26, 139–156. [Google Scholar] [CrossRef]
  17. Daniels, S.E.; Kilgore, M.A.; Jacobson, M.G.; Greene, J.L.; Straka, T.J. Examining the Compatibility between Forestry Incentive Programs in the US and the Practice of Sustainable Forest Management. Forests 2010, 1, 51. [Google Scholar] [CrossRef]
  18. McCarthy, S.; Matthews, A.; Riordan, B. Economic determinants of private afforestation in the Republic of Ireland. Land Use Policy 2003, 20, 51–59. [Google Scholar] [CrossRef]
  19. Ma, Z.; Butler, B.J.; Catanzaro, P.F.; Greene, J.L.; Hewes, J.H.; Kilgore, M.A.; Kittredge, D.B.; Tyrrell, M. The effectiveness of state preferential property tax programs in conserving forests: Comparisons, measurements and challenges. Land Use Policy 2014, 36, 492–499. [Google Scholar] [CrossRef]
  20. Duesberg, S.; Ni Dhubhain, A.; O’Connor, D. Assessing policy tools for encouraging farm afforestation in Ireland. Land Use Policy 2014, 38, 194–203. [Google Scholar] [CrossRef]
  21. Lawrence, A.; Dandy, N. Private landowners’ approaches to planting and managing forests in the UK: What’s the evidence? Land Use Policy 2014, 36, 351–360. [Google Scholar] [CrossRef]
  22. Regulation of the Council of Ministers from 21 September 2004 on property valuation and appraisal reports. Available online: http://isap.sejm.gov.pl/DetailsServlet?id=WDU20042072109 (accessed on 20 November 2014).
  23. Klajn, J. Określanie wartości innych niż rynkowa w odniesieniu do nieruchomości przemysłowych w Krakowie. Stud. Mater. Tow. Nauk. Nieruchomo. 2010, 18, 17–28. [Google Scholar]
  24. Clinch, P. Economics of Irish Forestry; COFORD: Dublin, Ireland, 1999. [Google Scholar]
  25. International Valuation Standards Council. The Valuation of Forests; Exposure Draft: London, UK, 2013; p. 29. [Google Scholar]
  26. Poczta, W. Gospodarstwa Rolne w Polsce na tle Gospodarstw Unii Europejskiej—Wplyw WPR 2013; Main Statistical Office in Poland: Warszawa, Poland; p. 162.
  27. The Ministry of Finance. Treasure Bonds. Available online: http://www.obligacjeskarbowe.pl (accessed on 6 August 2014).
  28. National Bank of Poland. Inflation report for July 2014. Available online: http://nbp.pl/polityka_pieniezna/dokumenty/raport_o_inflacji/raport_lipiec_2014.pdf (accessed on 6 August 2014).
  29. Warsaw City Report, Jones Lang LaSalle: Warszawa, Poland, 2013.
  30. Duesberg, S.; O’Connor, D.; Ni Dhubhain, A. To plant or not to plant—Irish farmers’ goals and values with regard to afforestation. Land Use Policy 2013, 32, 155–164. [Google Scholar] [CrossRef]
  31. Chalikias, M.; Kyriakopoulos, G.; Kolovos, K. Environmental sustainability and financial feasibility evaluation of woodfuel biomass used for a potential replacement of conventional space heating sources. Part I: A Greek Case Study. Oper. Res. 2010, 10, 43–56. [Google Scholar]
  32. Kyriakopoulos, G.; Kolovos, K.; Chalikias, M. Environmental sustainability and financial feasibility evaluation of woodfuel biomass used for a potential replacement of conventional space heating sources. Part II: A Combined Greek and the nearby Balkan Countries Case Study. Oper. Res. 2010, 10, 57–69. [Google Scholar]

