Expression Analysis of the NAC Transcription Factor Family of Populus in Response to Salt Stress


1
College of Forestry, Shanxi Agricultural University, Taigu 030801, China
2
State Key Laboratory of Tree Genetics and Breeding, Northeast Forestry University, 51 Hexing Road, Harbin 150040, China
*
Author to whom correspondence should be addressed.
Forests 2019, 10(8), 688; https://doi.org/10.3390/f10080688
Submission received: 27 June 2019
/
Revised: 31 July 2019
/
Accepted: 13 August 2019
/
Published: 14 August 2019
(This article belongs to the Special Issue Climate-Related Adaptive Genetic Variation and Population Structure in Forests)
Abstract
:Research Highlights: Sequence phylogeny, genome organisation, gene structure, conserved motifs, promoter cis-element and expression profiling of poplar NACs related to salt stress were detected. In addition, expression of two salt-induced NACs was analysed. Background and Objectives: NAC transcription factor (TF) proteins are involved in a wide range of functions during plant development and stress-related endurance processes. To understand the function of Populus NAC TFs in salt stress tolerance, we characterised the structure and expression profile of a total of 289 NAC members. Materials and Methods: Sequence phylogeny, genome organisation, gene structure, motif composition and promoter cis-element were detected using bioinformatics. The expression pattern of Populus NAC TFs under salt stress was also detected using RNA-Seq and RT-qPCR. Results: Synteny analysis showed that 46 and 37 Populus NAC genes were involved in whole-genome duplication and tandem duplication events, respectively. The expression pattern of Populus NAC TFs under salt stress showed the expression of the 289 PtNACs of 84K poplar was induced. Similar expression trends of NACs were found in Populus simonii × P. nigra T. S. Hwang et Liang and Arabidopsis thaliana (L.) Heynh. Conclusions: The correlation analysis showed that the expression of two differentially expressed NAC genes PtNAC024 and PtNAC182 was significantly associated with most of the 63 differentially expressed genes tested. The expression of PtNAC024 and PtNAC182 in different tissues was also analysed in silico and different expression patterns were found. Together, this study provides a solid basis to explore stress-related NAC TF functions in Populus salt tolerance and development.
1. Introduction
Gene expression regulation at the level of transcription can directly or indirectly influence many biological processes in plants, such as cellular morphogenesis, metabolic and physiological balance, signalling transduction and stress responses [1]. Plant growth and development is affected on differential gene expression and is controlled by transcription factors (TFs) acting as switches of regulatory cascades depending on the cell type [2]. Furthermore, the alterations of transcriptional regulators gene expression is becoming a major source of the diversity and change during the evolution process of plants [3]. TFs are proteins that regulate gene expression by binding to specific DNA elements located in gene promoters and/or introns [1,4]. Therefore, the identification and function characterisation of TFs is essential for understanding transcriptional regulatory networks [5,6]. In plants, with the development of bioinformatics and the bioinformatics database, a total of 320,370 TFs from 165 species have been identified [7]. The number of TFs proteins of Arabidopsis thaliana (L.) Heynh. is more than 2296, about 9.2% of its estimated total number of genes [7,8]. As for Populus, the number of TFs is about 4287 accounting for 9.5% of its genome and the proportion is similar to that of Arabidopsis thaliana [7,9,10].
NAC family proteins with a consensus sequence known as the NAC domain (NAM, ATAF1, ATAF2 and CUC2) are plant-specific TFs represented by ~105 genes in Arabidopsis [11], ~140 in rice [12] and ~163 in Populus genomes [6]. The conserved NAC domain is always located in the N-terminal region of NAC proteins and divided into the five A–E subdomains [11,13,14]. The NAC domains have been implicated in nuclear localisation, DNA binding and formation of homodimers or heterodimers with other NAC proteins [15,16,17,18,19]. In contrast, the C-terminal region of NAC proteins is generally not conserved and confers transcriptional activation diversity [5,11,12,13,18,20,21,22,23,24,25]. NAC proteins have been reported to participate in a wide range of plant development processes, including floral organ morphogenesis [26,27], lateral root development [28,29], shoot apical meristem and branching development [13,30,31], xylogenesis and fiber formation in vascular plants [20,21,25,32,33]. In addition, numerous NAC proteins play crucial roles in plant abiotic stress and defence responses, including responses to drought, salinity, cold, mechanical wounding and viral infection [22,34,35,36,37,38]. In Arabidopsis, ANAC019 was identified as a positive regulator of abscisic acid (ABA) signalling, conferring ABA-hypersensitivity when ectopically expressed in plants [19]. NTL8, a membrane-bound NAC TF induced by high salinity mediates salt regulation in Arabidopsis seed germination via the gibberellin acid (GA) pathway, primarily independently of ABA [39]. Its expression is increased by the GA biosynthetic inhibitor paclobutrazol (PAC) and is repressed by GA. NTL8 activity is also regulated by the controlled proteolytic release of the membrane-bound NTL8 form. Its release from the membranes is activated by PAC and high salinity. Interestingly, ATAF1 cloned from Arabidopsis is repressed by necrotrophic fungal and bacterial pathogens and acts as a negative regulator during the defence responses process [40]. Expression of ATAF1 is down-regulated after infection with Botrytis cinerea or Pseudomonas syringae pv. tomato or after treatment with salicylic acid (SA), jasmonic acid and 1-amino cyclopropane-1-carboxylic acid (the precursor of ethylene biosynthesis). Transgenic plants that overexpress the ATAF1 gene (ATAF1-OE) show increased susceptibility while those expressing an ATAF1 chimeric repressor construct (ATAF1-SRDX) exhibit enhanced resistance to P. syringae pv. tomato DC3000, B. cinerea and Alternaria brassicicola. In ATAF1-OE plants, SA-induced expression of pathogenesis-related genes and disease resistance against P. syringae pv. tomato DC3000 was partially suppressed. Another gene, SNAC1, plays an important role in the rising drought stress tolerance [35]. Plants expressing SNAC1 display significantly enhanced tolerance to drought and salinity in multiple generations and their leaves contain higher levels of water and chlorophyll, as compared to the wild type.
Although quite a few NAC TFs have been functionally characterised in model plants such as Arabidopsis and rice, the functions of most NAC proteins remain unknown [6]. Especially in Populus, the typical model of tree species, there are only very limited reports on the salt stress tolerance characterisation of NAC TFs. Movahedi et al. (2015) reported that the CarNAC3 and CarNAC6 salinity and drought tolerant genes from Cicer arietinum play a significant role in improving drought and salt tolerance when expressed in poplar [37]. Among poplars, the 84K (Populus alba × P. glandulosa) poplar is known by foresters to be relatively resistant to water stress, low temperature, diseases and insects. As the main afforestation species in North China, the 84K poplar is of great ecological importance [36]. Shen et al. (2009) carried out a genome-wide informatics survey on plant NAC TFs and identified a total of 148 NAC TFs from Populus [41]. However, their report only pertains to the sequence phylogeny analysis [41]. Hu et al. (2010) performed a relatively comprehensive analysis of the Populus NAC gene family and identified 163 NAC TFs [6]. In this article, we have used a genome-wide approach taking advantage of the functional diversity of the NAC proteins to dissect structure–function aspects of NAC TF modularity. This approach revealed an expanded NAC family with a total of 289 members. We performed a detailed analysis including sequence phylogeny, genome organisation, gene structure, conserved motifs, promoter cis-element and expression profiling of genes underlying salt stress. Noteworthy, we found that two NAC genes (PtNAC024 and PtNAC182) were significantly induced by salt stress and showed different tissue-specific expression patterns. The function and expression patterns of these two genes will be further characterised with respect to poplar growth and stress endurance in our future studies. Taken together, this will provide a basis to explore stress-related NAC TF members and clarify their response to abiotic stress in Populus.
2. Materials and Methods
2.1. Database Search and Phylogenetic Analysis of NAC Proteins
A systematic search was performed for NAC TFs in Populus using PlantTFDB (Version 4.0, http://planttfdb.cbi.pku.edu.cn/family.php?sp=Ptr&fam=NAC) [7]. The NAM domain in each Populus NAC protein was further manually confirmed using the InterProScan programme (http://www.ebi.ac.uk/interpro/). The sequences of Arabidopsis NAC proteins were searched and downloaded from the Arabidopsis genome TAIR 9.0 (http://www.Arabidopsis.org/index.jsp). Multiple sequence alignments of NAC proteins were performed using Clustal X 1.83. Unrooted phylogenetic trees were constructed with MEGA 7.0.21 using the Neighbour Joining (NJ) method and the bootstrap test carried out with 2100 iterations [42]. Pairwise gap deletion mode was used to ensure that the more divergent C-terminal domains could contribute to the topology of the NJ tree.
2.2. Chromosome Location and Synteny Analysis of NAC Genes
Genes on genome were located using the TBtools with the “Map Genes On Genome From Sequence Files” methods (http://www.tbtools.com/). The subject sequences were downloaded from Phytozome (https://phytozome.jgi.doe.gov/pz/portal.html#!info?alias=Org_Ptrichocarpa). Intra-species gene synteny and collinearity were detected by MCScanX using default parameters considering pBLAST ≤ 1 × 10⁻⁵. Links of colinear blocks between sets of Linkage Groups (LGs)/chromosomes are shown by circle plot [43].
2.3. Gene Structure and Conserved Motifs Analysis of NAC Genes
Toolbox for Biologist (TBtools V0.664445552, http://www.tbtools.com/) was used to illustrate the gene structure of individual NAC transcripts by comparison with their corresponding genomic DNA sequences from Phytozome (https://phytozome.jgi.doe.gov/pz/portal.html#!info?alias=Org_Ptrichocarpa) [44]. Conserved motifs in 289 Populus NAC proteins were detected using the programme MEME version 5.0.2 [45]. MEME was run with the following parameters: Any number of repetitions, 15 maximum number of motifs and between six and 50 residues for the optimum motif widths. Structural motif annotation was performed using the SMART and Pfam databases [46,47].
2.4. Promoter Cis-Element Analysis
Promoter sequences (2 kb upstream of the translation start site) of Populus NACs were blasted and obtained from the Phytozome v12.1 database. The cis-elements prediction and location in promoters was performed using the PlantCRAE (http://bioinformatics.psb.ugent.be/webtools/plantcare/html/) programme [48].
2.5. Gene Ontology Annotation
Functional grouping and annotation of Populus NACs were analysed using the programme Blast2GO v 5.2 [49]. The default blast annotation configurations were used in our study according to the manual (http://docs.blast2go.com/user-manual/). Genes are presented in terms related to three levels of Gene Ontology (GO) classification as follows: Biological processes, molecular functions and cellular components.
2.6. Plant Materials and Stress Treatment
Twigs cut from 84K poplar (P. alba × P. glandulosa) with the same genetic background were grown in the Murashige and Skoog (MS) medium for one month under conditions of 60%–70% relative humidity, 16/8-h light/dark cycle and an average temperature of 25 °C, and then transferred to hydroponic cultivation for one month under similar conditions. After that, strong and healthy strain with similar state were divided into two groups and treated with 0.15 M salt (S1, S2, S3, S4) or regular water (W1, W2, W3, W4) for 24 h, respectively. Four clones in the same tested group served as biological replicates. Secondary leaves from each of the replicates (eight samples) were collected, frozen immediately in liquid nitrogen and stored at −70 °C for RNA isolation. RNA extraction was processed according to the protocol presented in our former study [50].
2.7. Expression Characterization of NACs Using RNA-Seq
Total RNA of each sample was shipped to the GENEWIZ Company (https://www.genewiz.com/) for library construction and RNA-Seq using the Illumina HiSeq 2500 platform. Sequencing library construction and RNA-Seq data analysis were performed as in our former studies. Gene expression profiling by RNA-Seq is a powerful method to identify the molecules involved in environmental stress endurance. Gene expression was reported as fragments per kilo-base transcript per million mapped reads (FPKM). Identification of differentially expressed genes (DEGs) was performed in this study. The overall expression in the salt-treated (S1, S2, S3, S4) and the control (W1, W2, W3, W4) plants was compared using the software Pop’s Pipes (http://sys.bio.mtu.edu/) and degeR was chosen to identify the DEGs. The false discovery rate was controlled at 0.05 for multiple tests correction in the Pop’s Pipes processing. The fold change (FC) of each gene was the log transformation (base 2) of the specific value (S-tested/W-control) of FPKM. If FC > 0, the gene is up-regulated, and if FC < 0, the gene is down-regulated.
2.8. Expression Validation with RNA-Seq in Other Plant Species
P. simonii × P. nigra T. S. Hwang et Liang and Arabidopsis thaliana were also used as materials and treated with salt to validate the expression of genes in response to salt stress. The methods used to cultivate and treat P. simonii × P. nigra were similar to those for the 84K poplar used in this study. Two biological replicates (A1 and A2) of P. simonii × P. nigra were treated with 0.15 M NaCl and the other two replicates (B1 and B2) cultivated in regular water were used as the control. For Arabidopsis thaliana (Columbia-0) cultivation, wild-type seeds were surface-sterilised and sown on plates containing 1/2 MS medium solidified with 0.2% (w/v) phytoagar according to our former study [50]. After nine days, seedlings at two-leaves stage were transferred into soil mix pots and placed in 8/16-h light/dark (short-day) photoperiod conditions for two weeks. Each two biological replicates of strong and healthy Arabidopsis plants were treated with 0.15 M NaCl (C1 and C2) or water (D1 and D2) for 24 h. All the samples were then shipped to the GENEWIZ Company for RNA-Seq analysis.
2.9. Reverse Transcription-Quantitative Polymerase Chain Reaction Assay
To quantify the expression level of two important putative NAC DEGs, PtNAC024 and PtNAC182, in 84K poplar under both the salt stress treatment (0.15 M NaCl) and the control (water) conditions, leaf tissues were used for RT-qPCR. RT-qPCR was performed as in our previous study [51]. Two house-keeping genes, Actin and EF1, were used as internal control genes [52]. The primers for PtNAC024 and PtNAC182 used for RT-qPCR are presented in Table S1. The relative expression level of target genes was calculated using the 2−ΔΔCt method, defined as: ΔΔCt = (Ct-target − Ct-control)2 − (Ct-target − Ct-control)1.
2.10. Tissue-Specific Expression Pattern in Silico
In silico, the expression patterns in different tissues of PtNAC024 and PtNAC182 were detected using the exImage tool of the PopGenIE V3 database (http://popgenie.org/). The related data can be directly downloaded using the accession numbers of genes from PopGenIE.
2.11. Statistical Analysis
Single variable analysis was used to compare the gene expression between the samples exposed to salt stress and the controls using the t-test. We applied unsupervised clustering analysis to identify the DEGs with similar expression profiles. We also used the correlation analysis to detect the relationship among different DEGs. All statistical analyses were conducted using R v3.3.1 (http://cran.r-project.org/).
3. Results
3.1. Identification and Phylogenetic Analysis of Poplar NAC TFs
In this study, we identified 289 NAC transcripts of the 171 nonredundant genes in Populus with the PlantTFDB (Table S1). They were designed as PtNAC001–PtNAC289 following the nomenclature proposed in the previous study. All of them (except PtNAC289) encode proteins of 123–698 amino acids in lengths, molecular weights between 14,836.8 and 77,446.2 Da and isoelectric point values varying from 4.0667 to 11.3163. In most cases, two or more PtNACs were hit for every ortholog in Arabidopsis (Table S1). The detail information of PtNACs is shown in Tables S1 and S2, including TF_ID and similarities to their Arabidopsis orthologs as well as their complementary DNA and protein sequences.
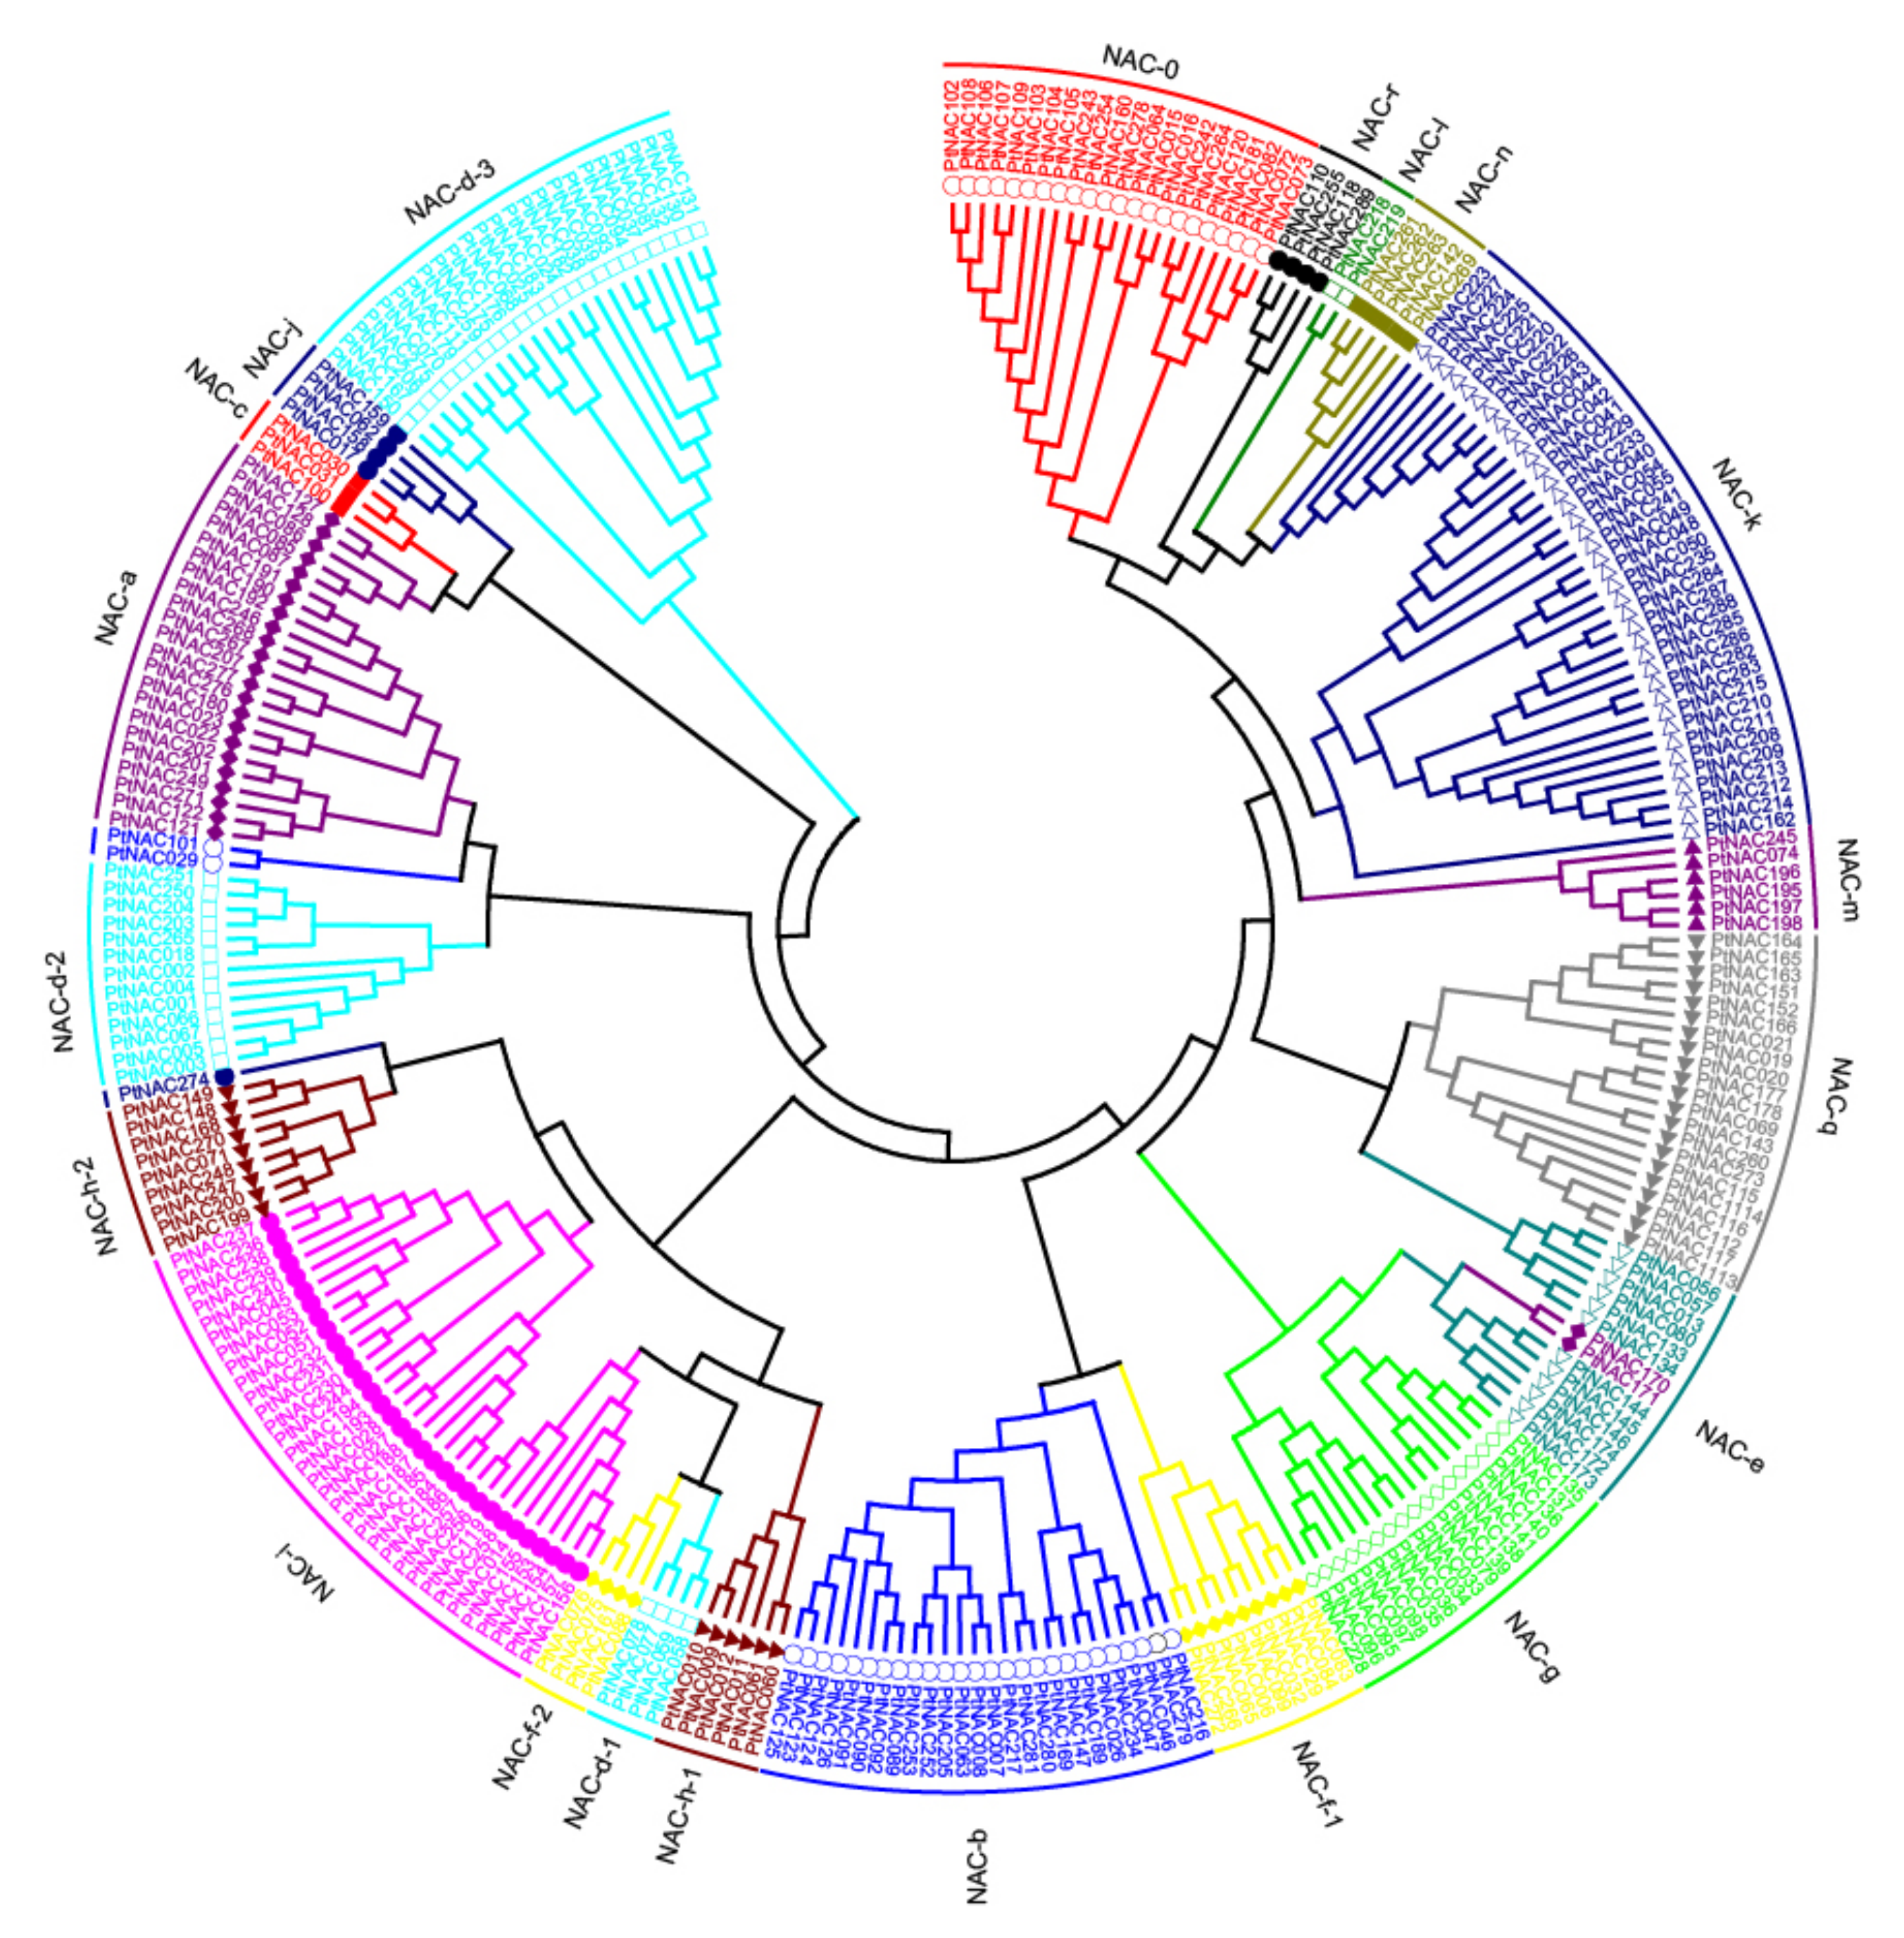
Homology studies of plant TFs can give insights into their functions. To examine the phylogenetic relationships among PtNACs, unrooted trees were constructed with alignments of the full-length protein sequences (Figure 1). The tree produced by the three algorithms NJ, ME and MP were largely comparable with only minor modifications at interior branches (data not shown). Therefore, only the NJ phylogenetic tree was subjected to further analysis in our study. PtNACs were divided into 18 subfamilies and were designed as NAC-a to NAC-r according to Hu et al. [6]. Some of these subfamilies contain two or three subgroups (Figure 1 and Figure S1), but none of the PtNACs belonged to the subfamily NAC-p. Moreover, the phylogenetic tree constructed with the conserved N-terminal NAC domains A–E using the same algorithm was largely consistent with the phylogenetic analyses performed with the full-length protein sequences (Figure S2). In addition, other evidences support the reliability of the subfamily classification including gene structure, motif composition and expression patterns, as described below.
3.2. Chromosome Location and Synteny Analysis of NAC Genes
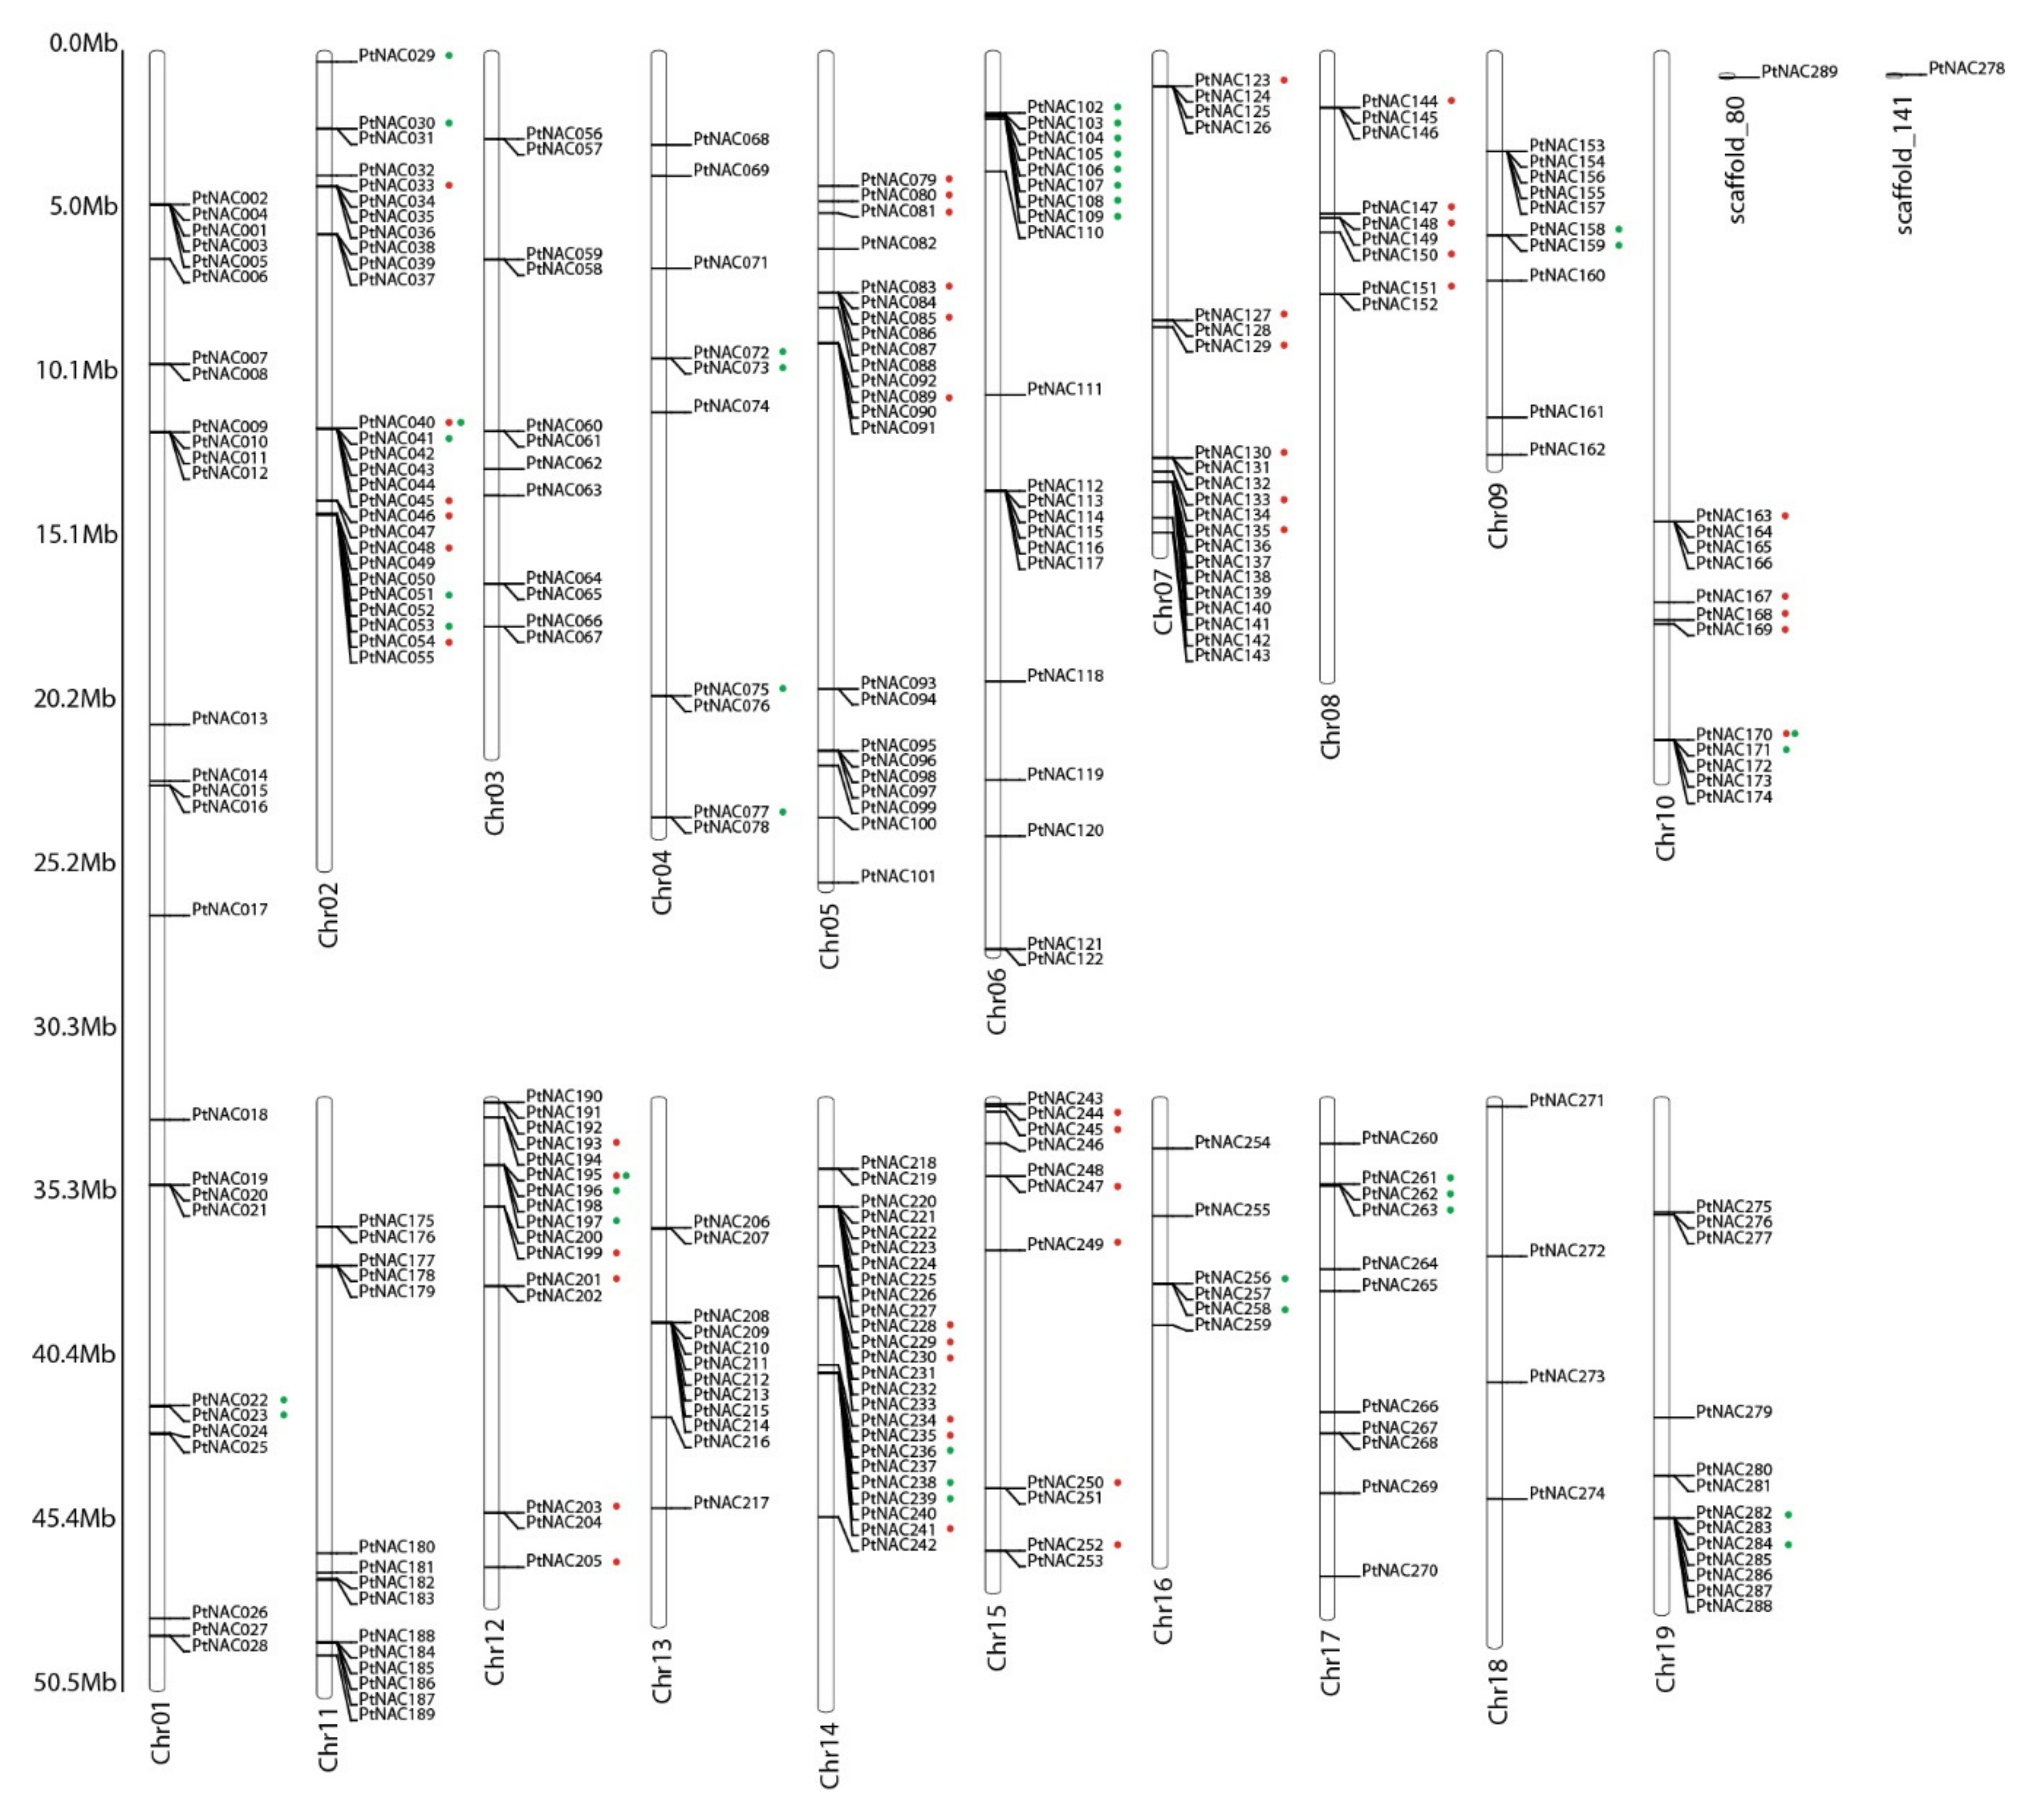
In silico, 287 of the 289 (99.3%) PtNACs were mapped to the 19 LGs, while only PtNAC278 and PtNAC289 remained as yet unmapped scaffold_141 and scaffold_80, respectively (Figure 2). The distributions of PtNACs genes across the LGs appeared to be non-random (Figure 2). There were 28 and 27 PtNACs mapped on LG I and LG II, respectively. In contrast, LG VIII, LG XVI and LG XVIII each encompassed no more than 10 PtNACs. In addition, a clustering phenomenon of PtNACs was found on several LGs, especially on those with large numbers of NAC genes (Figure 2). For instance, 16 PtNACs were cluster localised on a 3.0 Mb segment on LG II, and more than 20 PtNACs were arranged in a cluster localised to a 5.0 Mb segment on LG XIV. The PtNACs were also mapped to the duplicated blocks established in the previous studies to determine the impacts of segmental duplication event on the Populus NAC genes. A total of 215 out of 287 (75.3%) Populus NAC genes were mapped on 29 of 36 identified duplicated blocks related to the recent salicoid duplication event (Figure S3). Among the 29 block pairs, 12 block pairs only harboured NAC genes on one of the blocks and lacked the corresponding duplicates. In contrast, the remaining 72 NAC genes were located outside of any duplicated blocks (Figure S3).
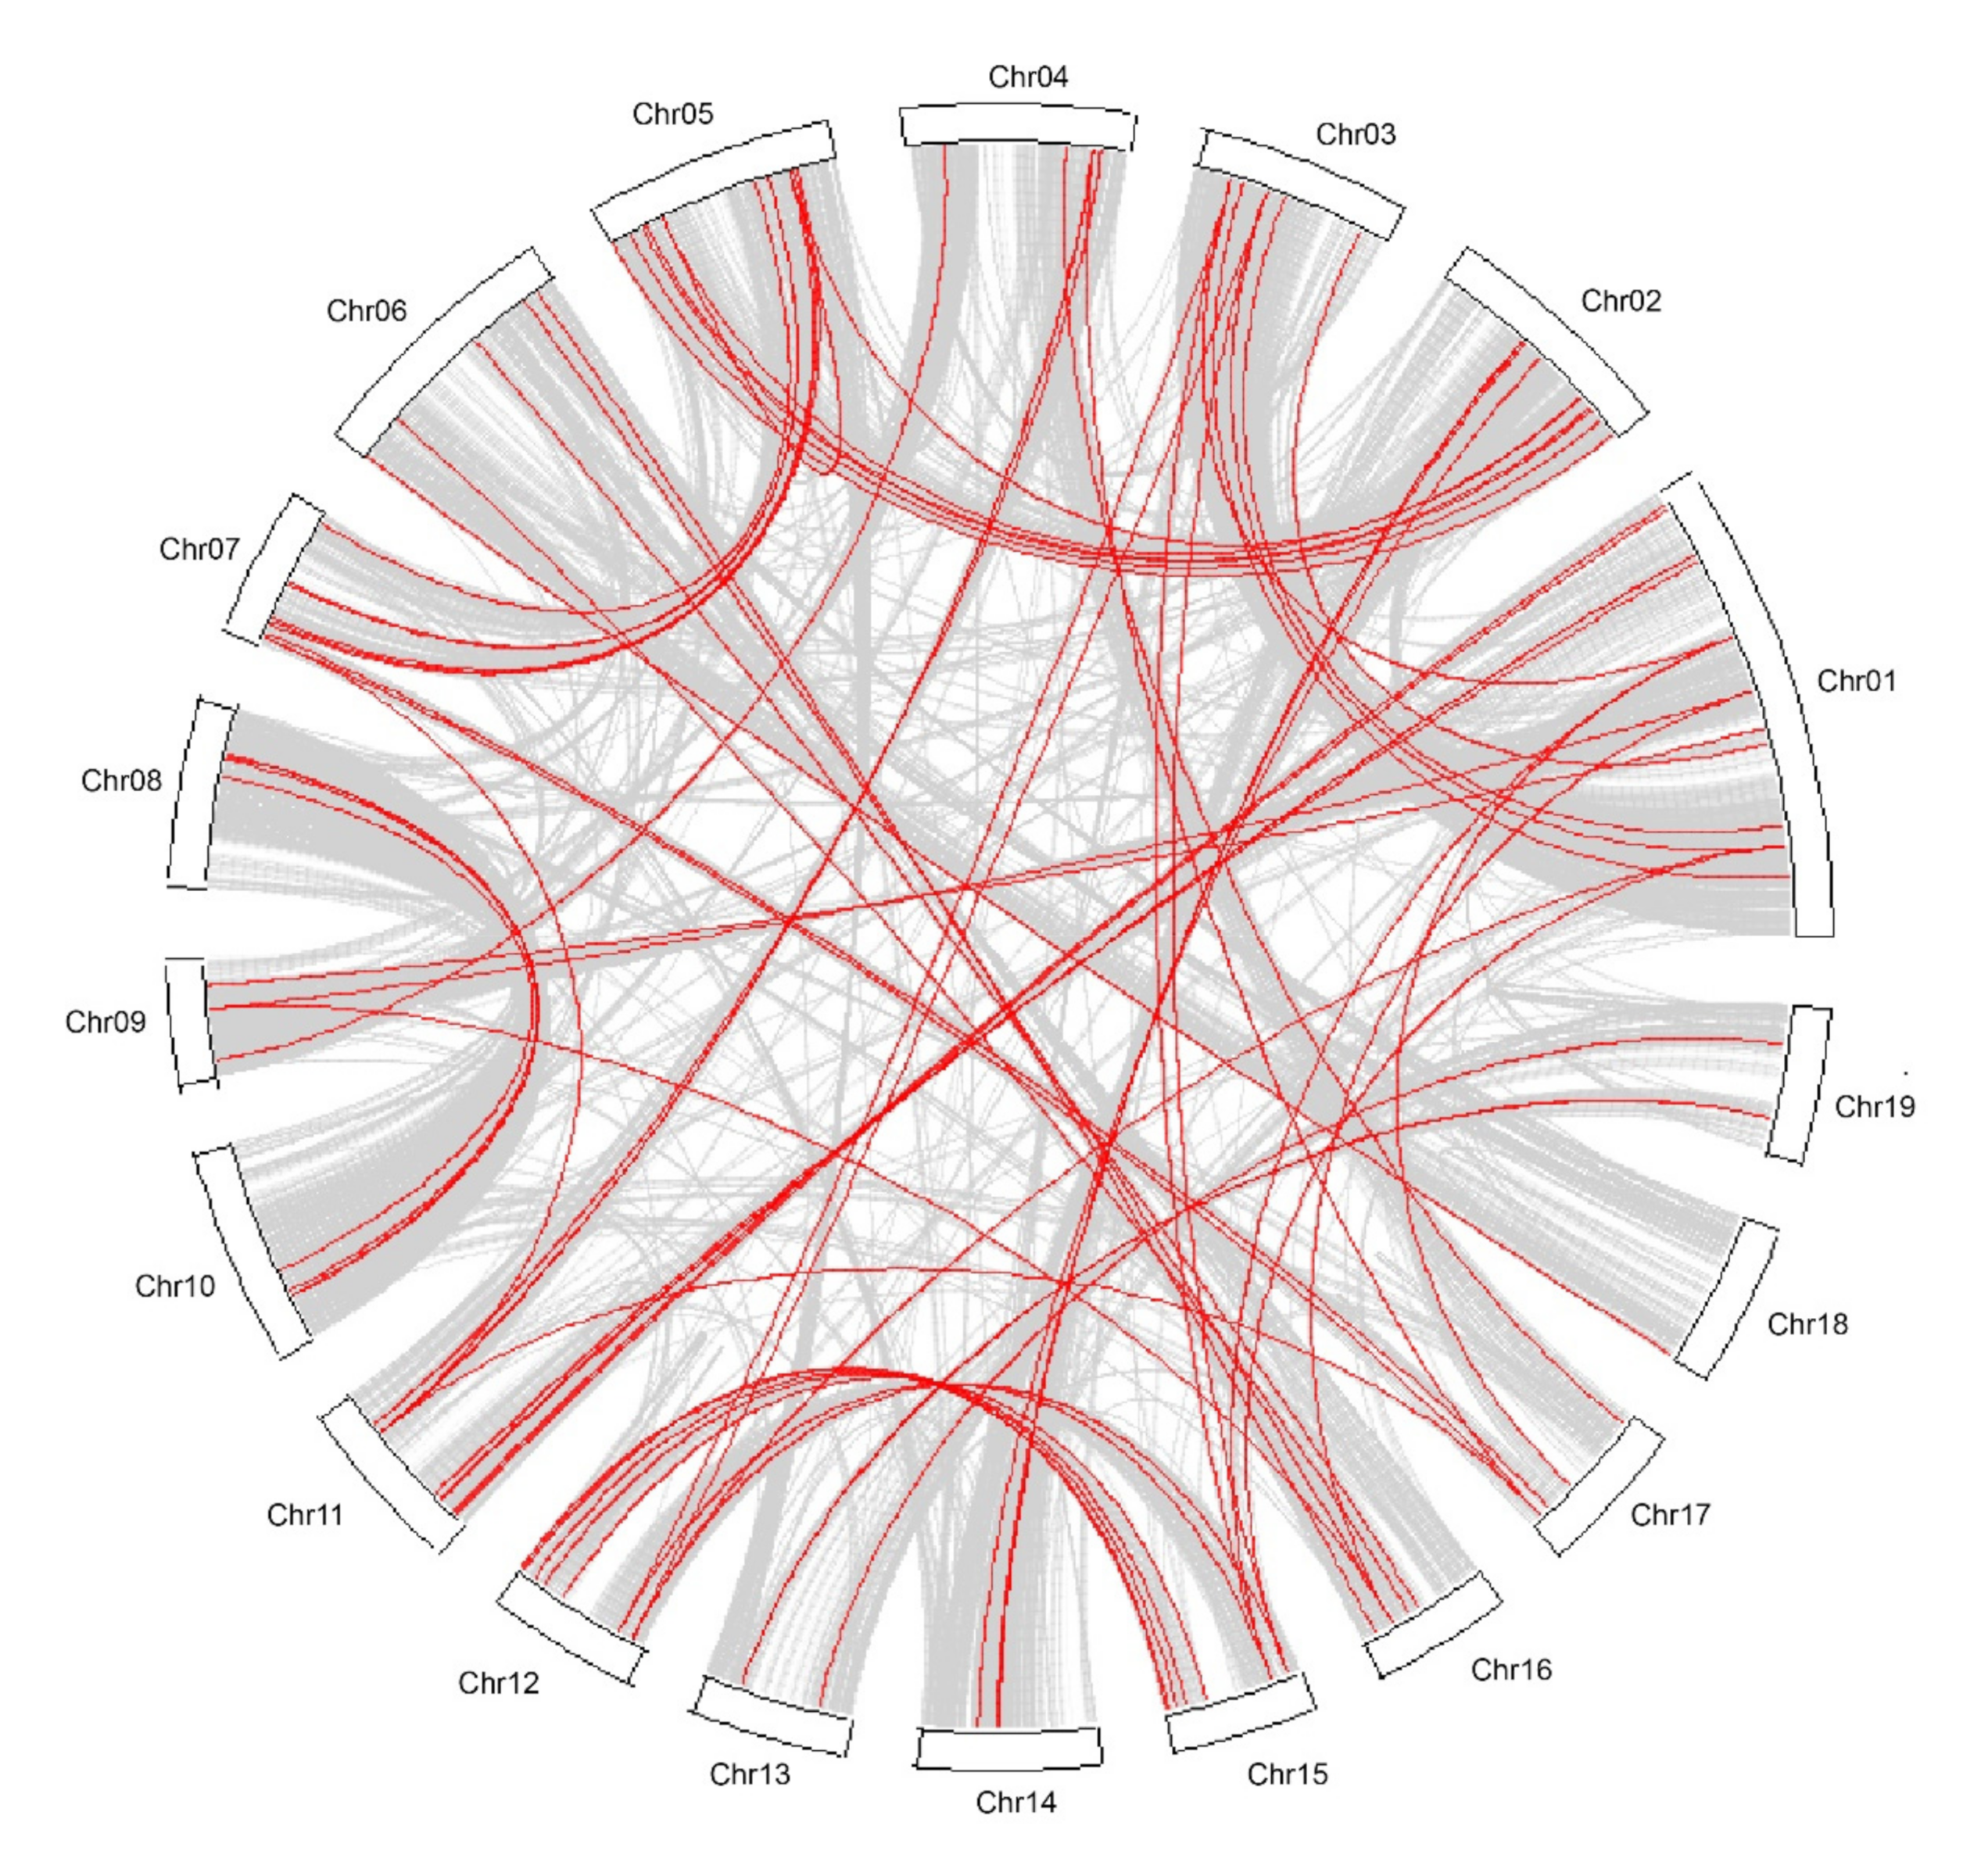
Synteny analysis of the 171 nonredundant Populus NAC family genes was performed using the programme MCScanX and 46 collinear genes were found (Figure 3, Table S3). These collinear genes considered as resulting from a whole-genome duplication event (indicated in red colour dots) are mainly located on eight LGs of Populus (Figure 2, Table S3). The tandem duplications might have an impact on the expansion of the Populus NAC gene family. In our study, 37 Populus NAC genes related to tandem duplications were identified and are indicated in green colour dots (Figure 2, Table S3). They are distributed on 11 of the 19 LGs (Figure 2).
3.3. Gene Structure and Conserved Motifs Analysis of NAC Genes
Gene structures comprising UTR, CDS (coding sequence) and introns of individual genes were compared to investigate the structural diversity of PtNACs. In general, most related members in the same subfamily shared similar exon/intron structures in terms of intron numbers and exon length (Figure S4c). For instance, genes in Subfamily-o all had no intron with the exception of PtNAC015, PtNAC016, PtNAC072, PtNAC073 and PtNAC160, which possessed only one intron, while most of the genes in Subfamily-d harboured two introns. In contrast, genes in Subfamily-b, Subfamily-k and Subfamily-q appeared to have a significantly variable structure organisation with a large number of exon/intron structure variants. However, we found that although the structure of NAC genes varied significantly, the intron was highly conserved (Figure S4c).
To further reveal the diversity of PtNACs, 15 conserved motifs were predicted using the programme MEME. Details of the 15 putative motifs are shown in an additional file (Table S4). The biological functions of most of the putative motifs remain unknown as we searched against the SMART and Pfam database. As shown in previous studies, most NAC proteins encompass the A to E subdomains in the N-terminal amino acid sequences that confer DNA-binding activities. In this study, motif-1, motif-6, motif-2, motif-3 and motif-7 representing the NAC subdomains A to E, respectively, were found in most of the Populus NAC proteins, and a small number of NAC proteins did not harbour all of these five motifs in their corresponding DNA-binding domains (Figure S4a, Table S4). Some conserved motifs still could be found, even though the C-terminal sequences of NAC proteins were divergent. We also found that most members in the phylogenetic tree had common motif compositions, suggesting functional similarities among Populus NAC proteins within the same subtree (Figure S4a). Noticeably, some specific motifs were present in NAC specific subfamilies, such as motif-10 for Subfamily-a and motif-11 for Subfamily-q. However, whether these motifs confer unique molecular functions to NACs remains to be further investigated.
3.4. Promoter Cis-Element Analysis
To investigate putative cis-acting regulatory elements in the promoter region of Populus NAC genes, we collected 15 experimentally characterised regulatory sites from published studies (Table S5). We found that the promoters of PtNACs harboured multiple cis-acting regulatory elements involved in plant defence and stress responsiveness, such as ABRE, CGTCA-motif, ERE, MBS, TC-rich repeats, TCA-element and W-box (Table S6). The 289 PtNACs all contained cis-elements related to phytohormone or stress signal responsiveness, but the kinds and numbers of cis-elements in different promoters varied. For instance, PtNAC009, PtNAC010, PtNAC011 and PtNAC012 had all of the 15 cis-elements except for the P-box motif, whereas PtNAC272 had only three cis-elements (ARE, MBS and MYC) in the corresponding promoter sequences (Table S6). In addition, the number of the same cis-element also varied in different promoters of Populus NACs (data not shown).
3.5. Gene Ontology Annotation
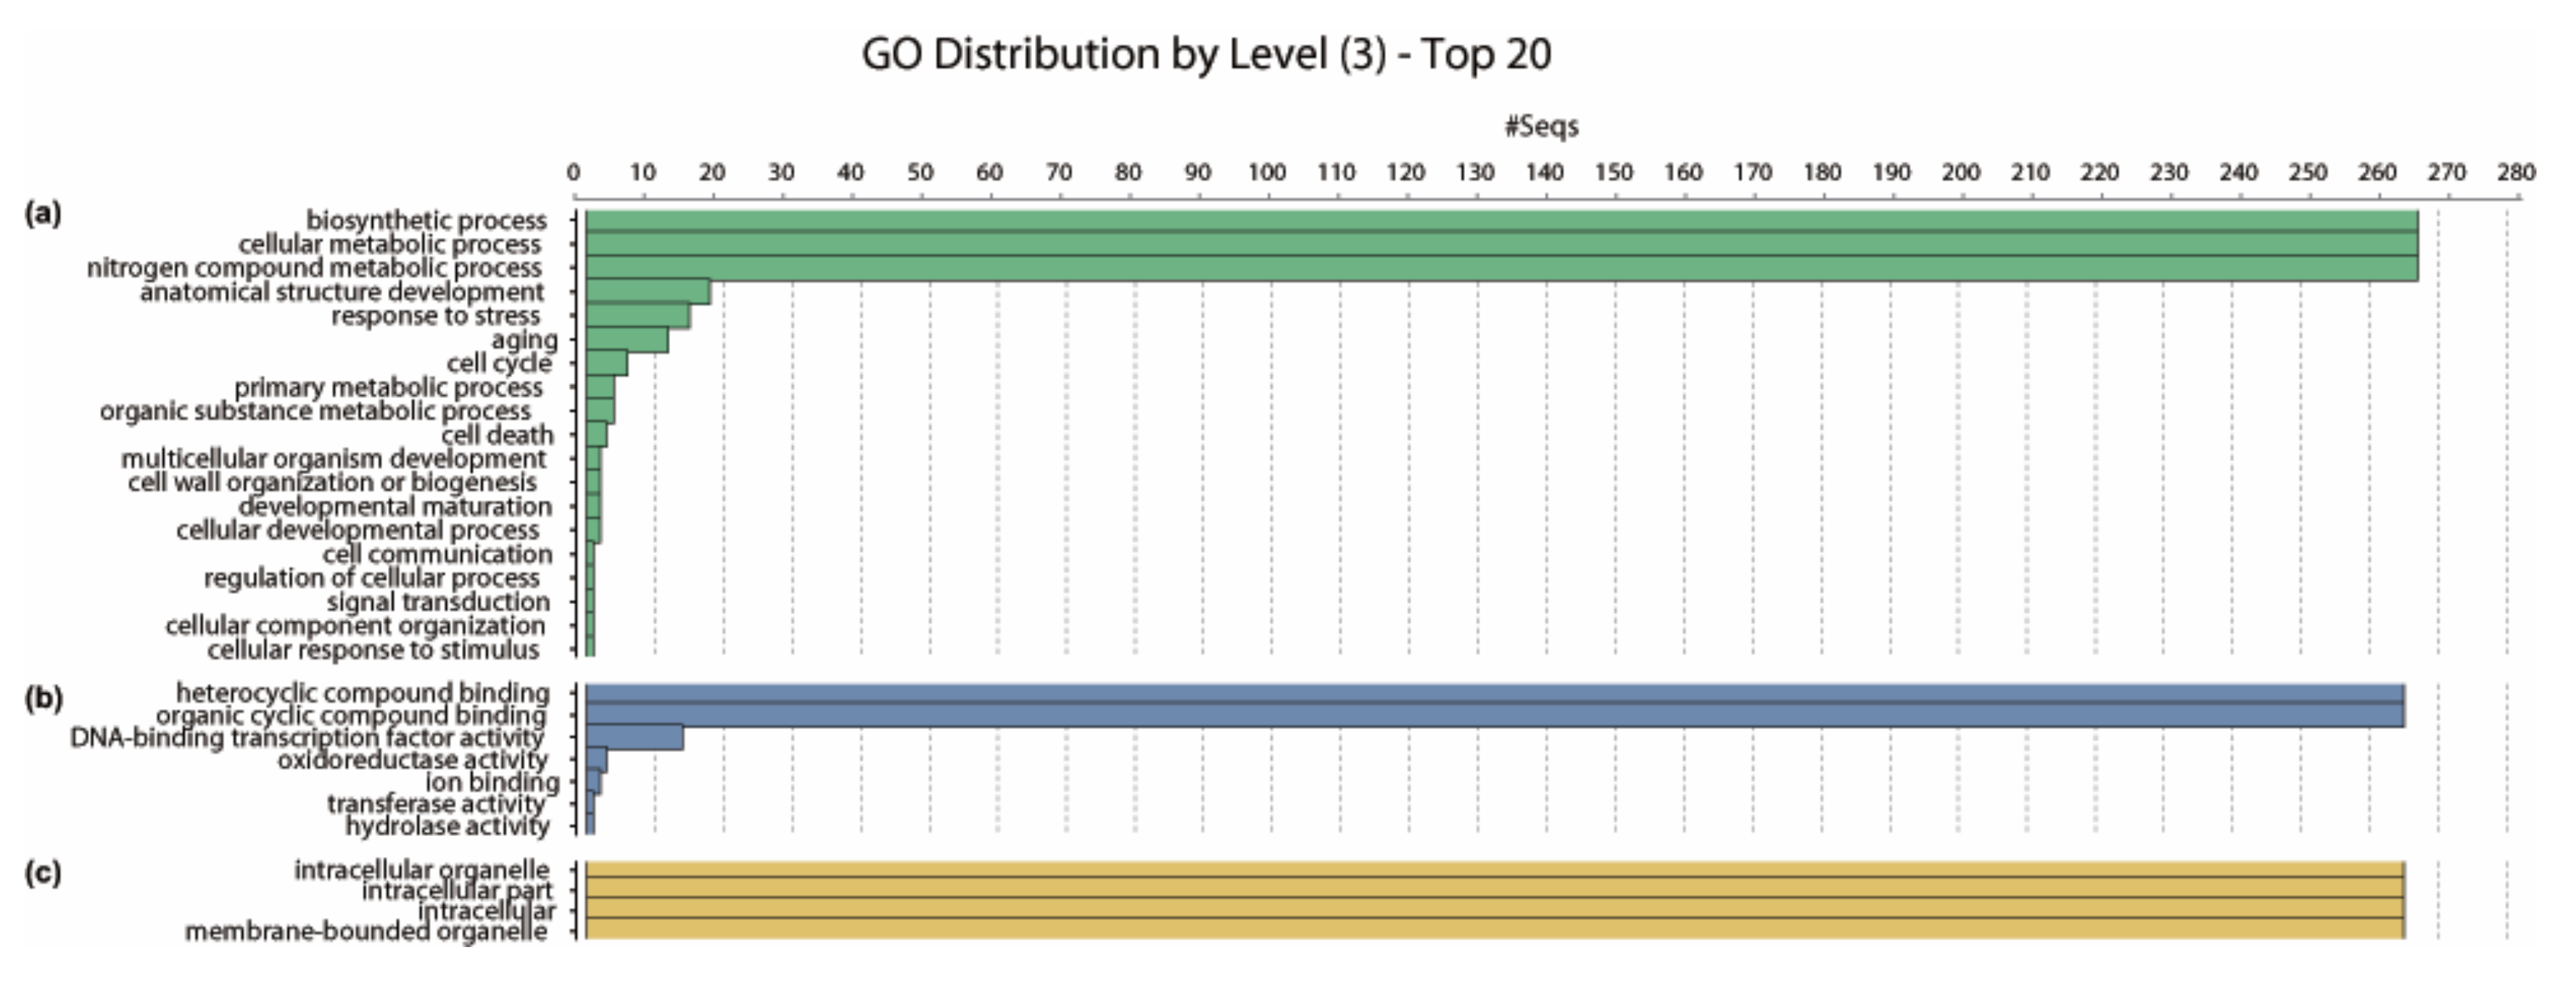
The biological processes, molecular functions and cellular components of Populus PtNACs were determined using the programme Blast2GO v 5.2 based on the GO terms. Results showed that PtNACs are involved in diverse biological processes. Most PtNACs (267) are predicted to function in the biosynthetic, cellular metabolic and nitrogen compound metabolic processes; 15 PtNACs (PtNAC280, PtNAC217, PtNAC004, PtNAC005, PtNAC002, PtNAC003, PtNAC066, PtNAC165, PtNAC001, PtNAC067, PtNAC166, PtNAC152, PtNAC163, PtNAC164, PtNAC151) participate in the stress response process (Figure 4a, Table S7). Molecular function prediction found 265 PtNACs annotated as heterocyclic compound binding or organic cyclic compound binding, whereas 14 (PtNAC280, PtNAC182, PtNAC206, PtNAC217, PtNAC158, PtNAC159, PtNAC024, PtNAC255, PtNAC025, PtNAC179, PtNAC110, PtNAC275, PtNAC062, PtNAC183) and three (PtNAC204, PtNAC203, PtNAC250) PtNACs were respectively involved in the TF activity and oxidoreductase activity, which may be related to plant stress endurance (Figure 4b, Table S7). In addition, cellular component prediction indicated that Populus PtNACs were mainly localised in intracellular organelle, intracellular part, intracellular and membrane-bounded organelle (Figure 4c, Table S7).
3.6. Expression Characterization of NACs Under Salt Stress
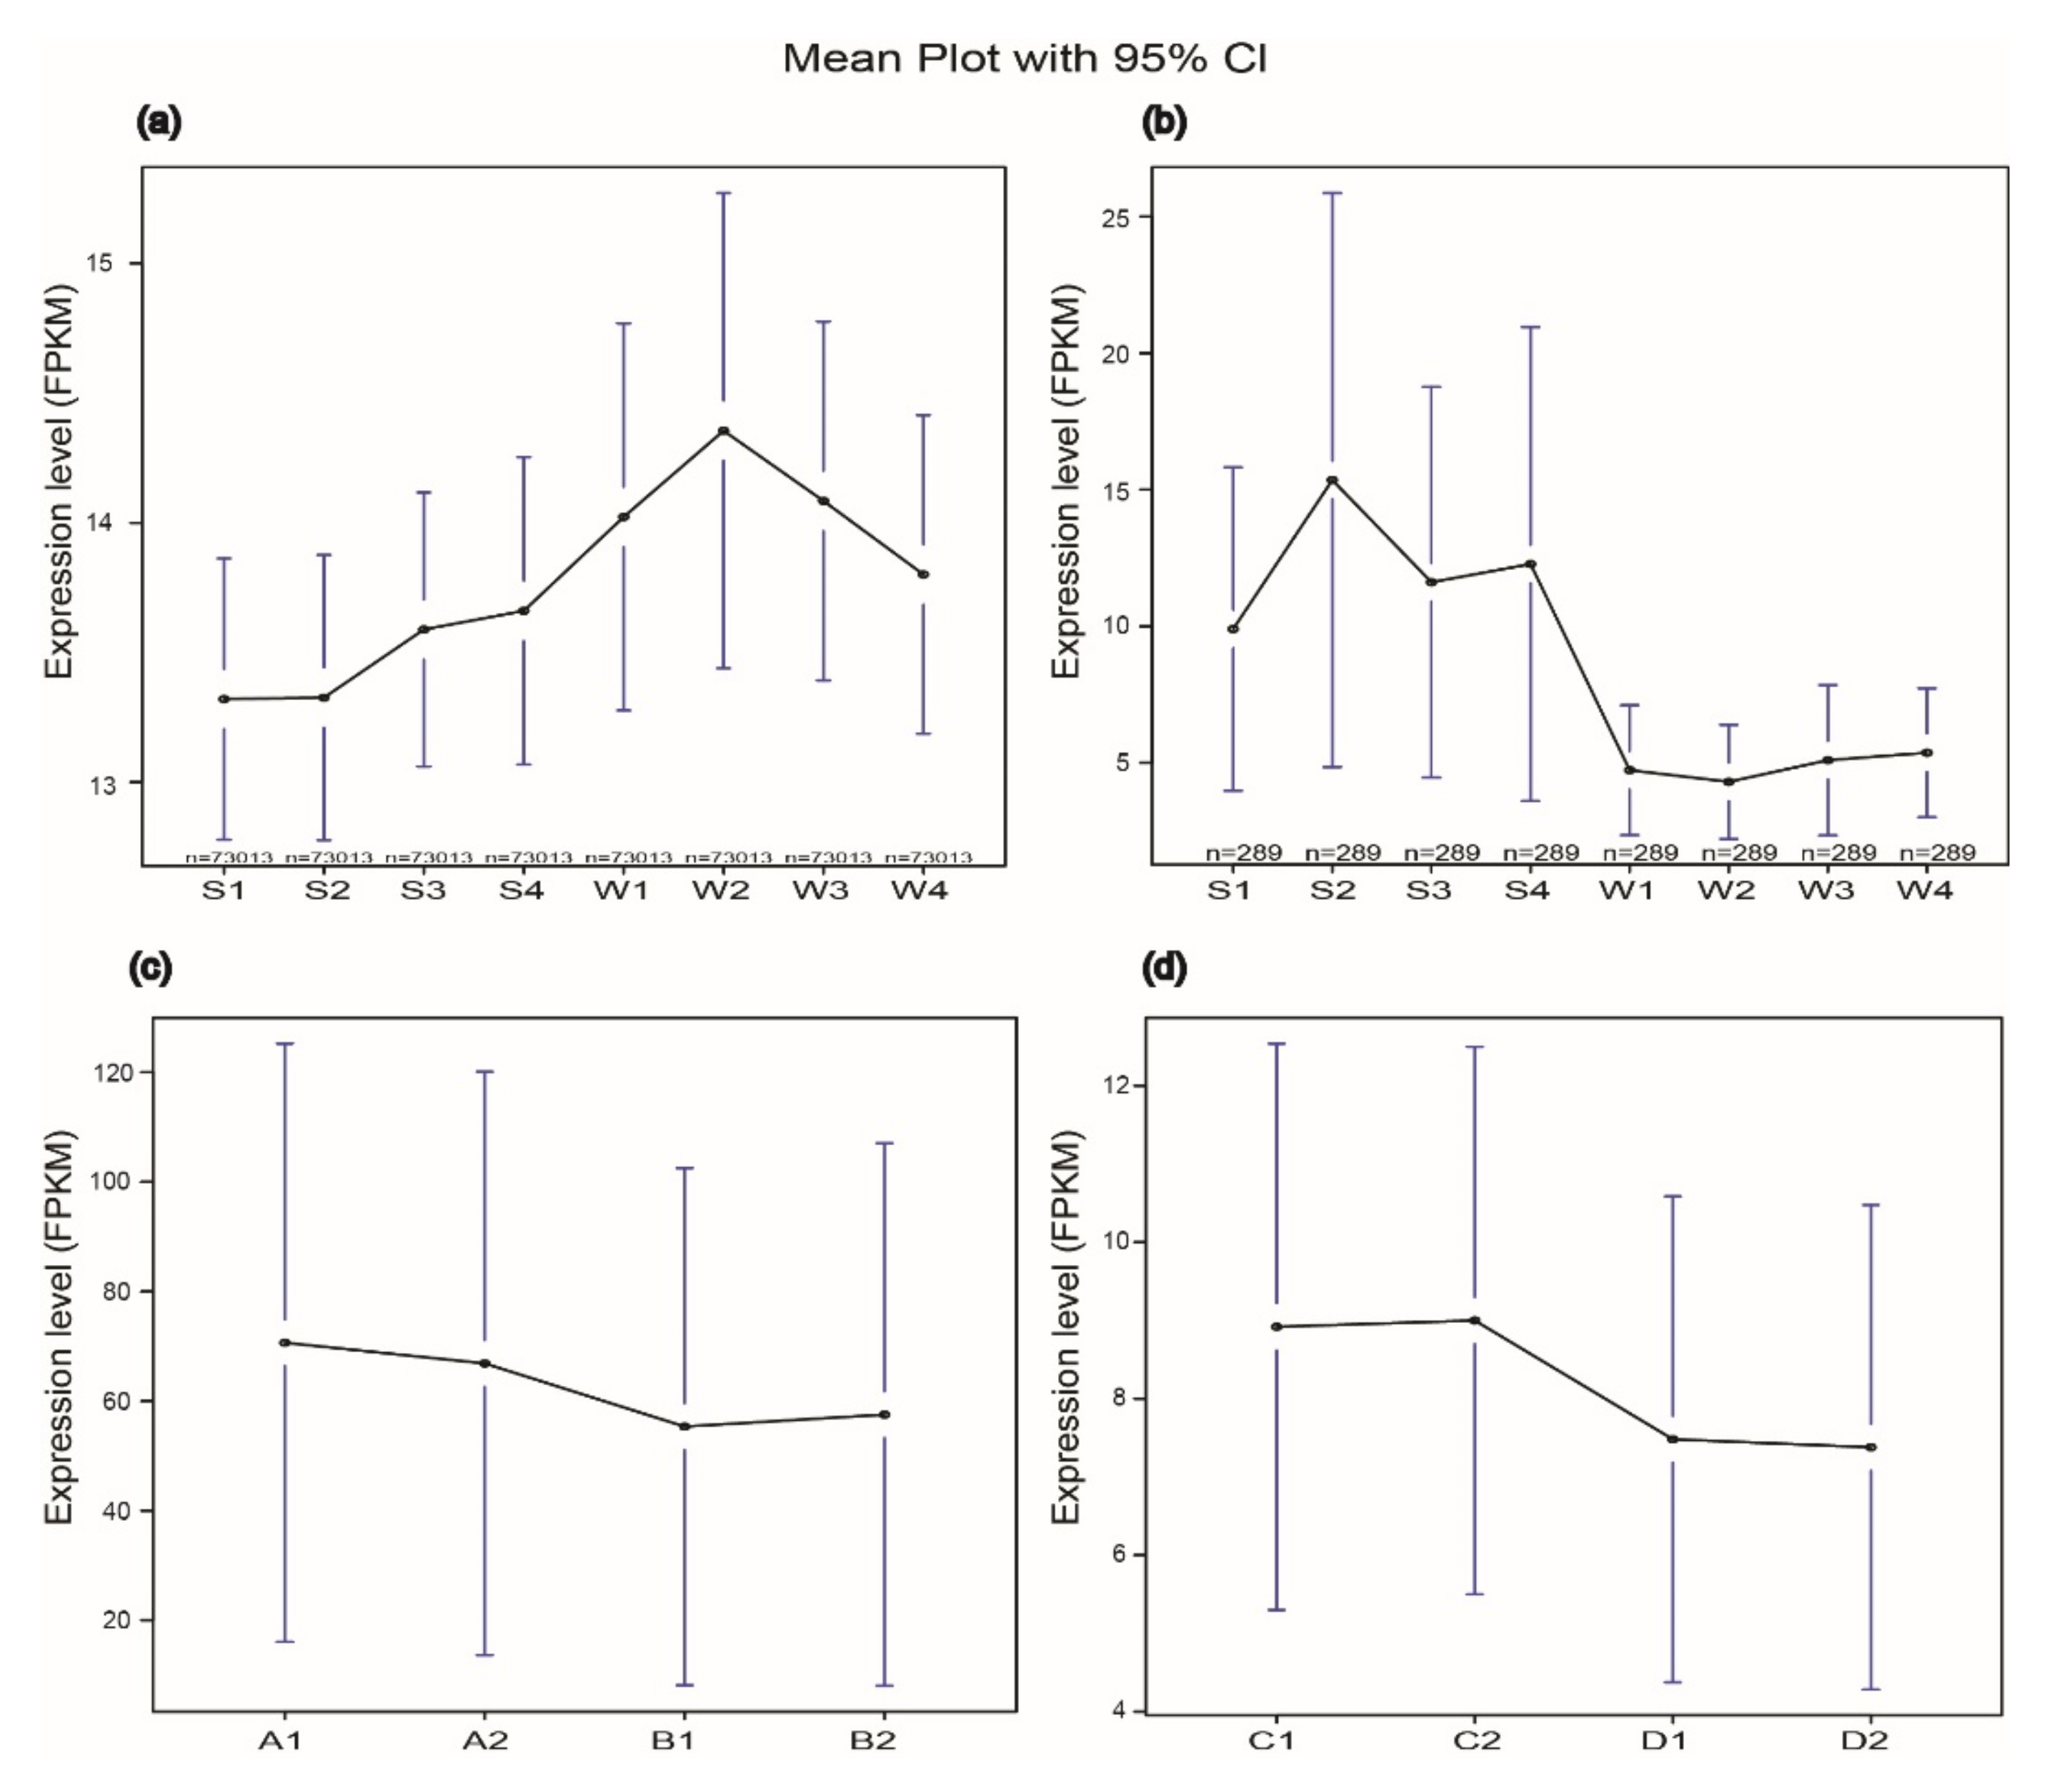
The expression levels of the 73,013 genes of 84K poplar found in this study were detected using RNA-Seq. Results showed that the overall expression of 73,013 poplar genes was suppressed by salt stress. The FPKM of samples exposed to salt stress (S1, S2, S3, S4) were lower than those of the control (W1, W2, W3, W4) (Figure 5a). On the contrary, the expression levels of the 289 PtNACs from 84K poplar under salt stress condition were higher than the control (Figure 5b), which suggests that NACs play positive roles in poplar salt stress endurance. Consistent with this, similar expression trends of NACs were found in P. simonii × P. nigra (Figure 5c) and Arabidopsis thalian (Figure 5d). However, the differences among the samples do not reach a significant level (Figure S5), which may be due to the exposure time of the tested materials not being long enough.
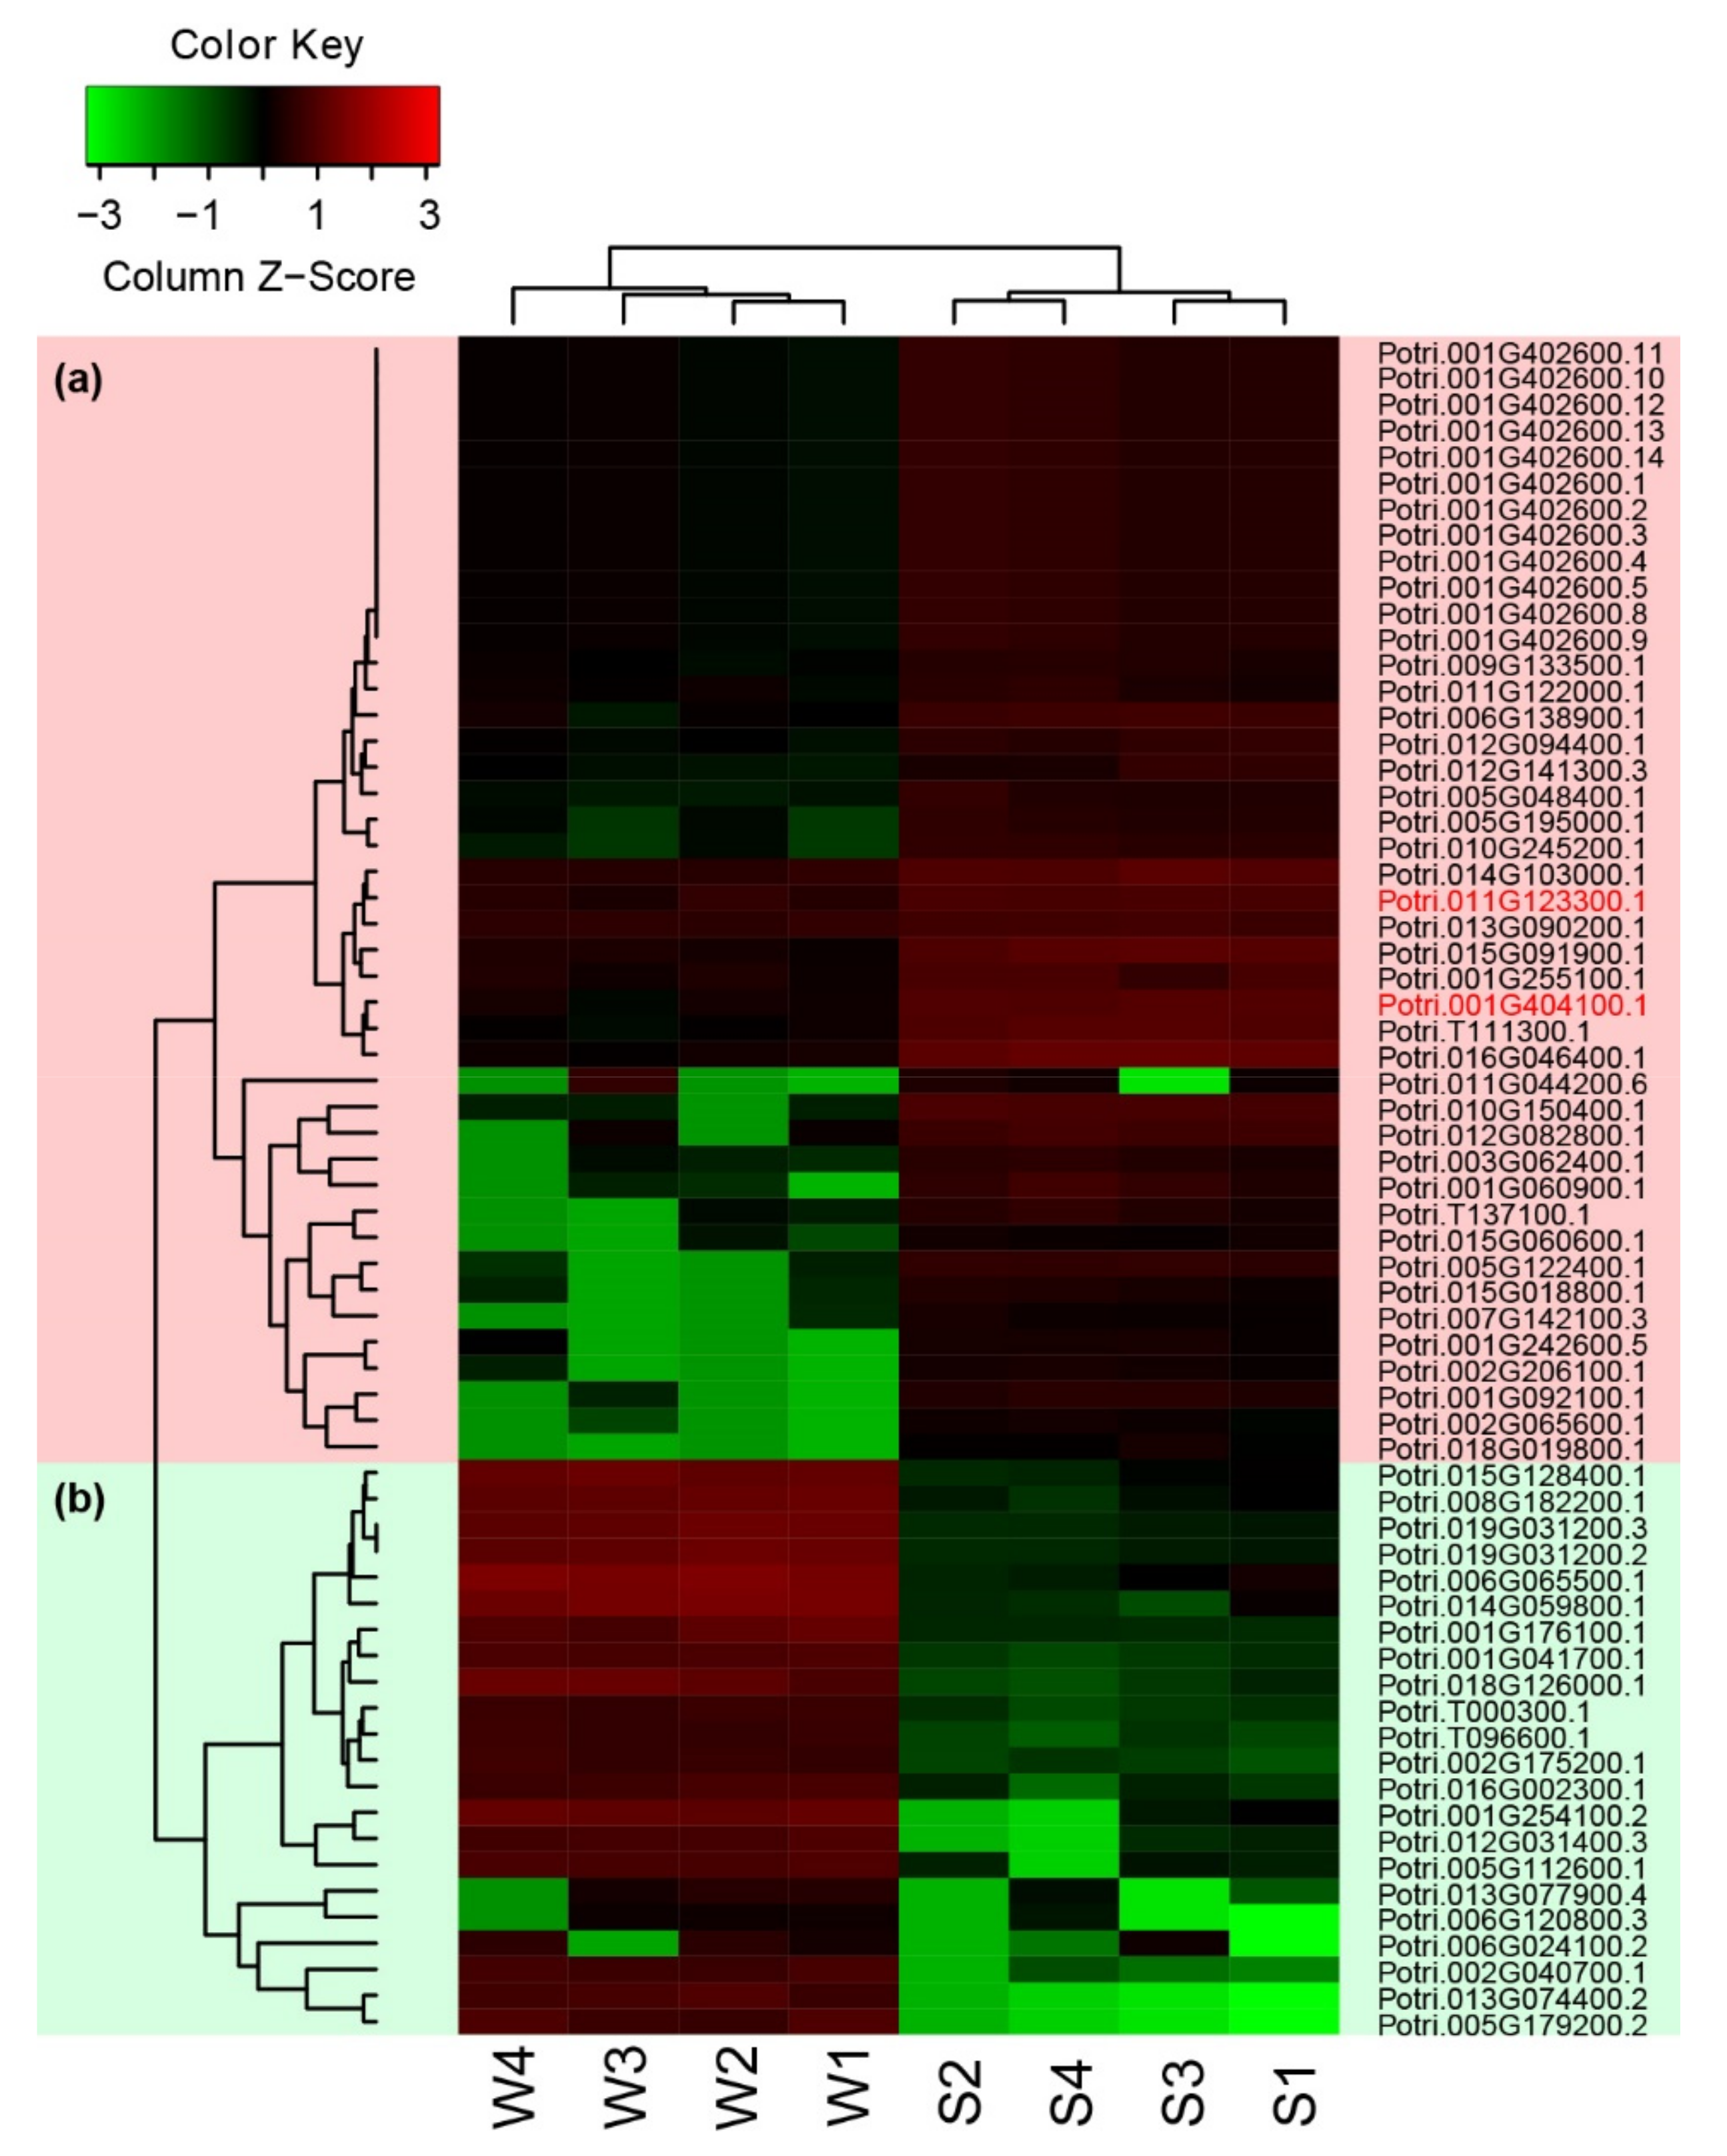
DEGs (differentially expressed genes) were detected using RNA-Seq data between the salt-treated samples and the control of 84K poplar. A total of 692 DEGs were identified in comparison of S1 and W1 (comparison group S1_W1), and 496 to 553 DEGs in the comparison groups S2_W2, S3_W3 and S4_W4 (Figure 6a). The number of up-regulated DEGs related to salt stress was generally similar to that of the down-regulated DEGs (Figure 6c). However, only 63 DEGs overlapped among the tested comparison groups (Figure 6b). DEGs in the poplar NAC family were also analysed in this study. Five NAC DEGs were found in the comparison group S3_W3 (Figure 6b). Two common differentially expressed NAC DEGs (PtNAC024 and PtNAC182) were found in groups S1_W1, S3_W3 and S4_W4, and no differentially expressed NAC was found in the comparison group S2_S2 (Figure 6b,d). Both PtNAC024 and PtNAC182 were up-regulated and retained to explore further their molecular functions in salt stress (Figure 6d). In addition, the expression patterns with log2FPKM of the above 63 DEGs and the two differentially expressed NAC DEGs in eight different samples (S1, S2, S3, S4, W1, W2, W3, W4) were characterised using Heatmap. For these 65 genes, the number of up-regulated genes was twice that of the down-regulated genes (Figure 7). The correlation analysis showed that the expressions of PtNAC024 and PtNAC182 were significantly associated with most of the 63 DEGs (Figure S6).
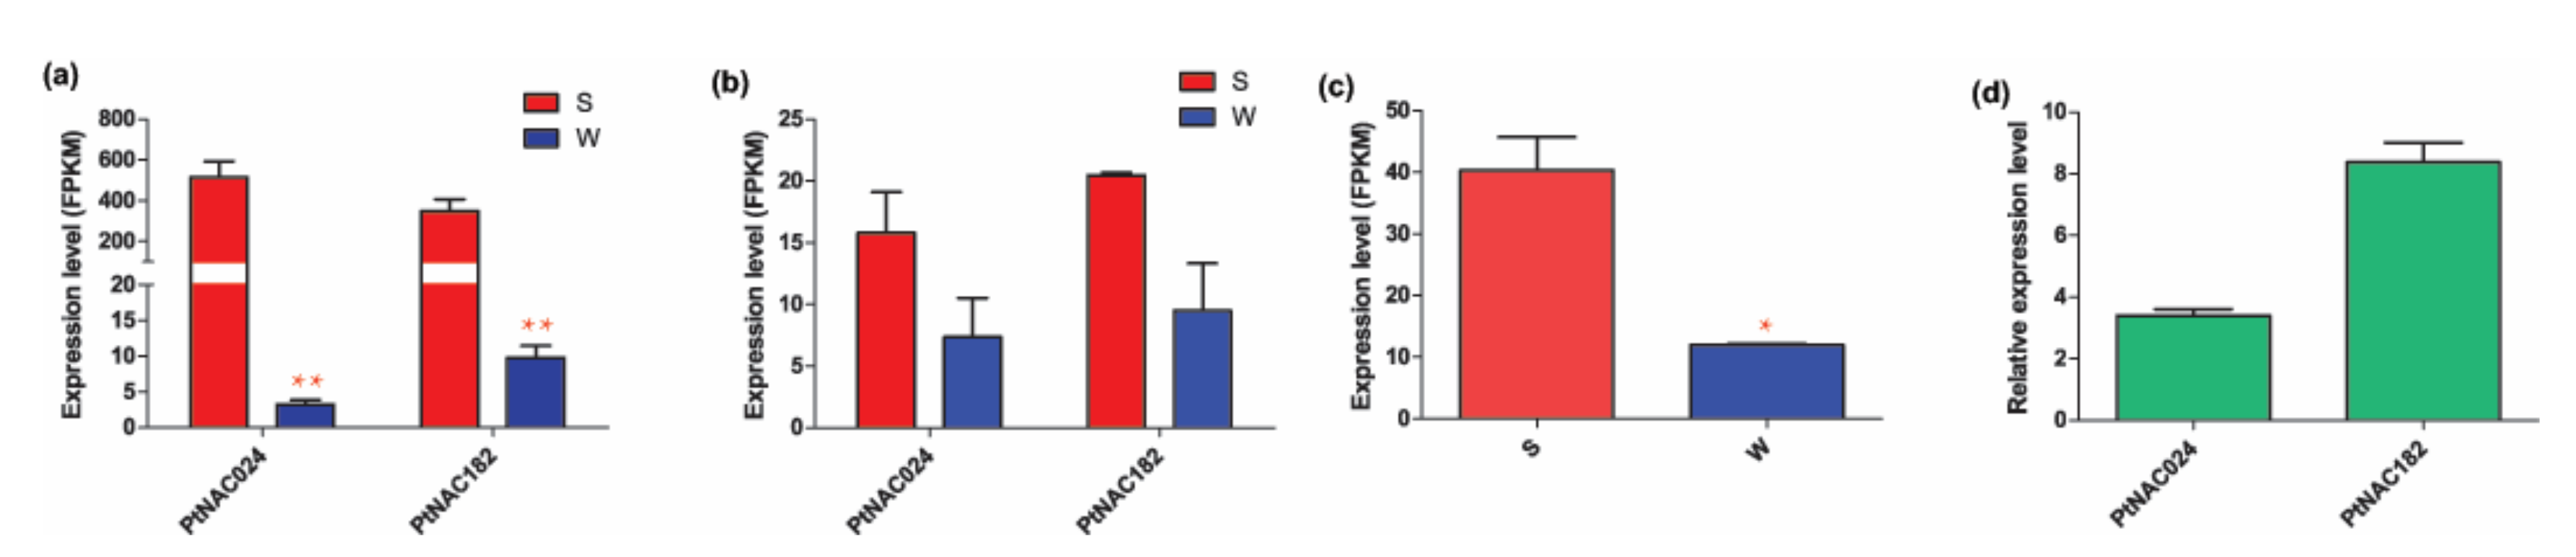
The expression patterns of the two differentially expressed NACs in the other plant species were also detected based on the RNA-Seq data in this study. In 84K poplar, the expression levels of both PtNAC024 and PtNAC182 after exposure to salt stress were significantly higher than under regular water conditions (Figure 8a). Similar trends were found in P. simonii × P. nigra. PtNAC024 and PtNAC182 of P. simonii × P. nigra were induced by salt stress, but the differences between the tested samples and the control were not significant (Figure 8b). It’s worth noting that Arabidopsis thalian carries a single homolog gene for PtNAC024 and PtNAC182, AT4G27410.2, which was also significantly induced by salt stress (Figure 8c). To cross-validate the expression changes of PtNAC024 and PtNAC182 in response to salt stress challenge, we examined the available RT-qPCR data from 84K poplar seedlings treated with NaCl and compared them to controls. Similar to the RNA-Seq data, the RT-qPCR results indicated that PtNAC024 and PtNAC182 were highly induced by salt stress (Figure 8d). The relative expression of PtNAC024 under salt stress condition is about 3.8 times higher than under the control condition, and for PtNAC182 about 8.2 times compared to the control (Figure 8d).
3.7. Tissue-Specific Expression Pattern In Silico
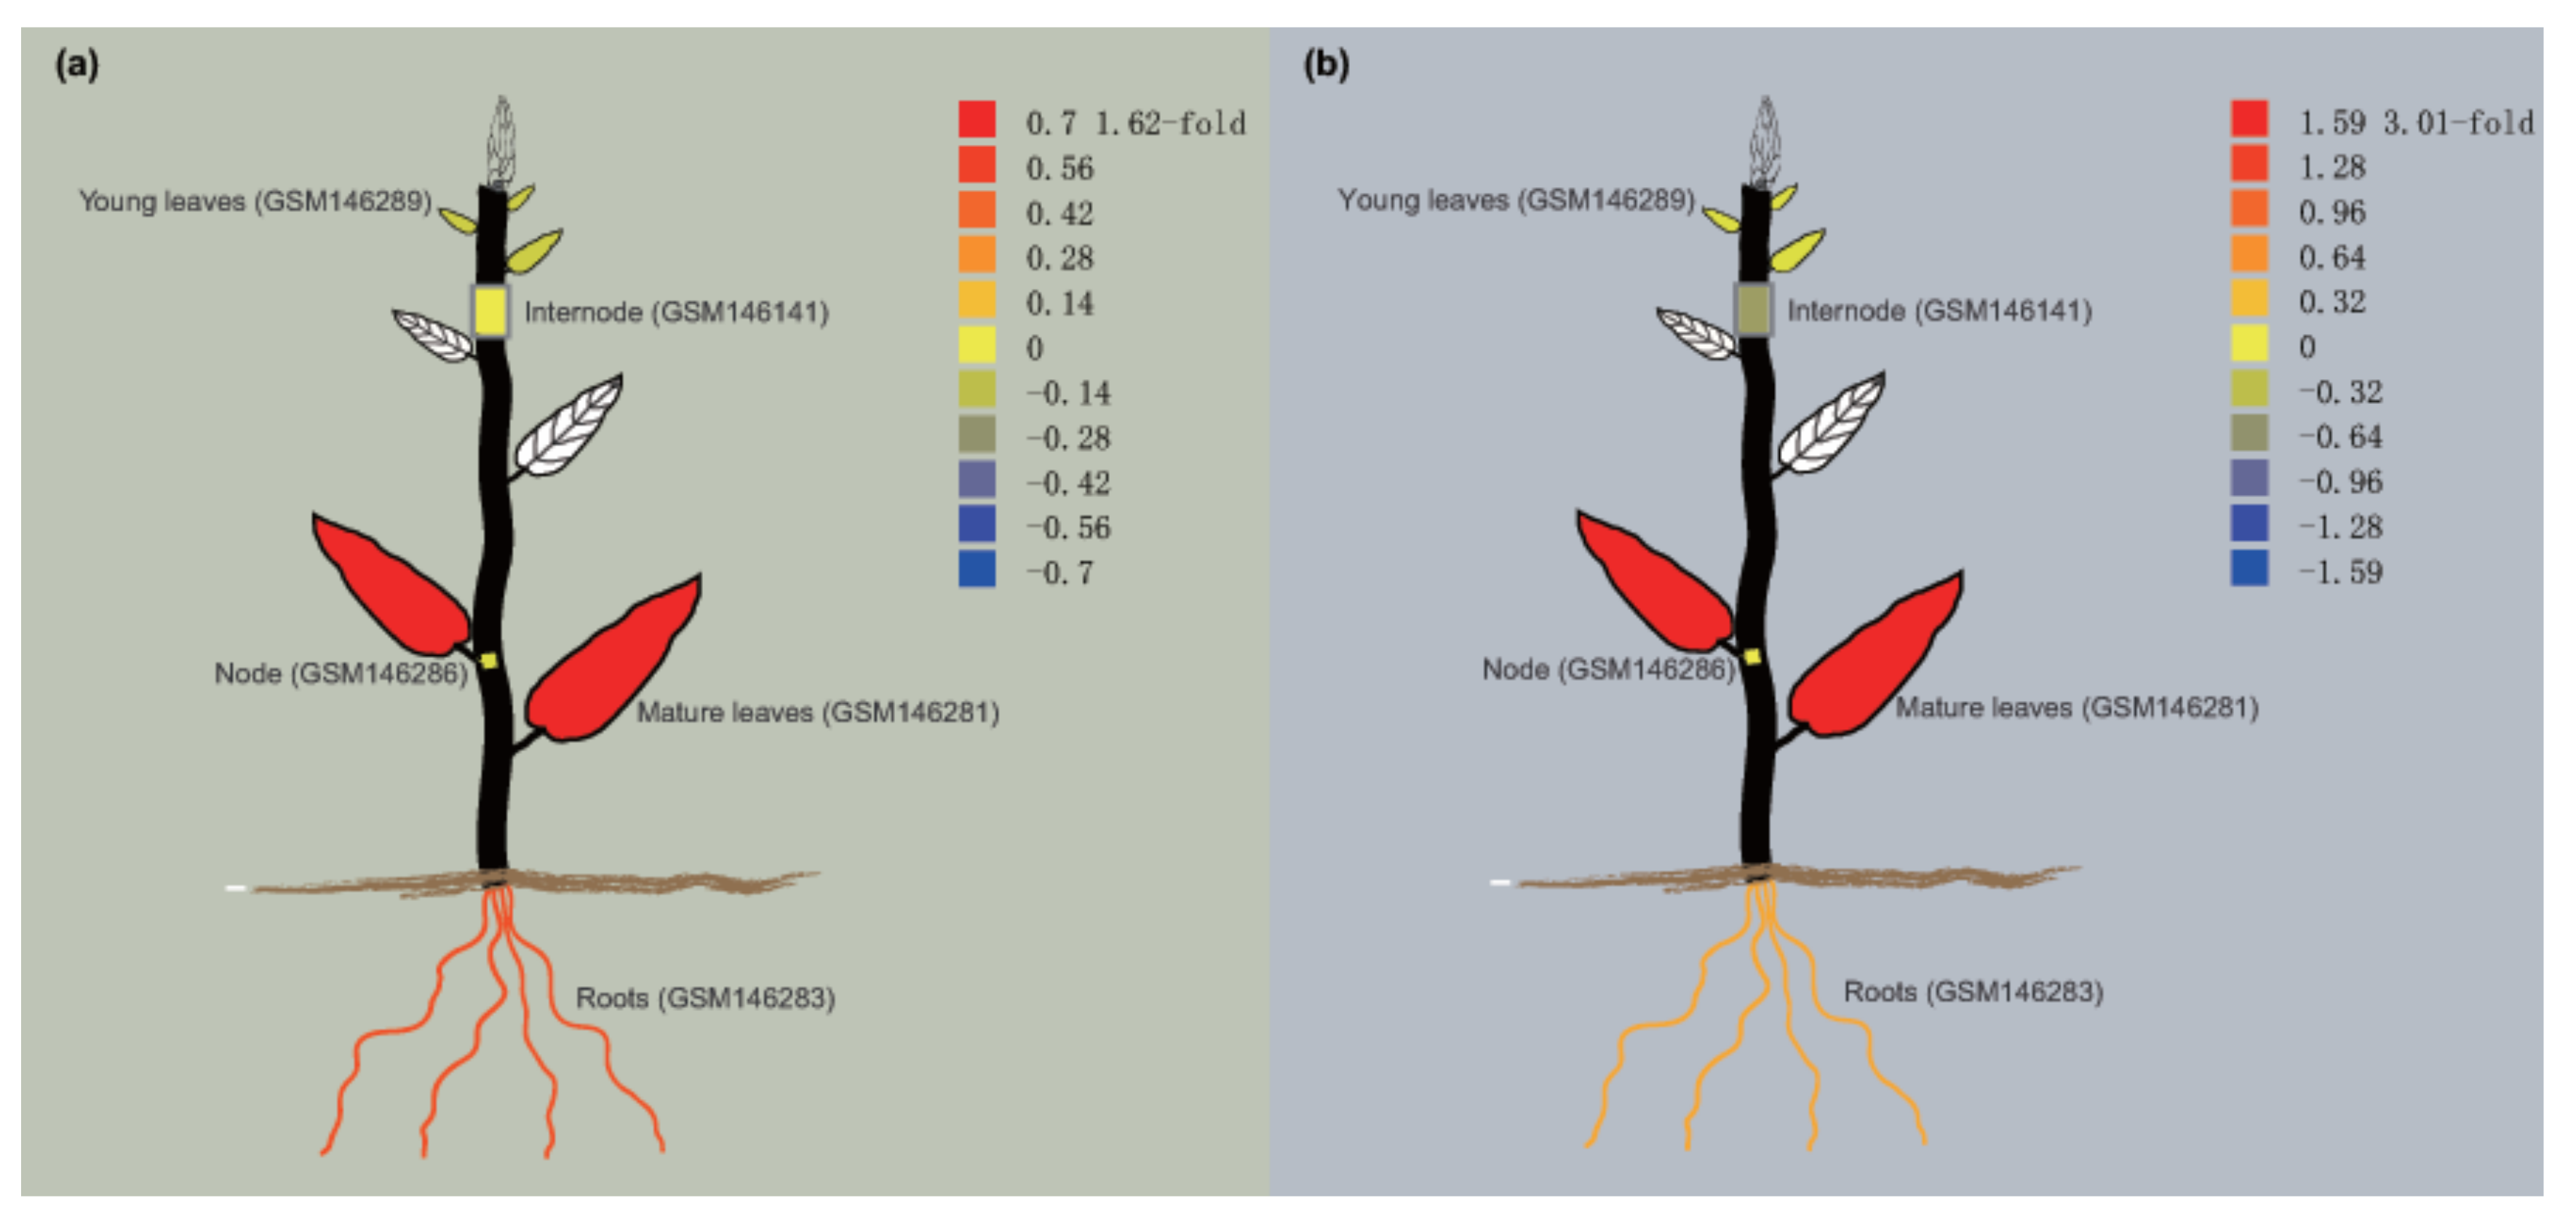
In silico, the expressions of PtNAC024 and PtNAC182 in different tissues were analysed using the exImage tool. Both PtNAC024 and PtNAC182 were highly expressed in mature leaves, followed by the roots and finally the nodes (Figure 9). However, the expression of PtNAC024 in internode tissues is relatively higher than that in young leaves (Figure 9a), while the opposite is true for PtNAC182 (Figure 9b). Similar trends were also found in the internode and node tissues (Figure 9). These results may suggest that PtNAC024 and PtNAC182 are also involved in the synthesis of lignin and fibrin, respectively.
4. Discussion
The NAC domain TFs are plant-specific TFs [5,11]. In a former published report, a total of 163 NAC genes were identified in Populus by searching the HMM domain [6]. In this study, a total of 289 NAC transcripts of 171 nonredundant genes were obtained and analysed from the PlantTFDB database, which identifies TFs using the Joint Genome Institute Ptri version 3.0 [7]. The transcripts were designed as PtNAC001–PtNAC289 for the convenience of analysis and identification (Table S1). These 171 genes covered 85.27% (139/163) of previously reported NAC TF genes of Populus (Table S1). The difference in the numbers of PtNACs may be due to different analysis methods, requiring further exploration. The homology sequence analysis found that two or more Populus NAC TFs are hit with one ortholog in Arabidopsis, which is consistent with the findings of former studies [6]. The phylogenetic tree constructed with the full-length protein sequences divided the 289 PtNACs into 18 subfamilies according to the methods used in former studies, but no PtNACs belonged to the subfamily NAC-p [6]. Although the bootstrap values were somewhat low due to the large number of sequences, which was also the case in previous studies [53,54,55], more significant bootstrap values in the distal branches allowed us to group the NAC proteins into distinct families (Figure S1). Phylogenetic analyses of the conserved N-terminal NAC domains A–E showed that the clusters were largely consistent with those of the full-length protein sequences, suggesting that the conserved NAC domains may play primary roles in NAC TF structures and functions [11,14].
It has been speculated that Populus has undergone at least three gene duplication events during the evolutionary process [9,56]. The genome duplication provides more copies of the genes, making it possible for poplar to gain new functions [55,57,58]. To detect the relationship between segmental duplication events and NAC TFs, we mapped PtNACs to the duplicated blocks and found that 75.3% PtNACs were mapped on 29 block pairs and 12 block pairs lacked corresponding duplicates [9], suggesting that dynamic changes have occurred following the segmental duplication events and some genes were lost (Figure S3). In addition to segmental duplications, whole-genome duplication and tandem duplication events might also have an impact on the expansion of the Populus NAC TF family [55,57,58]. The synteny analysis showed that 46 PtNACs related with the whole-genome duplication and 37 PtNACs involved in tandem duplications were mainly distributed on 14 of 19 LGs (Figure 2). It is intriguing that PtNAC040, PtNAC170 and PtNAC195 were detected in both whole-genome and tandem duplications. However, whether the duplicated NACs impact genetic redundancy or have evolved into divergent functions remains to be further study.
Although phylogenetic analysis provides important information for candidate genes selection, it cannot alone unequivocally indicate gene function [41]. For this reason, we combined phylogenetic grouping, gene structure, conserved motif identification, promoter cis-element and induction/tissue expression pattern. In this study, members of the same subfamily shared similar gene structure and conserved motif compositions. For instance, genes in Subfamily-q have the specific motif motif-11 and a large number of exon/intron structure variants (Figure S4). We also investigated putative cis-acting elements in the promoter region of PtNACs and found that PtNAC009, PtNAC010, PtNAC011 and PtNAC012 distributed in LG I of the same subfamily, Subfamily-f, contain 14 of 15 stress-related cis-elements (Figure 1, Figure 2, Table S6). GO annotation found that 15 PtNACs are involved in the stress response process and three participate in the oxidoreductase activity. It is interesting that 10 (PtNAC001, PtNAC002, PtNAC003, PtNAC004, PtNAC005, PtNAC066, PtNAC067, PtNAC203, PtNAC204, PtNAC250) of these 18 stress-related genes are located in Subfamily-d and six (PtNAC151, PtNAC152, PtNAC163, PtNAC164, PtNAC165, PtNAC166) in Subfamily-q (Figure 1, Figure 4, Table S7). The expression of PtNACs under salt stress was also characterised in this study and two DEGs, PtNAC024 and PtNAC182, were selected for further stress-related study. PtNAC024 and PtNAC182 are located in the Subfamily-d, consistent with the GO analysis predicting that members in Subfamily-d play roles in the stress response process. In addition, both PtNAC024 and PtNAC182 along with AT4G27410.2, the homolog gene in Arabidopsis thalian, were significantly induced by salt stress [59]. Tissue-specific expression analysis in silico showed that PtNAC024 and PtNAC182 were also involved in Populus synthesis of lignin and fibrin. Taken together, these findings indicate that Populus NAC TFs play important roles in plant stress endurance and development. The function and expression patterns in poplar using overexpression and RNAi of these two genes will be determined in our future study. We are looking forward to further explore the molecular functions of PtNACs.
5. Conclusions
In conclusion, we uncovered the salt stress-related expression of a total of 289 Populus NAC TFs in this study. The phylogenetic relationship analysis found that members in the same subfamily share a common gene structure, motif composition and promoter cis-elements, suggesting functional similarities among Populus NAC proteins within the same subtree. The expression pattern of Populus NACs under salt stress showed that PtNACs expression of 84K poplar, P. simonii × P. nigra and Arabidopsis thalian was induced by salt stress. In addition, two differentially expressed NAC genes (PtNAC024 and PtNAC182) induced by salt stress were found using edgeR. The correlation analysis showed that the expressions of PtNAC024 and PtNAC182 were significantly associated with most of the tested 63 DEGs under salt stress condition. The tissue-specific expression analysis found that PtNAC024 and PtNAC182 were differentially expressed in the internode, node and young leaf tissues. These findings support that NAC TF members play important functions in the Populus salt tolerance and tissue development.
Supplementary Materials
The following are available online at https://www.mdpi.com/1999-4907/10/8/688/s1, Table S1: NAC TFs of Populus. Table S2: Amino acids and cDNA sequences of the 289 Populus NAC genes identified in this study. The detailed information, including amino acid lengths, molecular weights and isoelectric points (PI) are also shown. Table S3: Synteny analysis of 171 Populus NACs. Intra-species gene synteny and collinearity were detected by MCScanX using default parameters considering pBLAST ≤ 1 × 10⁻⁵ [43]. Table S4: Sequence logos of the putative conserved motifs of NAC proteins. Conserved motifs and the sequence logos were generated using the MEME and TBtools programmes. Information of the discovered motifs is shown in the excel table. Motif-1 represents the NAM sub-domain A, motif-6 represents the NAM sub-domain B, motif-2 represents the NAM sub-domain C, motif-3 represents the NAM sub-domain D and motif-7 represents the NAM sub-domain E. Table S5: Phytohormone and abiotic stress-related cis-elements. Table S6: Abiotic stress-related and phytohormone response elements in 289 PtNACs promoters. Table S7: Details of the Gene Ontology annotation of 289 PtNAC sequences. Figure S1: Phylogenetic tree of 17 subfamilies of 289 Populus NAC proteins. The full-length amino acid sequences of each subfamily NAC proteins were aligned using Clustal X 1.83 and the phylogenetic tree was constructed using MEGA 7.0.21 with the NJ method. The numbers at nodes indicate the percentage bootstrap scores and only bootstrap values higher than 50% are shown. Figure S2: Phylogenetic tree of N-terminus of Populus NAC proteins. The Phylogenetic tree was constructed using MEGA 7.0.21 with the NJ method after alignment of the conserved N-terminus domain of 289 Populus NAC proteins. Only the topology is presented. Figure S3: Genome-wide duplication of Populus. The schematic diagram of genome-wide chromosome organisation arisen from the salicoid-specific genome duplication 65 Ma in Populus was adapted from Tuskan et al. [9]. Segmental duplicated homologous blocks are indicated with the same colour. Only the duplicated regions containing NAC genes are connected with lines in shaded colours. The diagram to the left uses the same colour coding and further illustrates the chimeric nature of most linkage groups. Figure S4: Conserved motifs, phylogenetic relationships and gene structure of Populus NAC genes. (a) Conserved motifs of Populus NAC proteins were discovered using the MEME programme and are shown by colourful boxes. The black lines represent the non-conserved sequences and the detailed information of each motif is presented in ESM_6. (b) Multiple alignments of the full-length sequences of Populus NAC proteins were performed using the programme Clustal X 1.83 and the phylogenetic tree was constructed using MEGA. The percentage bootstrap scores higher than 50% are indicated on the nodes. The 18 phylogenetic subfamilies are designed as a to r. (c) The UTR/CDS structures of Populus NAC genes were detected using the programme TBtools. UTR and CDS are represented by green and yellow boxes, respectively. The black lines represent the introns of each NAC gene. The sizes of UTR, CDS and introns can be estimated using the scale at the bottom. Figure S5: Significance analysis of the expression level of Populus genes under salt stress detected by RNA-Seq. (a) The overall expression of all the genes of 84K poplar. (b) Overall expression of NACs of 84K poplar. (c) Overall expression of NACs of P. simonii × P. nigra. (d) Overall expression of NACs of Arabidopsis. The 95% family-wise confidence level was measured. The X-coordinate indicates the differences in mean levels (FPKM) of groups. S1, S2, S3 and S4 were treated with NaCl. W1, W2, W3 and W4 were controls treated with regular water. Figure S6: Correlation analysis of the expression level of the 63 DEGs and two putative differentially expressed NACs, PtNAC024 and PtNAC182, based on RNA-Seq in different samples exposed to salt stress. Red indicates poor correlation and blue denotes high correlation. Statistical analyses were conducted using R v3.3.1 (http://cran.r-project.org/).
Author Contributions
Conceptualization, S.W. and Y.H.; Methodology, S.W.; Software, S.W.; Validation, J.H. and X.W.; Investigation, J.H. and X.W.; Resources, T.J.; Data curation, H.D.; Writing—Original draft preparation, J.H. and X.W.; Writing—Review and editing, S.W.; Supervision and project administration, Y.H.; Funding acquisition, S.W.
Funding
This research was funded by the National Natural Science Foundation of China, 31800564 and 31700534; Natural Science Foundation of Shanxi Province, 201801D121246; the Excellent Doctoral Program of Shanxi Province, SXYBKY201727; the Funding for Doctoral Research of Shanxi Agricultural University, 2017YJ21.
Acknowledgments
The authors thank all of the members who helped on this paper. We gratefully acknowledge the staff and students of Shanxi Agricultural University and who assisted in materials collection: Xiyan Li, Yanze Jing, Shasha Zhang, Haifeng Wang, Cong Xu, and Ziyu Dong who assisted with data analysis.
Conflicts of Interest
The authors declare no conflict of interest.
References
- Riechmann, J.L.; Heard, J.; Martin, G.; Reuber, L.; Jiang, C.Z.; Keddie, J.; Adam, L.; Pineda, O.; Ratcliffe, O.J.; Samaha, R.R.; et al. Arabidopsis Transcription Factors: Genome-Wide Comparative Analysis Among Eukaryotes. Science 2000, 290, 2105–2110. [Google Scholar] [CrossRef] [PubMed]
- Scott, M.P. Development: The natural history of genes. Cell 2000, 100, 27–40. [Google Scholar] [CrossRef]
- Carroll, S.B. Endless forms: The evolution of gene regulation and morphological diversity. Cell 2000, 101, 577–580. [Google Scholar] [CrossRef]
- Lopato, S.; Bazanova, N.; Morran, S.; Milligan, A.S.; Shirley, N.; Langridge, P. Isolation of plant transcription factors using a modified yeast one-hybrid system. Plant Methods 2006, 2, 3. [Google Scholar] [CrossRef] [PubMed]
- Riano-Pachon, D.M.; Ruzicic, S.; Dreyer, I.; Mueller-Roeber, B. PlnTFDB: An integrative plant transcription factor database. BMC Bioinform. 2007, 8, 42. [Google Scholar] [CrossRef] [PubMed]
- Hu, R.; Qi, G.; Kong, Y.; Kong, D.; Qian, G.; Zhou, G. Comprehensive Analysis of NAC Domain Transcription Factor Gene Family in Populus trichocarpa. BMC Plant Biol. 2010, 10, 145. [Google Scholar] [CrossRef] [PubMed]
- Jin, J.; Tian, F.; Yang, D.C.; Meng, Y.Q.; Kong, L.; Luo, J.; Gao, G. PlantTFDB 4.0: Toward a central hub for transcription factors and regulatory interactions in plants. Nucleic Acids Res. 2017, 45, D1040–D1045. [Google Scholar] [CrossRef]
- Jin, J.; He, K.; Tang, X.; Li, Z.; Lv, L.; Zhao, Y.; Luo, J.; Gao, G. An Arabidopsis Transcriptional Regulatory Map Reveals Distinct Functional and Evolutionary Features of Novel Transcription Factors. Mol. Biol. Evol. 2015, 32, 1767–1773. [Google Scholar] [CrossRef] [PubMed]
- Tuskan, G.A.; Difazio, S.; Jansson, S.; Bohlmann, J.; Grigoriev, I.; Hellsten, U.; Putnam, N.; Ralph, S.; Rombauts, S.; Salamov, A.; et al. The genome of black cottonwood, Populus trichocarpa (Torr. & Gray). Science 2006, 313, 1596–1604. [Google Scholar] [CrossRef]
- Zhu, Q.H.; Guo, A.Y.; Gao, G.; Zhong, Y.F.; Xu, M.; Huang, M.; Luo, J. DPTF: A database of poplar transcription factors. Bioinformatics 2007, 23, 1307–1308. [Google Scholar] [CrossRef]
- Ooka, H. Comprehensive Analysis of NAC Family Genes in Oryza sativa and Arabidopsis thaliana. DNA Res. 2003, 10, 239–247. [Google Scholar] [CrossRef] [PubMed]
- Fang, Y.; You, J.; Xie, K.; Xie, W.; Xiong, L. Systematic sequence analysis and identification of tissue-specific or stress-responsive genes of NAC transcription factor family in rice. Mol. Genet. Genom. 2008, 280, 547–563. [Google Scholar] [CrossRef] [PubMed]
- Aida, M.; Ishida, T.; Fukaki, H.; Fujisawa, H.; Tasaka, M. Genes involved in organ separation in Arabidopsis: An analysis of the cup-shaped cotyledon mutant. Plant Cell 1997, 9, 841–857. [Google Scholar] [CrossRef] [PubMed]
- Kikuchi, K.; Ueguchi-Tanaka, M.; Yoshida, K.T.; Nagato, Y.; Matsusoka, M.; Hirano, H.Y. Molecular analysis of the NAC gene family in rice. Mol. Gen. Genet. 2000, 262, 1047–1051. [Google Scholar] [CrossRef] [PubMed]
- Duval, M.; Hsieh, T.F.; Kim, S.Y.; Thomas, T.L. Molecular characterization of AtNAM: A member of the Arabidopsis NAC domain superfamily. Plant Mol. Biol. 2002, 50, 237–248. [Google Scholar] [CrossRef]
- Hegedus, D.; Min, Y.; Baldwin, D.; Gruber, M.; Sharpe, A.; Parkin, I.; Whitwill, S.; Lydiate, D. Molecular characterization of Brassica napus NAC domain transcriptional activators induced in response to biotic and abiotic stress. Plant Mol. Biol. 2003, 53, 383. [Google Scholar] [CrossRef]
- Ernst, H.A.; Olsen, A.N.; Larsen, S.; Lo, L.L. Structure of the conserved domain of ANAC, a member of the NAC family of transcription factors. EMBO Rep. 2004, 5, 297–303. [Google Scholar] [CrossRef]
- Olsen, A.N.; Ernst, H.A.; Leggio, L.L.; Skriver, K. NAC transcription factors: Structurally distinct, functionally diverse. Trends Plant Sci. 2005, 10, 79–87. [Google Scholar] [CrossRef]
- Jensen, M.K.; Kjaersgaard, T.; Nielsen, M.M.; Galberg, P.; Petersen, K.; O’Shea, C.; Skriver, K. The Arabidopsis thaliana NAC transcription factor family: Structure-function relationships and determinants of ANAC019 stress signalling. Biochem. J. 2010, 426, 183–196. [Google Scholar] [CrossRef]
- Zhong, R.; Demura, T.; Ye, Z.H. SND1, a NAC domain transcription factor, is a key regulator of secondary wall synthesis in fibers of Arabidopsis. Plant Cell 2006, 18, 3158–3170. [Google Scholar] [CrossRef]
- Ohashiito, K.; Oda, Y.; Fukuda, H. Arabidopsis VASCULAR-RELATED NAC-DOMAIN6 directly regulates the genes that govern programmed cell death and secondary wall formation during xylem differentiation. Plant Cell 2010, 22, 3461–3473. [Google Scholar] [CrossRef] [PubMed]
- Puranik, S.; Sahu, P.P.; Srivastava, P.S.; Prasad, M. NAC proteins: Regulation and role in stress tolerance. Trends Plant Sci. 2012, 17, 369–381. [Google Scholar] [CrossRef] [PubMed]
- Mao, C.; Lu, S.; Lv, B.; Zhang, B.; Shen, J.; He, J.; Luo, L.; Xi, D.; Chen, X.; Ming, F. A Rice NAC Transcription Factor Promotes Leaf Senescence via ABA Biosynthesis. Plant Physiol. 2017, 174, 1747–1763. [Google Scholar] [CrossRef] [PubMed] [Green Version]
- Wang, L.; Li, Z.; Lu, M.; Wang, Y. ThNAC13, a NAC Transcription Factor from Tamarix hispida, Confers Salt and Osmotic Stress Tolerance to Transgenic Tamarix and Arabidopsis. Front. Plant Sci. 2017, 8, 635. [Google Scholar] [CrossRef] [PubMed] [Green Version]
- Zhao, C.; Lasses, T.; Bako, L.; Kong, D.; Zhao, B.; Chanda, B.; Bombarely, A.; Cruz-Ramírez, A.; Scheres, B.; Brunner, A.M. XYLEM NAC DOMAIN1, an angiosperm NAC transcription factor, inhibits xylem differentiation through conserved motifs that interact with RETINOBLASTOMA-RELATED. New Phytol. 2017, 216, 76–89. [Google Scholar] [CrossRef] [PubMed]
- Hendelman, A.; Stav, R.; Zemach, H.; Arazi, T. The tomato NAC transcription factor SlNAM2 is involved in flower-boundary morphogenesis. J. Exp. Bot. 2013, 64, 5497–5507. [Google Scholar] [CrossRef] [PubMed] [Green Version]
- Mallory, A.C.; Al, E. MicroRNA regulation of NAC-domain targets is required for proper formation and separation of adjacent embryonic, vegetative, and floral organs. Curr. Biol. 2004, 14, 1035–1046. [Google Scholar] [CrossRef]
- Zhang, L.; Yao, L.; Zhang, N. Lateral Root Development in Potato Is Mediated by Stu-mi164 Regulation of NAC Transcription Factor. Front. Plant Sci. 2018, 9, 383. [Google Scholar] [CrossRef]
- Hao, Y.J.; Wei, W.; Song, Q.X.; Chen, H.W.; Zhang, Y.Q.; Wang, F.; Zou, H.F.; Lei, G.; Tian, A.G.; Zhang, W.K. Soybean NAC transcription factors promote abiotic stress tolerance and lateral root formation in transgenic plants. Plant J. Cell Mol. Biol. 2011, 68, 302. [Google Scholar] [CrossRef]
- Hibara, K.; Takada, S.; Tasaka, M. CUC1 gene activates the expression of SAM-related genes to induce adventitious shoot formation. Plant J. 2003, 36, 687–696. [Google Scholar] [CrossRef]
- Mao, C.; Ding, W.; Wu, Y.; Yu, J.; He, X.; Shou, H.; Wu, P. Overexpression of a NAC-domain protein promotes shoot branching in rice. New Phytol. 2007, 176, 288–298. [Google Scholar] [CrossRef] [PubMed]
- Ko, J.; Yang, S.; Park, A.O.; Han, K. ANAC012, a member of the plant-specific NAC transcription factor family, negatively regulates xylary fiber development in Arabidopsis thaliana. Plant J. 2007, 50, 1035–1048. [Google Scholar] [CrossRef] [PubMed]
- Zhao, Y.; Sun, J.; Xu, P.; Zhang, R.; Li, L. Intron-mediated alternative splicing of WOOD-ASSOCIATED NAC TRANSCRIPTION FACTOR1B regulates cell wall thickening during fiber development in Populus species. Plant Physiol. 2014, 164, 765–776. [Google Scholar] [CrossRef] [PubMed]
- Jeong, J.S.; Kim, Y.S.; Baek, K.H.; Jung, H.; Ha, S.H.; Do, C.Y.; Kim, M.; Reuzeau, C.; Kim, J.K. Root-specific expression of OsNAC10 improves drought tolerance and grain yield in rice under field drought conditions. Plant Physiol. 2010, 153, 185. [Google Scholar] [CrossRef] [PubMed]
- Saad, A.S.; Li, X.; Li, H.P.; Huang, T.; Gao, C.S.; Guo, M.W.; Cheng, W.; Zhao, G.Y.; Liao, Y.C. A rice stress-responsive NAC gene enhances tolerance of transgenic wheat to drought and salt stresses. Plant Sci. 2013, 203, 33–40. [Google Scholar] [CrossRef] [PubMed]
- Feng, F.; Ding, F.; Tyree, M.T. Investigations concerning cavitation and frost fatigue in clonal 84K poplar using high-resolution cavitron measurements. Plant Physiol. 2015, 168, 144–155. [Google Scholar] [CrossRef] [PubMed]
- Movahedi, A.; Zhang, J.; Yin, T.; Qiang, Z. Functional Analysis of Two Orthologous NAC Genes, CarNAC3, and CarNAC6 from Cicer arietinum, Involved in Abiotic Stresses in Poplar. Plant Mol. Biol. Rep. 2015, 33, 1539–1551. [Google Scholar] [CrossRef]
- Chen, D.; Chai, S.; Mcintyre, C.L.; Xue, G.P. Overexpression of a predominantly root-expressed NAC transcription factor in wheat roots enhances root length, biomass and drought tolerance. Plant Cell Rep. 2018, 37, 225–237. [Google Scholar] [CrossRef]
- Kim, S.G.; Lee, A.K.; Yoon, H.K.; Park, C.M. A membrane-bound NAC transcription factor NTL8 regulates gibberellic acid-mediated salt signaling in Arabidopsis seed germination. Plant J. 2008, 55, 77–88. [Google Scholar] [CrossRef]
- Wang, X.; Basnayake, B.M.; Zhang, H.; Li, G.; Li, W.; Virk, N.; Mengiste, T.; Song, F. The Arabidopsis ATAF1, a NAC transcription factor, is a negative regulator of defense responses against necrotrophic fungal and bacterial pathogens. Mol. Plant-Microbe Interact. 2009, 22, 1227–1238. [Google Scholar] [CrossRef]
- Shen, H.; Yin, Y.B.; Chen, F.; Xu, Y.; Dixon, R.A.; Haigler, C.; Liu, C.J.; Mort, A.; Reddy, S. A bioinformatic analysis of NAC genes for plant cell wall development in relation to lignocellulosic bioenergy production. Bioenergy Res. 2009, 2, 217. [Google Scholar] [CrossRef]
- Kumar, S.; Stecher, G.; Tamura, K. MEGA7: Molecular Evolutionary Genetics Analysis Version 7.0 for Bigger Datasets. Mol. Biol. Evol. 2016, 33, 1870–1874. [Google Scholar] [CrossRef] [PubMed] [Green Version]
- Yupeng, W.; Haibao, T.; Jeremy D, D.; Xu, T.; Jingping, L.; Xiyin, W.; Tae-ho, L.; Huizhe, J.; Barry, M.; Hui, G. MCScanX: A toolkit for detection and evolutionary analysis of gene synteny and collinearity. Nucleic Acids Res. 2012, 40, e49. [Google Scholar]
- Chen, C.; Xia, R.; Chen, H.; He, Y. TBtools, a Toolkit for Biologists integrating various HTS-data handling tools with a user-friendly interface. bioRxiv 2018. [Google Scholar] [CrossRef]
- Bailey, T.L.; Boden, M.; Buske, F.A.; Frith, M.; Grant, C.E.; Clementi, L.; Ren, J.; Li, W.W.; Noble, W.S. MEME SUITE: Tools for motif discovery and searching. Nucleic Acids Res. 2009, 37, W202–W208. [Google Scholar] [CrossRef] [PubMed]
- Finn, R.D.; Mistry, J.; Schuster-Bockler, B.; Griffiths-Jones, S.; Hollich, V.; Lassmann, T.; Moxon, S.; Marshall, M.; Khanna, A.; Durbin, R.; et al. Pfam: Clans, web tools and services. Nucleic Acids Res. 2006, 34, D247–D251. [Google Scholar] [CrossRef] [PubMed]
- Letunic, I.; Bork, P.J.N.A.R. 20 years of the SMART protein domain annotation resource. Nucleic Acids Res. 2018, 46, D493–D496. [Google Scholar] [CrossRef]
- Magali, L.; Patrice, D.; Gert, T.; Kathleen, M.; Yves, M.; Yves, V.d.P.; Pierre, R.; Stephane, R.J.N.A.R. PlantCARE, a database of plant cis-acting regulatory elements and a portal to tools for in silico analysis of promoter sequences. Nucleic Acids Res. 2002, 30, 325–327. [Google Scholar]
- Conesa, A.; Götz, S.; Garcíagómez, J.M.; Terol, J.; Talón, M.; Robles, M.J.B. Blast2GO: A universal tool for annotation, visualization and analysis in functional genomics research. Bioinformatics 2005, 21, 3674–3676. [Google Scholar] [CrossRef]
- Wang, S.; Zhou, B.; Yao, W.; Jiang, T. PsnERF75 Transcription Factor from Populus simonii × P. nigra Confers Salt Tolerance in Transgenic Arabidopsis. J. Plant Biol. 2018, 61, 61–71. [Google Scholar] [CrossRef]
- Wang, S.; Wang, J.; Yao, W.; Zhou, B.; Li, R.; Jiang, T. Expression patterns of WRKY genes in di-haploid Populus simonii × P. nigra in response to salinity stress revealed by quantitative real-time PCR and RNA sequencing. Plant Cell Rep. 2014, 33, 1687–1696. [Google Scholar] [CrossRef] [PubMed]
- Regier, N.; Frey, B. Experimental comparison of relative RT-qPCR quantification approaches for gene expression studies in poplar. BMC Mol. Biol. 2010, 11, 57. [Google Scholar] [CrossRef] [PubMed]
- Li, X.; Duan, X.; Jiang, H.; Sun, Y.; Tang, Y.; Yuan, Z.; Guo, J.; Liang, W.; Chen, L.; Yin, J.; et al. Genome-wide analysis of basic/helix-loop-helix transcription factor family in rice and Arabidopsis. Plant Physiol. 2006, 141, 1167–1184. [Google Scholar] [CrossRef] [PubMed]
- Wang, D.; Guo, Y.; Wu, C.; Yang, G.; Li, Y.; Zheng, C. Genome-wide analysis of CCCH zinc finger family in Arabidopsis and rice. BMC Genom. 2008, 9, 44. [Google Scholar] [CrossRef] [PubMed]
- Wilkins, O.; Nahal, H.; Foong, J.; Provart, N.J.; Campbell, M.M. Expansion and diversification of the Populus R2R3-MYB family of transcription factors. Plant Physiol. 2009, 149, 981–993. [Google Scholar] [CrossRef] [PubMed]
- Brunner, A.M.; Busov, V.B.; Strauss, S.H. Poplar genome sequence: Functional genomics in an ecologically dominant plant species. Trends Plant Sci. 2004, 9, 49–56. [Google Scholar] [CrossRef] [PubMed]
- Kalluri, U.C.; Difazio, S.P.; Brunner, A.M.; Tuskan, G.A. Genome-wide analysis of Aux/IAA and ARF gene families in Populus trichocarpa. BMC Plant Biol. 2007, 7, 59. [Google Scholar] [CrossRef] [PubMed]
- Lan, T.; Yang, Z.L.; Yang, X.; Liu, Y.J.; Wang, X.R.; Zeng, Q.Y. Extensive functional diversification of the Populus glutathione S-transferase supergene family. Plant Cell 2009, 21, 3749–3766. [Google Scholar] [CrossRef]
- Kreps, J.A.; Wu, Y.; Chang, H.S.; Zhu, T.; Wang, X.; Harper, J.F. Transcriptome changes for Arabidopsis in response to salt, osmotic, and cold stress. Plant Physiol. 2002, 130, 2129–2141. [Google Scholar] [CrossRef]
Figure 1.
Multiple alignment and phylogenetic analysis of Populus NAC proteins. The full-length amino acid sequences of 289 Populus NAC proteins were aligned using Clustal X 1.83 and the phylogenetic tree was constructed using MEGA (Molecular Evolutionary Genetics Analysis) 7.0.21 with the NJ (Neighbor-Joining) method. Each subfamily is indicated in a specific colour.

Figure 2.
Chromosome locations of Populus NAC genes. The 287 NAC genes are mapped to the 19 LGs (Linkage-Groups) and the other two genes reside on scaffold_80 and scaffold_141. Whole-genome wide or segmental duplicated genes are labelled with red colour dots. The green dots indicate the genes are involved in tandem duplicates. The scales represent the distance of chromosomes.

Figure 3.
Duplicated blocks in Populus genome. The syntenic relationships among 19 Populus LGs are detected using the MCScanX programme. The colinear blocks of Populus genome are shown in grey connecting lines and the colinear blocks of NAC genes are marked by red connecting lines.
Figure 3.
Duplicated blocks in Populus genome. The syntenic relationships among 19 Populus LGs are detected using the MCScanX programme. The colinear blocks of Populus genome are shown in grey connecting lines and the colinear blocks of NAC genes are marked by red connecting lines.

Figure 4.
GO (gene ontology) annotation of Populus NAC genes. GO analysis of 289 Populus NAC genes sequences predicted for their involvement in biological processes (a), molecular functions (b) and cellular components (c).
Figure 4.
GO (gene ontology) annotation of Populus NAC genes. GO analysis of 289 Populus NAC genes sequences predicted for their involvement in biological processes (a), molecular functions (b) and cellular components (c).

Figure 5.
Expression level of Populus genes under salt stress detected by RNA-Seq. The expression is measured as FPKM (fragments per kilo-base transcript per million mapped reads) based on the Illumina HiSeq platform. A1, A2, C1, C2, S1, S2, S3 and S4 were treated with NaCl. B1, B2, D1, D2, W1, W2, W3 and W4 were controls treated with regular water. The overall expression of all the genes in 84K poplar (a). The overall expression of NACs in 84K poplar (b), P. simonii × P. nigra T. S. Hwang et Liang (c) and Arabidopsis thaliana (L.) Heynh. (d).

Figure 6.
Number of stress-related differentially expressed genes (DEGs) in Populus. (a) Veen diagram analysis of DEGs of Populus in response to salt stress. (b) Veen diagram of DEGs of the NAC transcription factor (TF) family of Populus in response to salt stress. (c) Up/down-regulated DEGs of Populus in response to salt stress. (d) Up/down-regulated DEGs of the NAC TF family of Populus in response to salt stress. S1, S2, S3 and S4 were treated with NaCl. W1, W2, W3 and W4 were controls treated with regular water.
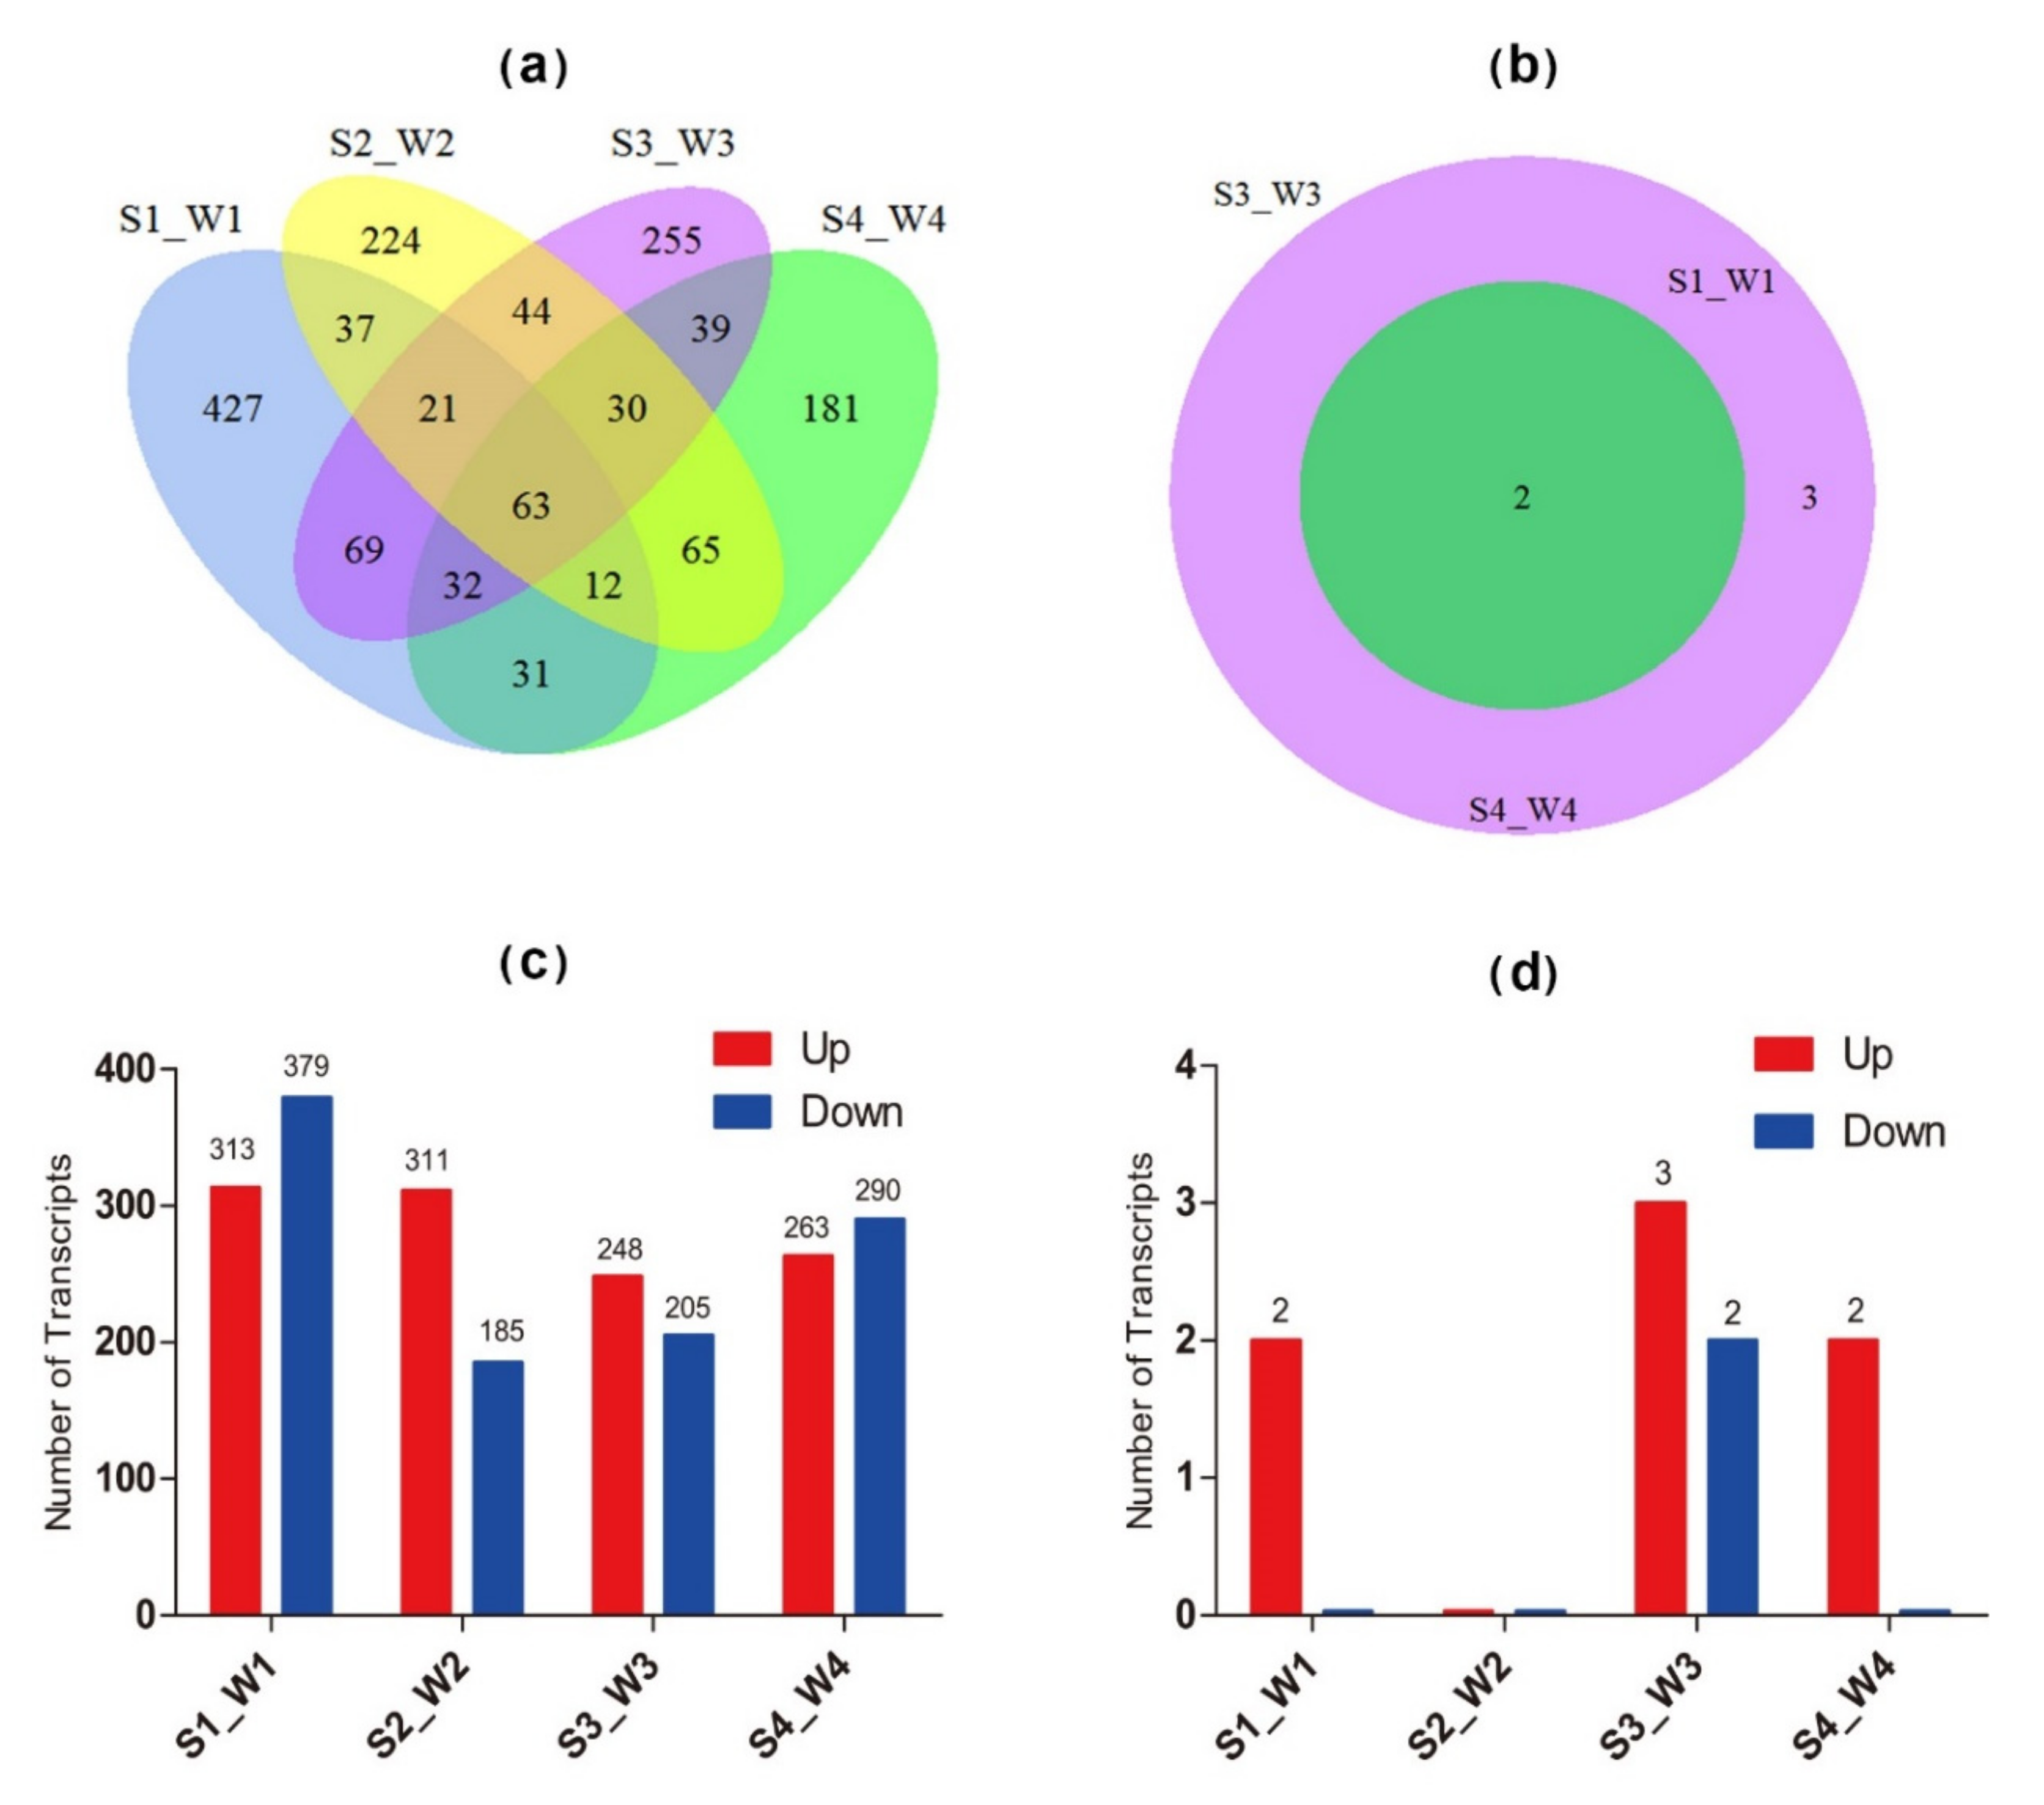
Figure 7.
Heatmap and clustering of the 63 DEGs and two putative differentially expressed NACs, PtNAC024 and PtNAC182, based on RNA-Seq in different samples exposed to salt stress. (a) Up-regulated genes are indicated with a pink background. (b) Down-regulated genes are indicated with an aqua background. The expression is measured as the log transformation (base 2) of the specific value (S-tested/W-control) of FPKM (fragments per kilo-base transcript per million mapped reads). The expression values were standardised by columns. Green indicates low expression and red denotes high expression. S1, S2, S3 and S4 were treated with NaCl. W1, W2, W3 and W4 were controls treated with regular water. PtNAC024 and PtNAC182 are marked with red font.

Figure 8.
Expression analysis of differentially expressed NACs in response to salt stress based on RT-qPCR of 84K poplar and RNA-Seq of Populus and Arabidopsis. (a) Expression of PtNAC024 and PtNAC182 of 84K poplar based on RNA-Seq. (b) Expression of PtNAC024 and PtNAC182 of P. simonii × P. nigra based on RNA-Seq. (c) Expression of the gene homolog of PtNAC024 and PtNAC182 in Arabidopsis (AT4G27410.2) based on RNA-Seq. (d) Relative expression of PtNAC024 and PtNAC182 of 84K poplar based on RT-qPCR. The expression level based on RNA-Seq was measured as FPKM and the relative expression was calculated using the 2−ΔΔCt method, defined as: ΔΔCt = (Ct-target − Ct-control)2 − (Ct-target − Ct-control)1. S indicates samples treated with NaCl and W the controls treated with regular water. Stars represent t-test results of gene expression after salt treatment compared to that of the controls. * indicates a significant difference at p < 0.05 and ** at p < 0.01.

Figure 9.
Tissue-specific expression pattern of PtNAC024 and PtNAC182 of Populus in silico. (a) Expression pattern of PtNAC024. (b) Expression pattern of PtNAC182. The related data were directly downloaded using the accession numbers of genes from PopGenIE and detected using the exImage tool of the PopGenIE V3 database (http://popgenie.org/). Blue indicates low expression and red denotes high expression.

© 2019 by the authors. Licensee MDPI, Basel, Switzerland. This article is an open access article distributed under the terms and conditions of the Creative Commons Attribution (CC BY) license (http://creativecommons.org/licenses/by/4.0/).
Share and Cite
MDPI and ACS Style
Wang, S.; Huang, J.; Wang, X.; Dang, H.; Jiang, T.; Han, Y. Expression Analysis of the NAC Transcription Factor Family of Populus in Response to Salt Stress. Forests 2019, 10, 688. https://doi.org/10.3390/f10080688
AMA Style
Wang S, Huang J, Wang X, Dang H, Jiang T, Han Y. Expression Analysis of the NAC Transcription Factor Family of Populus in Response to Salt Stress. Forests. 2019; 10(8):688. https://doi.org/10.3390/f10080688
Chicago/Turabian StyleWang, Shengji, Juanjuan Huang, Xingdou Wang, Hui Dang, Tingbo Jiang, and Youzhi Han. 2019. "Expression Analysis of the NAC Transcription Factor Family of Populus in Response to Salt Stress" Forests 10, no. 8: 688. https://doi.org/10.3390/f10080688
Note that from the first issue of 2016, this journal uses article numbers instead of page numbers. See further details here.