Nondestructive Near-Infrared Spectroscopic Analysis of Oils on Wood Surfaces


1
Graduate School of Bioresource Sciences, Nihon University, 1866 Kameino, Fujisawa, Kanagawa 252-0880, Japan
2
College of Bioresource Sciences, Nihon University, 1866 Kameino, Fujisawa, Kanagawa 252-0880, Japan
*
Author to whom correspondence should be addressed.
Forests 2019, 10(1), 64; https://doi.org/10.3390/f10010064
Submission received: 3 December 2018
/
Revised: 8 January 2019
/
Accepted: 11 January 2019
/
Published: 15 January 2019
(This article belongs to the Special Issue Wood Productions and Renewable Materials)
Abstract
:The further use of wood resources is expected in an environmentally conscious society. Added-value, such as durability enhancement and preservation by painting, are needed to expand the applicability of wood. Assessment of wood properties such as surface and coat adhesion can be made by studying perviousness to liquid oils, with the aim of developing wood products that deter insects and are weather-resistant; hence, discriminant analysis of oil type is important. Near-infrared (NIR) spectroscopy is a powerful tool for nondestructive characterization of organic materials and has been widely used in many industries. Here, NIR detection of oil on wood surfaces is applied for the distinguishing of three different types of oil (hereafter, “Oil_1”, “Oil_2” and “Oil_3”) via soft independent modeling of class analogy (SIMCA). Oil_1 was antiseptic vehicle or cutting oil. Oil_2 was used as a motor oil for an oil pressure machine. Oil_3 was plant-derived oil. Two types of wood that are commonly used in Japanese construction (Cryptomeria japonica and Chamaecyparis obtuse) were analyzed after applying oil. The NIR spectra measured after the oil was applied were greater in the ranges 1700–1800 nm and 2300–2500 nm than spectra for the bare wood sample. As SIMCA analyses were performed by using spectral data that included the moving average, baseline correction and second derivatives, good results were obtained for Oil_3 for both wood samples. However, the correct classification percentages were low for Oil_1, and the percentage of samples classified within several categories was high. If the components are very different, such as those for Oil_3, NIRS can be a powerful non-destructive method for identifying oil in the context of wood products testing.
1. Introduction
As wood has been widely used as an architectural and furniture material, it is necessary for the maintenance of the way of life in Japan [1]. Approximately 540,000 wooden buildings were built in Japan in 2017 [2]. The further use of biomass resources such as wood is expected in order to reduce environmental costs. However, old wooden buildings are in a state of partial disrepair because of the Japanese climate, with high temperature and humidity, and must be repaired every year in order to maintain their structural integrity. As wood is often processed to add some functionalities for the expansion of its applications and utility, it is important to study its surface and material adhesion properties. For instance, a preservative may be applied to the surface of the wood to increase its durability [3], or a resin overlay film may be affixed to its surface to make it more decorative or durable [4]. In such processing, the wood surface and material adhesion properties are important factors in keeping the wood surface coating intact. In this study, the relationship between the wood surface and vehicle fluids, hereafter referred to merely as “oils”, that are ingredients in printing ink, colored paints, and antiseptic agents, has been focused on. The adhesion between wood and oil was observed by using near-infrared spectroscopy (NIRS).
NIRS is an increasingly popular technique used in the nondestructive evaluation of organic materials, and has found widespread use in a variety of industries, including those of food, agriculture, pharmaceuticals, and wood [5,6,7,8]. In addition to nondestructive evaluation, NIRS may be employed as a classification tool by using soft independent modeling of class analogy (SIMCA) [9,10]. Regarding wood research, NIRS has been used as a nondestructive measurement tool. The modulus of elasticity in bending, bending strength, wood density and moisture content were applied to measure for acquisition NIR spectra under moving conditions on conveyer [9]. Good prediction results have been obtained in its practical use in the wood industry. Furthermore, the relationship between the NIR acquisition for wood surface conditions and wood anisotropy was argued in a next NIR research step [10]. NIR receiving light system mode (probe or direct), wood measurement surface and sample size were summarized and compared. Focusing on wood surface conditions that include the anisotropy like the direction of cell structure is an important factor in the applied NIR technique. In a part of surface analysis, three oils adhering to wood surfaces were identified using NIRS. In the wood industry, as some oils are widely used as the surface treatment, the classification for oil species on wood surfaces is important. Two wood species, Cryptomeria japonica (L.f.) D.Don (Japanese ceder) and Chamaecyparis obtuse (Siebold & Zucc.) Endl. (Japanese cypress), that are mainly used within Japanese home architecture were used for these measurements. As many wood species should be investigated, in this study, we used two wood species to facilitate confirmation of the measurement repeatability. Herein, we show that the different types of oils may be distinguished using SIMCA. Two of the oils we examined were mineral oils with differing qualities and flammable points, and the other oil was a plant oil with completely different molecular components.
2. Materials and Methods
2.1. Wood and Oil Sample Preparation
Air-dried lumber was prepared from two tree species, Cryptomeria japonica and Chamaecyparis obtuse (obtained from a commercial Japanese lumber mill), which are commonly used in the construction of Japanese buildings. The Cryptomeria japonica samples were approximately 50 mm long (longitudinal), 40 mm wide (tangential), and 10 mm thick (radial). The Chamaecyparis obtusa samples were 40 mm long, 40 mm wide, and 15 mm thick. Forty wood samples of each species were prepared; 30 were used for the training set to build the Principal Component Analysis (PCA) and 10 were the test set for comparison of the prediction accuracy. Average wood density of Cryptomeria japonica was 352 kg/m3 (standard deviation 52.1), and average wood density of Chamaecyparis obtuse was 447 kg/m3 (standard deviation 81.2). Three commercially available cutting oils were used; their details are summarized in Table 1. Oil_1 (NQ004, AZ CO., Ltd., Osaka, Japan) and Oil_2 (KURE5-56, KURE Engineering Ltd., Tokyo, Japan) are saturated hydrocarbons, and Oil_1 was used as the vehicle antiseptic. Oil_3 (Edible oils, The Nisshin OilliO Group, Ltd., Tokyo, Japan) is plant oil, with oleic acid its major component.
2.2. NIRS Procedure
The near-infrared (NIR) spectrometer (S-7100, Soma Optics Ltd., Tokyo, Japan) is shown in Figure 1. A tungsten-halogen lamp was used as the light source, and the light was diffracted within a Czerny-Turner spectroscope using two concave mirrors and a grating. Monochromatic light that was tunable over the wavelength range 1200–2500 nm (1 nm resolution) was obtained from Czerny-Turner spectroscope. The sample was irradiated with the monochromatic light, and reflectance was measured using a detector (inside the spectrometer) connected to a personal computer (Dell XPS 14z, Dell Japan, Tokyo, Japan). NIR spectra were obtained at 1 nm resolution over the entire wavelength range of 1200–2500 nm using this device. For each measurement, five spectral scans were averaged from the same position on the sample in order to ensure signal stability.
Prior to the experiments, the wood samples were maintained in an air-dried state and NIR spectra were obtained from the flat grains. Oil (100 μL) was then dropped on the same flat grain areas and maintained in an air-dried state for 24 h, and NIR spectra were then acquired at the exposure to the oil. In all measurement conditions, room temperature was 20–25 °C, and relative humidity was in the range of 40%–60%.
2.3. Data Analysis
Several factors could have affected these NIR spectra results, such as instrument stability, temperature, humidity, and the surface condition of the wood [11]. Therefore, we used spectral pre-processing treatments to reduce the spectral noise in our measurements. Several pre-treatments were compared for characterization accuracy during the measurements, and it was found that pre-treated data yielded better data analysis results than raw spectral data [12]. Pre-treatments included moving averages with a segment size of thirteen, baseline correction and second derivatives. Second-derivative spectra were obtained with the Norris Gap Derivative algorithm using a gap size of thirteen [13].
SIMCA has been extensively discussed in the literature [14]. It is a classification analysis that is often used in NIR spectroscopy [15,16,17] and focuses on similarities within classes. Each class model is subject to a PCA with a certain number of significant principal components (PCs). PCs indicated composite variables and the main structured information in the data. PCA was performed using full cross-validation (leave one out) by the multivariable analysis software (the Unscrambler (version 10.2; CAMO software, Oslo, Norway)). The number of training sets in each oil was 30 and the number of PCs for the PCA were 2. Pre-treated NIR data from the entire spectral range were used for PCA and SIMCA. SIMCA classification results had a significance level α = 0.05.
3. Results and Discussion
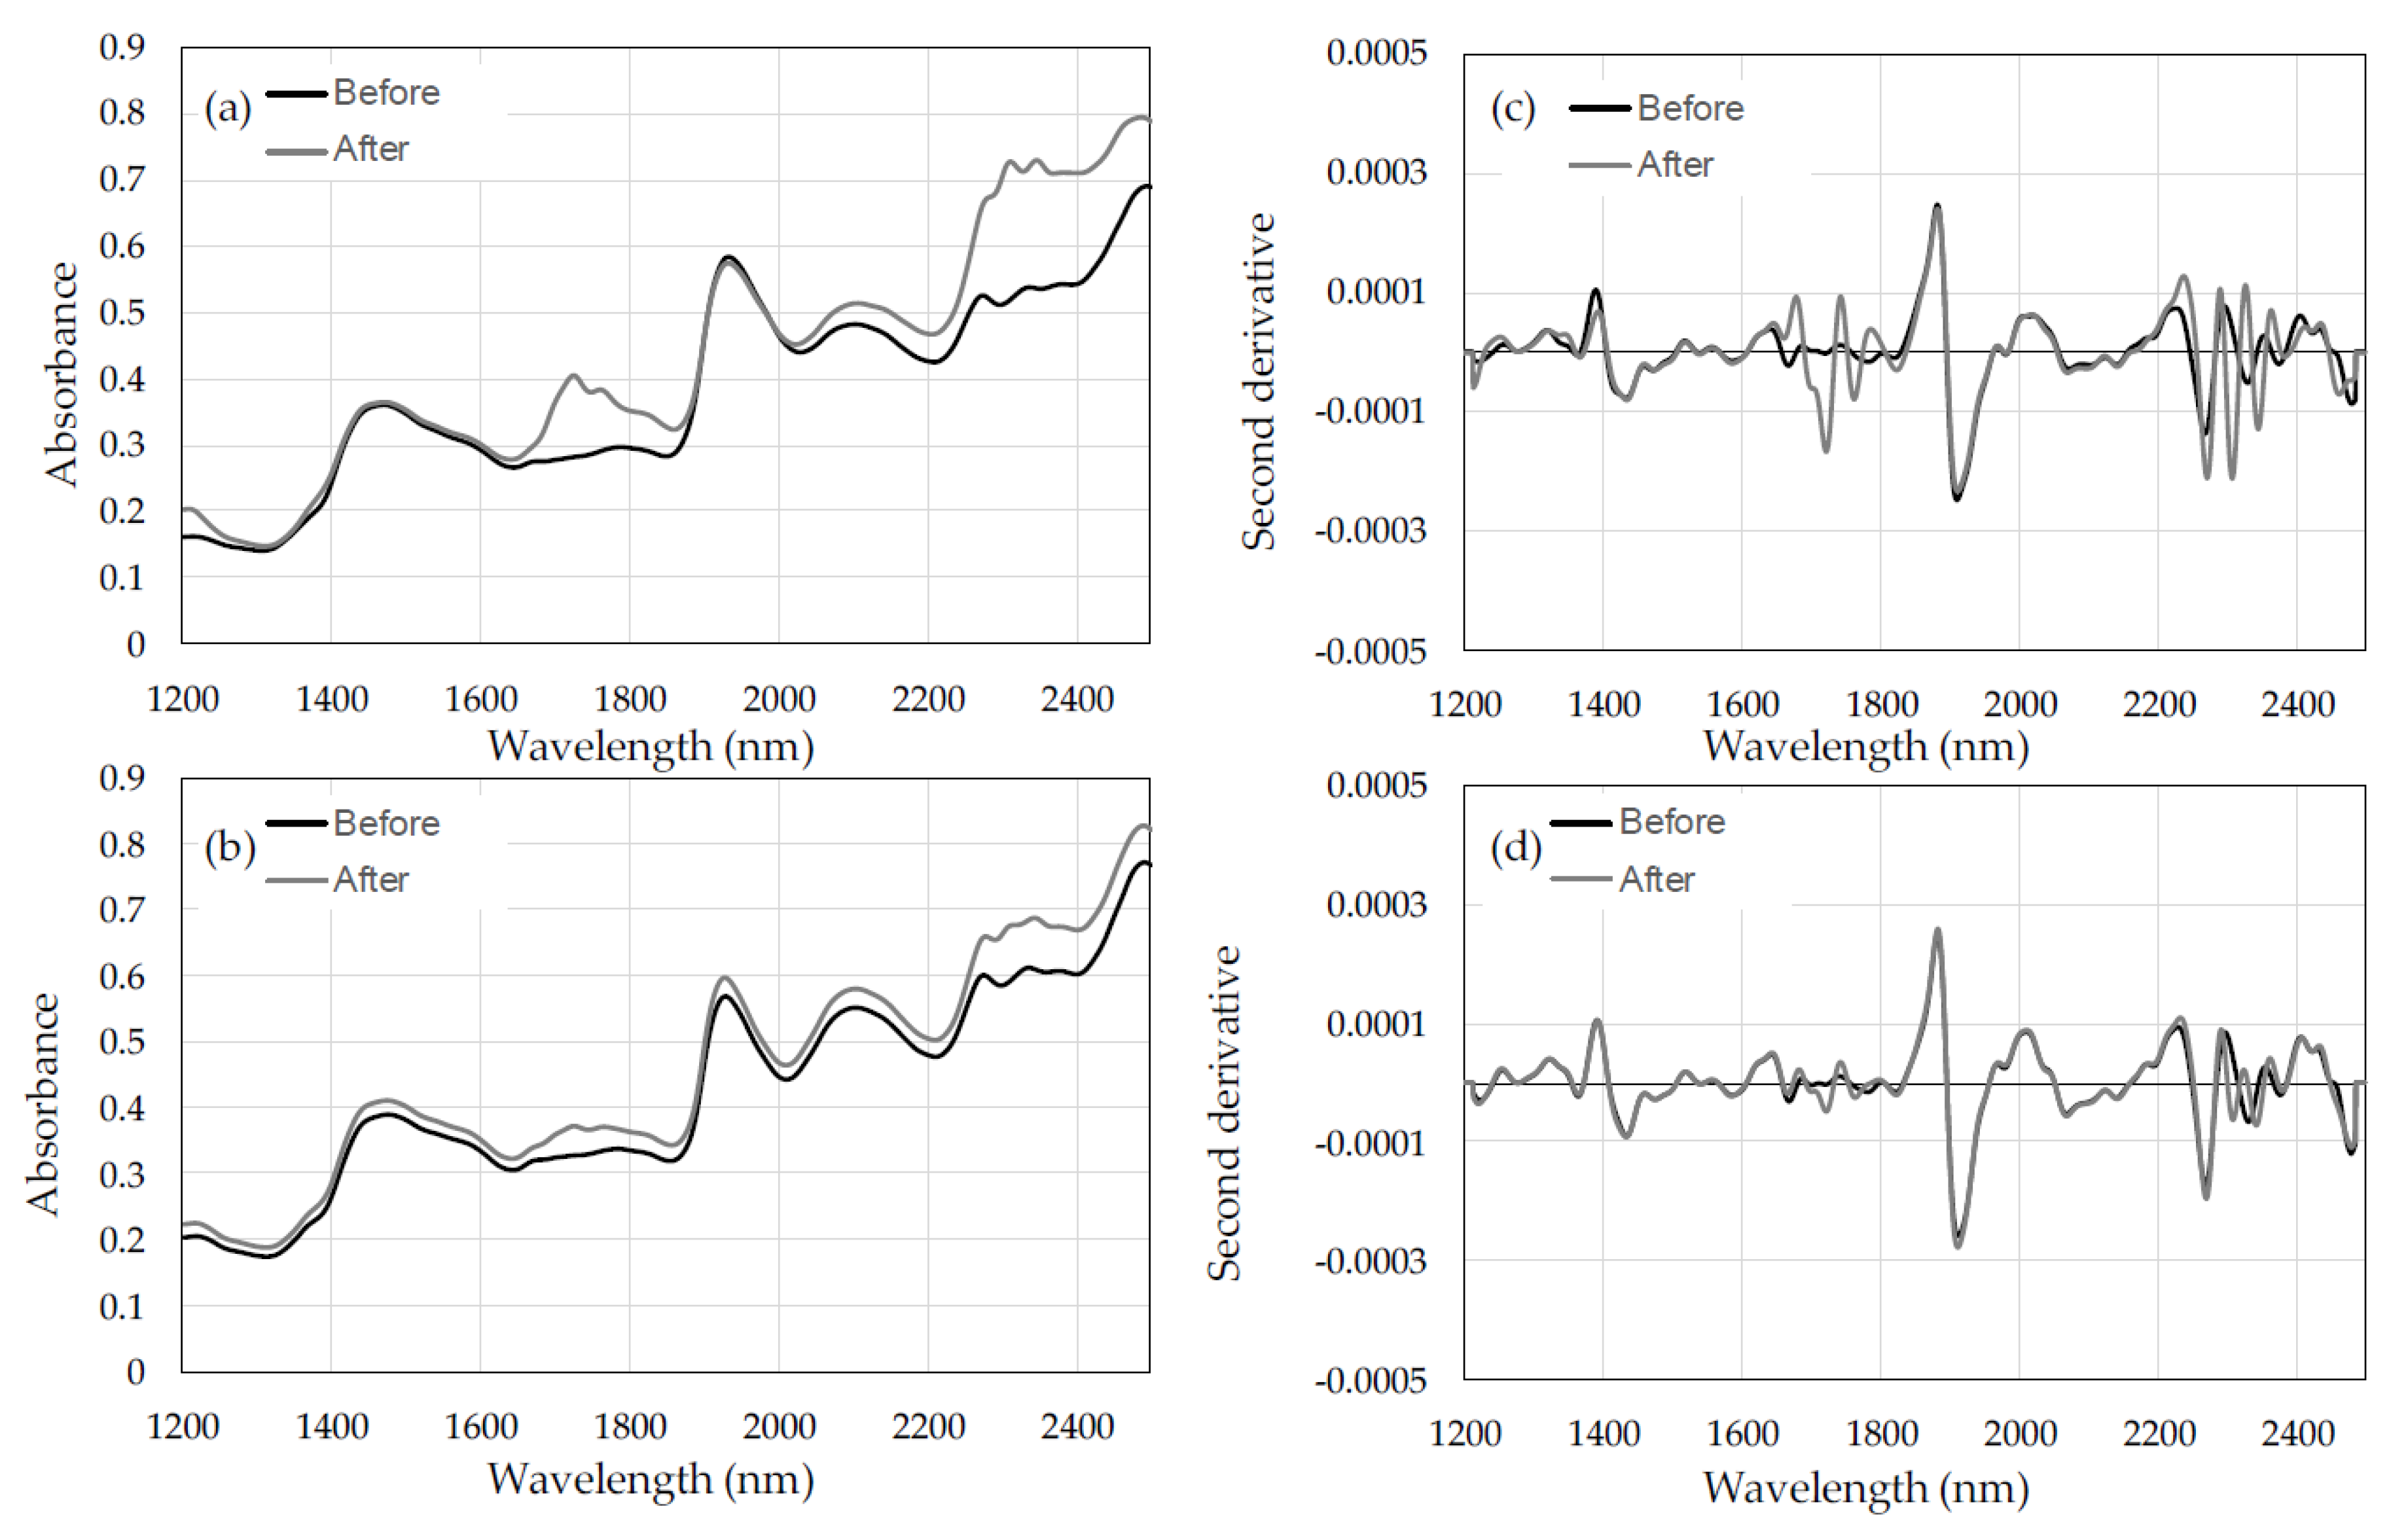
Figure 2 plots NIR spectra of Cryptomeria japonica (a,c) and Chamaecyparis obtusa (b,d) obtained from flat grain regions of the samples. Figure 2a,b are raw spectra, whereas Figure 2c,d are second derivative spectra obtained by pre-processing the raw spectra; the black lines represent the spectra collected before applying Oil_1, and the gray lines indicate the spectra collected after the application of Oil_1 to the surface of the wood. In Figure 2a,b, the spectral signal measured after the oil was applied is greater in the ranges 1700–1800 nm and 2300–2500 nm than that for the bare wood sample. Similarly, in Figure 2c,d, several peaks are observed in the pre-processed spectrum in the 1700–1800 nm and 2200–2400 nm regions. The 2240–2270 nm band can be assigned to C=O and C–O stretching combinations [18], and could be attributed to the oil.
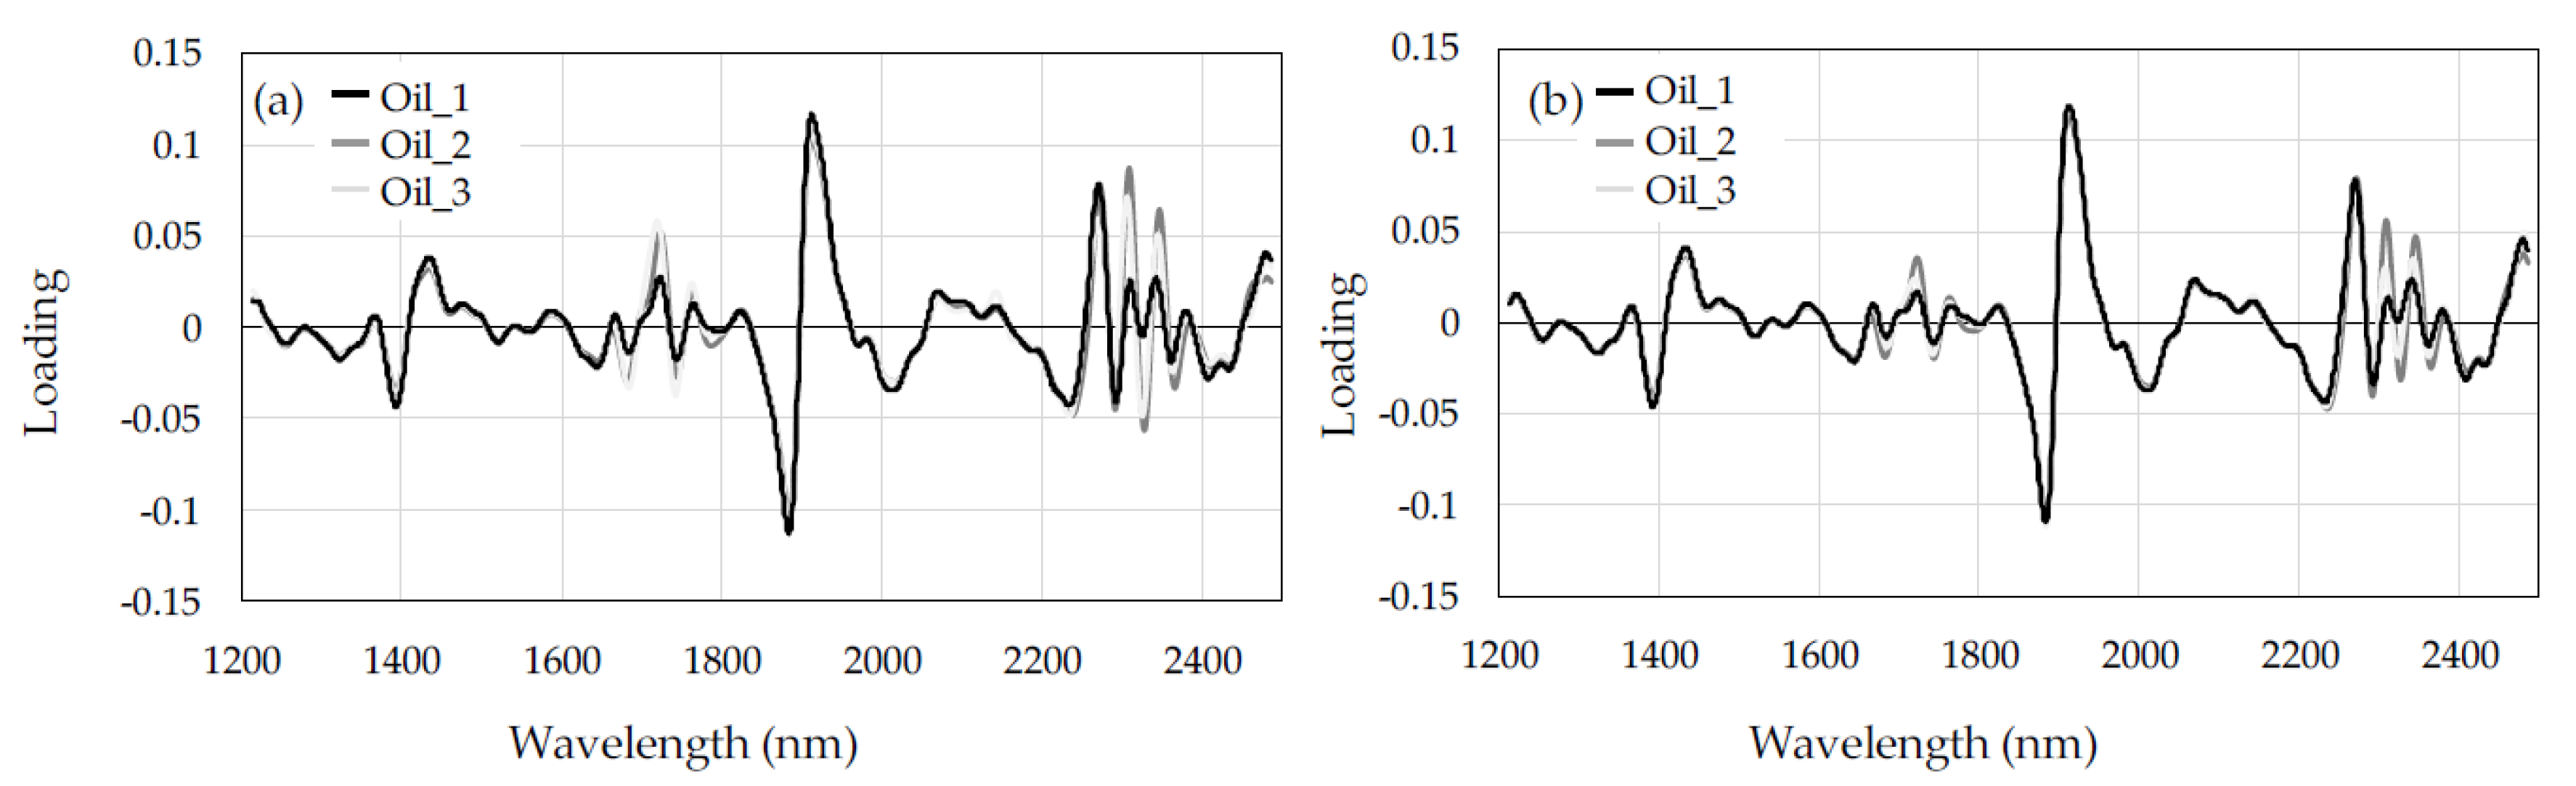
Figure 3 displays the loading plots for PC1 for each oil applied to (a) Cryptomeria japonica and (b) Chamaecyparis obtusa. Several peaks can be observed in the ranges of 1700–1800 nm and 2200–2400 nm, indicating oil absorption.
Table 2 summarizes the SIMCA classification results for the three oil samples (α = 0.05). “Correct classification” was uniquely allocated to one class belonging to itself. “Classified several categories” indicates belonging to more than one category including correct class. “Classified wrong category” indicates miscategorization in other classes [19]. In difference of wood species, the percentage of “classified no category” with Cryptomeria japonica was more than that of Chamaecyparis obtusa. It indicated that wood surface conditions were not changed before and after oil adhesion. In this study, wood density of Cryptomeria japonica (0.35 g/cm3) was less than that of Chamaecyparis obtuse (0.45 g/cm3). As the Cryptomeria japonica tended to be lighter than Chamaecyparis obtuse, its tendency was the same [20]. Less wood density had more pore volume [21]. As Cryptomeria japonica had more pore volume, oil might more fully penetrate the wood sample. The wood surface had less oil adhesion.
Good results were obtained for Oil_3 for both wood samples. However, the correct classification percentages were low for Oil_1, and the percentage of samples classified within several categories was high. For this reason, we focused on the model distance from SIMCA, which indicates whether the models are really different. If the model distance value is greater than 3, the models are significantly different; whereas, distance parameters in the range 1–3 suggest that the models overlap to some extent [19]. In Figure 4a,b we plot the model distances from SIMCA for each oil and tree sample. The distance parameter of the Oil_1 model was given a value of 1. There was little difference between Oil_1 and Oil_2 (Figure 4a), which explains the erroneous classifications. The chemical components of Oil_1 and Oil_2 may be similar because they are both mineral oils.
4. Conclusions
Nondestructive analysis is needed for wood surfaces and chemical vehicles such as antiseptic oils and insect deterrents to understand the wood surface workability. We focused on the distinction between the oils on the surface of the wood, as a preliminary study. It was demonstrated that NIR accurately detects the presence of three oils on wood samples. We used SIMCA classification analysis, which is often used with NIR spectroscopy and focuses on similarities within classes. In difference of wood species, the percentage of classified no category with Cryptomeria japonica was more than that of Chamaecyparis obtusa. It indicated that wood surface conditions were unchanged before and after oil adhesion. Oil adhesion affected wood surface conditions and wood pore. Good classifications were obtained for all oil samples via SIMCA. However, the correct classification percentages were slightly low for Oil_1, and the percentage of samples classified within several categories was high. From the model distance parameters, there was little difference between Oil_1 and Oil_2, which explains the erroneous classifications. In this study, relationship between wood surface condition and oil adhesion was not cleared. Further analyses that were used such as degree of viscosity applied or the oil propagation using time course measurement, were needed to elucidate the wood surface condition. However, if the components are very different, such as those for Oil_3, NIRS can be a powerful non-destructive method for identifying the oil.
Author Contributions
Conceptualization, Y.K.; methodology, Y.K.; software, N.O. and Y.K.; validation, Y.K.; formal analysis, Y.K.; investigation, N.I., N.O. and Y.K.; resources, N.I., N.O. and Y.K.; data curation, N.I., N.O. and Y.K.; writing—review & editing, Y.K.; visualization, N.O. and Y.K.; supervision, Y.K.; project administration, Y.K.; funding acquisition, Y.K.
Funding
This research was funded by Nihon University individual research funding.
Conflicts of Interest
The authors declare no conflict of interest.
References
- Japan Ministry of Agriculture, Forestry and Fisheries. Annual Report on Forest and Forestry in Japan Fiscal Year 2017. Available online: http://www.rinya.maff.go.jp/j/kikaku/hakusyo/29hakusyo/attach/pdf/sankou-3.pdf (accessed on 5 November 2018).
- Japan Ministry of Land, Infrastructure, Transport and Tourism. Building Starts 2017. Available online: https://www.e-stat.go.jp/en/stat-search/files?page=1&toukei=00600120&tstat=000001016965 (accessed on 5 November 2018).
- Kojima, Y.; Adachi, K. Establishment of evaluation method for durability of wood-based materials breakthroughs and future development. Mokuzai Gakkaishi 2015, 61, 178–185. [Google Scholar] [CrossRef]
- Teranishi, H.; Kato, S.; Shimizu, M. Overlaying by diallyl phthalate resin impregnated paper. Mokuzai Gakkaishi 1969, 18, 892–898. [Google Scholar] [CrossRef]
- Cozzolino, D.; Murray, I.; Chree, A.; Scife, J.R. Multivariate determination of free fatty acids and moisture in fish oils by partial least-squares regression and near-infrared spectroscopy. LWT Food Sci. Technol. 2005, 38, 821–828. [Google Scholar] [CrossRef]
- Woodcock, T.; Fagan, C.C.; O’Donnell, C.P.; Downey, G. Application of near and mid-infrared spectroscopy to determine cheese quality and authenticity. Food Bioprocess Technol. 2008, 1, 117–129. [Google Scholar] [CrossRef]
- Segtnan, V.H.; Sasic, S.; Isaksson, T.; Ozaki, Y. Studies on the structure of water using two-dimensional near-infrared correlation spectroscopy and principal component analysis. Anal. Chem. 2001, 73, 3153–3161. [Google Scholar] [CrossRef] [PubMed]
- Schwanninger, M.; Rodrigues, J.C.; Fackler, K. A review of band assignments in near infrared spectra of wood and wood components. J. Near Infrared Spectrosc. 2011, 19, 287–308. [Google Scholar] [CrossRef]
- Fujimoto, T.; Kurata, Y.; Matsumoto, K.; Tsuchikawa, S. Feasibility of near infrared spectroscopy for on line grading of sawn lumber. Appl. Spectrosc. 2010, 64, 92–99. [Google Scholar] [CrossRef] [PubMed]
- Schimleck, L.R.; Matos JL, M.; Trianoski, R.; Prata, J.G. Comparison of methods for estimating mechanical properties of wood by NIR spectroscopy. J. Spectrosc. 2018, 10. [Google Scholar] [CrossRef]
- Kurata, Y. Accuracy of predicting the moisture content of three types of wood sections using near infrared spectroscopy. Bioresources 2018, 13, 8444–8454. [Google Scholar] [CrossRef]
- Heraud, P.; Wood, B.R.; Beardall, J.; McNaughton, D. Effects of pre-processing of Raman spectra on in vivo classification of nutrient status of microalgal cells. J. Chemom. 2006, 20, 193–197. [Google Scholar] [CrossRef]
- Meza-Marquez, O.G.; Gallardo-Velazquez, T.; Osorio-Revilla, G. Application of mid-infrared spectroscopy with multivariate analysis and soft independent modeling of class analogies (SIMCA) for the detection of adulterants in minced beef. Meat Sci. 2010, 86, 511–519. [Google Scholar] [CrossRef] [PubMed]
- Dunn, W.J., III; Wold, S. Relationships between chemical structure and biological activity modeled by SIMCA pattern recognition. Bioorg. Chem. 1980, 9, 505–523. [Google Scholar] [CrossRef]
- Tominaga, Y. Comparative study of class data analysis with PCA-LDA, SIMCA, PLS, ANNs, and k-NN. Chemom. Intell. Lab. Syst. 1999, 49, 105–115. [Google Scholar] [CrossRef]
- Candolfi, A.; Maesschalck, R.D.; Massartm, D.L.; Harrington, A.C.E. Identification of pharmaceutical excipients using NIR spectroscopy and SIMCA. J. Pharm. Biomed. Anal. 1999, 19, 923–935. [Google Scholar] [CrossRef]
- Kurata, Y. Nondestructive classification analysis of wood soaked in seawater by using near-infrared spectroscopy. For. Prod. J. 2015, 67, 63–68. [Google Scholar] [CrossRef]
- Fernanda Pimentel, M.; Ribeiro, G.M.G.S.; da Cruz, R.S.; Stragevitch, L.; Pacheco Filho, J.G.A.; Teixeira, L.S.G. Determination of biodiesel content when blended with mineral diesel fuel using infrared spectroscopy and multivariate calibration. Microchem. J. 2006, 82, 201–206. [Google Scholar] [CrossRef]
- Esbensen, K.H. Multivariate Data Analysis—In Practice, 5th ed.; Camo Software: Oslo, Norway, 2010; ISBN-10 8299333032. [Google Scholar]
- Ido, H.; Nagao, H.; Kato, H. Evaluation of the shear strength of lumber by different test methods. Mokuzaigakkaishi 2006, 52, 293–302. [Google Scholar] [CrossRef]
- Keylwerth, R. Investigations on free and restraint swelling of wood. Part IV: Investigations on the course of swelling and the dependence of wood density on moisture. Holz Als Roh-Werkstoff 1964, 22, 255–258. [Google Scholar] [CrossRef]
Figure 1.
Outline of measurement device.

Figure 2.
NIR spectra of Cryptomeria japonica (a,c) and Chamaecyparis obtusa (b,d) flat grain samples. (a,b) are raw spectra, and (c,d) are pre-processed spectra. Black lines indicate the spectra collected before applying Oil_1, and the gray lines indicate those obtained after applying Oil_1 to the surfaces of the wood samples.

Figure 3.
PC1 loading plots for oil-treated (a) Cryptomeria japonica and (b) Chamaecyparis obtusa.

Figure 4.
Model distance plot for the three oils on the wood samples: (a) Cryptomeria japonica; (b) Chamaecyparis obtusa.
Figure 4.
Model distance plot for the three oils on the wood samples: (a) Cryptomeria japonica; (b) Chamaecyparis obtusa.


Table 1.
Oils used in this study.
| Name | Usage | Flammable point (°C) |
|---|---|---|
| Oil_1 | antiseptic vehicle or cutting oil | 70–200 |
| Oil_2 | motor oil for oil pressure machine | 200–250 |
| Oil_3 | plant oil | 200–250 |
Table 2.
Classification results of soft independent modeling of class analogy (SIMCA) with three oil samples (α = 0.05).
Table 2.
Classification results of soft independent modeling of class analogy (SIMCA) with three oil samples (α = 0.05).
| Wood Species | Sample Name | No. in Test Set 1 | Correct Classification (%) | Classified Several Categories (%) | Classified Wrong Category (%) | Classified No Category (%) |
|---|---|---|---|---|---|---|
| Cryptomeria japonica | Oil_1 | 10 | 0 | 90 | 0 | 10 |
| Oil_2 | 10 | 80 | 10 | 0 | 10 | |
| Oil_3 | 10 | 80 | 0 | 0 | 20 | |
| Chamaecyparis obtusa | Oil_1 | 10 | 0 | 90 | 0 | 10 |
| Oil_2 | 10 | 70 | 30 | 0 | 0 | |
| Oil_3 | 10 | 100 | 0 | 0 | 0 |
1 No.: number.
© 2019 by the authors. Licensee MDPI, Basel, Switzerland. This article is an open access article distributed under the terms and conditions of the Creative Commons Attribution (CC BY) license (http://creativecommons.org/licenses/by/4.0/).
Share and Cite
MDPI and ACS Style
Ito, N.; Okubo, N.; Kurata, Y. Nondestructive Near-Infrared Spectroscopic Analysis of Oils on Wood Surfaces. Forests 2019, 10, 64. https://doi.org/10.3390/f10010064
AMA Style
Ito N, Okubo N, Kurata Y. Nondestructive Near-Infrared Spectroscopic Analysis of Oils on Wood Surfaces. Forests. 2019; 10(1):64. https://doi.org/10.3390/f10010064
Chicago/Turabian StyleIto, Noboru, Naoya Okubo, and Yohei Kurata. 2019. "Nondestructive Near-Infrared Spectroscopic Analysis of Oils on Wood Surfaces" Forests 10, no. 1: 64. https://doi.org/10.3390/f10010064
Note that from the first issue of 2016, this journal uses article numbers instead of page numbers. See further details here.