Article

Response to Temperature and Virulence Assessment of Fusarium circinatum Isolates in the Context of Climate Change

1
School of Forest Resources and Conservation, University of Florida, 1745 McCarty Drive, Gainesville, FL 32611, USA
2
USDA Forest Service, Resistance Screening Center, 1579 Brevard Road, Asheville, NC 28805, USA
3
USDA Forest Service, Southern Institute of Forest Genetics, Southern Research Station, Saucier, MS 39574, USA
*
Author to whom correspondence should be addressed.
Forests 2019, 10(1), 40; https://doi.org/10.3390/f10010040
Submission received: 7 December 2018 / Revised: 3 January 2019 / Accepted: 4 January 2019 / Published: 9 January 2019
(This article belongs to the Section Forest Ecology and Management)

Abstract

:
With future global temperatures predicted to increase, the relationship between a host, pathogen, and environment, becomes less predictable and epidemics may pose a greater risk to forests worldwide. Resistance breeding is an important disease management tool, but because tree species require long breeding times, it is necessary to develop techniques for testing current pathogen isolates against their hosts. Pitch canker disease of pines, caused by the pathogen Fusarium circinatum, is no exception and represents a threat to pine forests and commercial plantations worldwide, as it thrives at warm temperatures and high humidity. We tested growth of 15 F. circinatum isolates in culture at three temperatures: 25, 27, and 31 °C. We also evaluated the sporulation and pathogenicity of eight of the isolates on two susceptible Pinus elliotti (slash pine) open-pollinated families and one tolerant open-pollinated Pinus taeda (loblolly pine) family. Our results showed significant differences among isolates in the temperature and pathogenicity tests. All isolates showed a significant decrease in growth at 31 °C, although some showed similar growth at 25 and 27 °C. Several of the new isolates tested were more pathogenic than the isolates that the USDA Forest Service Resistance Screening Center (RSC) had been using. The new isolates have now been incorporated into their operational screening program.

1. Introduction

Pitch canker, caused by the necrotrophic fungus Fusarium circinatum Nirenberg and O’Donnell, is one of the major diseases of pines, affecting 57 pine species [1,2,3], but Douglas-fir (Pseudotsuga menziesii) is also susceptible [4]. It causes resinous lesions in stems and branches and affects reproductive structures [5], thereby reducing fertility [1]. Its economic impact can be devastating in nursery settings, where it causes seedling mortality. In older trees, economic losses are mainly due to the effects of the disease on growth and timber volume, and in more severe cases, mortality due to girdling [3]. The disease was first reported in 1946 [6,7], and is mainly considered a disease of pines in the southeastern United States [2], although it is considered to have originated in Mexico and Central America [5]. More recently, pitch canker has been spreading globally through the introduction and culture of southern pines for timber [8,9,10,11,12,13,14,15]. Both the pathogen and the host are easy to grow under controlled conditions, facilitating experimental work to test for response under diverse environments. Also, both pathogen and some of hosts have whole-genome drafts available [16,17,18] that would facilitate future projects designed to understand host–pathogen interactions at the genomic and molecular level.
Due to the wide-scale planting of southern pines and their economic importance, there is an urgent need to understand, not only the genetics and host–pathogen interactions, but also interactions with the environment in order to develop practical strategies for the management of pitch canker and other diseases. Resistance to pitch canker is quantitative and heritable [19,20]; therefore, commonly used management strategies involve breeding and deployment of resistant host material. With future global temperatures predicted to increase [21,22,23], new climate variations and extreme weather events are predicted to increase [24,25,26,27,28], which may lead to increased disease incidence [29] and compromise the host’s defense response [30,31,32,33]. These changes in environment may also alter the relationships between host, pathogen and environment [34]. This disruption may also change the geographical distribution of pathogens, bringing them into areas where they are currently absent. In the future, a larger number of outbreaks and possible pathogenic variants may be expected as new environmental conditions resulting from climate change may favor survival and fitness of some pathogens. In contrast, plant disease management strategies under new climate conditions are lagging [35].
The USDA Forest Service Resistance Screening Center (RSC) in Asheville, North Carolina has been screening seedlings of pine and other forest tree species for genetically-controlled resistance or tolerance to diseases like pitch canker, fusiform rust, dogwood anthracnose, chestnut blight, white pine blister rust brown spot needle blight, and butternut canker [36]. The RSC has screened plant material for over 20 industrial, governmental, non-profit, and academic institutions. By performing artificial inoculations in a controlled environment on an operational scale, seedlings and varietals are tested for resistance to diseases, families are compared for relative resistance, and new hypotheses related to forest genetics and pathology are tested. In the case of pitch canker, thousands of loblolly, slash, as well as pine species from Mexican and Central American sources have been screened for resistance at the RSC. Protocols used today were developed in the 1980s, based on studies done by Dr. George Blakeslee of the University of Florida and Dr. Steve Oak of the US Forest Service Forest Health Protection program [37]. At that time, a limited number of F. circinatum isolates were collected from a small geographic area and used in the initial development of the RSC screening procedure. Standard tests are performed using a mix of four to five F. circinatum isolates, and the isolates used have continued to be the ones initially collected in the 1980s. Collection and renewal of these fungal isolates has not been as frequent as with other diseases, such as fusiform rust (new aeciospore collections are made at least every five years).
There is a critical need to better understand host–pathogen systems and to validate current prediction models [38]. F. circinatum outbreaks are favored by warm climate and high humidity [5,39], therefore, it is likely to thrive under predicted environmental conditions under changing climate scenarios. Pathogenicity tests of F. circinatum have been conducted in a variety of loblolly pine (P. taeda) genotypes [19,20], but these used a single fungal isolate. In more recent studies conducted using different Fusarium species, pathogenicity tests were conducted using multiple isolates on Polish provenances of Scots pine (Pinus sylvestris) [40]. In other recent pathogenicity tests, multiple Czech [41] and Romanian [42] conifer species were inoculated with the same F. circinatum isolate isolated from P. radiata in Northern Spain (FcCa6) [41,42]. On the pathogen site, fungal growth and sporulation experiments at a range of temperatures [43], also used a single F. circinatum isolate. Here we report the growth response of 15 different isolates from Florida and Georgia at three different temperatures, and the pathogenicity test results of eight of these isolates for pathogenicity on one loblolly (Pinus taeda) and two slash pine (Pinus elliottii) families, and discuss the observed differences in pathogenicity among isolates in pines.

2. Materials and Methods

2.1. Fusarium circinatum Isolates

Fusarium circinatum isolates from 13 Florida and Georgia counties were obtained from field samples of infected loblolly (Pinus taeda) or slash (Pinus elliottii) pine tissue or from previously dried mycelia stored at 4 °C (Figure 1). The isolates from fresh infected pine tissue were obtained by scraping chips from the borderline between infected and healthy host tissue. These chips were immersed in half-strength commercial sodium hypochlorite solution for 30 s under sterile conditions and excess moisture was drained before placing the chip on acidified potato dextrose agar (APDA) culture medium plates. The plates were placed at room temperature and mycelium growth was monitored between two to seven days. Mycelium was then transferred to a new APDA plate and grown at room temperature for seven days, after which the plates were flooded with sterile water and plated again to obtain single-spore isolates. The single-spore isolates were grown on sterile filter paper atop APDA medium for 8–10 days. After this time, filter papers were separated from the medium and cut into approximate 5 × 5 mm confetti squares under sterile conditions using sterilized scissors. The confetti were placed in sterile glass vials for long-term storage at 4 °C.

2.2. Temperature Growth Experiments

Temperature growth experiments were performed in the University of Florida Forest Pathology Laboratory in Gainesville, Florida. We tested 15 single-spore isolates in a split-split plot design, with three temperature treatments (25 °C, 28 °C, and 31 °C) in three incubators and three replicates. Mycelium from each of the single-spore cultures were transferred to APDA medium using the tip of a sterilized glass rod to ensure initial inoculum uniformity. Three plates per isolate were cultured at each temperature and the experiment was repeated three times, alternating incubators so that each temperature was tested in each incubator. Plates and a standard ruler for reference were photographed daily and measurements were done using the ImageJ (Version1.46) software (National Institutes of Health, Bethesda, MD, USA) [44]. Two measurements of the diameter across the mycelium growth were obtained in the x and y axes, passing through the center of the inoculation point. The average of these two diameter measurements was used as the response variable.
A subset of these cultures was further incubated for two weeks, after which each plate was flooded with 4 mL of sterile water and swirled to release microconidia. A volume of 50 µL was obtained directly from the culture and placed in a 1-mL tube with 450 µL of sterile water, for a 1:10 dilution. Samples were mixed and 10 µL were placed in a hemocytometer to obtain spore count. The remaining spore solution was incubated for 24 h at the same temperature as the initial culture. After this period, spore count and germination were obtained using a hemocytometer. The final concentration (spores/µL) was obtained by using the following formula:
Total spores/µL = Total spores counted × (dilution factor/# squares) × 10 cells/µL

2.3. Inoculation Experiments

The virulence study was conducted at the USDA Forest Service Resistance Screening Center (RSC) using three standard checklots. Approximately 10–20 confetti squares were sent to the RSC in Asheville, NC for inoculation experiments. Seed from one resistant loblolly pine open-pollinated family was stratified for six weeks, then sown along with seed from two susceptible slash pine open-pollinated families. Seedlings were inoculated at 10 weeks old, following the RSC guidelines [37]. Fungal cultures were established by placing the confetti on a selective Fusarium medium containing PCNB (pentachloronitrobenzene) and allowed to grow for two weeks. Cultures were then transferred to carnation leaf agar and allowed to grow for another two weeks. At the end of this period, cultures were flooded with distilled water to create spore suspensions for each isolate, and spore densities were determined using a hemocytometer. Spore densities were adjusted to 100,000 spores/mL. Three replicates of 20 seedlings each were inoculated with each of the eight isolates, totaling 60 trees per isolate per host family, for a total of 1440 trees. For the inoculation, seedlings were sterilized with 95% ethyl alcohol and allowed to air dry. Individual trays of 20 seedlings were top-clipped with sterile pruners, then immediately sprayed with the spore suspension. Between inoculations with each isolate, all tools were sterilized with 95% ethyl alcohol. The inoculated seedlings were kept in a greenhouse maintained between 17 °C and 30 °C, where they were watered three times a week. Survival and lesion length measurements were recorded 13 weeks after inoculation.

2.4. Statistical Analyses

For the temperature response experiments, statistical analyses were performed on data collected at the eighth day of culture. The following ANOVA model was used for this analysis:
Yijklm = µ + Inci + Rij + Tk + Il + T*Ikl + εijklm,
where, Yijklm is the response variable average diameter of mycelium culture measured in two perpendicular axes, of the lth isolate cultured at the kth temperature in the jth replicate within the ith incubator, µ is the overall mean, Incj is the fixed effect incubator (i = 1, 2, 3), Rij is the random effect of replicate within incubator ~ NID(0, σ2R) (i = 1, 2, 3), Tk is the fixed effect temperature (k = 25 °C, 28 °C, 31 °C), Il is the fixed effect isolate (k = 1, …, 15), T*Ikl is the fixed effect temperature by isolate interaction, and εijklm is the random error. This same model was used to analyze the results from the sporulation and germination experiments, with the response variables being number of microconidia per microliter and number of germinated microconidia per microliter, respectively.
For the pathogenicity effects, the following ANOVA model was used to determine whether there were significant effects of pathogenicity among isolates and host families:
Yijkl = µ + Ri + Ij + Fk + F*Ijk + εijkl,
where Yijkl is the response variable lesion length of the lth seedling from the kth host family of the ith replicate inoculated with the jth isolate, µ is the overall mean, Ri is the fixed effect replicate (i = 1, 2, 3), Ij is the fixed effect of the isolate (j = 1, …, 8), Fk is the fixed effect of host family (k = 1, 2, 3), F*Ijk is the host family by isolate interaction, and εijkl is the random error. All statistical analyses were performed using SAS software, version 9.3 (SAS Institute Inc., Cary, NC, USA, 2011).

3. Results

3.1. Isolates Showed Differential Responses to Temperature

An increase in temperature affected all isolates in mycelium growth, sporulation and spore germination. While the increase in temperature did not cause mortality of any isolate, it did cause a decrease in growth. After eight days in culture, significant fixed effects (p < 0.05) were observed for temperature, isolate, and temperature by isolate interactions but not for the effects of incubator (Table 1). These results indicate that significant temperature effects (p < 0.0001) on mycelial growth were observed within each isolate and that there were also significant differences among isolates (p < 0.0001) for a given temperature. Similarly, significant temperature by isolate interaction effects (p < 0.0001) suggest that, the isolates had different magnitudes of response at different temperatures. The same effects were significant (p < 0.05) for the 11 isolates tested for sporulation after 15 days in culture and spore germination after 24-h incubation (Table 1).
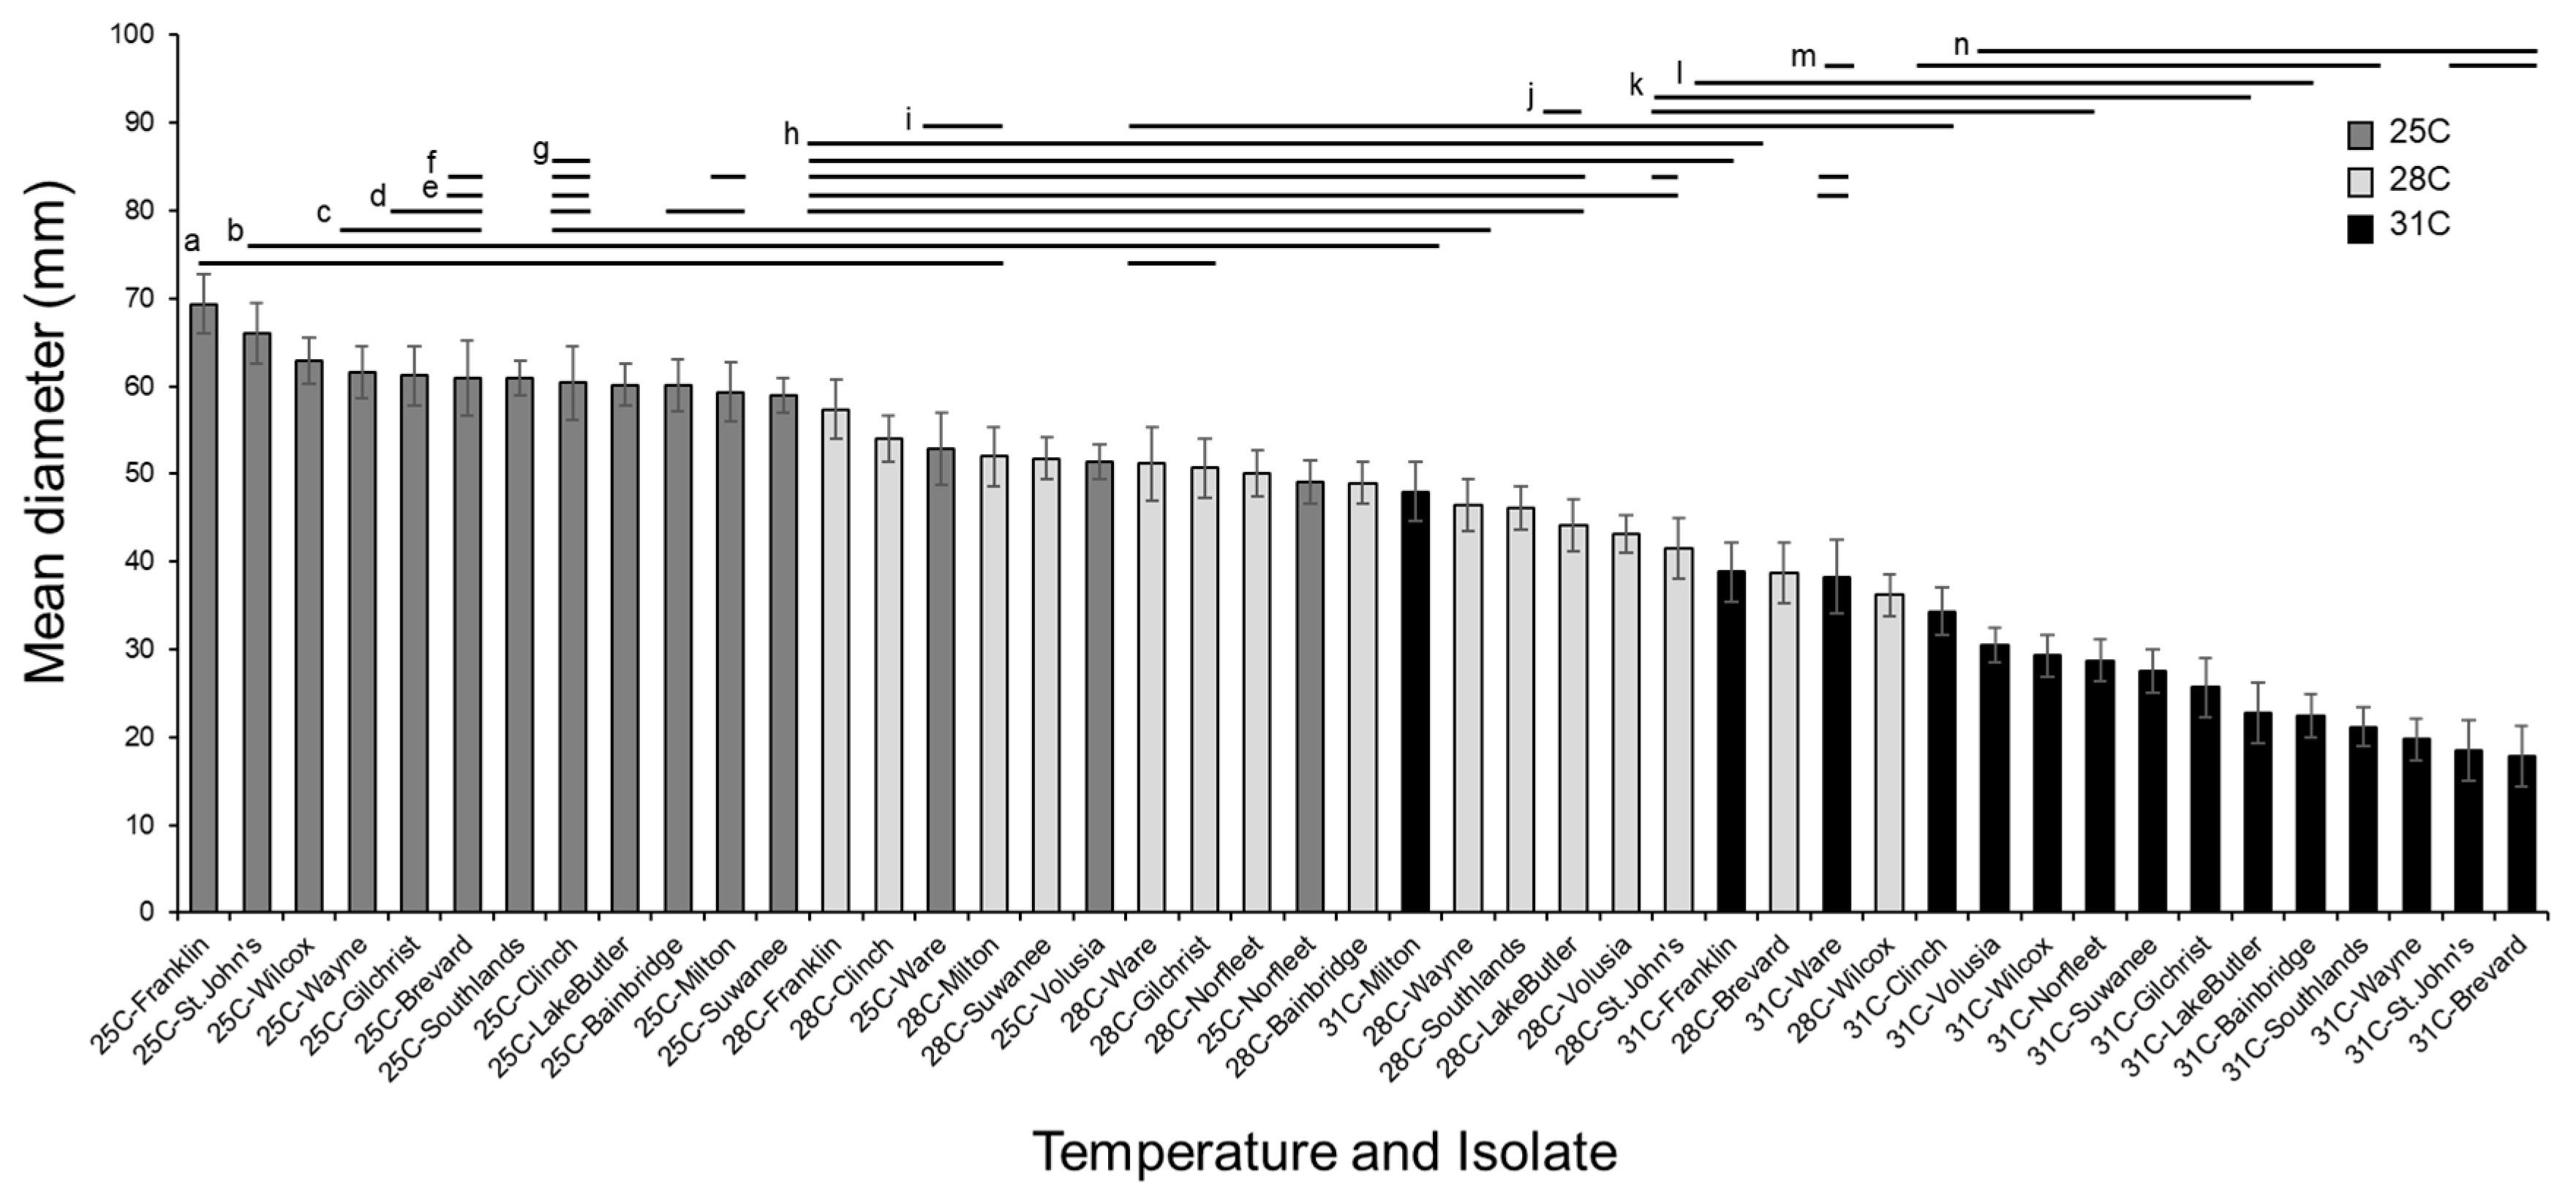
When daily data was included, all the isolates responded significantly (p < 0.01) to an increase in temperature, with reduced growth at higher temperatures. However, this response to temperature was not equal, as some isolates, such as Clinch, Norfleet, or Ware, showed no significant differences in growth between 25 °C and 28 °C, whereas Milton and Wilcox did not show differences between 28 °C and 31 °C. All other isolates showed significant differences among all temperatures (Figure 2).
Data also showed that some of the isolates seem to be more adapted to warmer temperatures whereas others are better adapted to lower temperatures. For example, isolates like Franklin and St. John’s had the highest growth at 25 °C but their growth decreased significantly when at higher temperatures. In addition, Franklin had the greatest growth among all isolates at each given temperature, suggesting that it may adapt better to changes in temperature, whereas St. John’s growth was greatly reduced at 28 °C and 31 °C, suggesting that while it grows well at lower temperatures, it is greatly affected by warmer conditions. In contrast, isolates like Milton and Ware didn’t have as high growth as others at 25 °C but had the highest growth at 31 °C (Figure 2 and Figure 3). These isolates are expected to grow better at higher temperatures.
When the data was sorted by growth diameter across all isolate–temperature combinations, isolates grown at 25 °C showed the greatest diameter, those grown at 28 °C were intermediate, and those grown at 31 °C showed the least diameter after eight days (Figure 3). Most isolates grown at 25 °C had a mean diameter between 60 and 70 mm; however, there were some exceptions like the isolates from Ware, Milton, Volusia, and Norfleet. These isolates showed a slower growth at 25 °C that is comparable to the growth of other isolates at 28 °C, averaging around 47 mm. Similarly, the isolate from Milton grown at 31 °C had a mean diameter of 48 mm, similar to the mean growth at 28 °C. The remaining isolates grown at 31 °C measured between 20 and 35 mm in diameter, with a mean of approximately 28 mm (Figure 3). Only three isolates grown at 31 °C had a diameter greater than 35 mm: Milton (48 mm), Ware (38.2 mm), and Franklin (38.8 mm). These isolates seem better adapted to higher temperatures.
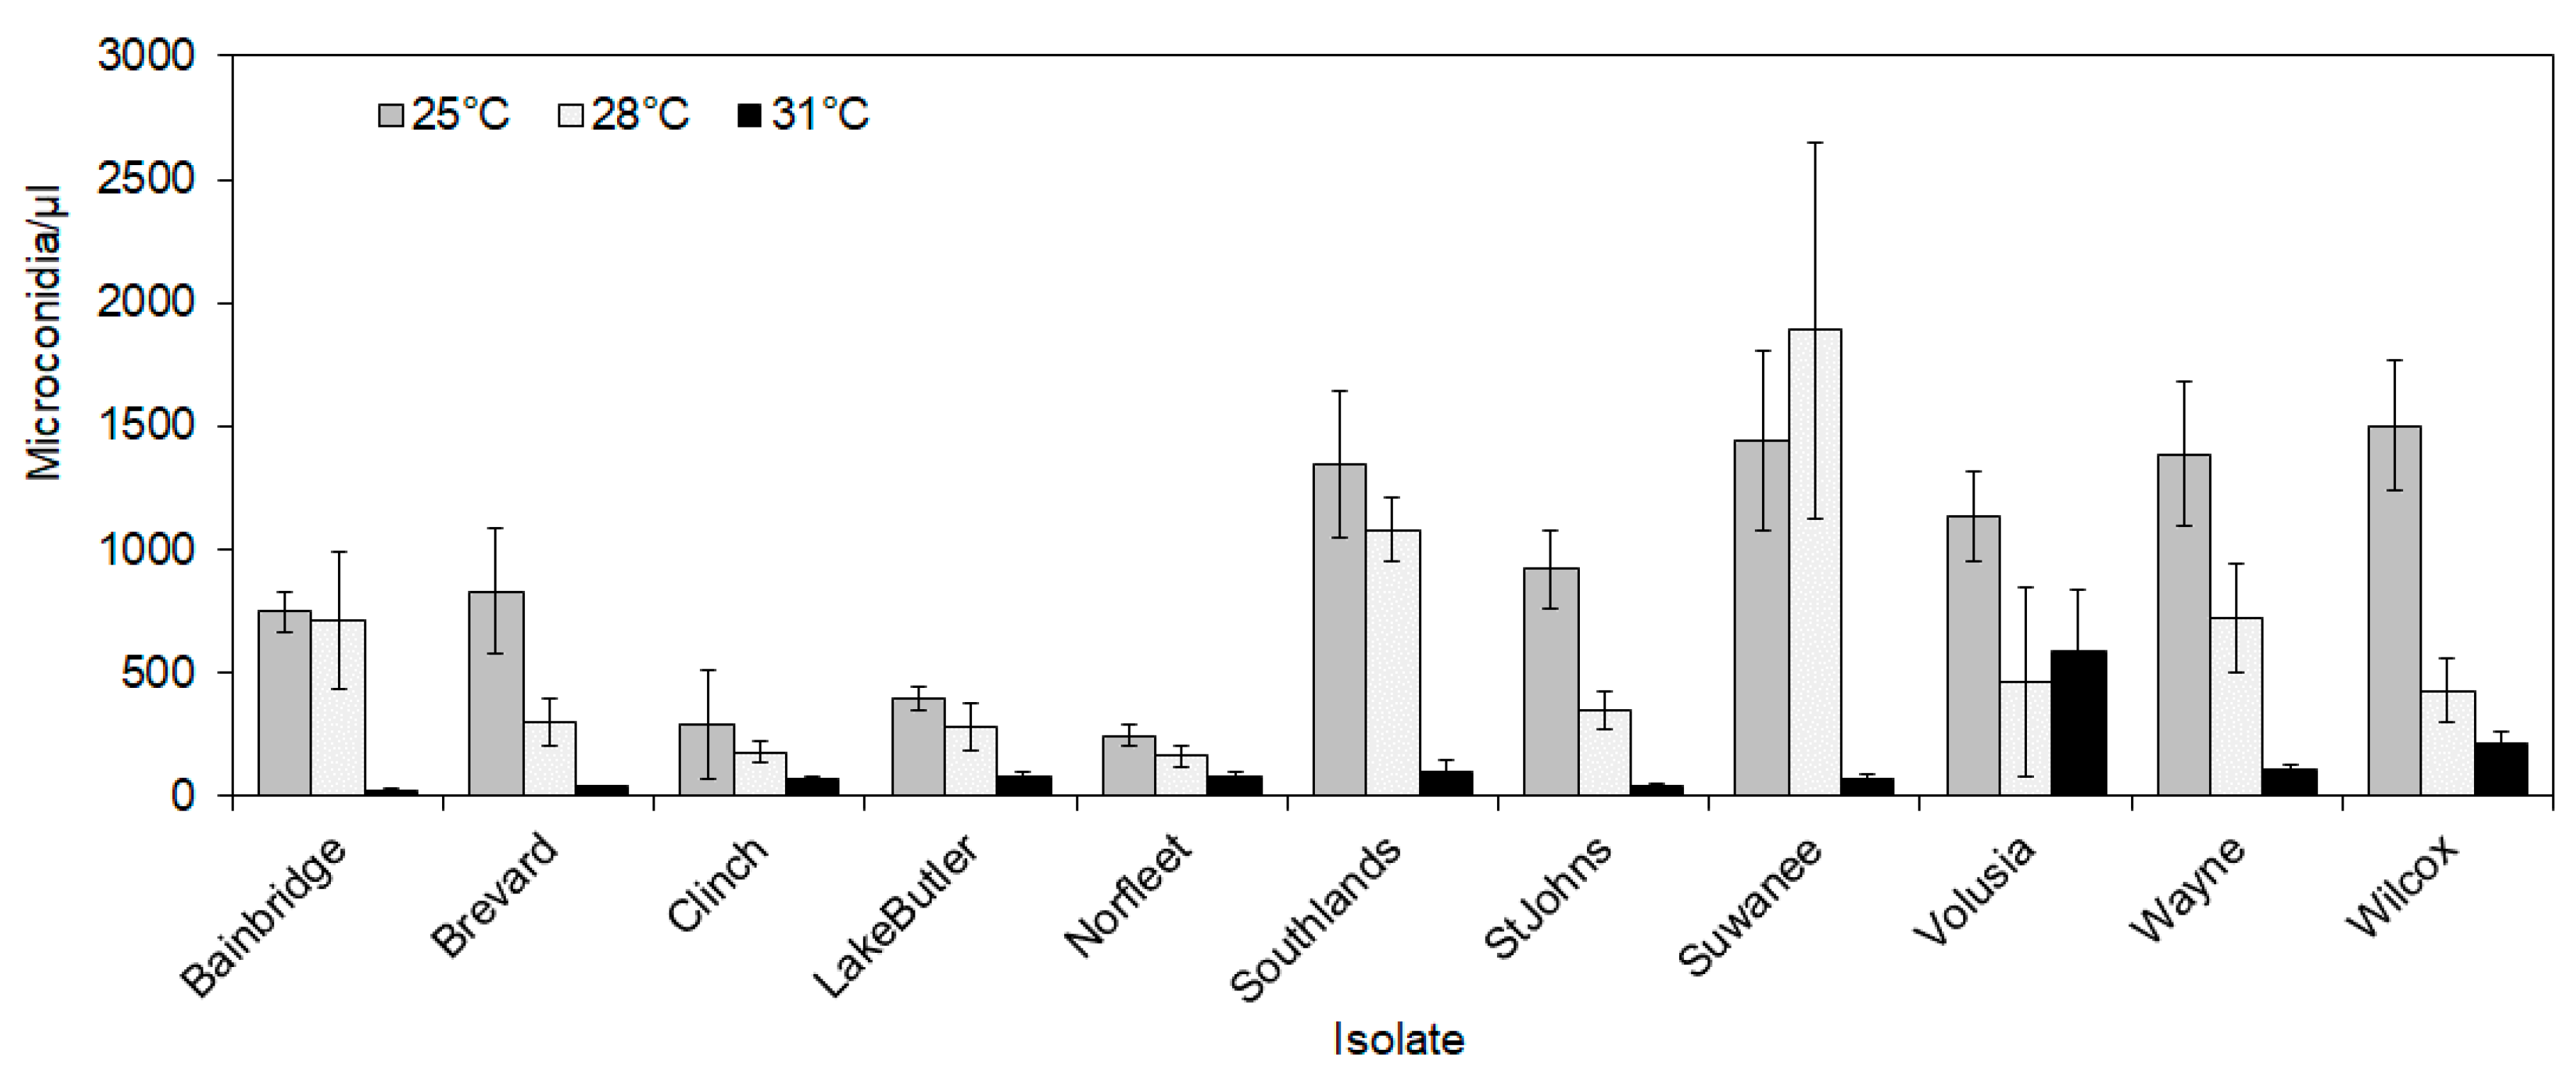
Sporulation at 25 °C, 28 °C, and 31 °C was evaluated for 11 of the 15 isolates. While variation was high, as shown by large standard errors (Figure 4), mean microconidia per microliter was highest at 25 °C for most isolates, except for Suwanee, which showed highest mean spore concentrations of around 2000 microconidia/μL at 28 °C, although this was not significantly different from those at 25 °C for that isolate. Like the trends in growth, sporulation at 31 °C had the lowest values for all isolates (Figure 4), whereas sporulation at 28 °C was intermediate.
Microconidia germination was very low, regardless of temperature, with most isolates showing under 50 germinated spores/uL, except for Southlands and Volusia (Figure 5). Unlike the growth and sporulation trends, germination was highest at 31 °C in seven of the 11 isolates. The Volusia isolate showed highest spore germination at 25 °C, followed by 28 °C and lowest at 31 °C, Southlands showed very low spore germination at 25 °C, but showed highest germination at 28 °C, followed by 31 °C, although the difference between these two temperatures was not statistically significant (p < 0.05). Finally, the isolates Bainbridge and Clinch showed similar mean microconidia germination at 25 °C and 31 °C, with Bainbridge showing similar values at 28 °C and Clinch with lower germination at 28 °C (Figure 5).

3.2. USDA Resistance Screening Tests Showed Differences in Virulence among Isolates

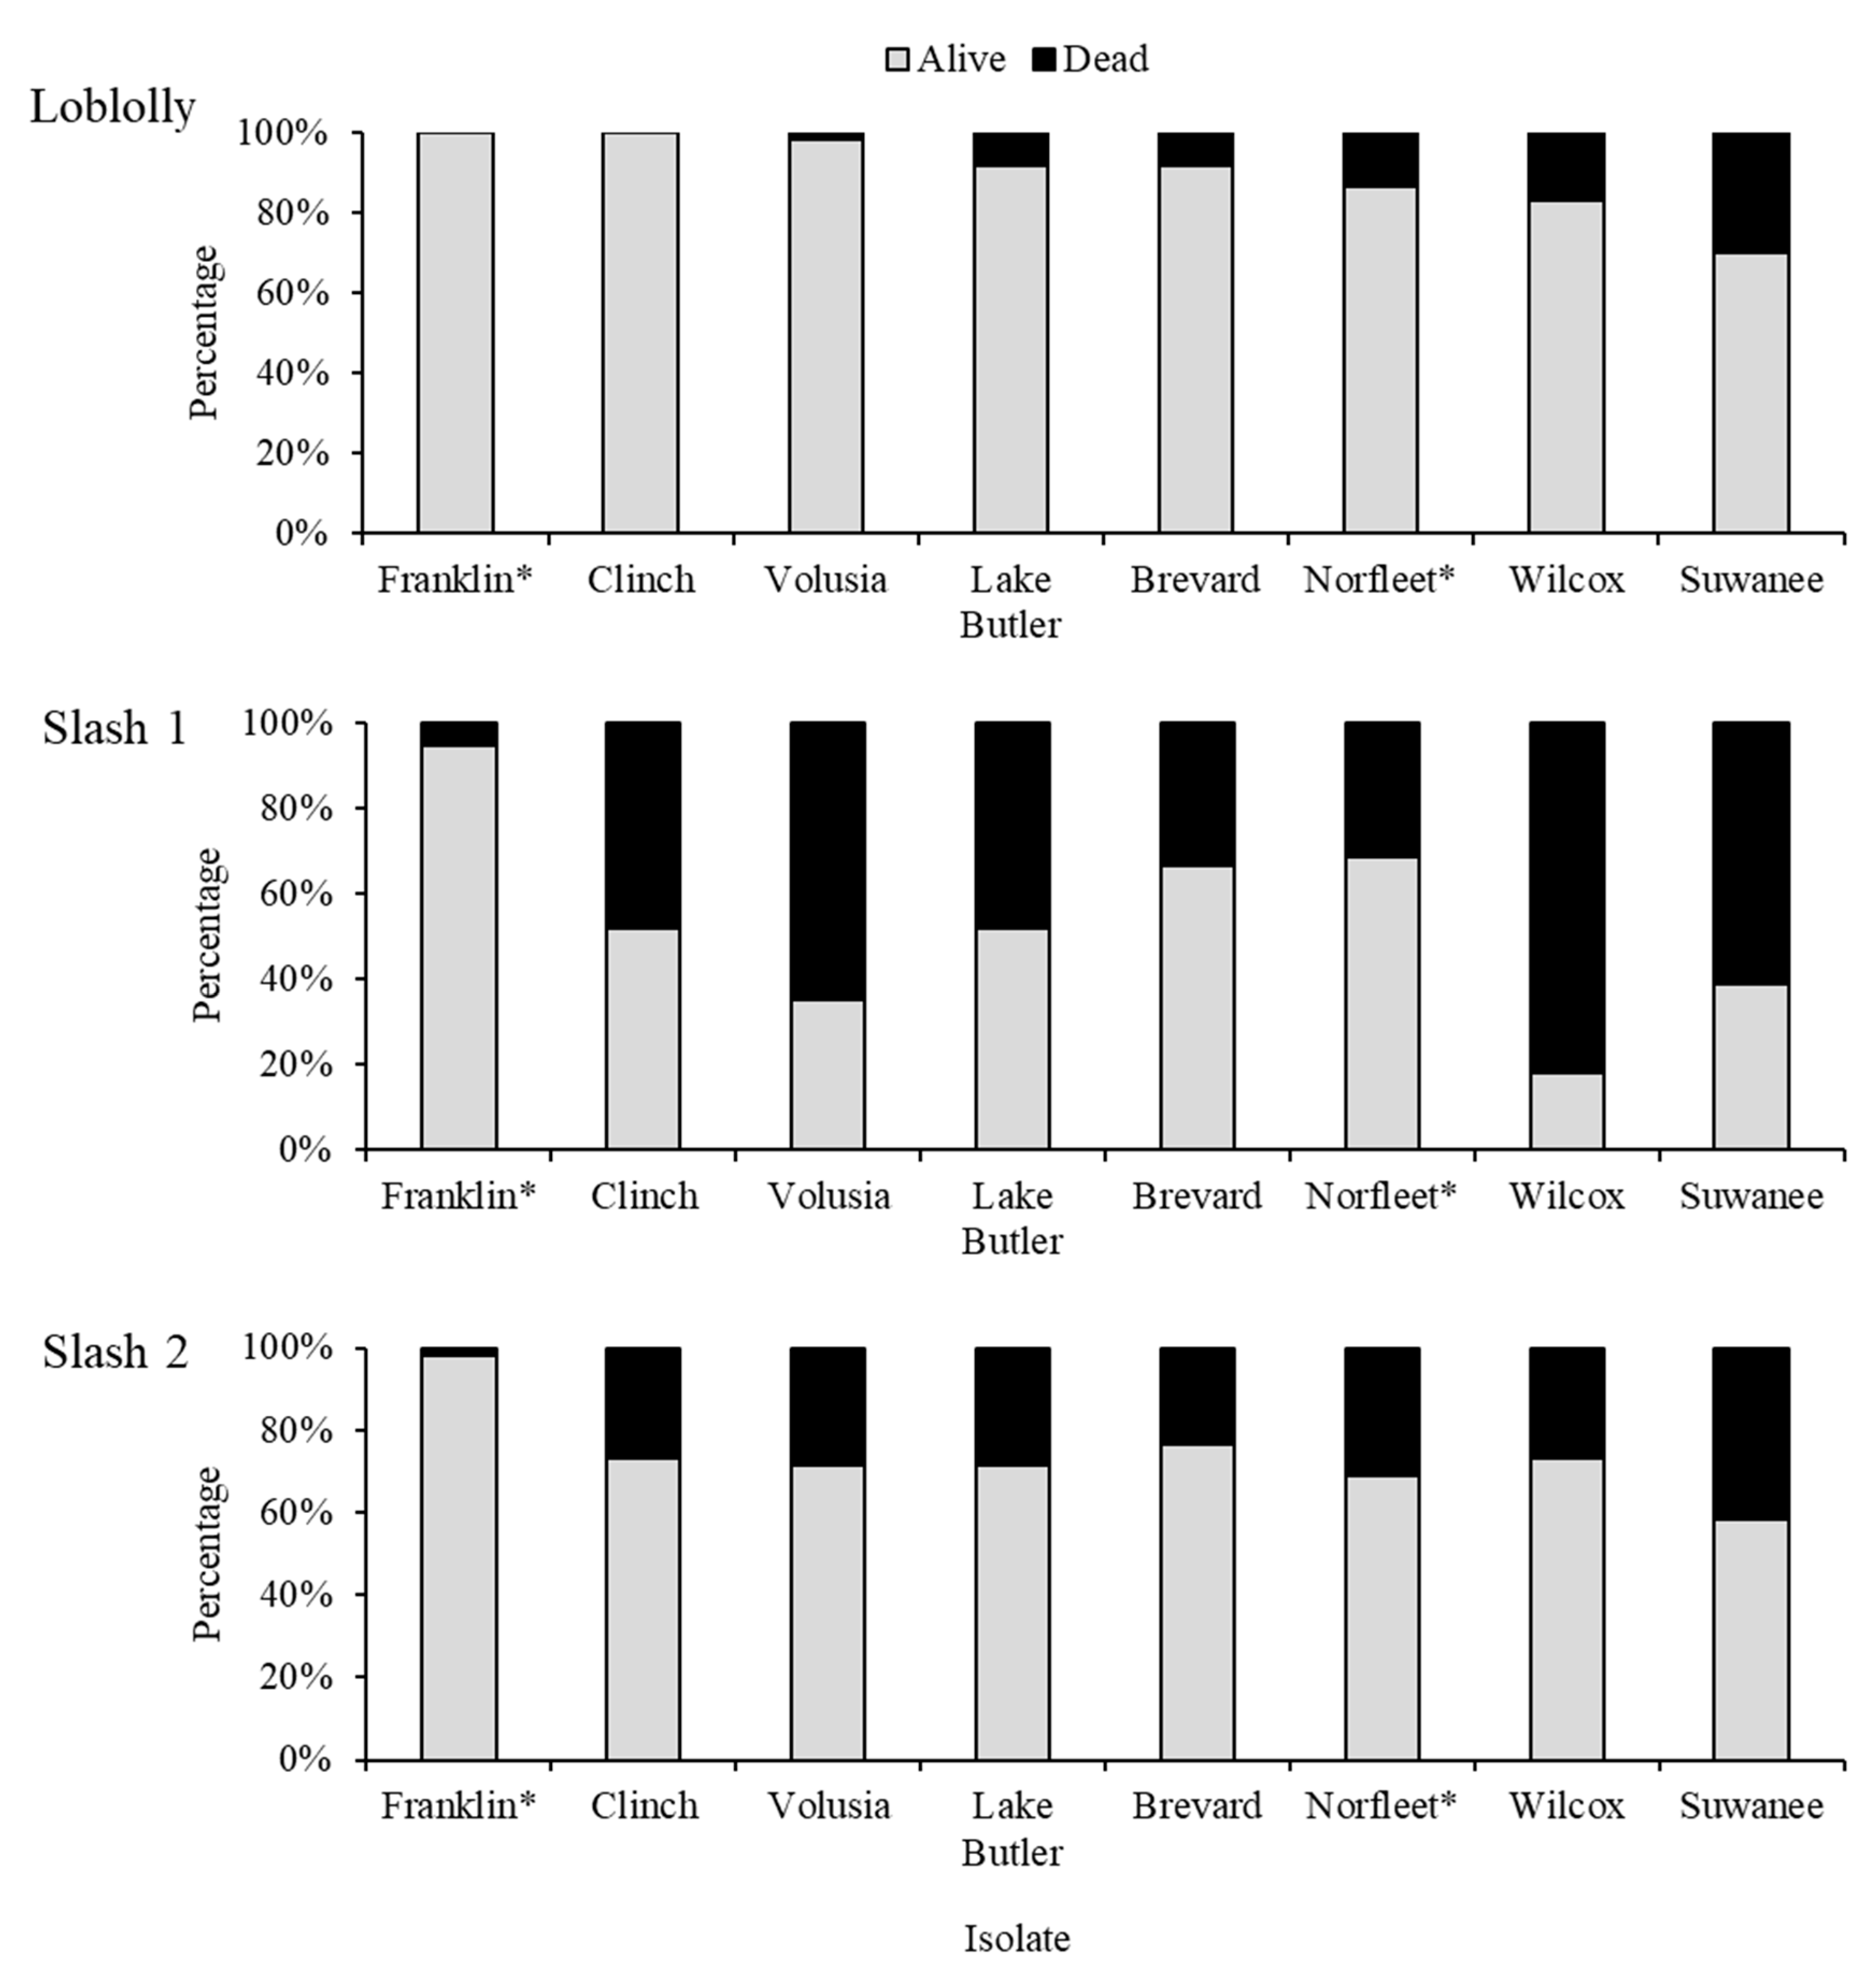
Eight isolates were tested for virulence at the USDA Resistance Screening Center in Asheville, North Carolina using the same protocols and susceptible and resistant check seedlots they include in all their routine screening tests. At 13 weeks after inoculation, the percentage of survival was high (above 80%) in all but one isolate for the resistant loblolly check (Figure 6). Isolates Franklin and Clinch did not cause any mortality in the resistant check (100% survival), whereas the Suwanee isolate caused over 30% mortality in this resistant family. In the susceptible slash checks, one family (Slash 1) was more susceptible than the other and showed survival as low as 20% in plants inoculated with the Wilcox isolate, and as high as 95% in plants inoculated with the Franklin isolate, with overall survival below 60% (Figure 6). The Slash 2 family showed nearly 100% survival when inoculated with the Franklin isolate but remained between 60% and 70% after inoculation with the other isolates, with the lowest survival observed in plants inoculated with the Suwanee isolate.
Aside from mortality, susceptibility to the pathogen was evaluated on the remaining live plants by measuring the lesion length at 13 weeks post-inoculation. Analysis of variance on the response variable lesion length showed significant differences between the fungal isolates, host half-sib families and isolate by family interactions (Table 2).
Lesion length means were lower in the resistant loblolly seedlings for all isolates, whereas these were significantly higher in both susceptible slash families (Figure 7). It was also observed that the Franklin isolate, aside from causing very low mortality (Figure 6), also had the lowest means for lesion length in all three families tested (Figure 7). It therefore suggests that this isolate is not very virulent or has lost its virulence across time. The Franklin and Norfleet isolates are two of the isolates that have been routinely used at the RSC over multiple years. More recently collected isolates, like Lake Butler, Wilcox and Suwanee, showed greater lesion lengths, even in the resistant seedlings. This suggests that these isolates are more virulent and that the loblolly family is not fully resistant to the pathogen, but rather more tolerant. These findings also suggest that including more recently collected fungal material in the operational screening program may be required to keep selection of resistant material current in breeding programs and ensure deployment of improved stock.

4. Discussion and Conclusions

Pitch canker disease affects many pine species and Douglas-fir [4,5]. As climate conditions continue to warm and temperatures and weather events become more extreme, it is important to understand the pathogen’s response to such changes in weather patterns. For example, climate change may cause shifts in the geographic distribution of the pathogen, allowing it to expand its range [45] or cause additional stress to host plants that could limit their resistance to pathogen infection [45,46]. We tested different isolates for growth at temperatures of 25, 28, and 31 °C and observed significant differences in growth within isolates at different temperatures, among isolates and in temperature x isolate interactions. Growth differences at a variety of temperatures have been previously found for F. circinatum, with the optimal temperature being 25 °C, which agrees with our findings [47]. In addition, our tests using fifteen isolates from Florida and Georgia, showed variability in growth response. While most isolates slowed down growth at 28 °C or higher, there were four isolates that did not show significant differences in growth at 25 °C compared to 28 °C (Figure 2). This might indicate that such isolates could be better adapted to increased temperatures and could become potentially important strains, as they may be likely to survive in a warmer environment.
Sporulation was highly variable among isolates and temperatures. In general, sporulation was highest at 25 °C for most isolates tested, whereas microconidia abundance was very low at 31 °C. Isolates that had spore counts over 1000 microconidia/µL at 28 °C were isolates that also showed greater growth at that temperature. This could be an indication of a better adaptability to higher temperatures, which could translate into better fitness in warmer climates. Spore germination after a 24-h incubation was extremely low but also highly variable for each isolate tested. While some isolates had better germination at 25 °C, others showed higher number of germinated microconidia at 28 or even at 31 °C. Experiments on spore survival under controlled temperatures have shown better survival of F. circinatum spores at 20 °C than at 30 °C [48]. While we did not test survival for long periods, isolates with higher germination at 28 °C or 31 °C could be better adapted to a warmer climate. Further studies are needed to test this hypothesis, but the diverse responses of the different isolates to temperature may reflect differential adaptation to warmer conditions.
Virulence tests on the three seedling families showed significant differences among isolate pathogenicity. Previous pathogenicity tests have involved a single isolate and multiple host species or genotypes from a same species [19,20,41,42] or different isolates on a same conifer species [40]. Here we tested the response to temperature of 15 isolates and performed pathogenicity tests on a subset of these using two host species. The two susceptible slash pine host families showed higher mortality and susceptibility, measured by lesion length, than the more resistant loblolly family. However, some isolates were highly virulent even in the loblolly hosts. The RSC has been performing operational-scale pitch canker disease screening to find genetic resistance in pine hosts since the 1980s [36]. Two of the isolates used in this study were isolates from the RSC that were routinely used for F. circinatum screening tests; however, these were not as virulent as some of the newer isolates. While it is known that long-term storage of fungal material for long periods can decrease virulence [49], one of the two RSC isolates showed similar mortality and virulence as other more recent isolates (Figure 7). These new isolates were obtained mainly from commercial plantations that were experiencing a recent outbreak, therefore, the observed increased virulence in the new isolates could be due to factors such as the appearance of new strains, better environmental adaptations of the pathogen, or other conditions in the stands from which these isolates were collected.
Although this study was limited by using isolates from Georgia and Florida, further testing should incorporate a broader variety of isolates from the entire geographic range of loblolly and slash pines, which includes 14 US States. Furthermore, expanding this study to encompass isolates affecting other pine species from within the United States, such as Pinus radiata [50,51] or P. muricata [52], as well as worldwide [8,10,40,41,42,53,54] could offer a more complete perspective on the effects of different environmental conditions and isolate diversity in fungal growth and virulence of F. circinatum. This study helped identify new isolates that have high virulence, even more so than those used by the RSC, and as a result, they are now included in the RSC tests. We recommend that periodic collection, testing, and renewal of F. circinatum isolates should be done as part of the RSC activities, with the help of the academic and industry groups that routinely benefit from its service.

Author Contributions

T.Q. and J.S. conceived and designed the experiments; T.Q. performed the culture experiments; S.L. performed the inoculation tests; K.S. and T.Q. measured the results of inoculations, T.Q. analyzed the data; J.S. and S.L. contributed reagents, material, and equipment for the experiments; T.Q. wrote the paper and all authors reviewed and proofread the drafts.

Funding

This research was funded by the University of Florida/Institute of Food and Agricultural Sciences Climate Change Seed Grant Program for 2016–2017, https://research.ifas.ufl.edu/climatechange/. Publication costs were covered by the University of Florida Forest Biology Research Cooperative, FBRC.

Acknowledgments

The authors would like to acknowledge that funding for this work was made available through the University of Florida/IFAS Climate Change Seed Grant Program. We also thank Alan Wilson, from Rayonier, Inc. and Paul Belonger from Weyerhaeuser Co. for providing plant material from which some isolates were obtained. Assistance on the experimental design and analysis was provided by Salvador Gezan, from the University of Florida. Finally, we appreciate the feedback from the two anonymous reviewers, whose suggestions and comments helped improve the quality of this manuscript.

Conflicts of Interest

The authors declare no conflict of interest.

References

  1. Dwinell, L.D.; Barrow-Broaddus, J.B.; Kuhlman, E.G. Pitch canker: A disease complex of southern pines. Plant Dis. 1985, 69, 270–276. [Google Scholar] [CrossRef]
  2. Blakesley, G.M.; Dwinell, L.D.; Anderson, R.L. Pitch Canker of Southern Pines: Identification and Management Considerations; USDA Forest Service: Washington, DC, USA, 1980. [Google Scholar]
  3. Wingfield, M.J.; Hammerbacher, A.; Ganley, R.J.; Steenkamp, E.T.; Gordon, T.R.; Wingfield, B.D.; Coutinho, T.A. Pitch canker caused by Fusarium circinatum—A growing threat to pine plantations and forests worldwide. Australas. Plant Pathol. 2008, 37, 319–334. [Google Scholar] [CrossRef]
  4. Gordon, T.R.; Kirkpatrick, S.C.; Aegerter, B.J.; Wood, D.L.; Storer, A.J. Susceptibility of Douglas fir (Pseudotsuga menziesii) to pitch canker, caused by Gibberella circinata (anamorph = Fusarium circinatum). Plant Pathol. 2006, 55, 231–237. [Google Scholar] [CrossRef]
  5. Gordon, T.R. Pitch canker disease of pines. Phytopathology 2006, 96, 657–659. [Google Scholar] [CrossRef] [PubMed]
  6. Hepting, G.H.; Roth, E.R. Pitch canker, a new disease of some southern pines. J. For. 1946, 44, 742–744. [Google Scholar]
  7. Hepting, G.H.; Roth, E.R. Host relations and spread of the pine pitch canker disease. Phytopathology 1953, 43, 475. [Google Scholar]
  8. Pérez-Sierra, A.; Landeras, E.; León, M.; Berbegal, M.; García-Jiménez, J.; Armengol, J. Characterization of Fusarium circinatum from Pinus spp. in northern Spain. Mycol. Res. 2007, 111, 832–839. [Google Scholar] [CrossRef] [PubMed]
  9. Wingfield, M.J.; Jacobs, A.; Coutinho, T.A.; Ahumada, R.; Wingfield, B.D. First report of the pitch canker fungus, Fusarium circinatum, on pines in Chile. Plant Pathol. 2002, 51, 397. [Google Scholar] [CrossRef]
  10. Jacobs, A.; Coutinho, T.A.; Wingfield, M.J.; Ahumada, R.; Wingfield, B.D. Characterization of the pitch canker fungus, Fusarium circinatum, from Chile. S. Afr. J. Sci. 2007, 103, 253–257. [Google Scholar]
  11. Coutinho, T.A.; Steenkamp, E.T.; Mongwaketsi, K.; Wilmot, M.; Wingfield, M.J. First outbreak of pitch canker in a South African pine plantation. Australas. Plant Pathol. 2007, 36, 256–261. [Google Scholar] [CrossRef]
  12. Kobayashi, T.; Muramoto, M. Pitch canker of Pinus luchuensis, a new disease in Japanese forests. For. Pests 1989, 38, 169–173. [Google Scholar]
  13. Dick, M.A. Pine pitch canker—The threat to New Zealand. N. Z. For. 1998, 42, 30–34. [Google Scholar]
  14. Carlucci, A.; Colatruglio, L.; Frisullo, S. First Report of Pitch Canker Caused by Fusarium circinatum on Pinus halepensis and P. pinea in Apulia (Southern Italy). Plant Dis. 2007, 91, 1683. [Google Scholar] [CrossRef]
  15. McCain, A.H.; Koehler, C.S.; SA, T. Pitch canker threatens California pines. Calif. Agric. 1987, 41, 22–23. [Google Scholar]
  16. Neale, D.B.; Wegrzyn, J.L.; Stevens, K.A.; Zimin, A.V.; Puiu, D.; Crepeau, M.W.; Cardeno, C.; Koriabine, M.; Holtz-Morris, A.E.; Liechty, J.D.; et al. Decoding the massive genome of loblolly pine using haploid DNA and novel assembly strategies. Genome Biol. 2014, 15, R59. [Google Scholar] [CrossRef] [PubMed] [Green Version]
  17. Zimin, A.; Stevens, K.A.; Crepeau, M.W.; Holtz-Morris, A.; Koriabine, M.; Marçais, G.; Puiu, D.; Roberts, M.; Wegrzyn, J.L.; de Jong, P.J.; et al. Sequencing and assembly of the 22-gb loblolly pine genome. Genetics 2014, 196, 875–890. [Google Scholar] [CrossRef] [PubMed]
  18. Wingfield, B.D.; Steenkamp, E.T.; Santana, Q.C.; Coetzee, M.P.A.; Bam, S.; Barnes, I.; Beukes, C.W.; Chan, W.Y.; De Vos, L.; Fourie, G.; et al. First fungal genome sequence from Africa: A preliminary analysis. S. Afr. J. Sci. 2012, 108, 1–9. [Google Scholar] [CrossRef]
  19. Kayihan, G.C.; Huber, D.A.; Morse, A.M.; White, T.L.; Davis, J.M. Genetic dissection of fusiform rust and pitch canker disease traits in loblolly pine. Theor. Appl. Genet. 2005, 110, 948–958. [Google Scholar] [CrossRef]
  20. Quesada, T.; Gopal, V.; Cumbie, W.P.; Eckert, A.J.; Wegrzyn, J.L.; Neale, D.B.; Goldfarb, B.; Huber, D.A.; Casella, G.; Davis, J.M. Association Mapping of Quantitative Disease Resistance in a Natural Population of Loblolly Pine (Pinus taeda L.). Genetics 2010, 186, 677–686. [Google Scholar] [CrossRef]
  21. Easterling, D.R. Maximum and Minimum Temperature Trends for the Globe. Science 1997, 277, 364–367. [Google Scholar] [CrossRef]
  22. Marcott, S.A.; Shakun, J.D.; Clark, P.U.; Mix, A.C. A reconstruction of regional and global temperature for the past 11,300 years. Science 2013, 339, 1198–1201. [Google Scholar] [CrossRef] [PubMed]
  23. Wigley, T.M.; Raper, S.C. Interpretation of high projections for global-mean warming. Science 2001, 293, 451–454. [Google Scholar] [CrossRef]
  24. Karl, T.R.; Melillo, J.; Peterson, T.C. Global Climate Change Impacts in the United States; Cambridge University Press: Cambridge, UK, 2009; p. 196. [Google Scholar]
  25. Schiermeier, Q. Climate and weather: Extreme measures. Nature 2011, 477, 148–149. [Google Scholar] [CrossRef] [PubMed] [Green Version]
  26. Tilman, D.; Lehman, C. Human-caused environmental change: Impacts on plant diversity and evolution. Proc. Natl. Acad. Sci. USA 2001, 98, 5433–5440. [Google Scholar] [CrossRef] [PubMed] [Green Version]
  27. Beaumont, L.J.; Pitman, A.; Perkins, S.; Zimmermann, N.E.; Yoccoz, N.G.; Thuiller, W. Impacts of climate change on the world’s most exceptional ecoregions. Proc. Natl. Acad. Sci. USA 2011, 108, 2306–2311. [Google Scholar] [CrossRef] [PubMed]
  28. Kunkel, K.E.; Stevens, L.E.; Stevens, S.E.; Sun, L.; Jansen, E.; Wuebbles, D.; Konrad, C.E.; Fuhrman, C.M.; Keim, B.D.; Kruk, M.C.; et al. Regional Climate Trends and Scenarios for the U.S. National Climate Assessment. Part 2 Climate of the Southeast U.S.; National Oceanic and Atmospheric Administration: Washington, DC, USA, 2013; Volume 3, pp. 142–143. [Google Scholar]
  29. Dale, V.H.; Joyce, L.A.; McNulty, S.; Neilson, R.P.; Ayres, M.P.; Flannigan, M.D.; Hanson, P.J.; Irland, L.C.; Lugo, A.E.; Peterson, C.J.; et al. Climate change and forest disturbances. BioScience 2001, 51, 723–734. [Google Scholar] [CrossRef]
  30. Ayres, P. The Interaction Between Environmental Stress Injury and Biotic Disease Physiology. Annu. Rev. Phytopathol. 1984, 22, 53–75. [Google Scholar] [CrossRef]
  31. Coakley, S.M.; Scherm, H.; Chakraborty, S. Climate change and plant disease management. Annu. Rev. Phytopathol. 1999, 37, 399–426. [Google Scholar] [CrossRef]
  32. Rohrs-Richey, J.K.; Mulder, C.P.H.; Winton, L.M.; Stanosz, G. Physiological performance of an Alaskan shrub (Alnus fruticosa) in response to disease (Valsa melanodiscus) and water stress. New Phytol. 2011, 189, 295–307. [Google Scholar] [CrossRef]
  33. Roos, J.; Hopkins, R.; Kvarnheden, A.; Dixelius, C. The impact of global warming on plant diseases and insect vectors in Sweden. Eur. J. Plant Pathol. 2011, 129, 9–19. [Google Scholar] [CrossRef]
  34. McNew, G.L. Plant Pathology: An Advanced Treatise; Horsfall, J.G., Dimond, A.E., Eds.; Academic Press: New York, NY, USA; London, UK, 1960; Volume 2. [Google Scholar]
  35. Garrett, K.A.; Jumpponen, A.; Toomajian, C.; Gomez-Montano, L. Climate change and plant health: Designing research spillover from plant genomics for understanding the role of microbial communities. Can. J. Plant Pathol. 2012, 34, 349–361. [Google Scholar] [CrossRef]
  36. Cowling, E.; Young, C. Narrative history of the resistance screening center: It’s origins, leadership and partial list of public benefits and scientific contributions. Forests 2013, 4, 666–692. [Google Scholar] [CrossRef]
  37. Young, C.H.; Minton, B.S.; Bronson, J.J. Resistance Screening Center Procedures Manual: A Guide Used in the Operational Screening of Pines for Resistance to Pitch Canker Disease; United States Department of Agriculture Forest Service Southern: Asheville, NC, USA, 2006; p. 25. [Google Scholar]
  38. Pinkard, E.A.; Battaglia, M.; Roxburgh, S.; O’Grady, A.P. Estimating forest net primary production under changing climate: Adding pests into the equation. Tree Physiol. 2011, 31, 686–699. [Google Scholar] [CrossRef] [PubMed]
  39. Storer, A.J.; Gordon, T.R.; Wood, D.L.; Bonello, P. Pitch canker disease of pines—Current and future impacts. J. For. 1997, 95, 21–26. [Google Scholar]
  40. Davydenko, K.; Nowakowska, J.; Kaluski, T.; Gawlak, M.; Sadowska, K.; García, J.; Diez, J.; Okorski, A.; Oszako, T. A Comparative Study of the Pathogenicity of Fusarium circinatum and other Fusarium Species in Polish Provenances of P. sylvestris L. Forests 2018, 9, 560. [Google Scholar] [CrossRef]
  41. Martín-García, J.; Lukačevičová, A.; Flores-Pacheco, J.; Diez, J.; Dvořák, M. Evaluation of the Susceptibility of Several Czech Conifer Provenances to Fusarium circinatum. Forests 2018, 9, 72. [Google Scholar] [CrossRef]
  42. Martín-García, J.; Paraschiv, M.; Flores-Pacheco, J.; Chira, D.; Diez, J.; Fernández, M. Susceptibility of Several Northeastern Conifers to Fusarium circinatum and Strategies for Biocontrol. Forests 2017, 8, 318. [Google Scholar] [CrossRef]
  43. De Vos, L.; van der Nest, M.A.; van der Merwe, N.A.; Myburg, A.A.; Wingfield, M.J.; Wingfield, B.D. Genetic analysis of growth, morphology and pathogenicity in the F(1) progeny of an interspecific cross between Fusarium circinatum and Fusarium subglutinans. Fungal Biol. 2011, 115, 902–908. [Google Scholar] [CrossRef]
  44. Schneider, C.A.; Rasband, W.S.; Eliceiri, K.W. NIH Image to ImageJ: 25 years of image analysis. Nat. Methods 2012, 9, 671–675. [Google Scholar] [CrossRef] [Green Version]
  45. Battisti, A.; Stastny, M.; Netherer, S.; Robinet, C.; Schopf, A.; Roques, A.; Larsson, S. Expansion of geographic range in the pine processionary moth caused by increased winter temperatures. Ecol. Appl. 2005, 15, 2084–2096. [Google Scholar] [CrossRef]
  46. Ramsfield, T.D.; Bentz, B.J.; Faccoli, M.; Jactel, H.; Brockerhoff, E.G. Forest health in a changing world: Effects of globalization and climate change on forest insect and pathogen impacts. Forestry 2016, 89, 245–252. [Google Scholar] [CrossRef]
  47. Mullett, M.; Pérez-Sierra, A.; Armengol, J.; Berbegal, M. Phenotypical and Molecular Characterisation of Fusarium circinatum: Correlation with Virulence and Fungicide Sensitivity. Forests 2017, 8, 458. [Google Scholar] [CrossRef]
  48. Serrano, Y.; Iturritxa, E.; Elvira-Recuenco, M.; Raposo, R. Survival of Fusarium circinatum in soil and Pinus radiata needle and branch segments. Plant Pathol. 2017, 66, 934–940. [Google Scholar] [CrossRef]
  49. Dahmen, H.; Staub, T.; Schwinn, F.J. Technique for Long-Term Preservation of Phytopathogenic Fungi in Liquid Nitrogen. Phytopathology 1983, 73, 241–246. [Google Scholar] [CrossRef]
  50. Storer, A.J.; Bonello, P.; Gordon, T.R.; Wood, D.L. Evidence of resistance to the pitch canker pathogen (Fusarium circinatum) in native stands of monterey pine (Pinus radiata). For. Sci. 1999, 45, 500–505. [Google Scholar]
  51. Storer, A.J.; Wood, D.L.; Gordon, T.R. The epidemiology of pitch canker of Monterey pine in California. For. Sci. 2002, 48, 694–700. [Google Scholar]
  52. Schmale, D.G.; Gordon, T.R. Variation in susceptibility to pitch canker disease, caused by Fusarium circinatum, in native stands of Pinus muricata. Plant Pathol. 2003, 52, 720–725. [Google Scholar] [CrossRef]
  53. Britz, H.; Coutinho, T.A.; Wingfield, B.D.; Marasas, W.F.O.; Wingfield, M.J. Diversity and differentiation in two populations of Gibberella circinata in South Africa. Plant Pathol. 2005, 54, 46–52. [Google Scholar] [CrossRef]
  54. Britz, H.; Couhnho, T.A.; Gordon, T.R.; Wingfield, M.J. Characterisation of the pitch canker fungus, Fusarium circinatum, from Mexico. S. Afr. J. Bot. 2001, 67, 609–614. [Google Scholar] [CrossRef]
Figure 1. County map of southeast United States showing the locations where the Fusarium circinatum isolates were collected. The dark shaded area corresponds to the geographical range of slash pine (Pinus elliottii) and the thin grey line corresponds to the geographical range of loblolly pine (Pinus taeda). Thick grey lines correspond to state borders.
Forests 10 00040 g001
Figure 2. Least square means of daily growth of F. circinatum isolates in culture at 25 °C, 28 °C, and 31 °C across eight days. F. circinatum mycelium was grown in APDA medium and the culture diameter was recorded daily. Error bars correspond to standard errors of the means. Different letters within each graph correspond to significant differences in total mycelium growth (p < 0.01) between temperatures for each isolate for the last date of measurement at day 8, using Tukey’s adjustment.
Forests 10 00040 g002
Figure 3. Least square means for mycelium diameter of each isolate and temperature combination measured at eight days in culture. Error bars correspond to standard errors of the mean. Isolates not connected by the same horizontal bars sharing a letter are significantly different (p < 0.05) using Tukey’s pairwise comparisons.
Forests 10 00040 g003
Figure 4. Means for number of microconidia per microliter of spore suspension obtained in F. circinatum isolates after 15 days in culture at 25 °C, 28 °C, and 31 °C. Error bars correspond to standard errors of the mean.
Forests 10 00040 g004
Figure 5. Means for number of germinated microconidia per microliter of spore suspension obtained in F. circinatum isolates after 15 days in culture at 25 °C, 28 °C, and 31 °C and 24 h incubation at those same temperatures. Error bars correspond to standard errors of the mean.
Forests 10 00040 g005
Figure 6. Survival and mortality of a resistant loblolly pine open-pollinated family, and two susceptible slash pine open-pollinated families inoculated with eight different F. circinatum isolates. Each vertical bar corresponds to a total of 60 seedlings (three replicates of 20 seedlings) of each family inoculated with a given isolate, with percentages of surviving and dead seedlings shown as gray and black portions of each bar, respectively. Isolates with an asterisk (*) correspond to two of the 6 isolates used by the RSC for routine screenings in previous years.
Forests 10 00040 g006
Figure 7. Mean lesion length measurements in loblolly (resistant check) and slash (susceptible checks) pine seedlings inoculated with eight different isolates of Fusarium circinatum. Measurements were taken at 13 weeks post-inoculation and included only live seedlings (381 out of 1408 seedlings were excluded). Isolates with an asterisk (*) are two of the isolates routinely used at the USDA Resistance Screening Center in Asheville, NC. Error bars correspond to standard errors of the mean.
Forests 10 00040 g007
Table 1. Analysis of variance results for fixed effects Incubator, temperature (Temp), fungal isolate (Isolate) and the Temperature-by-Isolate interaction (Temp × Isolate) for the response variable mean diameter of cultured mycelium measured on 15 Fusarium circinatum isolates after eight days in culture, mean microconidia/microliter of 11 isolates after 15 days in culture, and mean geminated microconidia/microliter after 24 h incubation on those 11 F. circinatum isolates collected after 15 days in culture. Significant effects (p < 0.05) are shown in bold.
EffectMean Mycelium DiameterMean Microconidia/μLMean Germinated Microconidia/μL
Incubator0.43280.07630.0552
Temp<0.0001<0.00010.0097
Isolate<0.0001<0.00010.0002
Temp × Isolate<0.00010.01710.0115
Table 2. Analysis of Variance results for fixed effects Replicate (Rep), Isolate, Family and Isolate-by-Family interactions (Isolate × Family) for the response variable lesion length measured on one resistant loblolly pine and two susceptible slash pine open-pollinated families at 13 weeks after inoculation with eight Fusarium circinatum isolates.
SourceDFSum of SquaresF RatioProb > F
Rep23072.861.5780.2069
Isolate7507,144.274.4112<0.0001
Family2535,146.29274.8194<0.0001
Isolate × Family1481,026.985.9444<0.0001