1. Introduction
The response rate of a survey, the extent to which submitted surveys are fully completed, and the reliability of the information provided by respondents each greatly depend on the length of time required to take the survey (see, for example, Burchell and March (1992) [
1] and Beebe
et al. (2010) [
2]). Shortening a survey without losing important information is quantitatively feasible when past surveys can be analyzed to develop branching rules for future respondents. Branching rules customize the survey experience for each respondent by taking advantage of paths through the survey that are estimated to be highly predictable based on past survey respondents.
While individual survey questions are typically not highly predictable over the entire population of respondents, it is frequently the case that a patterned response to one set of questions leads to a predictable response to another question. Consider a hypothetical example where a vast majority of respondents who answer ‘Yes’ on the first two questions of a survey also answer ‘Yes’ on the third question. If this is the case, then the third question could be skipped for the respondents who answer ‘Yes’ to the first two questions. We refer to skipping the third question, based on a ‘Yes’ to the first two questions, as a branching rule. Using past survey data to learn branching rules is the subject of this paper.
Incorporating branching rules into a survey optionally shortens the survey for a respondent based on their individual responses. This approach differs from shortening the survey by simply eliminating questions altogether. We are not attempting to shorten the survey by entirely removing one or more questions. Instead, branching rules offer respondents alternative paths through the survey. The paths vary in length and are dictated by the developing pattern of responses. One respondent might only be able to skip a few of the questions, while another might be able to skip many. Some respondents may not skip any questions.
Our premise is that the individual questions on the survey have already been vetted for their potential to provide unique value. What is more difficult to do a-priori is judge if there are branching rules that could effectively shorten the survey. We propose to identify these situations by mining a repository of past survey data. Depending on the number of questions in a survey, it may be suitable to individually examine subsections of related questions when learning associations.
We focus on the context where the questions on the survey have binary responses. We discuss how our approach can be adapted for more general situations. Key to our strategy for learning branching rules is an inputted accuracy level. The accuracy level specifies the maximum allowable discrepancy rate between the actual answers provided in the repository of surveys and the answers that would be implied by running those respondents through the new survey design that incorporates the branching rules. In this way, the inputted accuracy level controls the level of loss in the information that results from implementing branching rules.
The rest of this paper is organized as follows.
Section 2 places the work presented in this paper into context with related literature. In
Section 3, we provide the motivation for our work. First, we describe a survey used for geriatric assessment that provides guidance on treatment therapy for breast cancer patients. Second, we discuss the challenges of administering the survey to these patients and highlight the value in shortening the time needed for the patients to complete the survey. In
Section 4, we describe in detail our solution for learning branching rules from past survey data. Our description is aided by a sketch of an algorithm included in the
appendix that implements the solution.
Section 5 discusses some properties of our proposed solution. In
Section 6, we use our proposed solution to learn branching rules for three different subsections of questions on the geriatric assessment survey. A summary of the paper is provided in
Section 7.
2. Related Literature
There are many places to go for tips on survey design. Fanning (2005) [
3], for example, discusses considerations such as look and feel, ordering of questions, and branching options. The Harvard University Program on survey research offers a tip sheet to survey designers (
http://psr.iq.harvard.edu/book/questionnaire-design-tip-sheet). Hayes (2005) [
4] discussed a technique for reducing the number of components needed for calculating composite measures of personality, opinions and attitudes. In that work, surveys are shortened by eliminating questions. Mielenz
et al. (2015) [
5] use itemized response theory models to similarly shorten a survey by eliminating questions.
There are also many software tools that facilitate designing surveys when branching rules are known a-priori. For example, REDCap, Qaultrics, SurveyMonkey, FourEyes, and SurveyGizmo each provide the capability to build-in branching logic rules (
http://project-redcap.org/,
http://www.qualtrics.com,
http://www.surveymonkey.com,
https://getfoureyes.com/p/charming/,
http://www.surveygizmo.com). None of these software tools, however, addresses the same topic we address in this paper, which is how to
learn branching rules from historical surveys.
The work in this paper has a relation to computer adaptive testing (CAT). The literature on CAT is scattered and vast. Good introductions to CAT are Lunz
et al. (1994) [
6] and Linacre (2000) [
7]. Like CAT, we aim to shorten a survey for respondents by deciding which questions to present a respondent based on their evolving pattern of answers. Our approach uses a data mining technique to discover branching rules from past surveys. CAT, on the other hand, uses past surveys to build sophisticated statistical models that allow the question sequence to be customized for each respondent in order to match to their underlying ability level. Based on the response to each question, the respondent’s estimated ability level is updated and used to select the next question to be presented. Questions are selected to reduce the uncertainty in the updated estimate of ability as much as possible. Surveys with CAT typically terminate when a specified amount of precision in the estimated ability is achieved.
Compared to CAT, our data mining approach to shortening a survey is simpler for practitioners to use and is less encumbered by necessary adherence to modeling assumptions. A key feature of CAT is that each respondent’s ability level is estimated with nearly the same precision. However, for some surveys this is not a crucial objective. Instead, the objective of many surveys is simply to gather diagnostic information from a respondent such as feedback about a program or indicators of a disease. In these situations, if time was not an issue each respondent would be asked all of the questions on the survey. Our data mining approach to developing branching rules is useful in these contexts.
Our data mining approach to discovering branching rules has similarities to market basked analysis (MBA). A good introductory reference to MBA is Lindoff and Berry (2011) [
8]. In the context of surveys, patterns of answers to the survey questions could be viewed as item sets. MBA would use conditional probabilities for discovering frequent item sets that could then be interpreted has high frequency response patterns. However, a difficulty with using MBA in this context is that surveys have a natural forward flow as the respondent moves through the questions. MBA will provide predictive rules for response patterns that can violate that flow. For example, MBA will produce rules such as, the answer from the first question can be predicted from the answers to the fourth and fifth questions. Moreover, MBA does not control a global metric that measures the error introduced into the survey when predictive rules are used to shorten the survey.
3. Geriatric Assessment Survey
Because aging is a heterogeneous process, and understanding a patient’s functional age as opposed to their chronological age is an essential part of cancer-treatment decisions, a geriatric assessment survey for oncologists has been developed. Since cancer therapy often involves substantial risks, consideration of the risk-to-benefit ratio of cancer therapy plays an important part in the treatment decision-making process.
Prior studies have shown that older adults derive similar benefits from chemotherapy as do younger adults, but they are at increased risk for side effects (Muss
et al. (2007) [
9], Hurria
et al. (2011) [
10], and Extermann
et al. (2012) [
11]). The challenge is to characterize these risks, identify areas of vulnerability, develop interventions to address these areas of vulnerability, and tailor treatment decisions based on the risks identified. A geriatric assessment can help to fill this need by providing a comprehensive overview of the individual’s daily functioning, memory, social support, psychological state, nutritional status, and other medical conditions (Wildiers
et al. 2014) [
12]).
One of the main barriers to performing a comprehensive geriatric assessment in daily oncology practice is the time and resources required. To address this barrier, an abbreviated geriatric assessment has been developed. The shorter assessment consists of reliable geriatric assessment measures that can, for the most part, be completed by patients themselves. A study by Hurria
et al. (2011) [
10] utilized the abbreviated assessment along with tumor, treatment and laboratory data to develop a predictive model of severe chemotherapy side effects in older adults with cancer.
There is value to obtaining the comprehensive geriatric assessment results as well as to completing the abbreviated assessment for the predictive model since they serve different yet complementary purposes. The predictive model provides a numerical value which predicts the risk of chemotherapy toxicity while the comprehensive geriatric assessment provides a summary of the patient’s overall health status and identifies areas of vulnerability for which interventions may be considered.
There are limits to a paper and pencil approach of obtaining geriatric assessment information. First, a healthcare provider must take the time to review and score the measures, summarize the assessment results, identify areas of vulnerability, and propose targeted interventions. Furthermore, from the patient’s perspective, some questions in the assessment may be redundant, depending on how they answered a prior question. For example, the geriatric assessment includes questions regarding a range of functional abilities, including whether someone can bathe independently all the way to whether they are able to run. If a patient responds that they cannot bathe independently, it is highly unlikely that they can run and so that question could be skipped, thus both shortening the number of items in the assessment as well as tailoring the assessment to the person.
In order to address the need for individualizing the comprehensive geriatric assessment, a computerized version is being developed. The current phase of development calls for statistical guidance on how to streamline the assessment based on a patient’s prior responses, and further, development of useful reports to summarize the information and highlight potential interventions. The work in this paper addresses the first of these two needs.
4. Deriving Branching Rules
We define a conditional question (CQ) to be a question on the survey that is asked, conditional on a specific pattern of answers to the questions that preceded it. For example, asking question #2 among all respondents who said ‘No’ to question #1 is a CQ. Asking question #2 among all respondents who said ‘Yes’ to question #1 is a different CQ. We create ‘branching’ rules by identifying which CQs, if any, can be eliminated, based on a preponderance of evidence in historical surveys that suggests their answers are highly predictable. The level of predictability for the answer to a CQ to conclude it could be skipped needs to be decided. In essence, branching rules modify the design of the survey by leading individual respondents through different paths of questioning based on their cumulative responses during the survey. Branching rules can be developed by mining a large set of historical surveys to identify the most likely paths through the survey.
4.1. Organizing Historical Data
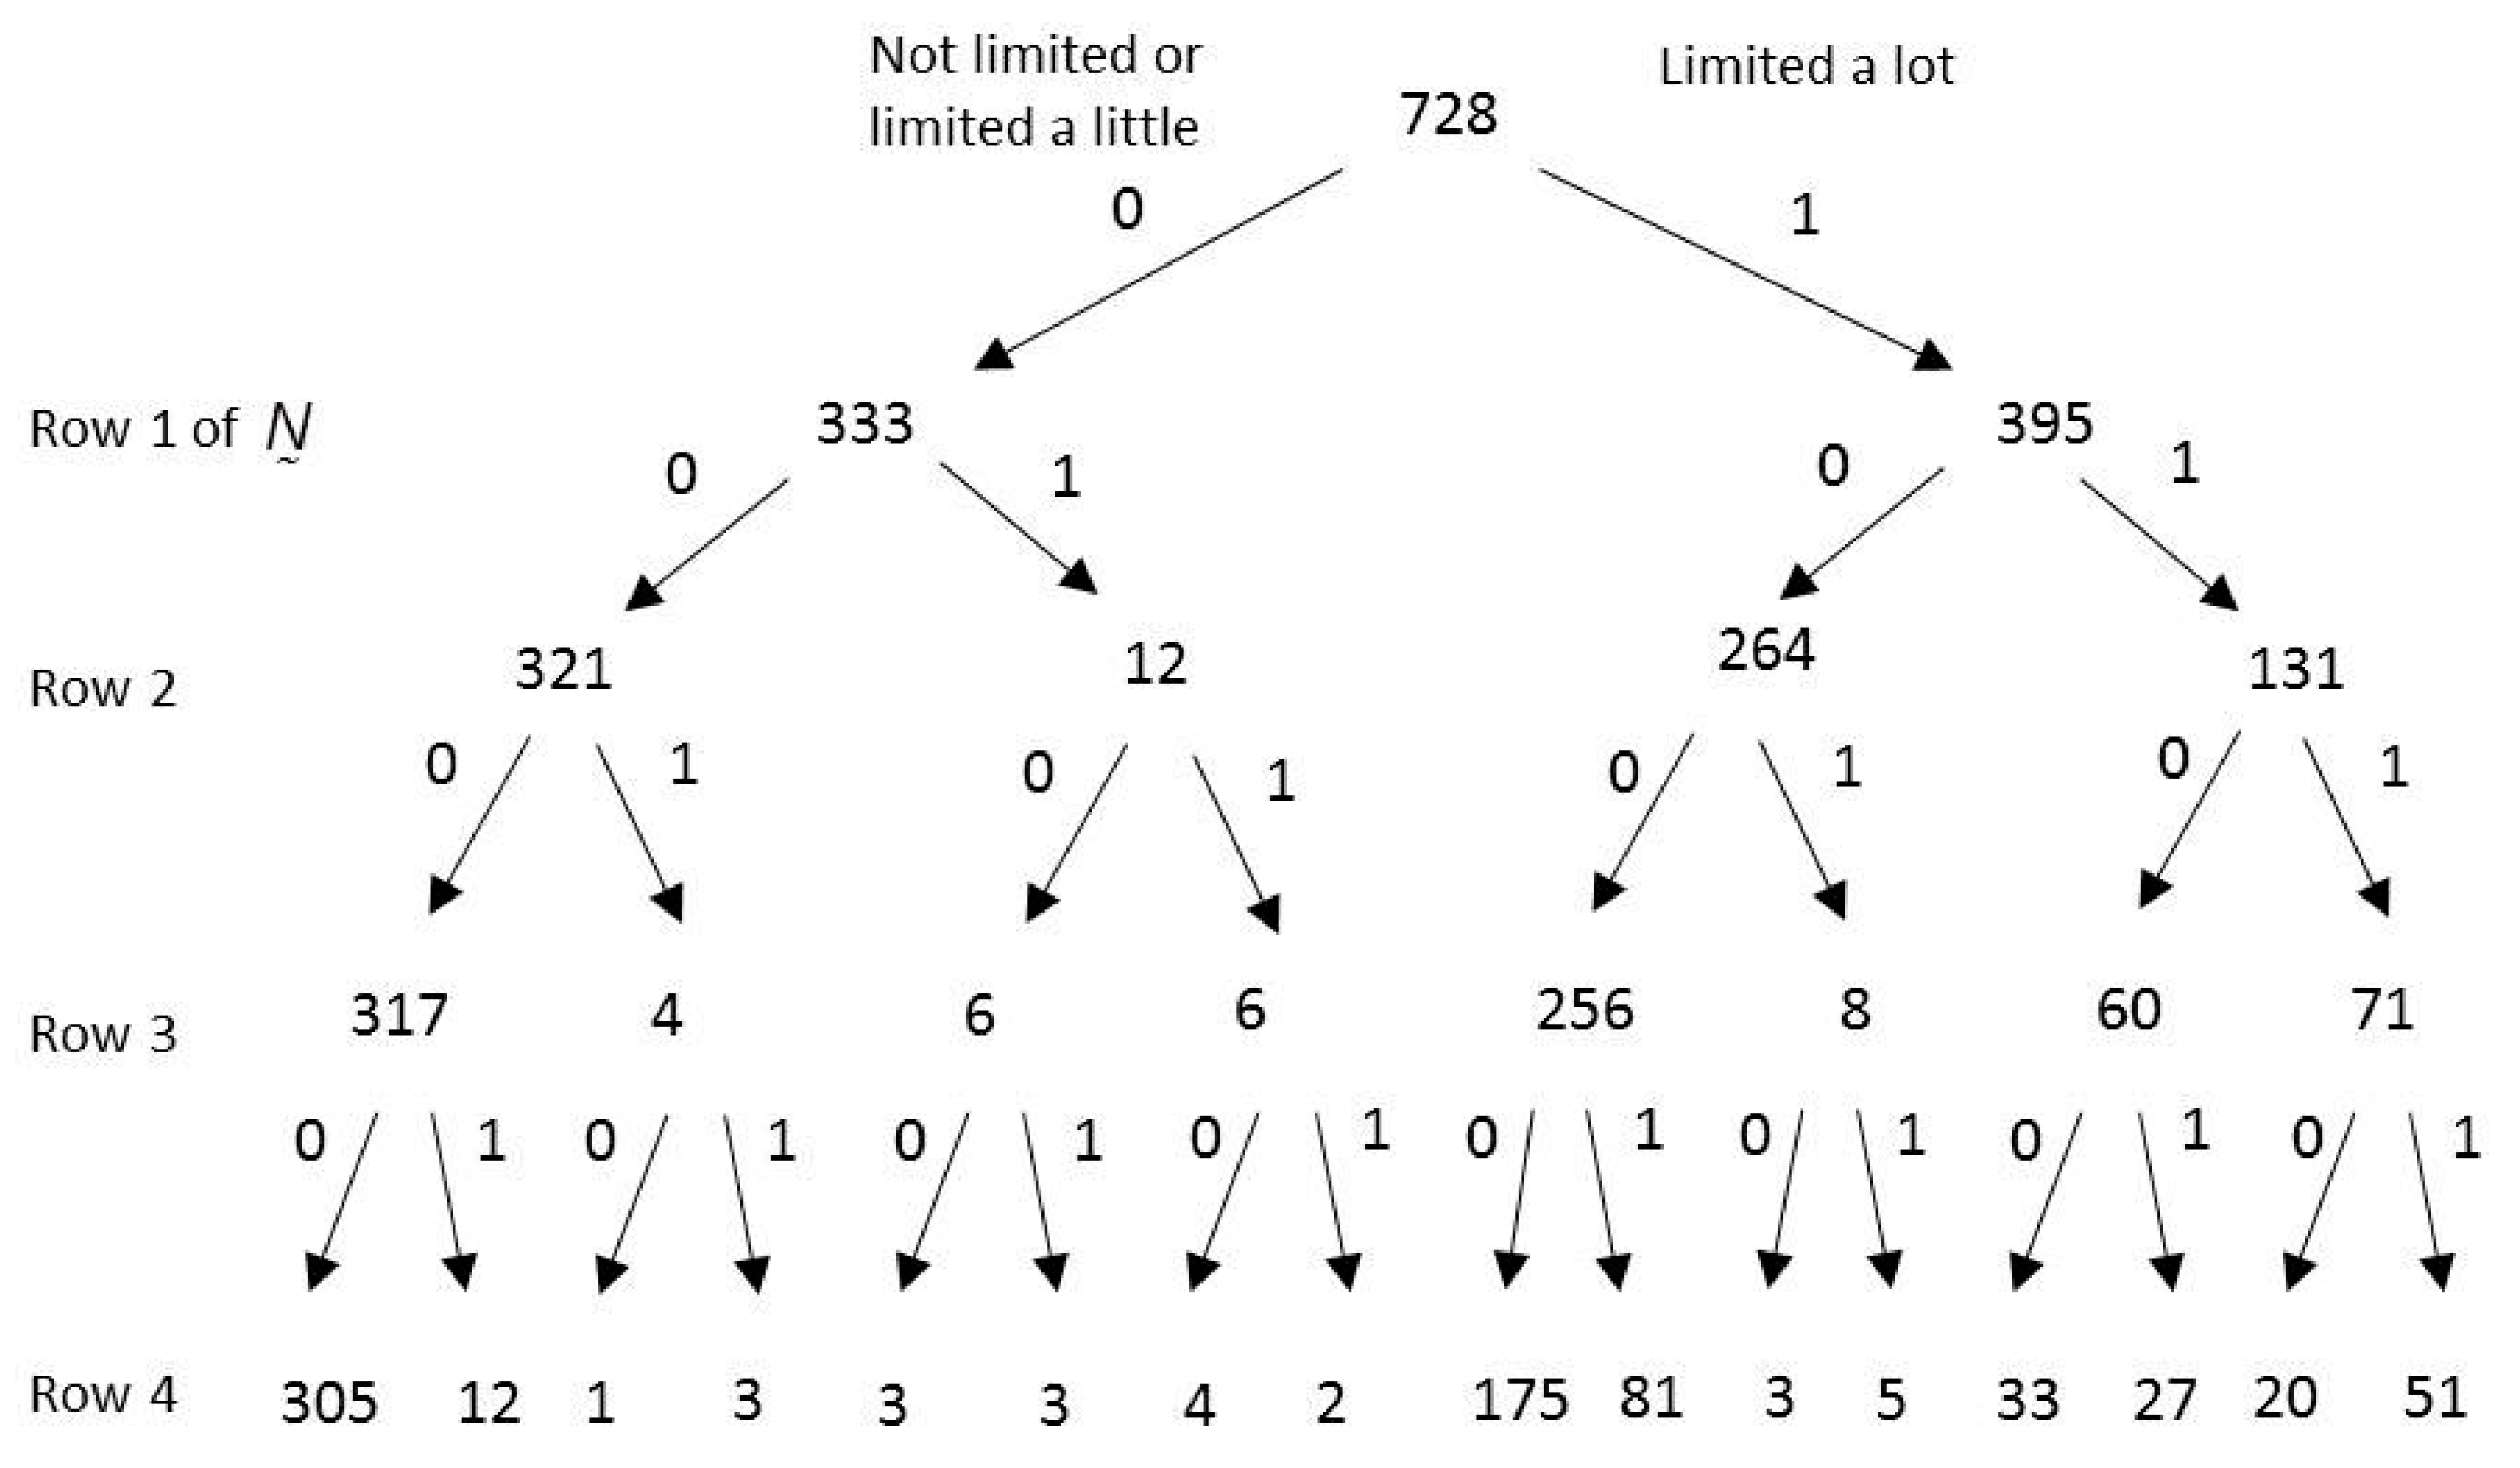
Historical responses from a survey that asks binary questions and is administered to n individuals can be represented as a matrix as follows. Each row corresponds to a question. In the row, only the first elements are populated with data. In the first row, the first two elements correspond to the number of ‘0’ answers and the number of ‘1’ answers, respectively, to the first question. For the second row, the first two elements correspond to the number of ‘0’ answers and the number of ‘1’ answers, respectively, to the second question conditional on the first question being answered ‘0.’ The next two elements in the second row are similar, but are conditional on the first question being answered ‘1.’ All of the remaining rows of are built in this same way.
Figure 1 is an illustrative tree representation of
based on the geriatric assessment survey. Respondents were asked if they felt limited in 4 different functional activities and their responses were coded ‘0’ or ‘1’ as shown. The geriatric assessment survey will be discussed at length in
Section 6 of this paper. The entries for the first row of
would be 333 and 395, appearing in columns 1 and 2, as the number of respondents who answered ‘0’ and ‘1’, respectively, to the first questions. The filled in entries of the second row of
would be 321, 12, 264 and 131, appearing in the first four columns, respectively. The first two entries, 321 and 12, are the partition of 333 corresponding to ‘0’ and ‘1’ answers to the second question among the 333 respondents who said ‘0’ to the first question. Similarly, the entries 264 and 131 are the partition of 395 corresponding to ‘0’ and ‘1’ answers to the second question among the 395 respondents who said ‘1’ to the first question. The initialization section of the algorithm in the
appendix shows the steps involved for building
. The basic idea is to establish counters for each node in the tree and increment the counters as each survey traverses the tree.
4.2. Cost vs. Benefit
Consider an arbitrary CQ and its corresponding pair of numbers in . When either or reflects a great majority the total number of answers, , intuition suggests that the CQ is a candidate to be skipped. Skipping the CQ is equivalent to branching to a different section of the survey, assuming all of the answers to the skipped question will be the majority answer. With respect to the historical data, skipping a CQ is equivalent to changing all of the minority answers in the historical surveys set to the majority answer. Specifically, we are changing answers in the historical surveys.
We can interpret as the cost for skipping that CQ. On the other hand, skipping that CQ would have reduced the number questions we needed to ask in the historical surveys by s. We could interpret s as the benefit for skipping that CQ. Let and denote the cost and benefit, respectively, for skipping a CQ. When considering the net value of skipping a CQ, a natural metric to examine is the cost-benefit ratio, given by , which measures the cost per unit of benefit if that CQ was skipped.
4.3. Budget
Skipping CQs implicitly presumes their answers to be the majority answer that is reflected in the historical surveys. Applying candidate branching rules to the historical surveys, therefore, implicitly changes answers in these surveys. We presume that a budget for the overall number of changed answers to CQs among the historical surveys has been specified, say . The budget might be determined based on a requirement that of the total number of answers reflected in the historical surveys, , we change no more than a specified percentage. For example, if we want to change (at most) 2% of the total number of answers given by the respondents in the historical surveys, then .
4.4. Sequential Identification
Branching rules will be identified in a sequential manner. To get started, we first identify all the admissible CQs. A CQ is admissible if it has cost and benefit satisfying
and
, where
is a specified minimum benefit. The motivation for imposing the benefit constraint is to screen out CQs that do not have an adequate sample size to judge if the majority answer can be trusted as representative of future surveys. As can be seen from
Figure 1, for example, some of the CQs have very small values for
, and this becomes increasingly more common the deeper you look into the tree.
Admissible CQs that have zero cost (i.e., all the answers to the CQ go one way) form the initial list of CQs to be eliminated. After that, we choose CQs that have small non-zero cost-benefit ratios, . For each CQ that is selected, the matrix is modified to reflect the presumed majority answer. Modifying involves consolidating the minority answers to the majority in multiple places, as will now be illustrated.
Referring to
Figure 1, the CQ with the smallest cost-benefit ratio is question #3, given that the answer to the first two questions was ‘0.’ For this case,
,
,
and
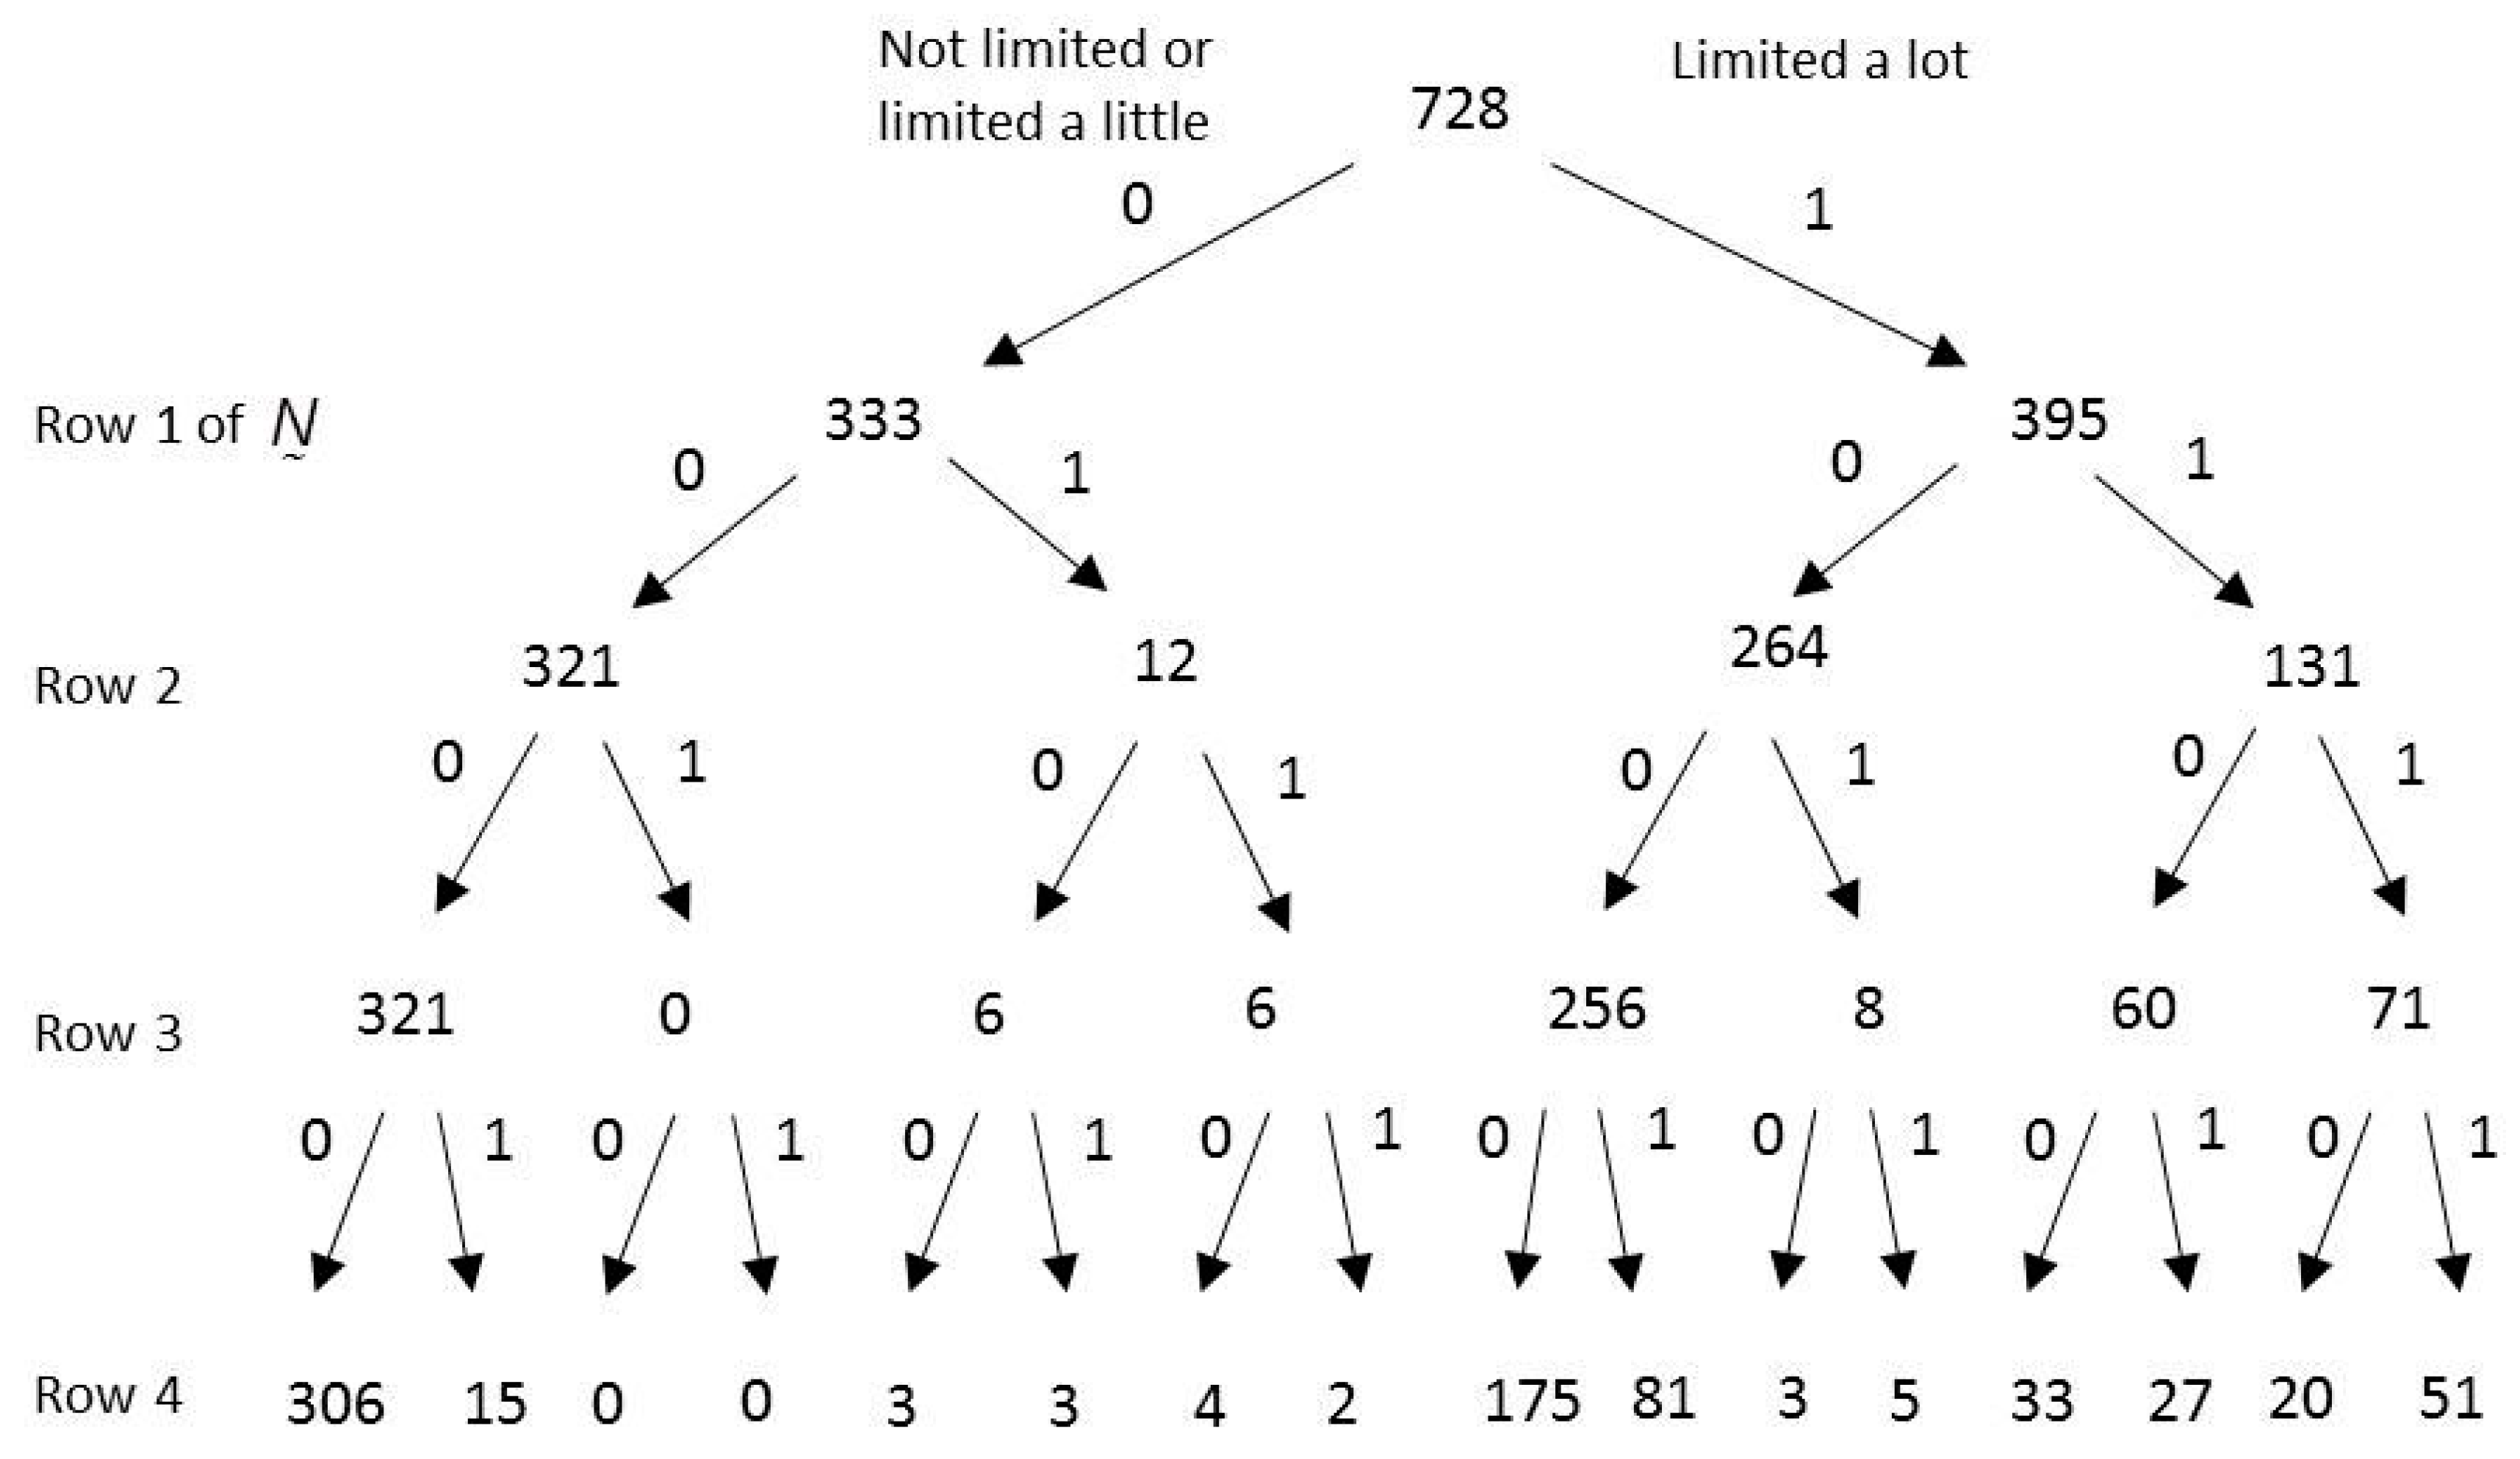
. The modified version of
is shown in
Figure 2. First, it can be seen that the four ‘1’ answers to the CQ have been merged with the 317 ‘0’ answers. A consequence of this change is that it becomes unnecessary to ask the CQ, since all 321 answers have become ‘0.’ Thus, for a cost of 4 changed answers, a benefit of 321 reduced questions needs to be asked. Second, it can also be seen that subsequent corresponding merges were implemented to maintain consistency throughout the tree. These additional merges are necessary because for the four respondents who answered ‘1’ to the CQ we want to preserve their answers to all subsequent questions. The first iteration is complete and the remaining budget is
.
In the second step of the sequential process, the modified
is processed in what is essentially the same way the original
was processed in the first step, the only difference being that we compare cost to a reduced budget to account for what part of it was spent in the first step. Referring to
Figure 2, the CQ with the smallest cost-benefit ratio is question #3, given that the answers to the first two questions are ‘1’ and ‘0.’ For this case,
,
,
and
. The modified version of
is shown in
Figure 3. It can be seen that the 8 ‘1’ answers to the CQ have been merged with the 256 ‘0’ answers. A consequence of this change is that it becomes unnecessary to ask the CQ, since all 264 answers have become ‘0.’ Thus, for a cost of 8 changed answers, the benefit is a reduction of 264 questions that need to be asked. The second iteration is complete, and the remaining budget is
.
The sequential process would continue until either the budget,
, for the number of changed answers amongst the historical surveys was entirely spent, or until all the remaining CQs had individual costs that exceeded the remaining budget. Upon completion of the sequential process, the branching rules can be discerned from
by identifying the CQs that have pure answers. The mining section of the algorithm in the
appendix sketches the steps involved with the sequential process. The basic idea is to iteratively identify the CQ that would deliver the biggest ‘bang for the buck’ in terms of eliminating that question from the survey. CQs are eliminated on that basis until the remaining budget for the number of changed answers reaches zero, or can no longer be reduced.
5. Properties of Solution
Our solution for identifying branching rules can be described as ‘greedy’, due to the strategy of sequentially making the best possible decision. The alternative of evaluating all possible subsets of CQs that stay within the budget for changed answers is not computationally feasible except for very small surveys. The greedy approach we have taken provides a practical way to reduce survey fatigue by shortening a survey for most respondents.
Our solution depends upon the original ordering of the questions in the survey. In some cases, a practitioner may not want to alter the order of the questions for future respondents, having in mind some good reasons for the order they have selected. For example, often the most important questions are asked first in hopes of getting high quality answers from respondents before survey fatigue becomes an issue. However, if the order of the survey questions is up for debate, our approach could be executed on permuted versions of the questions that are thought to be viable alternatives. Each permutation of the questions leads to a changed structure for the starting value of . The permutation that yields the largest reduction in the number of questions asked could be identified as the recommended ordering for the questions.
When populating
with historical surveys, only surveys that have complete data with respect to the questions being analyzed can be used. If the response to any question is missing, uncertainty about which path to place the respondent in arises and it cannot be cleanly resolved. In most instances, branching rules would be developed for subsections of questions within a large survey. This will help keep the number of useable historical surveys large. In some situations, a practitioner may wish to consider data imputation methods. Van Buren (2012) [
13] provides a general introduction to data imputation methods, while Schafer and Graham (2002) [
14] give a more detailed discussion of the options for creating imputation algorithms that fill in missing data. Rubin (1987) [
15] discusses the use of multiple imputation in the context of survey analyses. In our context, multiple imputation could be used to create multiple instances of the initial
matrix, and then the branching rules would be derived from an initial
obtained by averaging the node frequencies over these instances.
The initial matrix may have some pure splits based on what was observed from the historical surveys. As the greedy algorithm processes the data it identifies new pure splits. Sometimes new pure splits will undo a pre-existing pure split, but always the total number of questions saved by the new pure split will exceed whatever was saved by the pre-existing pure splits that become impure. This is because existing pure splits that get undone by the new pure split are always down stream of the new split and thus in aggregate cannot save more questions than a higher level pure split.
The branching rules extracted from the final matrix correspond to pure splits formed during the process of spending the budget for the number of allowable changed answers. The changed answers will mostly correspond to the CQs associated with the pure splits. Steps during the sequential process to change answers always create a pure split. However, because later changes at a higher level can undo a previously created pure split, it will be the case that in the end some of the changed answers are related to CQs that are not converted into branching rules.
A sensitivity analysis with small upward adjustments to the budget is recommended to see what could be gained in terms of the additional reduction in the number of questions asked. It is unlikely that a precise value for the budget is going to be available. There will be situations where allowing a modest increase in the budget for the number of allowable changed answers in the historical surveys will yield a significant decrease in the number of questions that need to be asked.
The focus of this paper is on binary response questions. A strategy for handling more than two responses would be to redefine benefit as and redefine cost as , where denotes the number of respondents that gave the j-th response. The number of paths in grows quickly as the number of responses to the questions increases, and the consequence of that is a larger number of historical surveys will be required to get reliable estimates of the path frequencies.
6. Application to Geriatric Assessment Survey
6.1. Functional Activity Questions
Patients were asked if their health limited them in each of ten functional activities. A total of 704 surveys were available to analyze these questions. The responses were coded as “0” if the patient did not feel limited or only felt a little limited and “1” if the patient felt a lot limited. The activities queried are shown in Column 1 of
Table 1.
6.1.1. Initial Analysis
The inputted
budget for the number of changed answers in the historical surveys was 1% of the 7040 total number of answers provided, or 70 answers. The inputted
min.benefit was 50. The results in
Table 2 provide the information needed to implement the mined branching rules into the survey. Each row in the table corresponds to a CQ that can be eliminated. Column 1 of the table shows the question that can be eliminated for respondents who provide the pattern of answers to the previous questions shown in column 2. The answer to be presumed (
i.e., the answer assumed for all respondents if the question is eliminated) is shown in column 3. The overall cost of eliminating the 12 CQs is 70 and the total number of saved questions is 2929. That is, for a cost of 70 changed answers in the historical surveys, a total of 2929 fewer questions would have been asked, yielding a 41.6% reduction in the total number of questions asked.
Branching rules corresponding to the eliminated CQs identified in
Table 2 are displayed in
Table 1. Yellow shading is used to represent observed answers and blue shading is used to represent predicted answers. For example, the representation of rule 1 implies that if the response to the question concerning vigorous activity is ‘0’, then questions #2 thru #6 can be skipped and their responses can be assumed ‘0’ as well.
6.1.2. Budget Sensitivity Analysis
We illustrate budget sensitivity by increasing the maximum number of allowable changed answers to 1.1%. That is, we could use a budget of 77 allowable changed answers to see what type of impact that makes on the number of questions that need to be asked. Results are shown in
Table S1 in the supplementary materials. By increasing the budget by this small amount, one additional CQ (indicated in the table by an asterisk) can be eliminated resulting in a total of 3219 saved questions. The realized cost was 71. For just one more changed answer in the historical surveys, an additional 290 questions were eliminated. Branching rules require only a small modification of the branching rules formulated from
Table 1. Namely, the blue region for rule 2 in
Table 1 would now extend all the way to question #10.
6.1.3. Alternative Orderings
The function level questions for the historical surveys are ordered from highest to lowest with respect to physical capabilities. Because the questions can be ordered in terms of function, it would not be natural to consider all permutations as equally viable orderings. However, two alternative permutations that would be natural to consider are reverse order, where the questions are ordered from lowest functional level to highest, and inside out order where consecutive questions are separated.
Would ordering the questions in either of these alternative ways yield a larger overall benefit compared to the original ordering? The inputted survey data is an matrix of 0/1 responses. To explore the effect of alternative orderings of the questions, all we have to do is permute the q columns in the data matrix appropriately, and then proceed with the analysis as before.
Next, consider the inside out ordering which changes the sequence of the questions numbers to 1, 3, 5, 7, 9, 10, 8, 6, 4, and 2. The intuition here is that consecutive questions are highly correlated, so separating them in space may lead to more efficient branching rules. For a budget of 70 allowable changed answers, the 15 CQs shown in
Table S4 of the supplementary materials were identified for elimination for a total reduction of 3255 CQs. The inside out ordering leads to an increase 330 saved questions. Corresponding branching rules are shown in
Table S5 of the supplementary materials. The inside our order analysis leads to one more branching, and increases the percentage of questions saved from 41.6% (initial analysis) to 46.2%.
6.2. Daily Activity Questions
Patients were asked if their health limited them in each of seven daily activities. A total of 744 historical surveys were available to analyze these questions. The responses were coded as “0” if the patient felt they needed no help, and “1” if they needed some or a lot of help. The activities queried are shown in
Table 3.
The inputted
budget for the number of changed answers in the historical surveys was 1% of the 5208 total number of answers provided, or 52 answers. The inputted
min.benefit was 50. The results in
Table 4 provide the information needed to implement the mined branching rules into the survey. The overall cost of eliminating the 4 CQs is 51 and the total number of saved questions is 2265. That is, for a cost of 51 changed answers in the historical surveys, a total of 2265 fewer questions would have been asked, yielding a 43.5% reduction in the total number of questions asked. Branching rules corresponding to the eliminated CQs identified in
Table 4 are shown in
Table 3.
6.3. Mood Questions
Patients were asked to what extent they agreed with statements concerning how they have been feeling, on the average, in the past week. A total of 750 historical surveys were available to analyze these questions. The responses were coded as “0” if the patient did not agree very much with the statement and “1” if the patient generally agreed. The statements presented to the patient are shown in
Table 5.
The inputted
budget for the number of changed answers in the historical surveys was 1% of the 10,500 total number of answers provided, or 105 answers. The inputted
min.benefit was 50. The results in
Table 6 provide the information needed to implement the mined branching rules into the survey. The overall cost of eliminating the 16 CQs is 101 and the total number of saved questions is 3474, yielding a 33.1% reduction in the total number of questions asked. Branching rules corresponding to the eliminated CQs identified in
Table 6 are shown in
Table 5.
6.4. Social Support Questions
Patients were asked about their social support. A total of 750 historical surveys were available to analyze these questions. The responses were coded as “0” if the patient felt they need more support and “1” if the patient felt their support was adequate. The statements presented to the patient are shown in
Table 7.
The inputted
budget for the number of changed answers in the historical surveys was 1% of the 9000 total number of answers provided, or 90 answers. The inputted
min.benefit was 50. The results in
Table 8 provide the information needed to implement the mined branching rules into the survey. The overall cost of eliminating the 8 CQs is 89 and the total number of saved questions is 4837, yielding a 53.7% reduction in the total number of questions asked. Branching rules corresponding to the eliminated CQs identified in
Table 8 are displayed in
Table 7.
7. Summary
We have developed a data mining algorithm for identifying common patterns in the answers to questions provided in historical surveys. The algorithm allows high frequency patterns to be the basis for the implementation of branching rules in a redesign of the survey for future use. A key feature of the algorithm is that it is designed to control the error rate incurred through the use of branching rules that implicitly impute a respondent’s answer to an unasked question. The data mining algorithm works on binary responses, which for our application were obtained by dichotomizing question responses. Adapting the algorithm for multi-level responses could be useful future work, though it will require a proportionally larger size repository of historical surveys.
We applied the data mining algorithm to four sections of a geriatric assessment survey covering areas of functional activity, daily function, mood and social support. The number of questions in these sections of the survey is 10, 7, 14 and 12, respectively. Allowing no more than 5% discrepancy between actual responses and imputed responses within each of the sections, our algorithm produced branching rules that decrease the number of questions asked by 41.6%, 43.5%, 33.1% and 53.7% respectively. Execution time on a standard laptop computer of the algorithm for these four analyses was less than 1 min in each case.
The proposed branching rules, and the underlying data mining tool used to get them, enable a capability to streamline the geriatric assessment survey. All of the branching rules derived by the methodology will be vetted by a team of clinicians prior to implementing them into the survey in order to certify that key individual patient information elicited by the unabridged survey is not compromised by eliminating CQs on the basis of statistical trends.


