
Effect of Dissolved Oxygen and Immersion Time on the Corrosion Behaviour of Mild Steel in Bicarbonate/Chloride Solution


Abstract
:1. Introduction
2. Results and Discussion
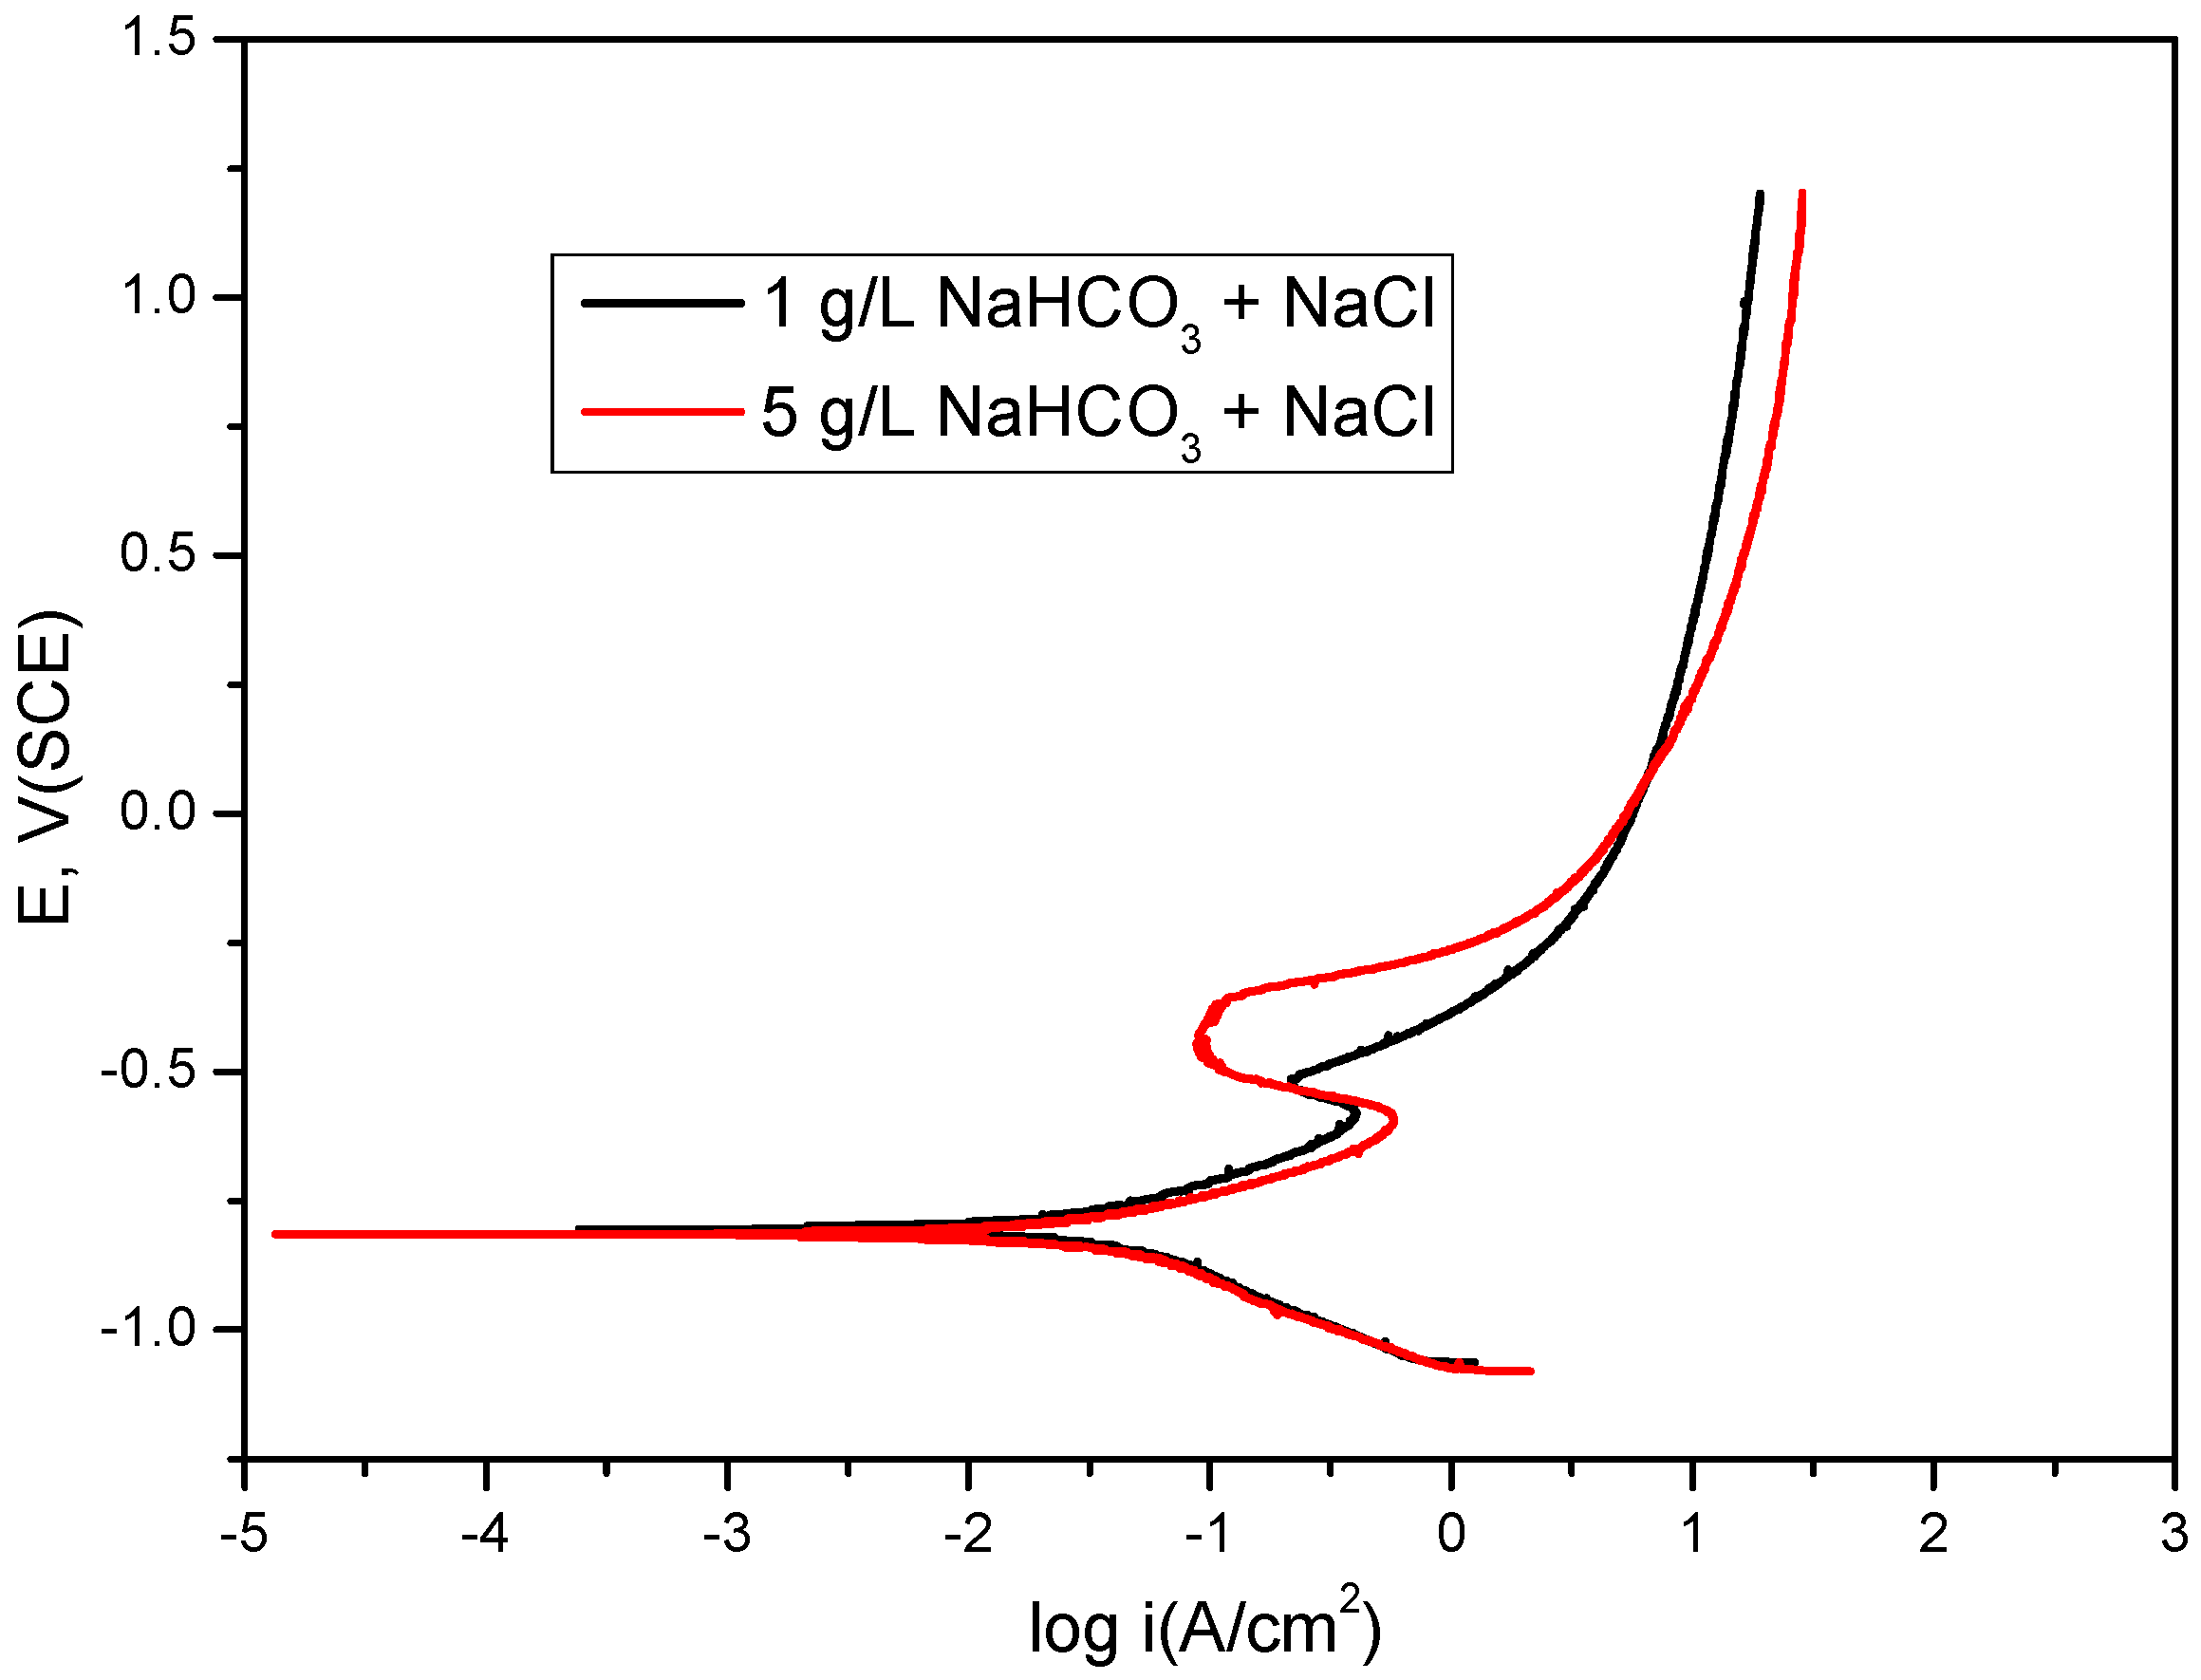
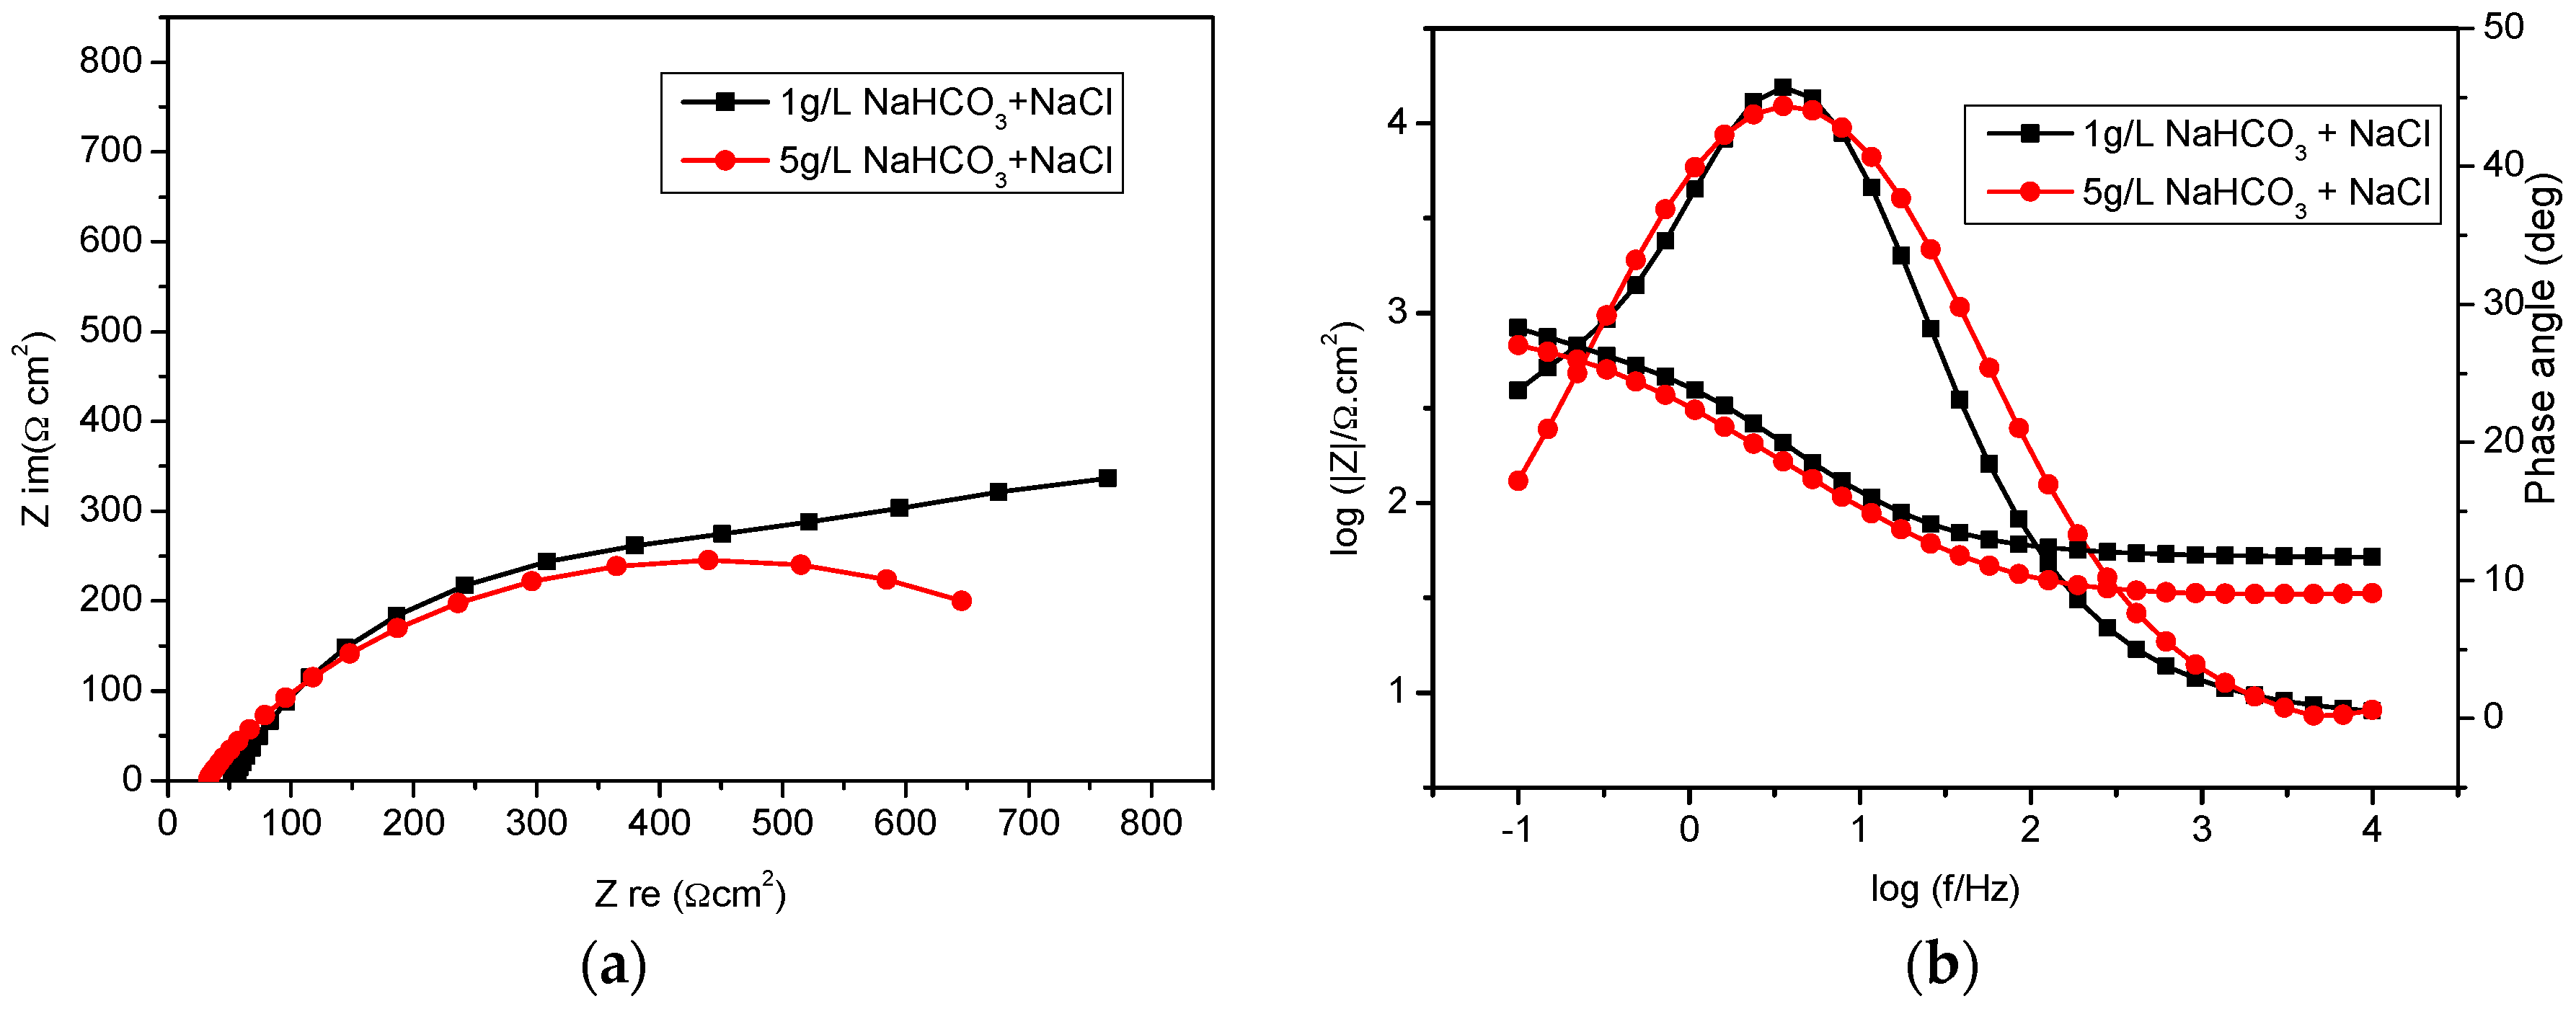
2.1. Bicarbonate Concentration
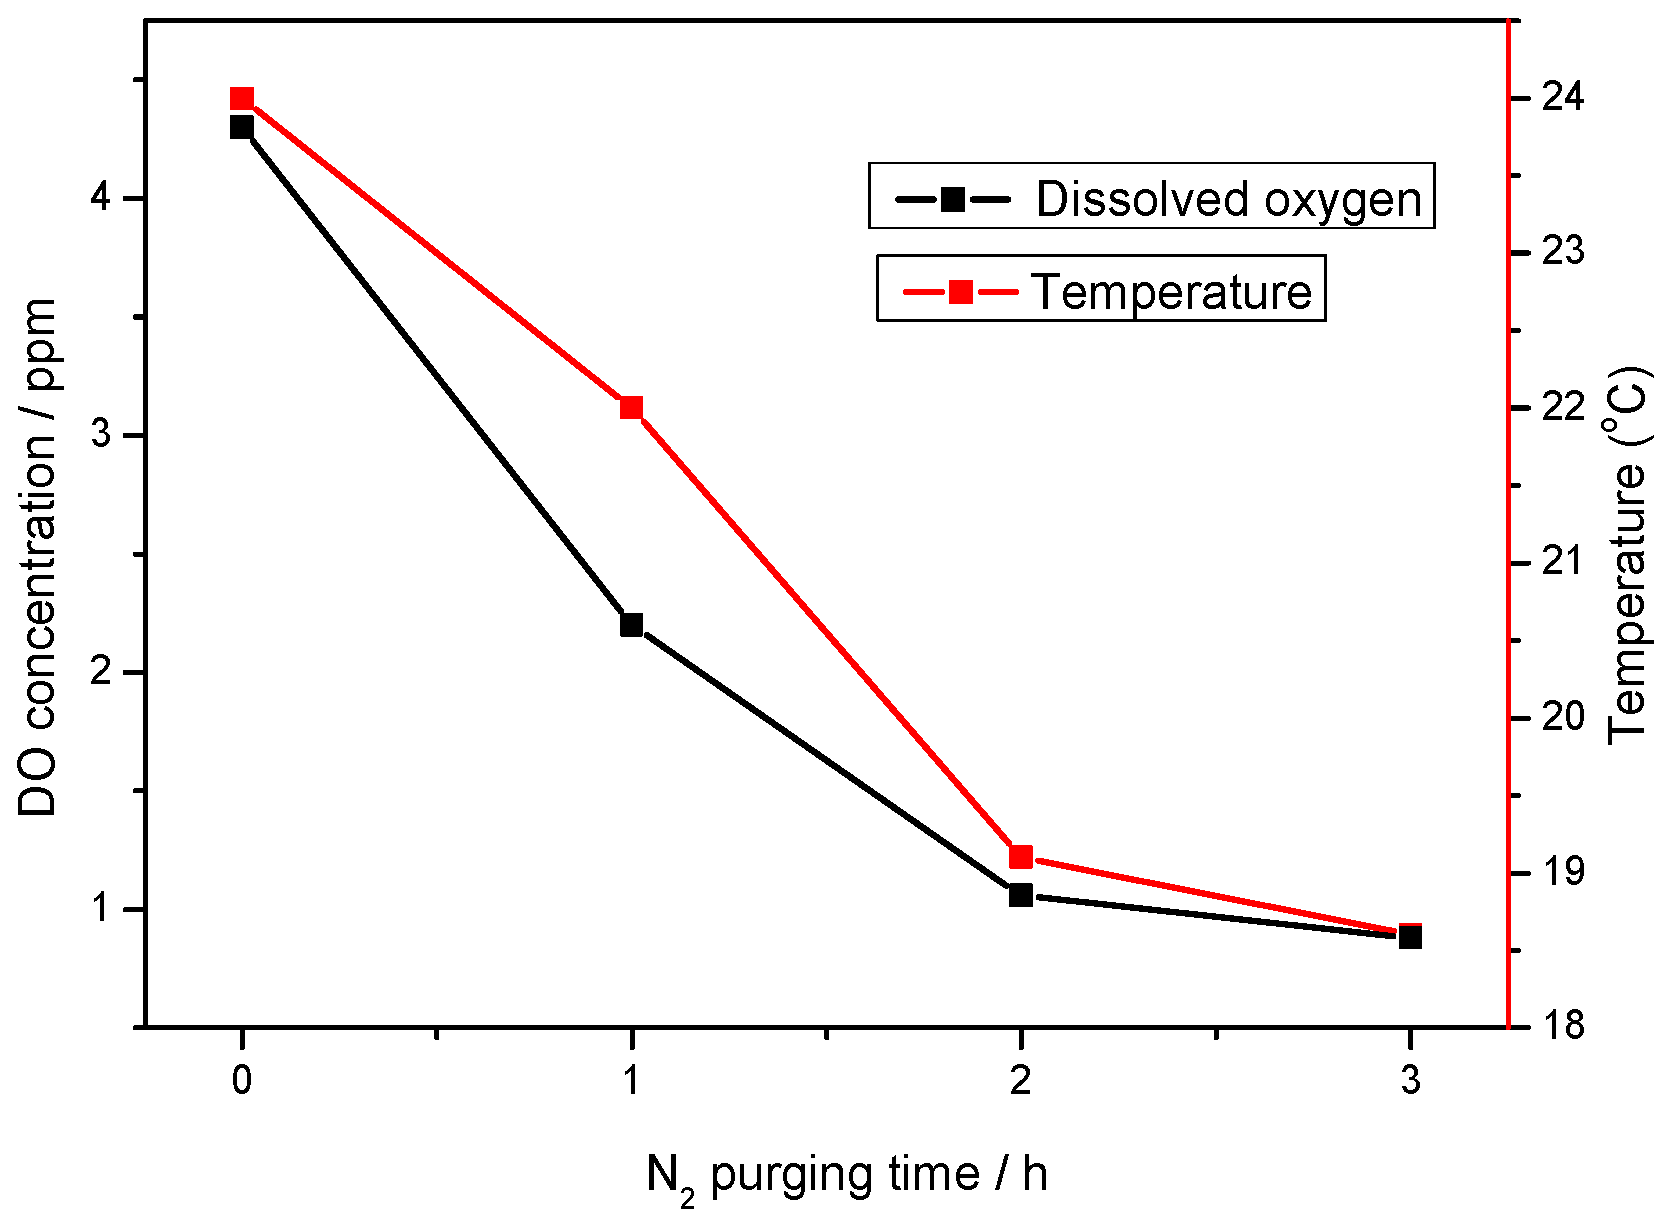
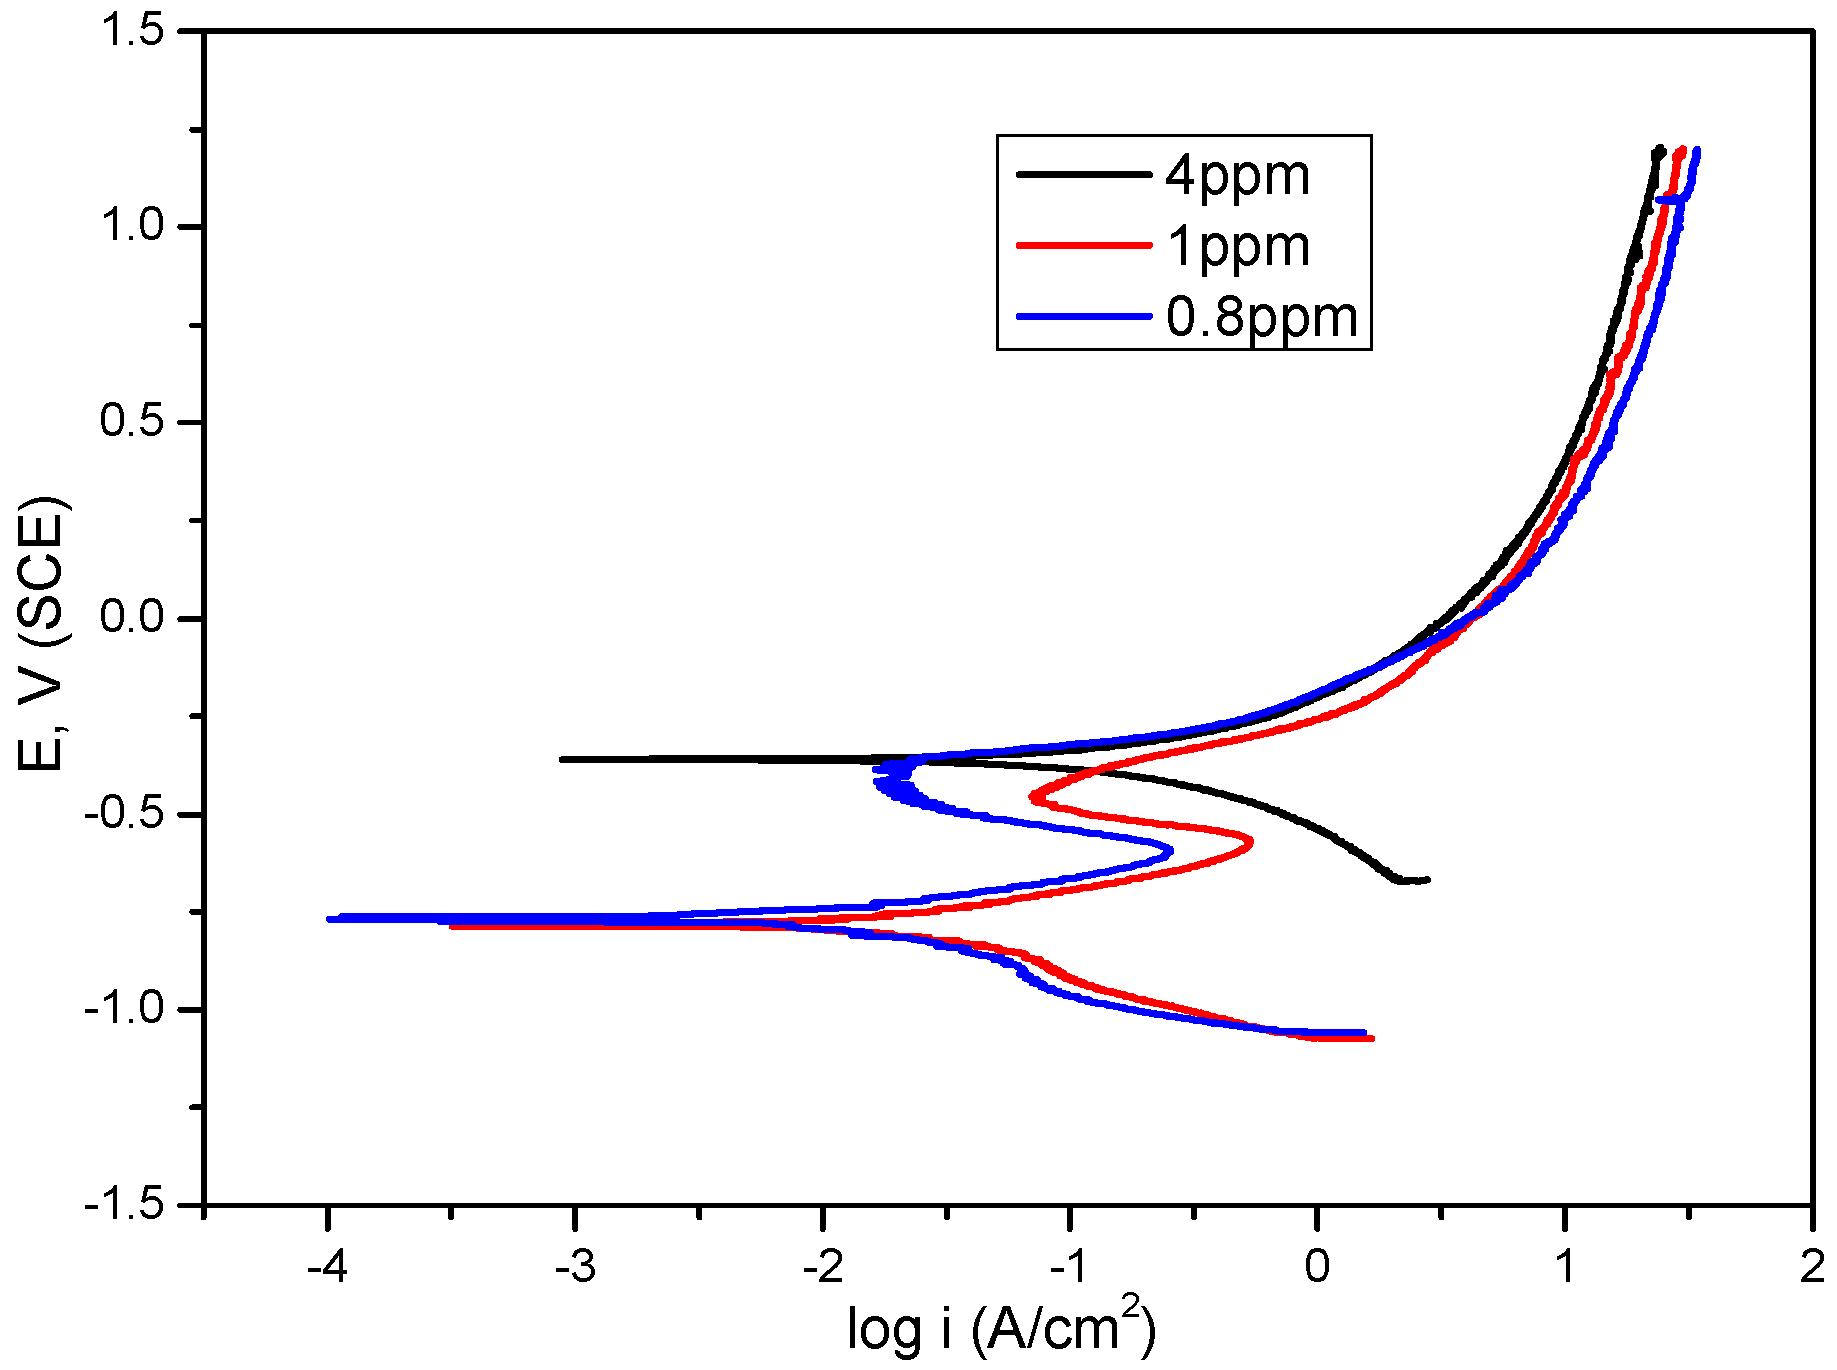
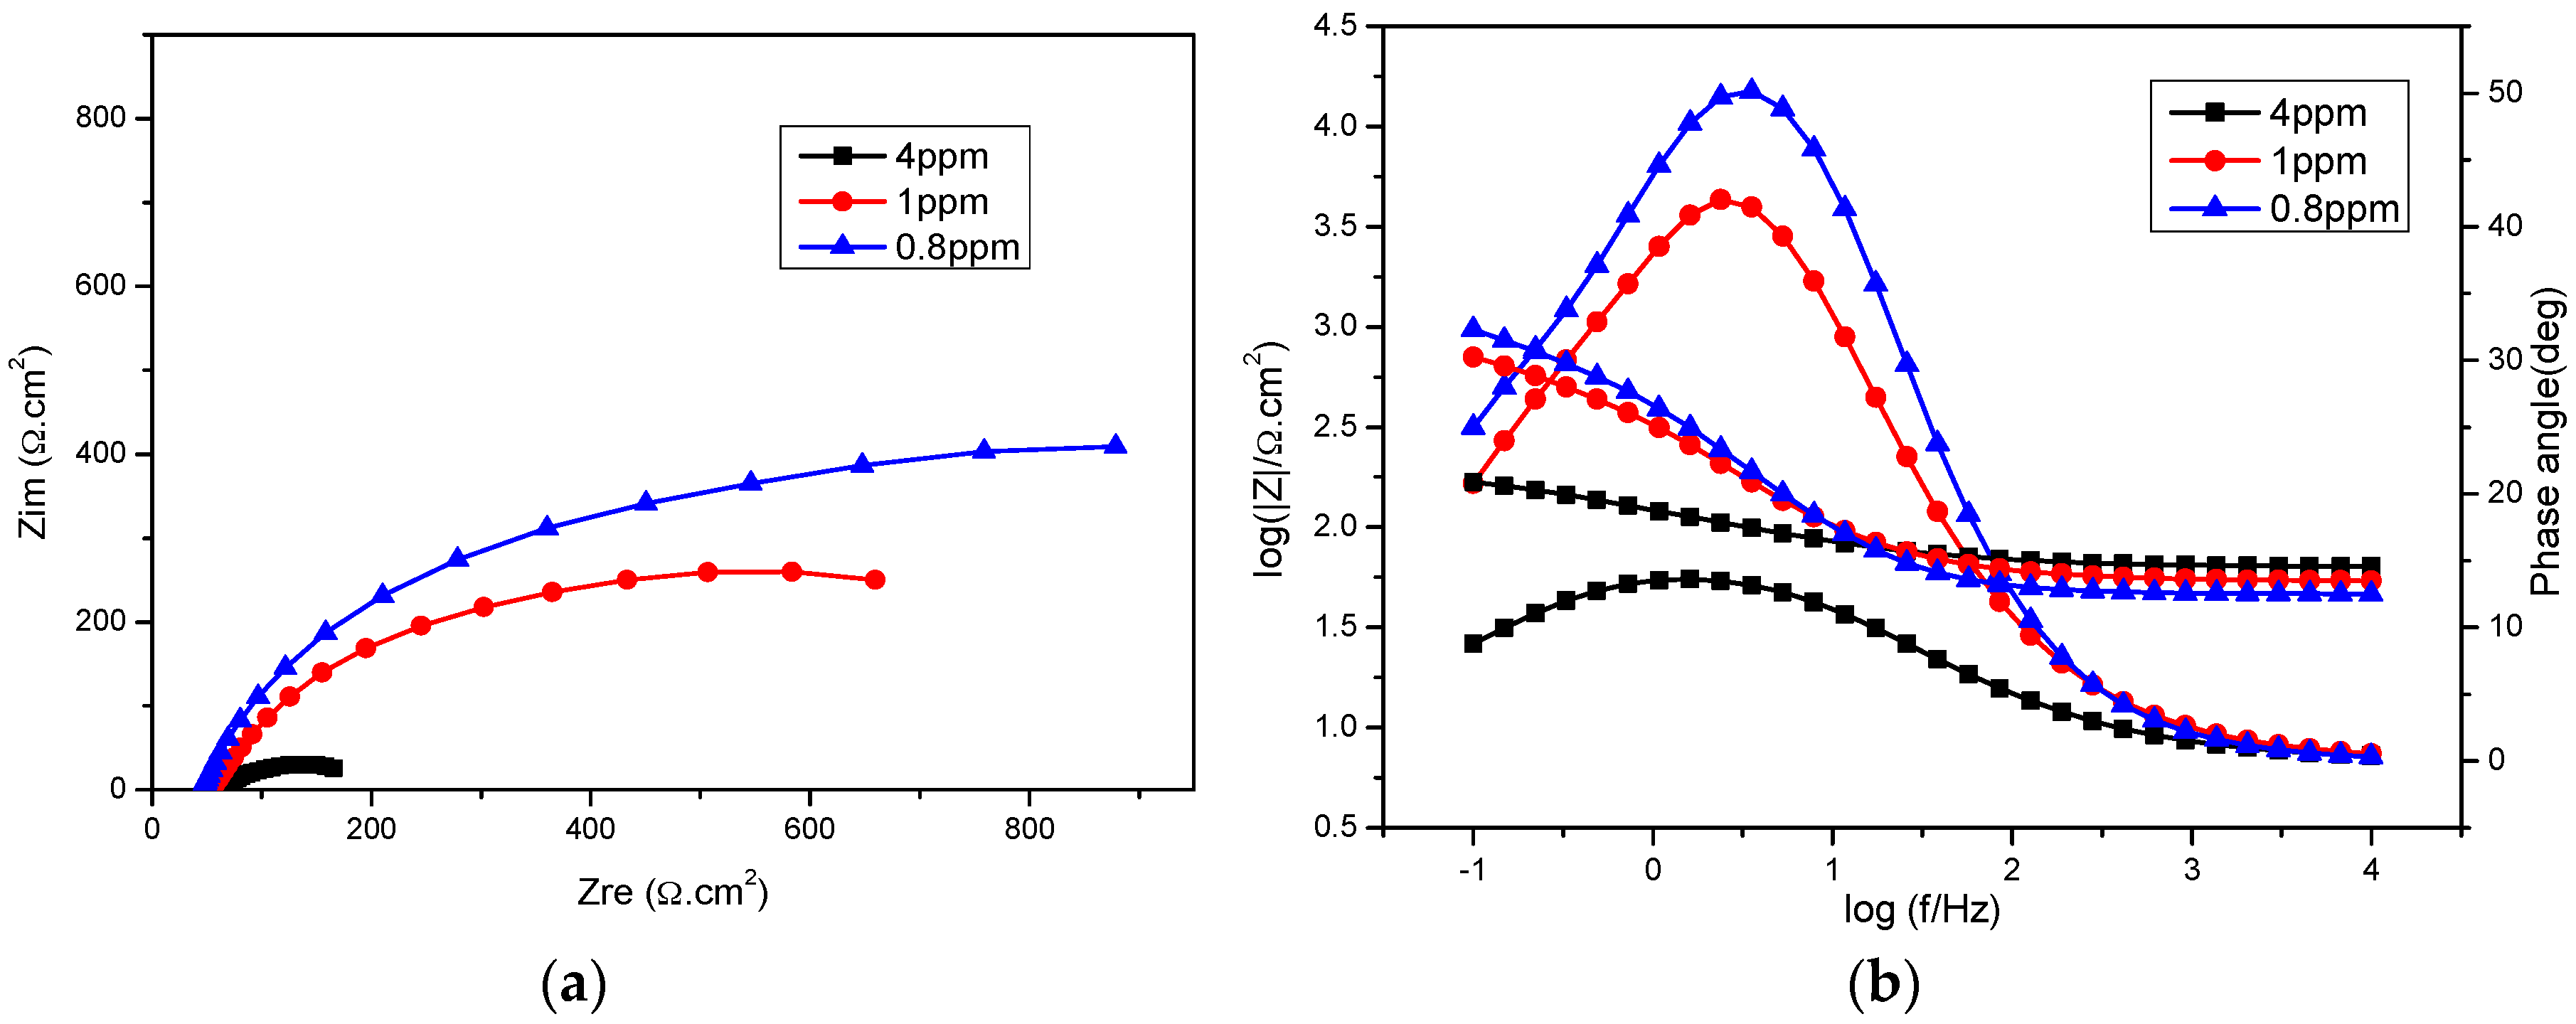
2.2. Dissolved Oxygen
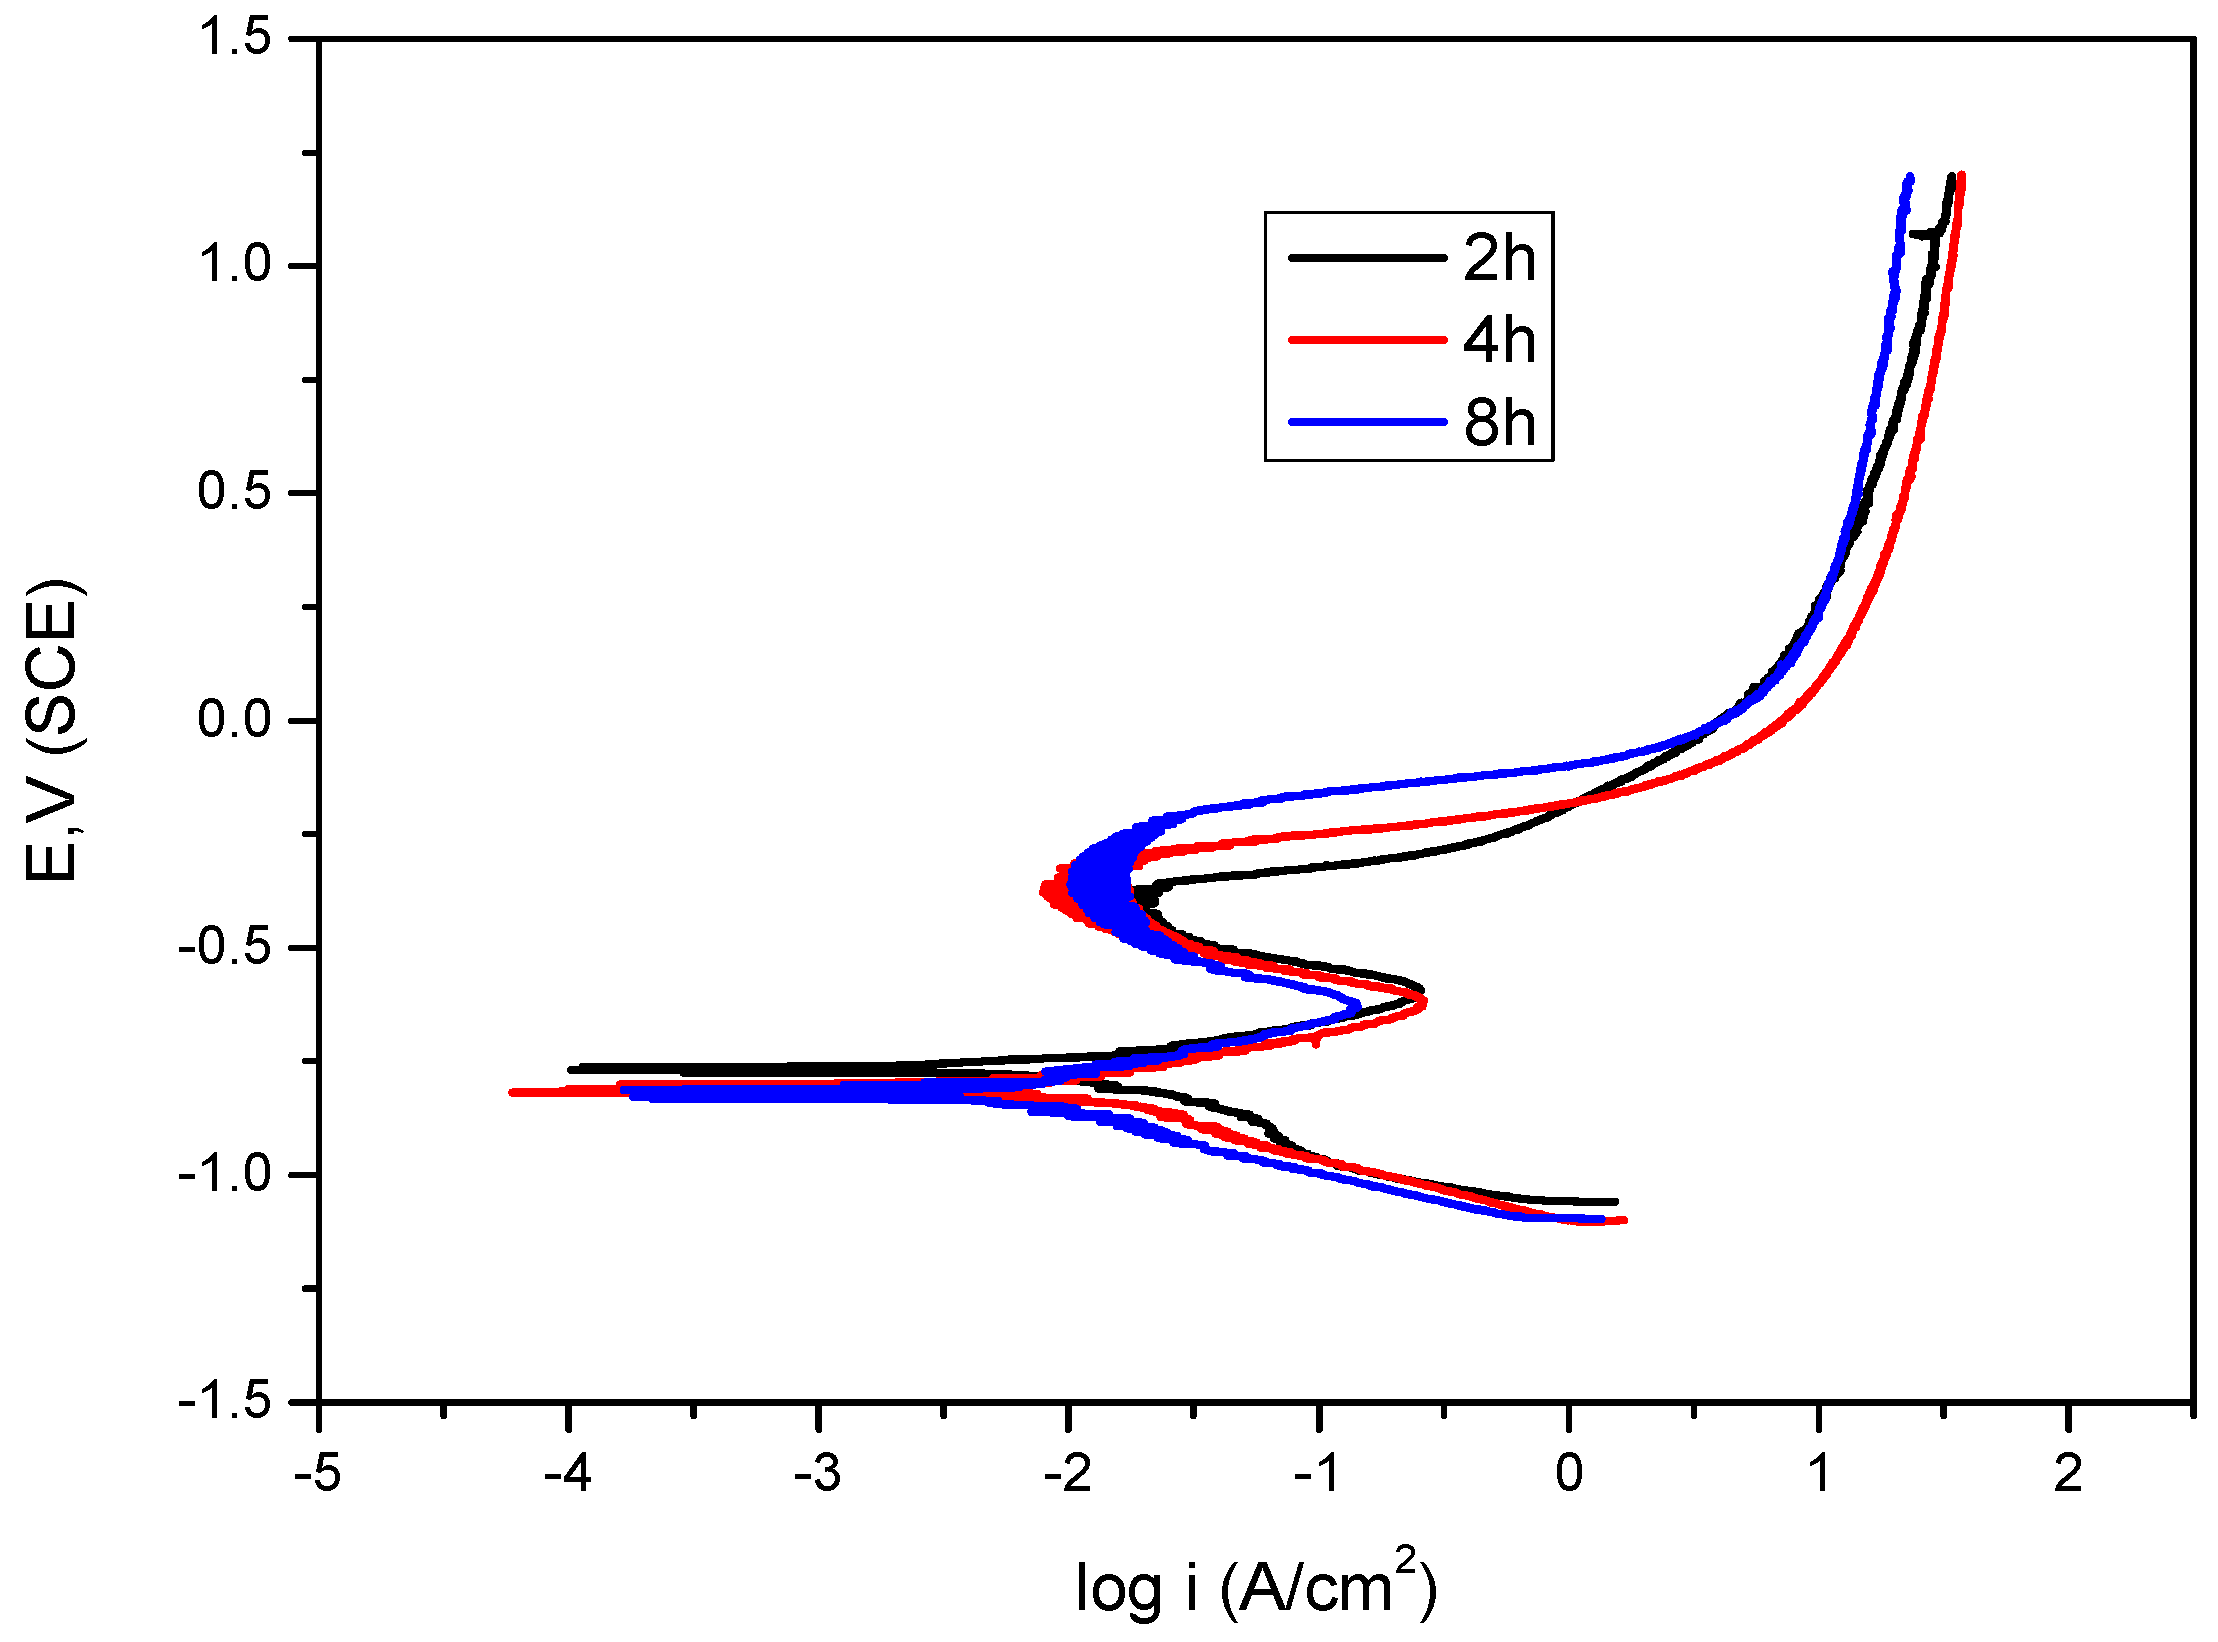
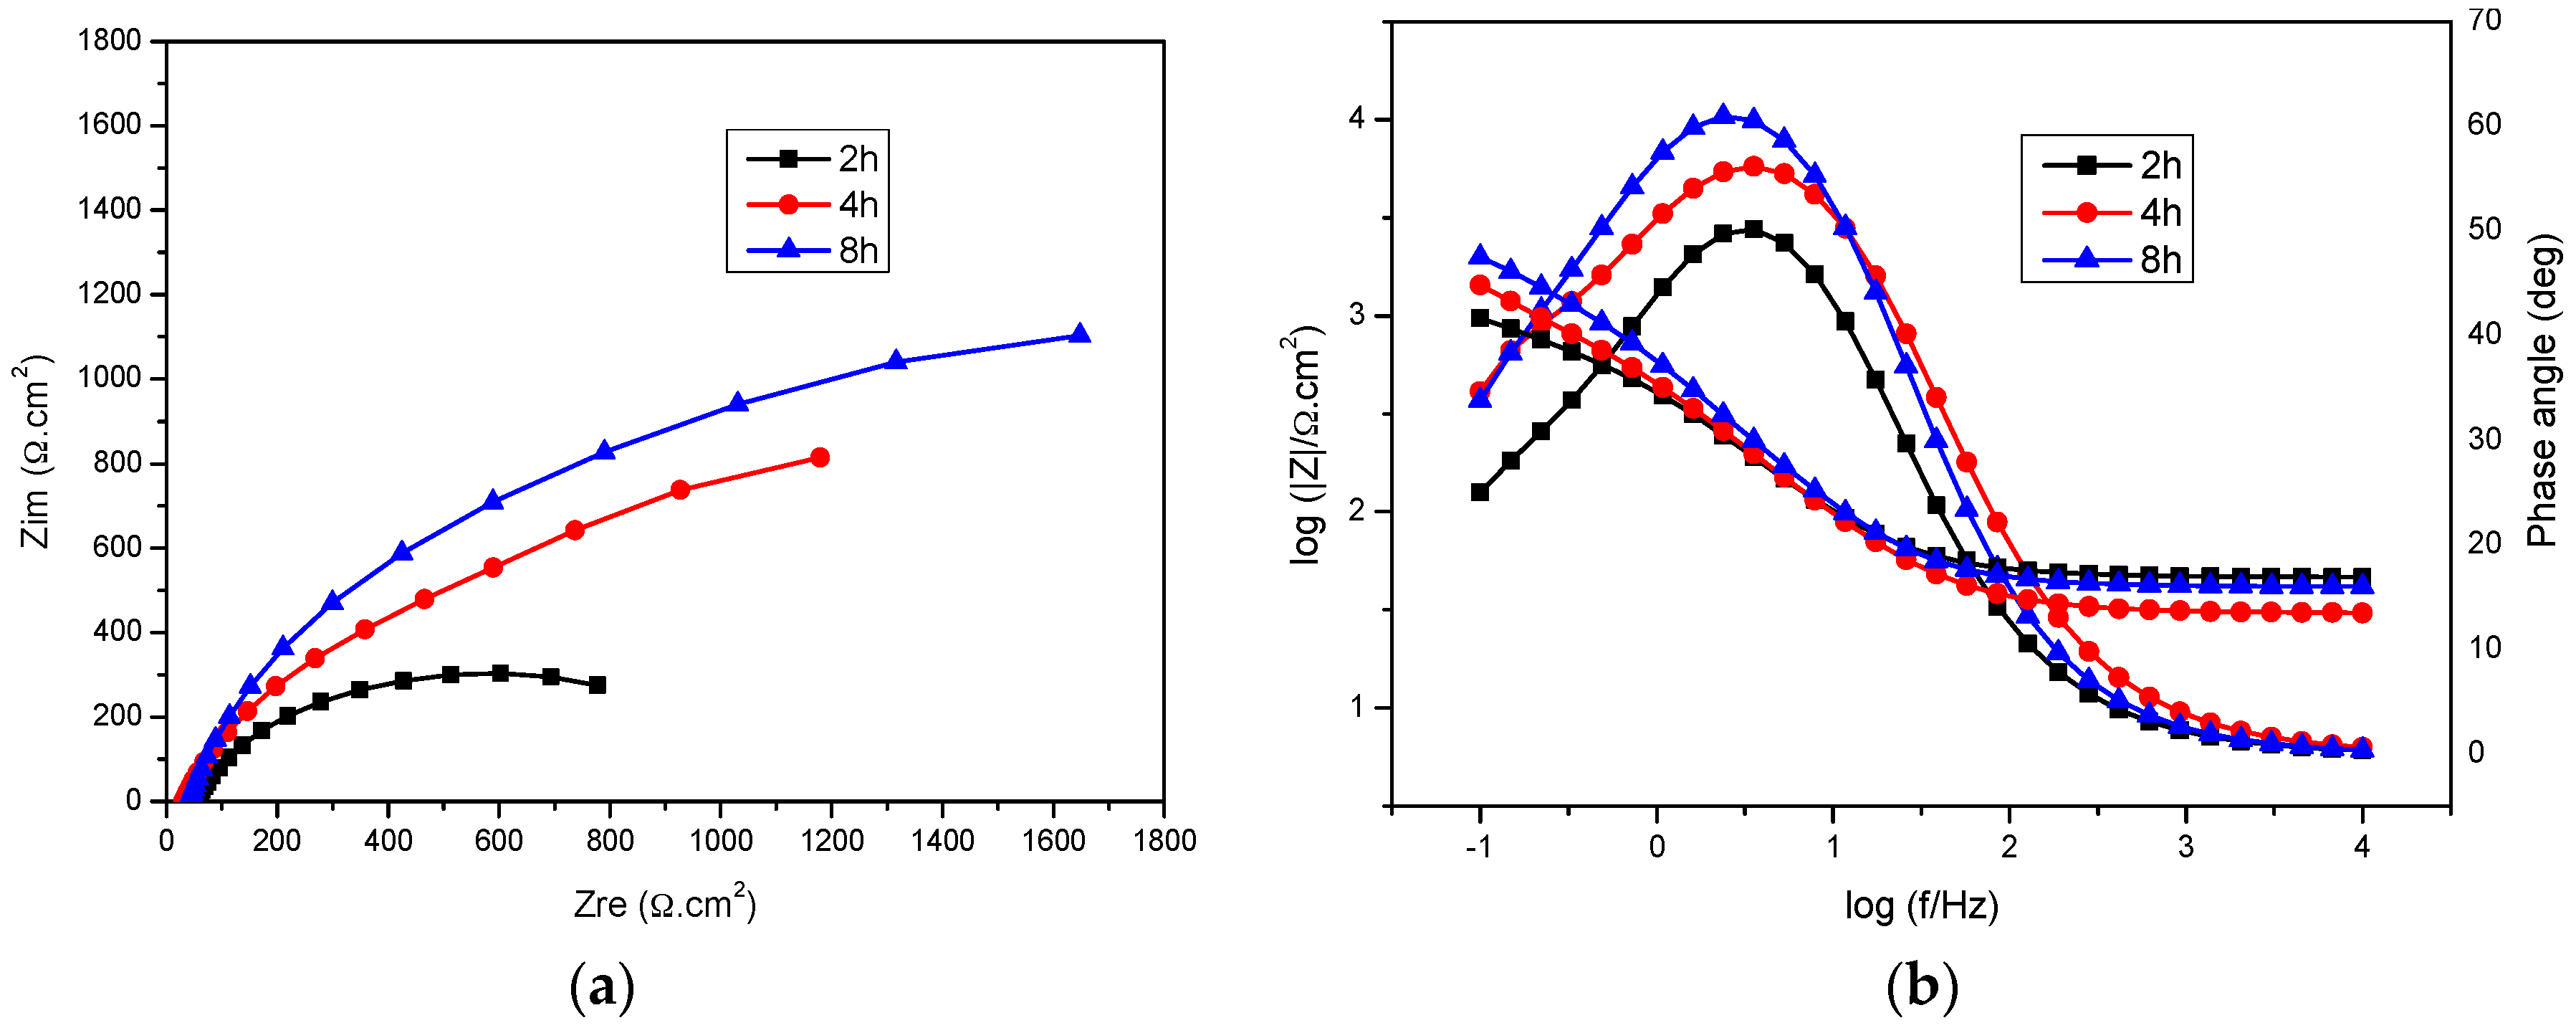
2.3. Immersion Time
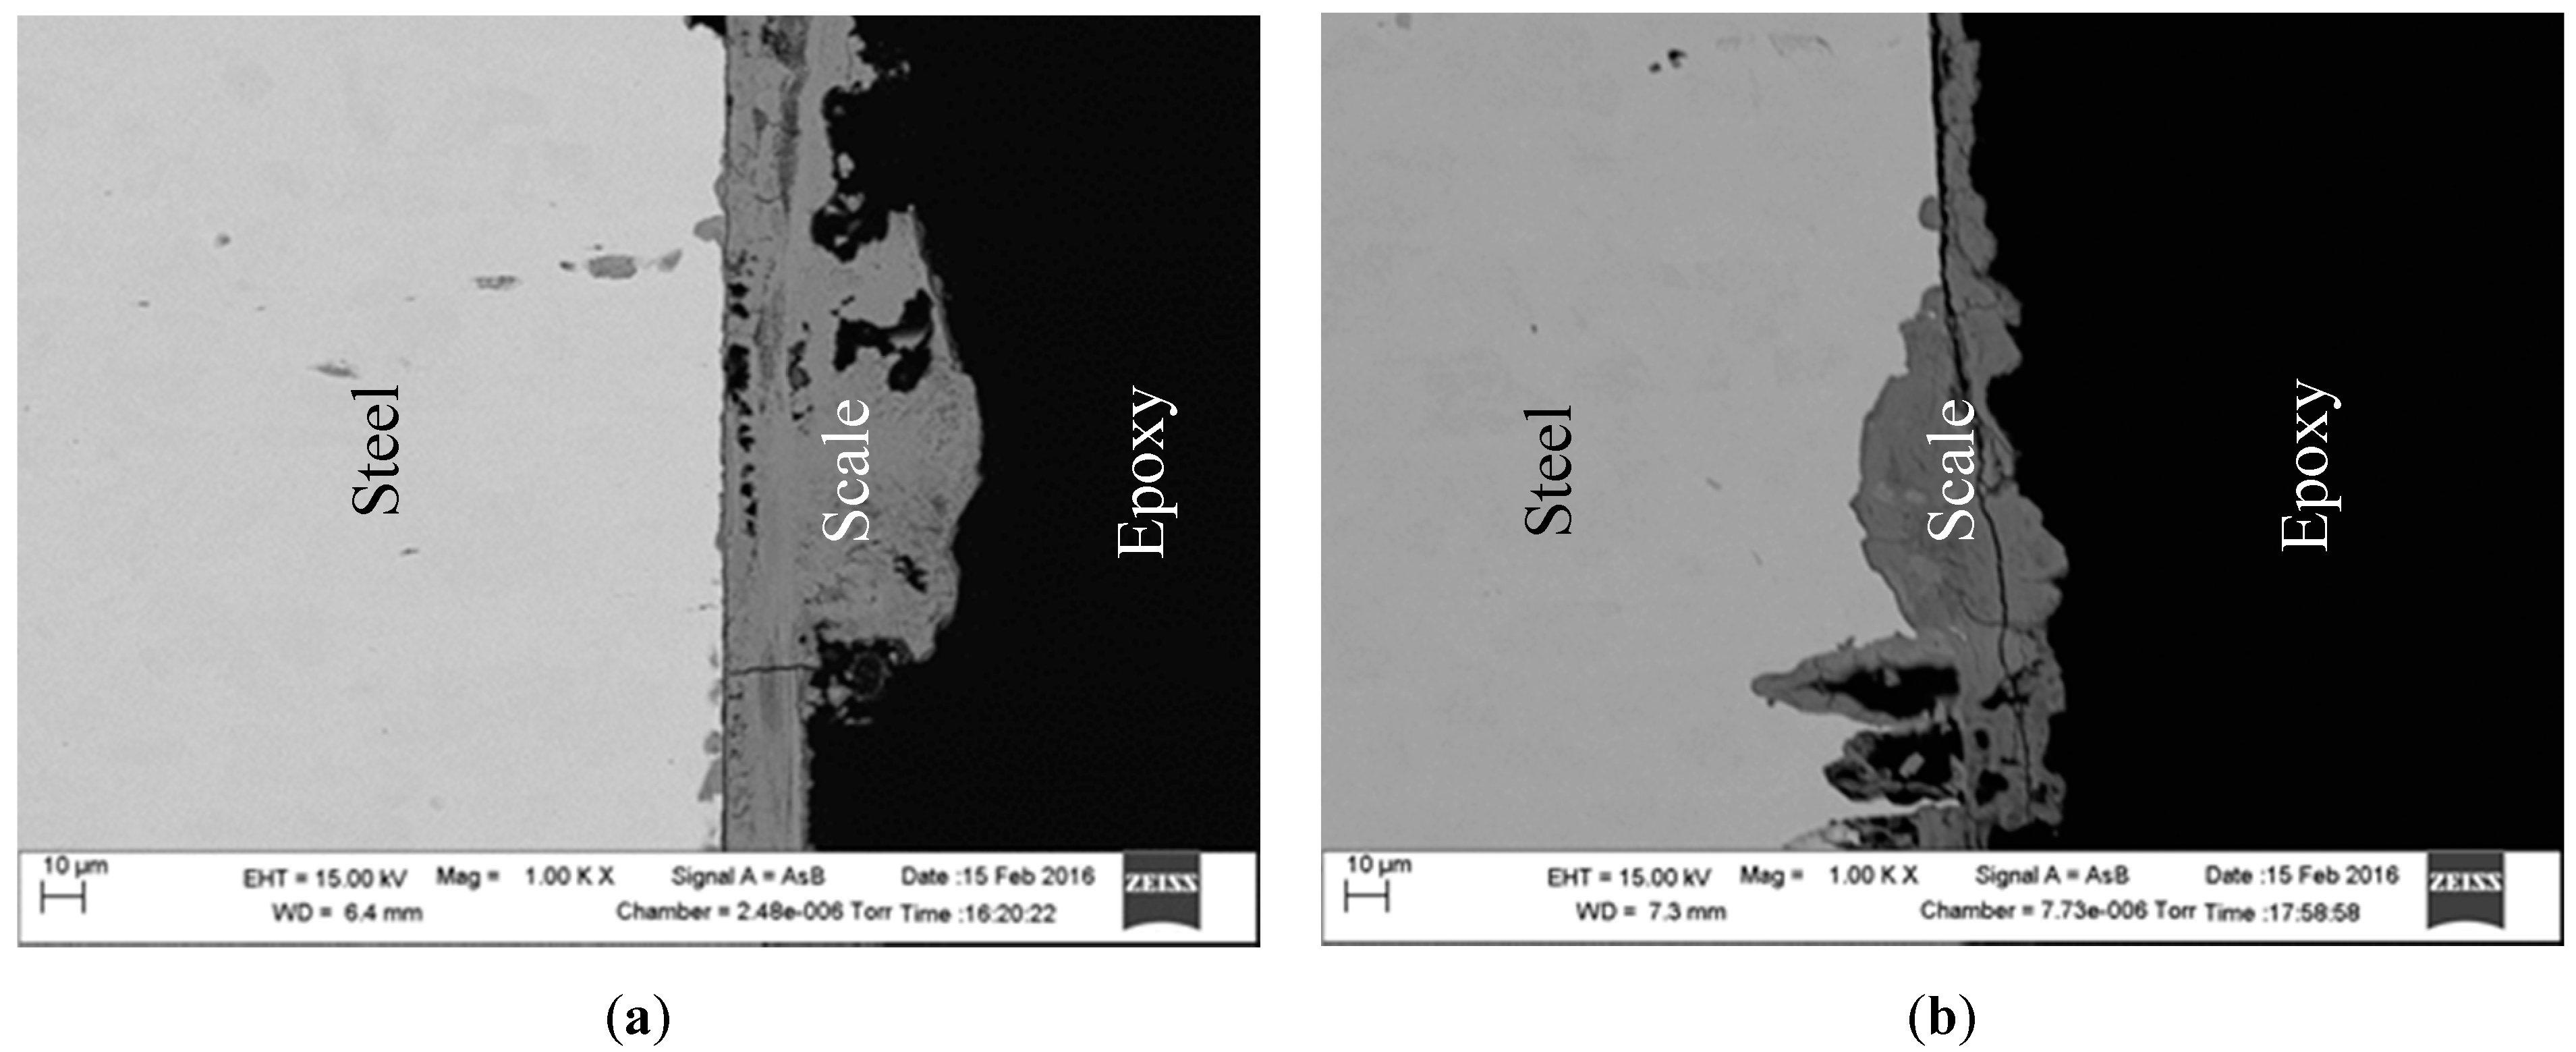
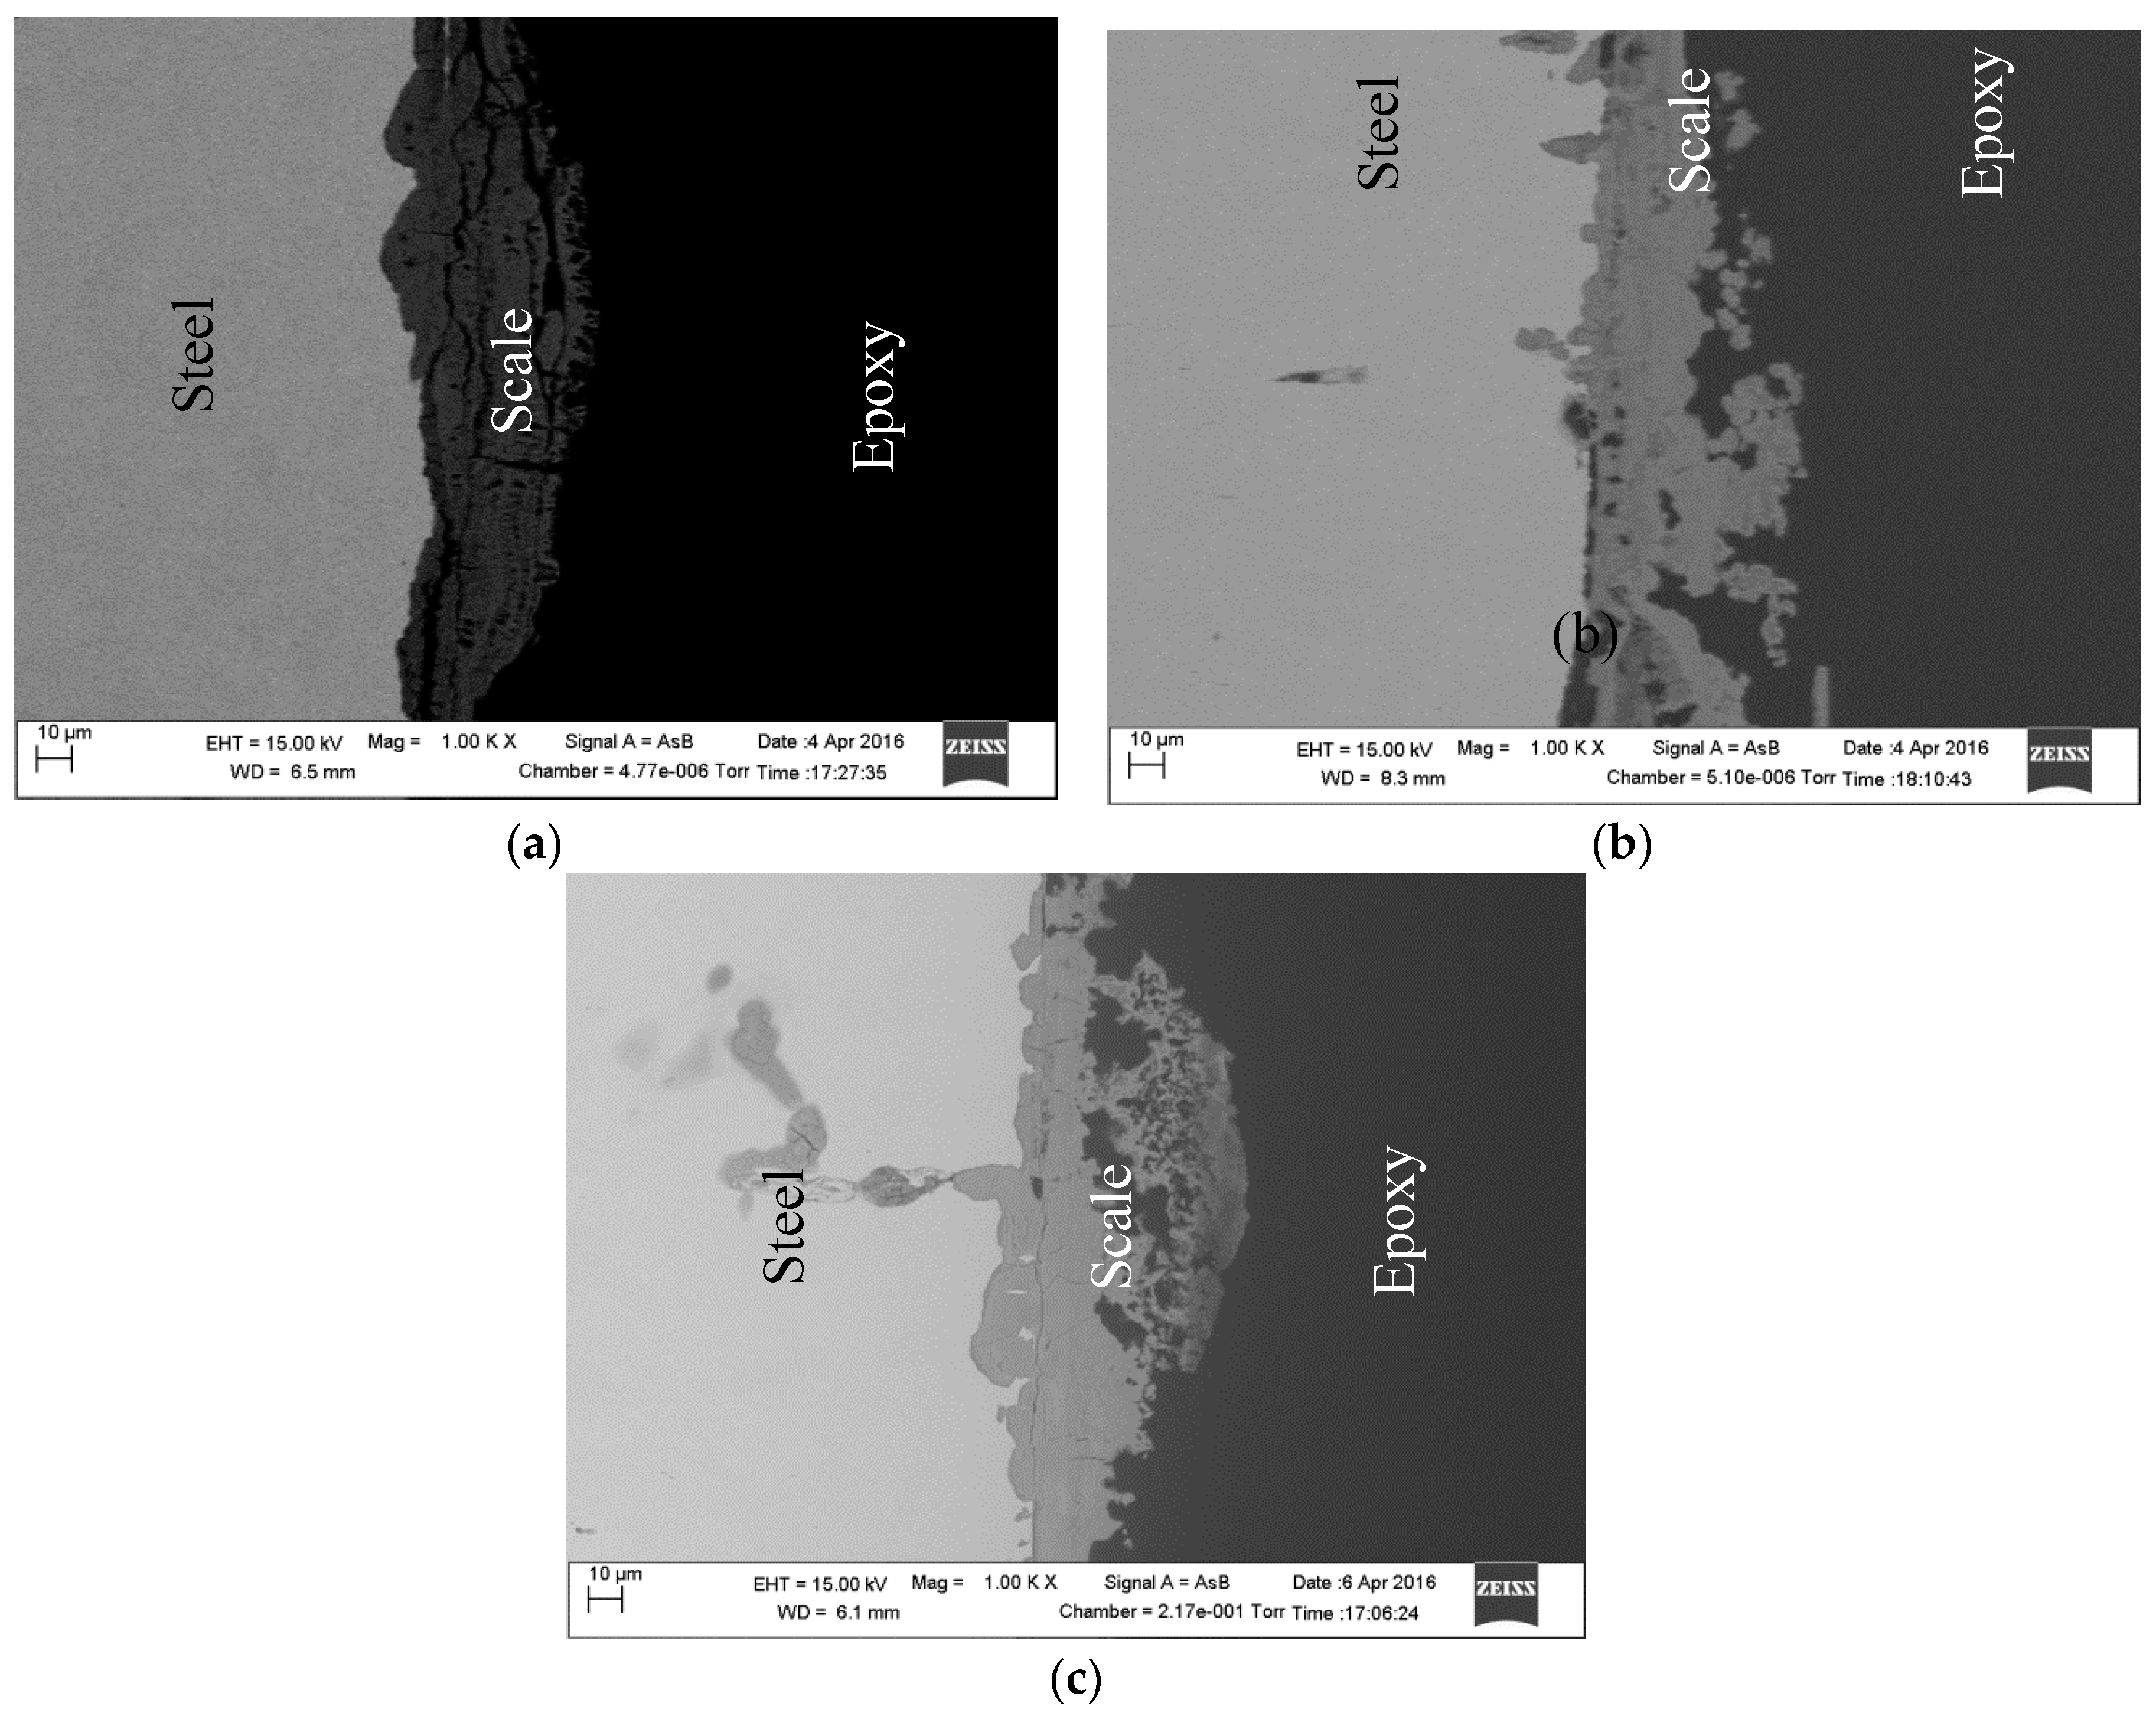
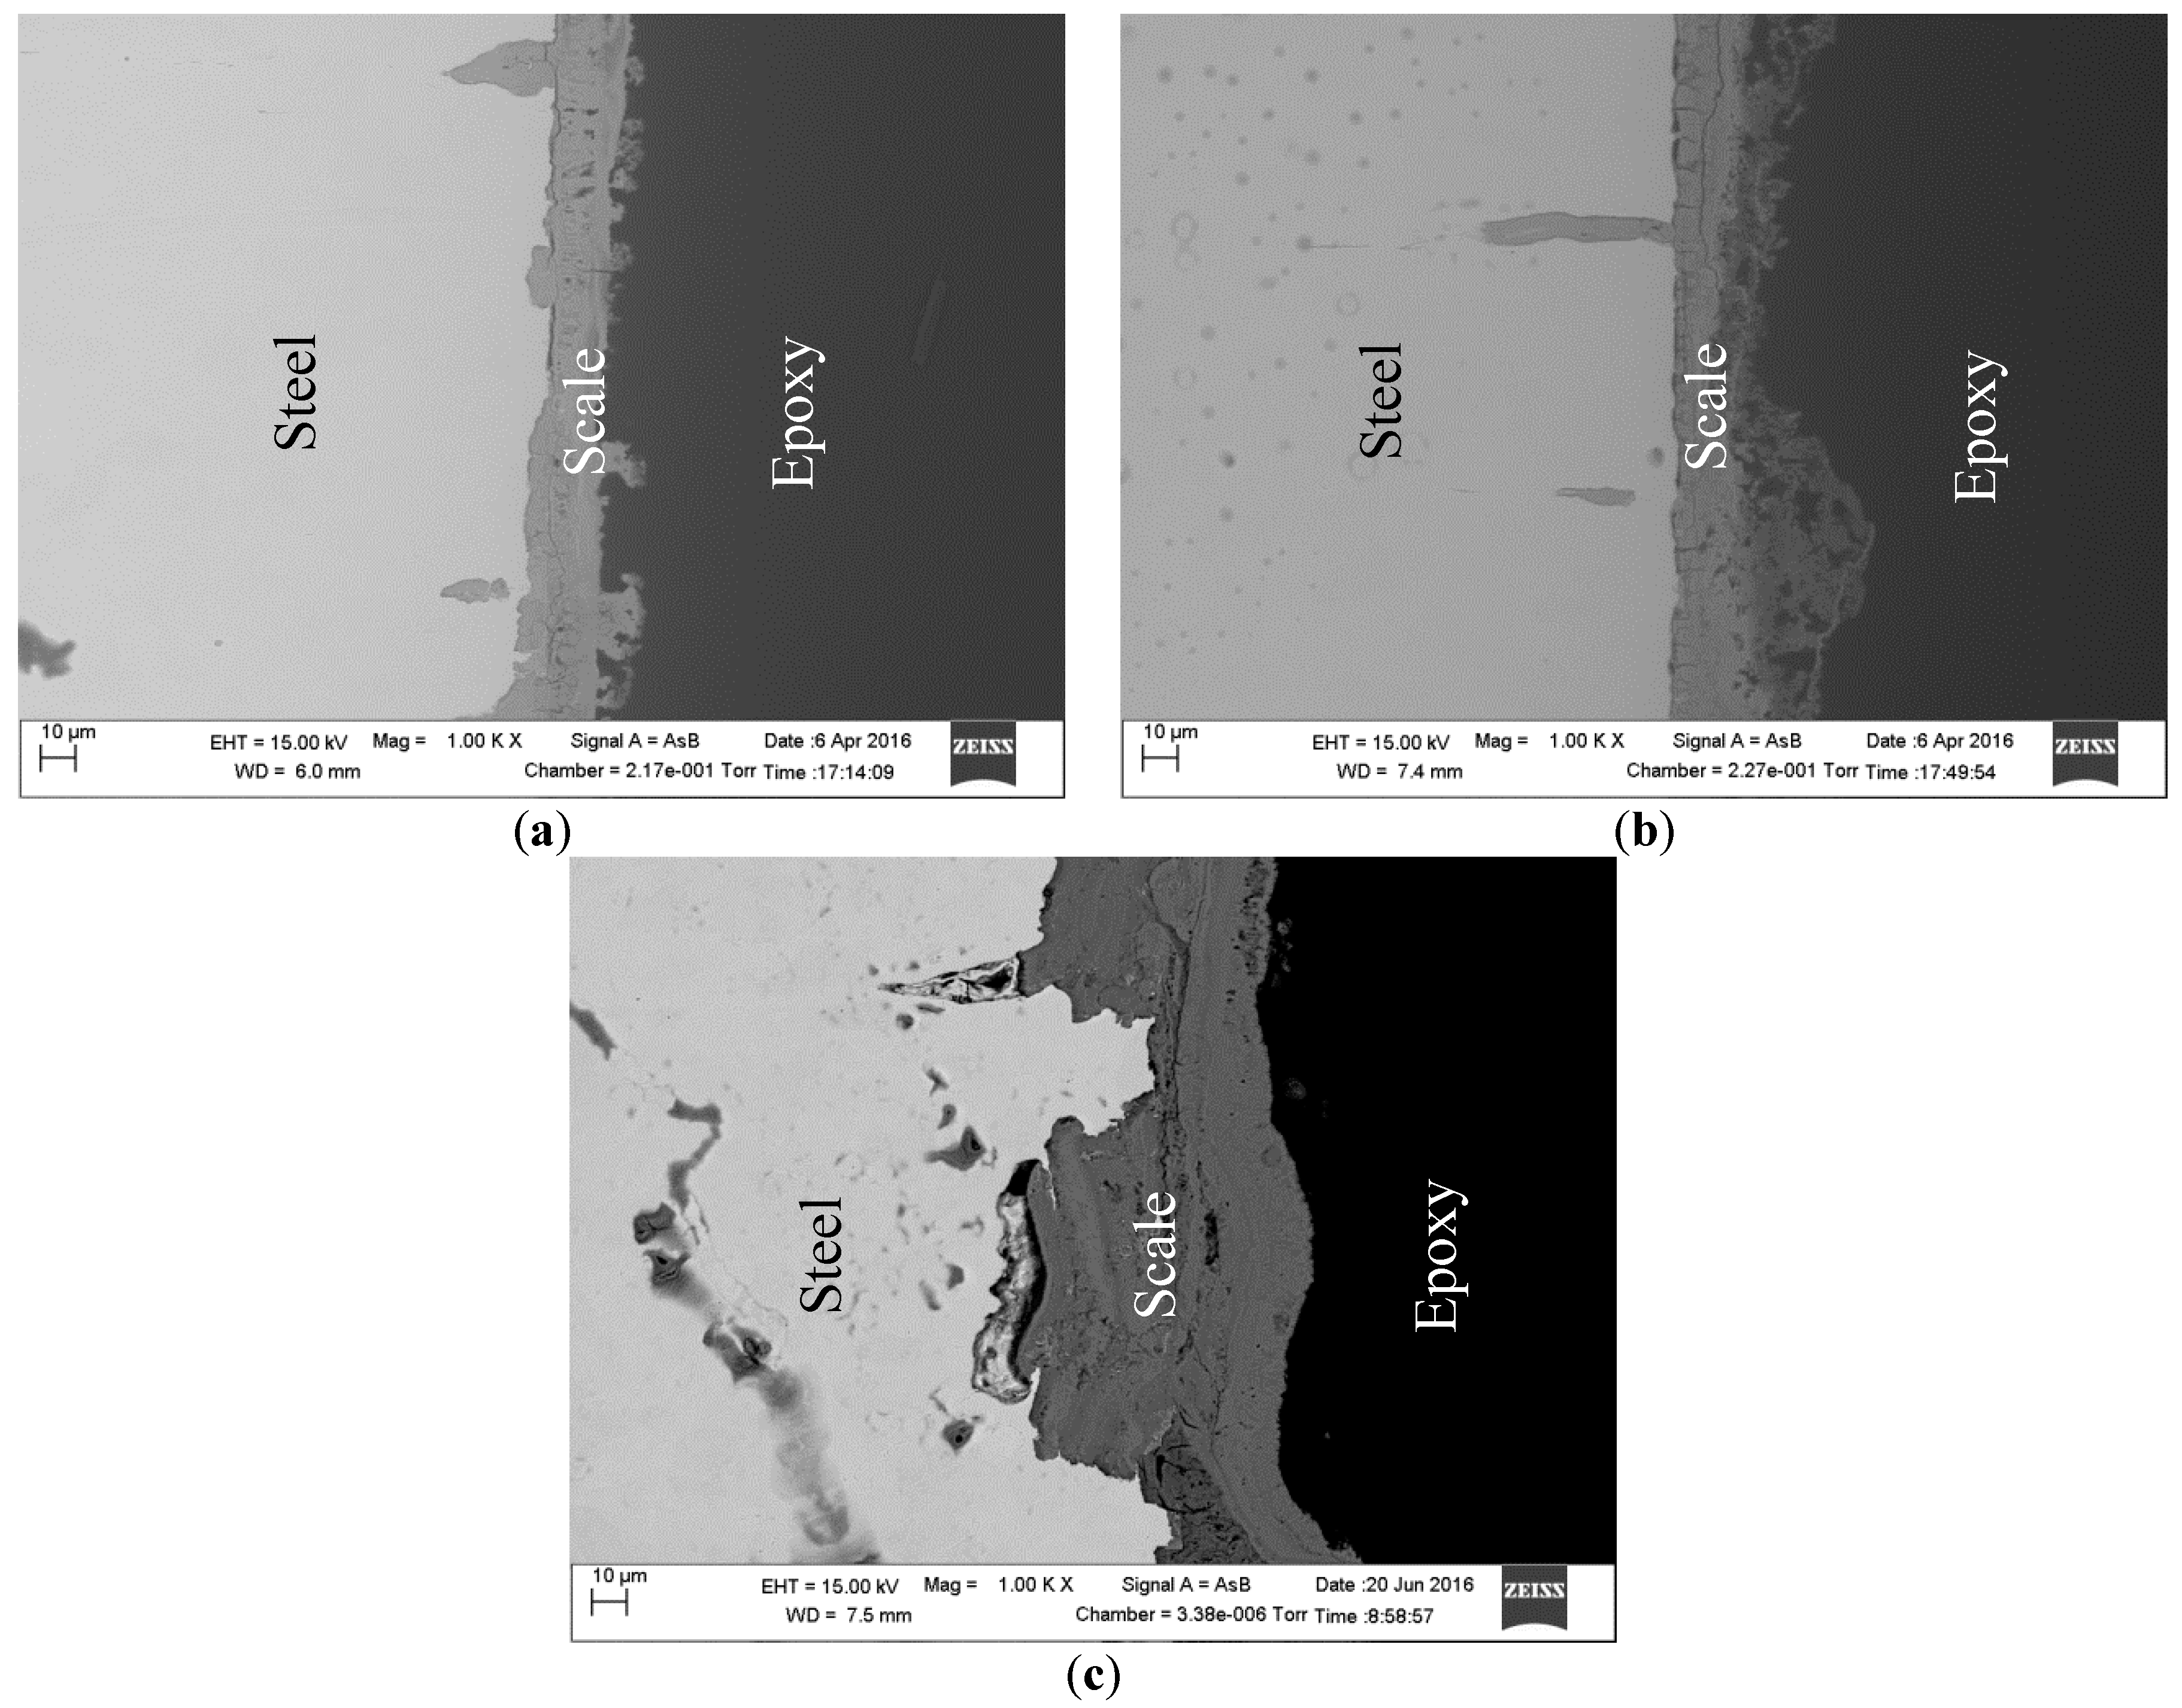
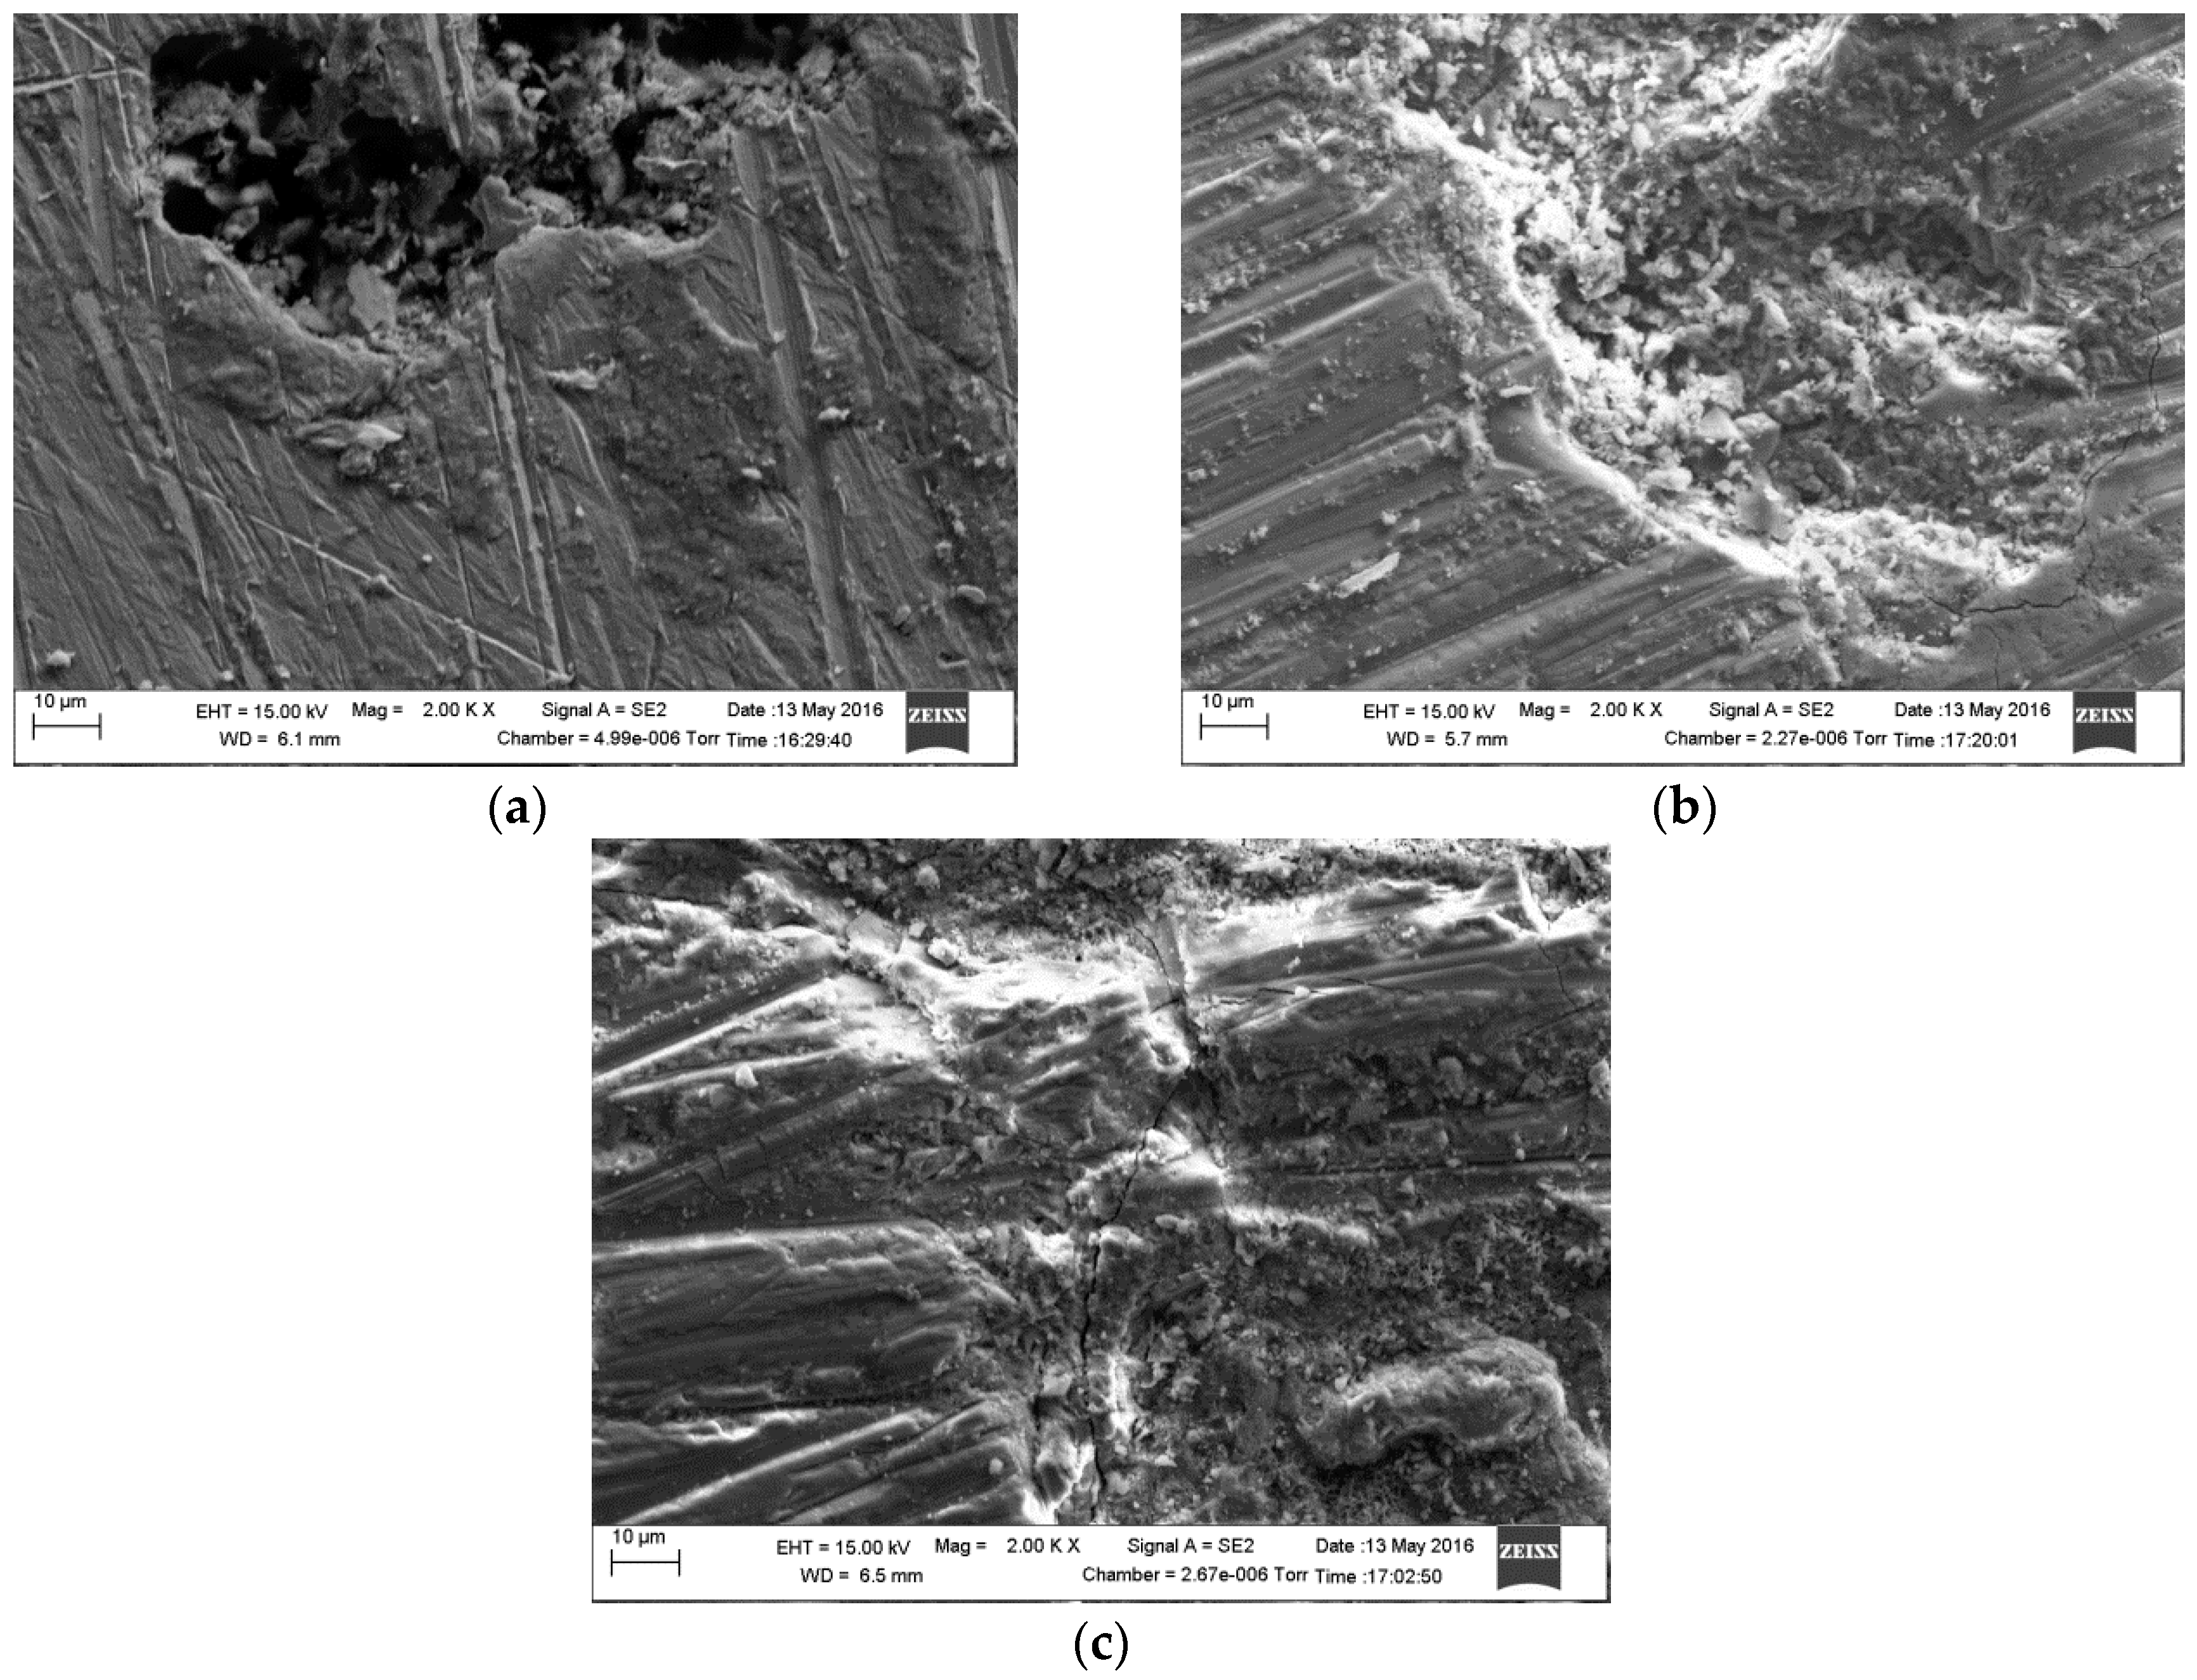
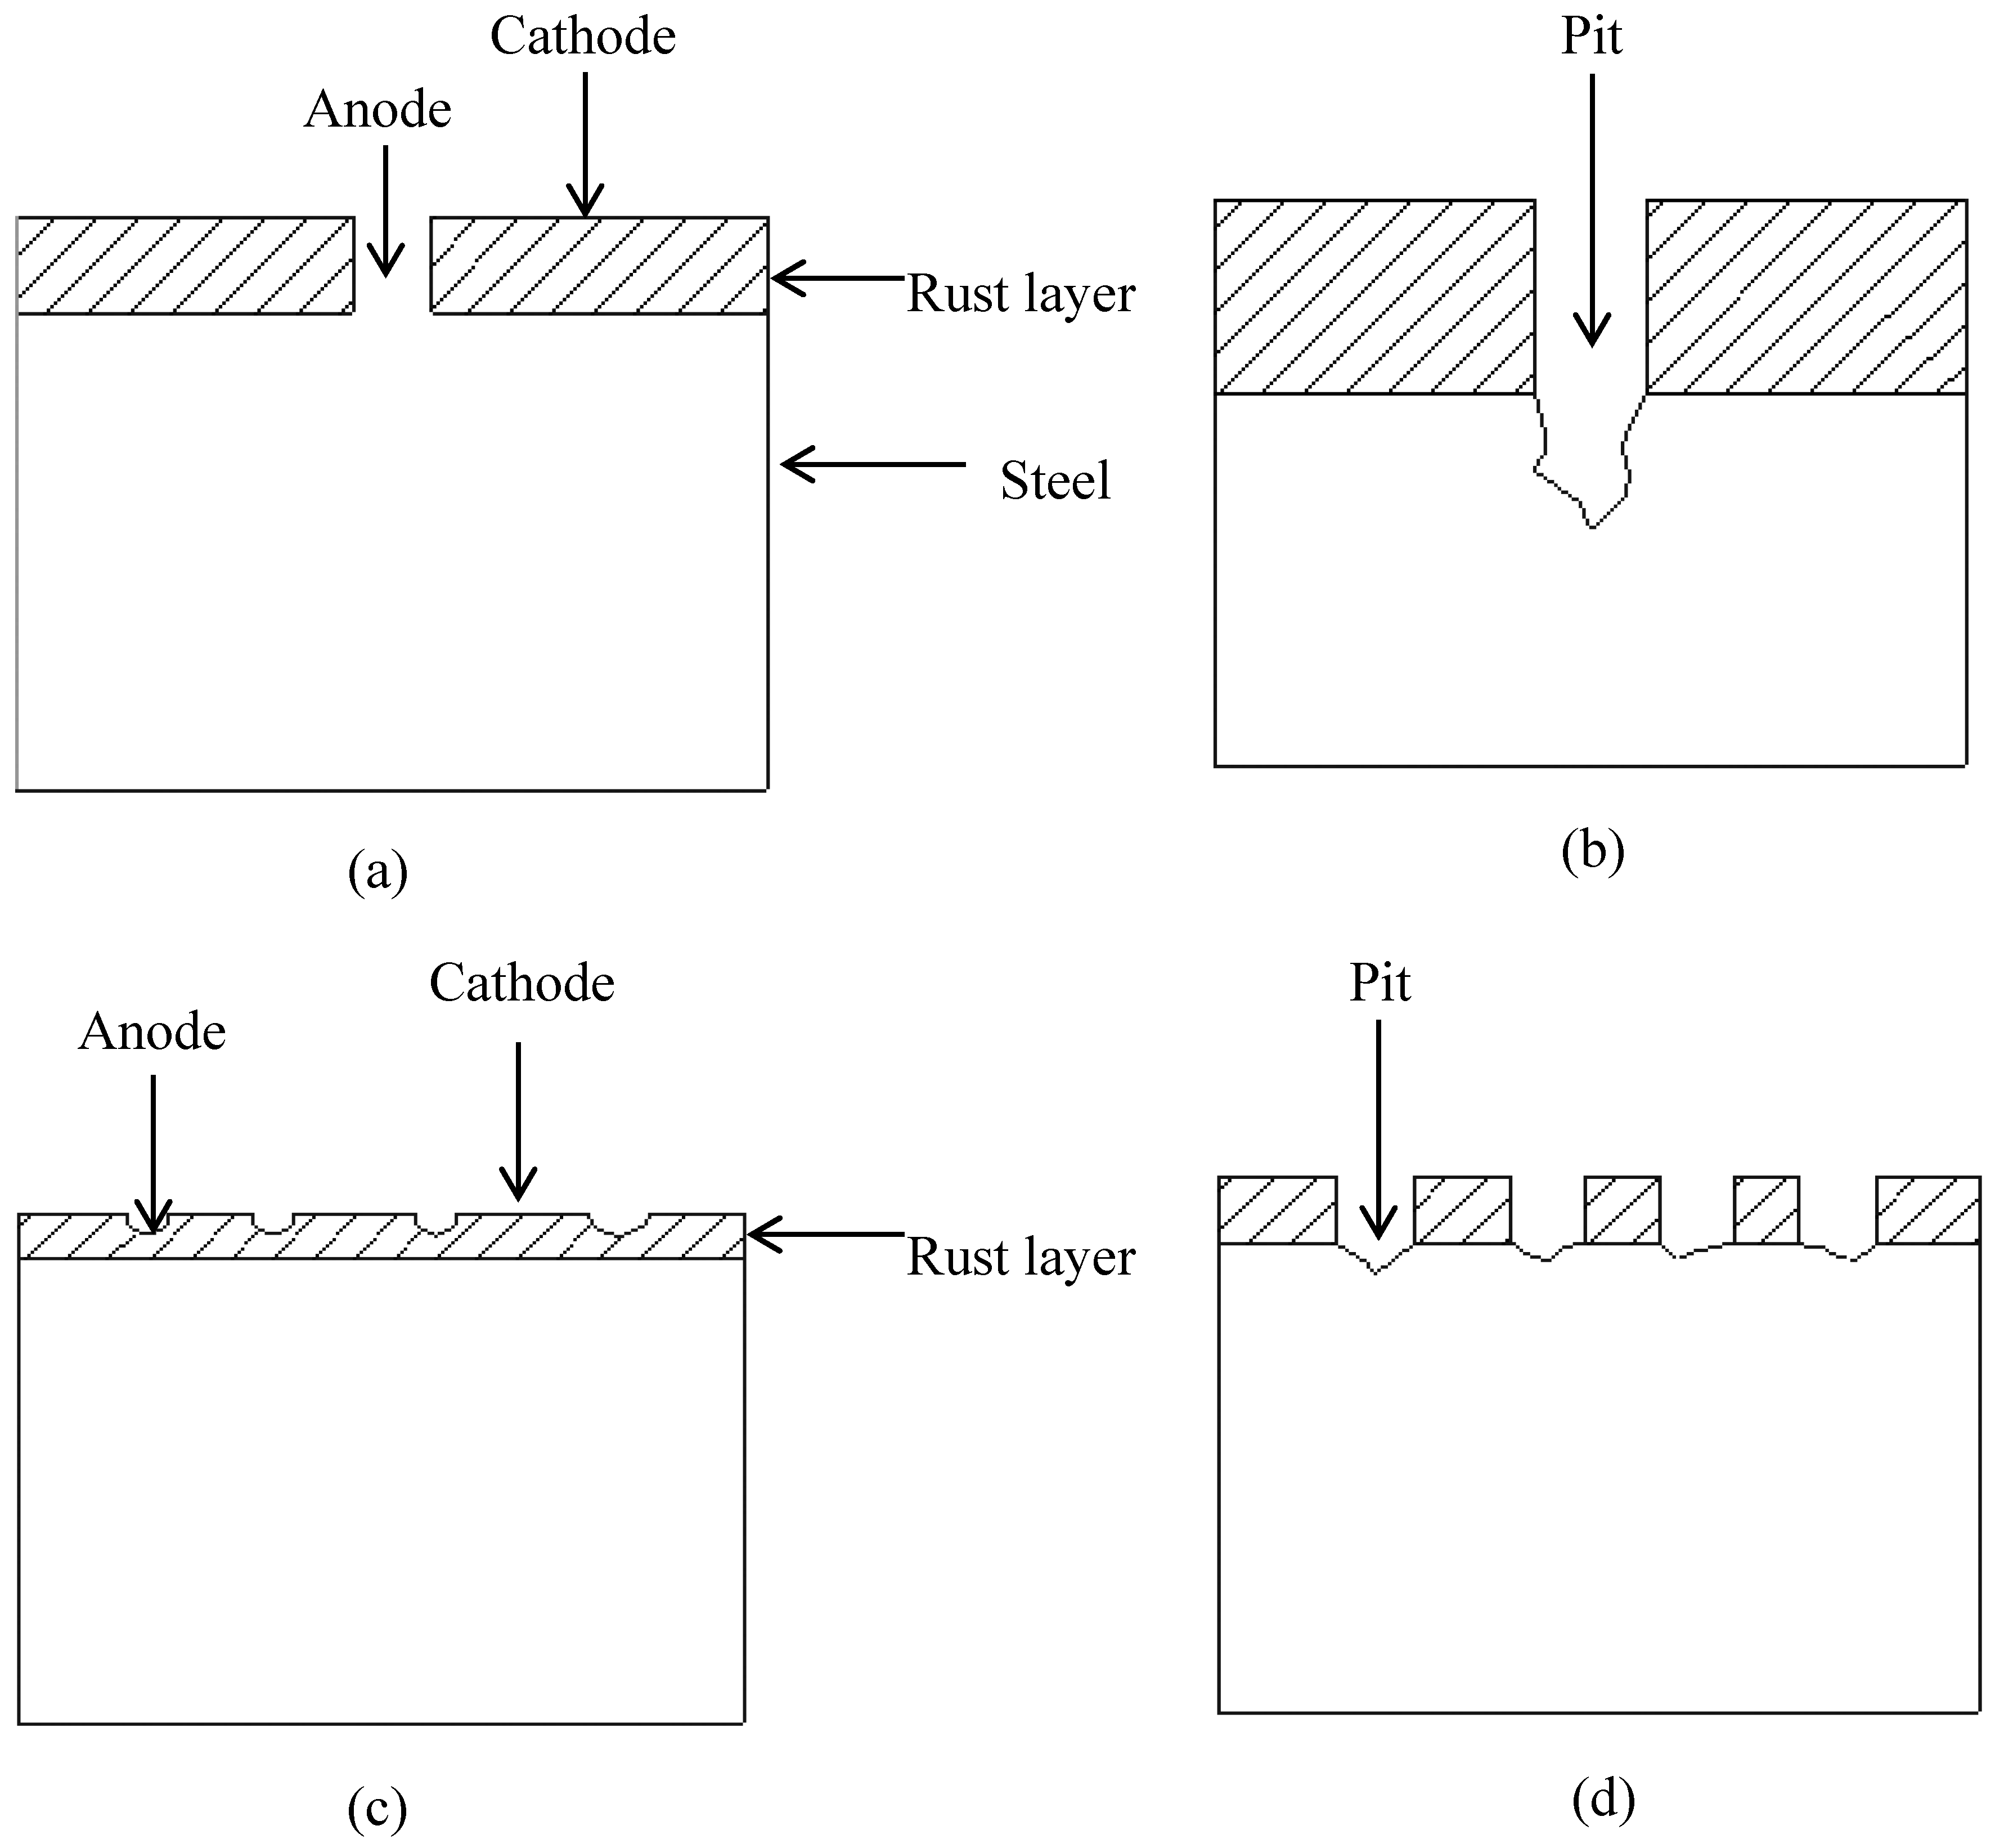
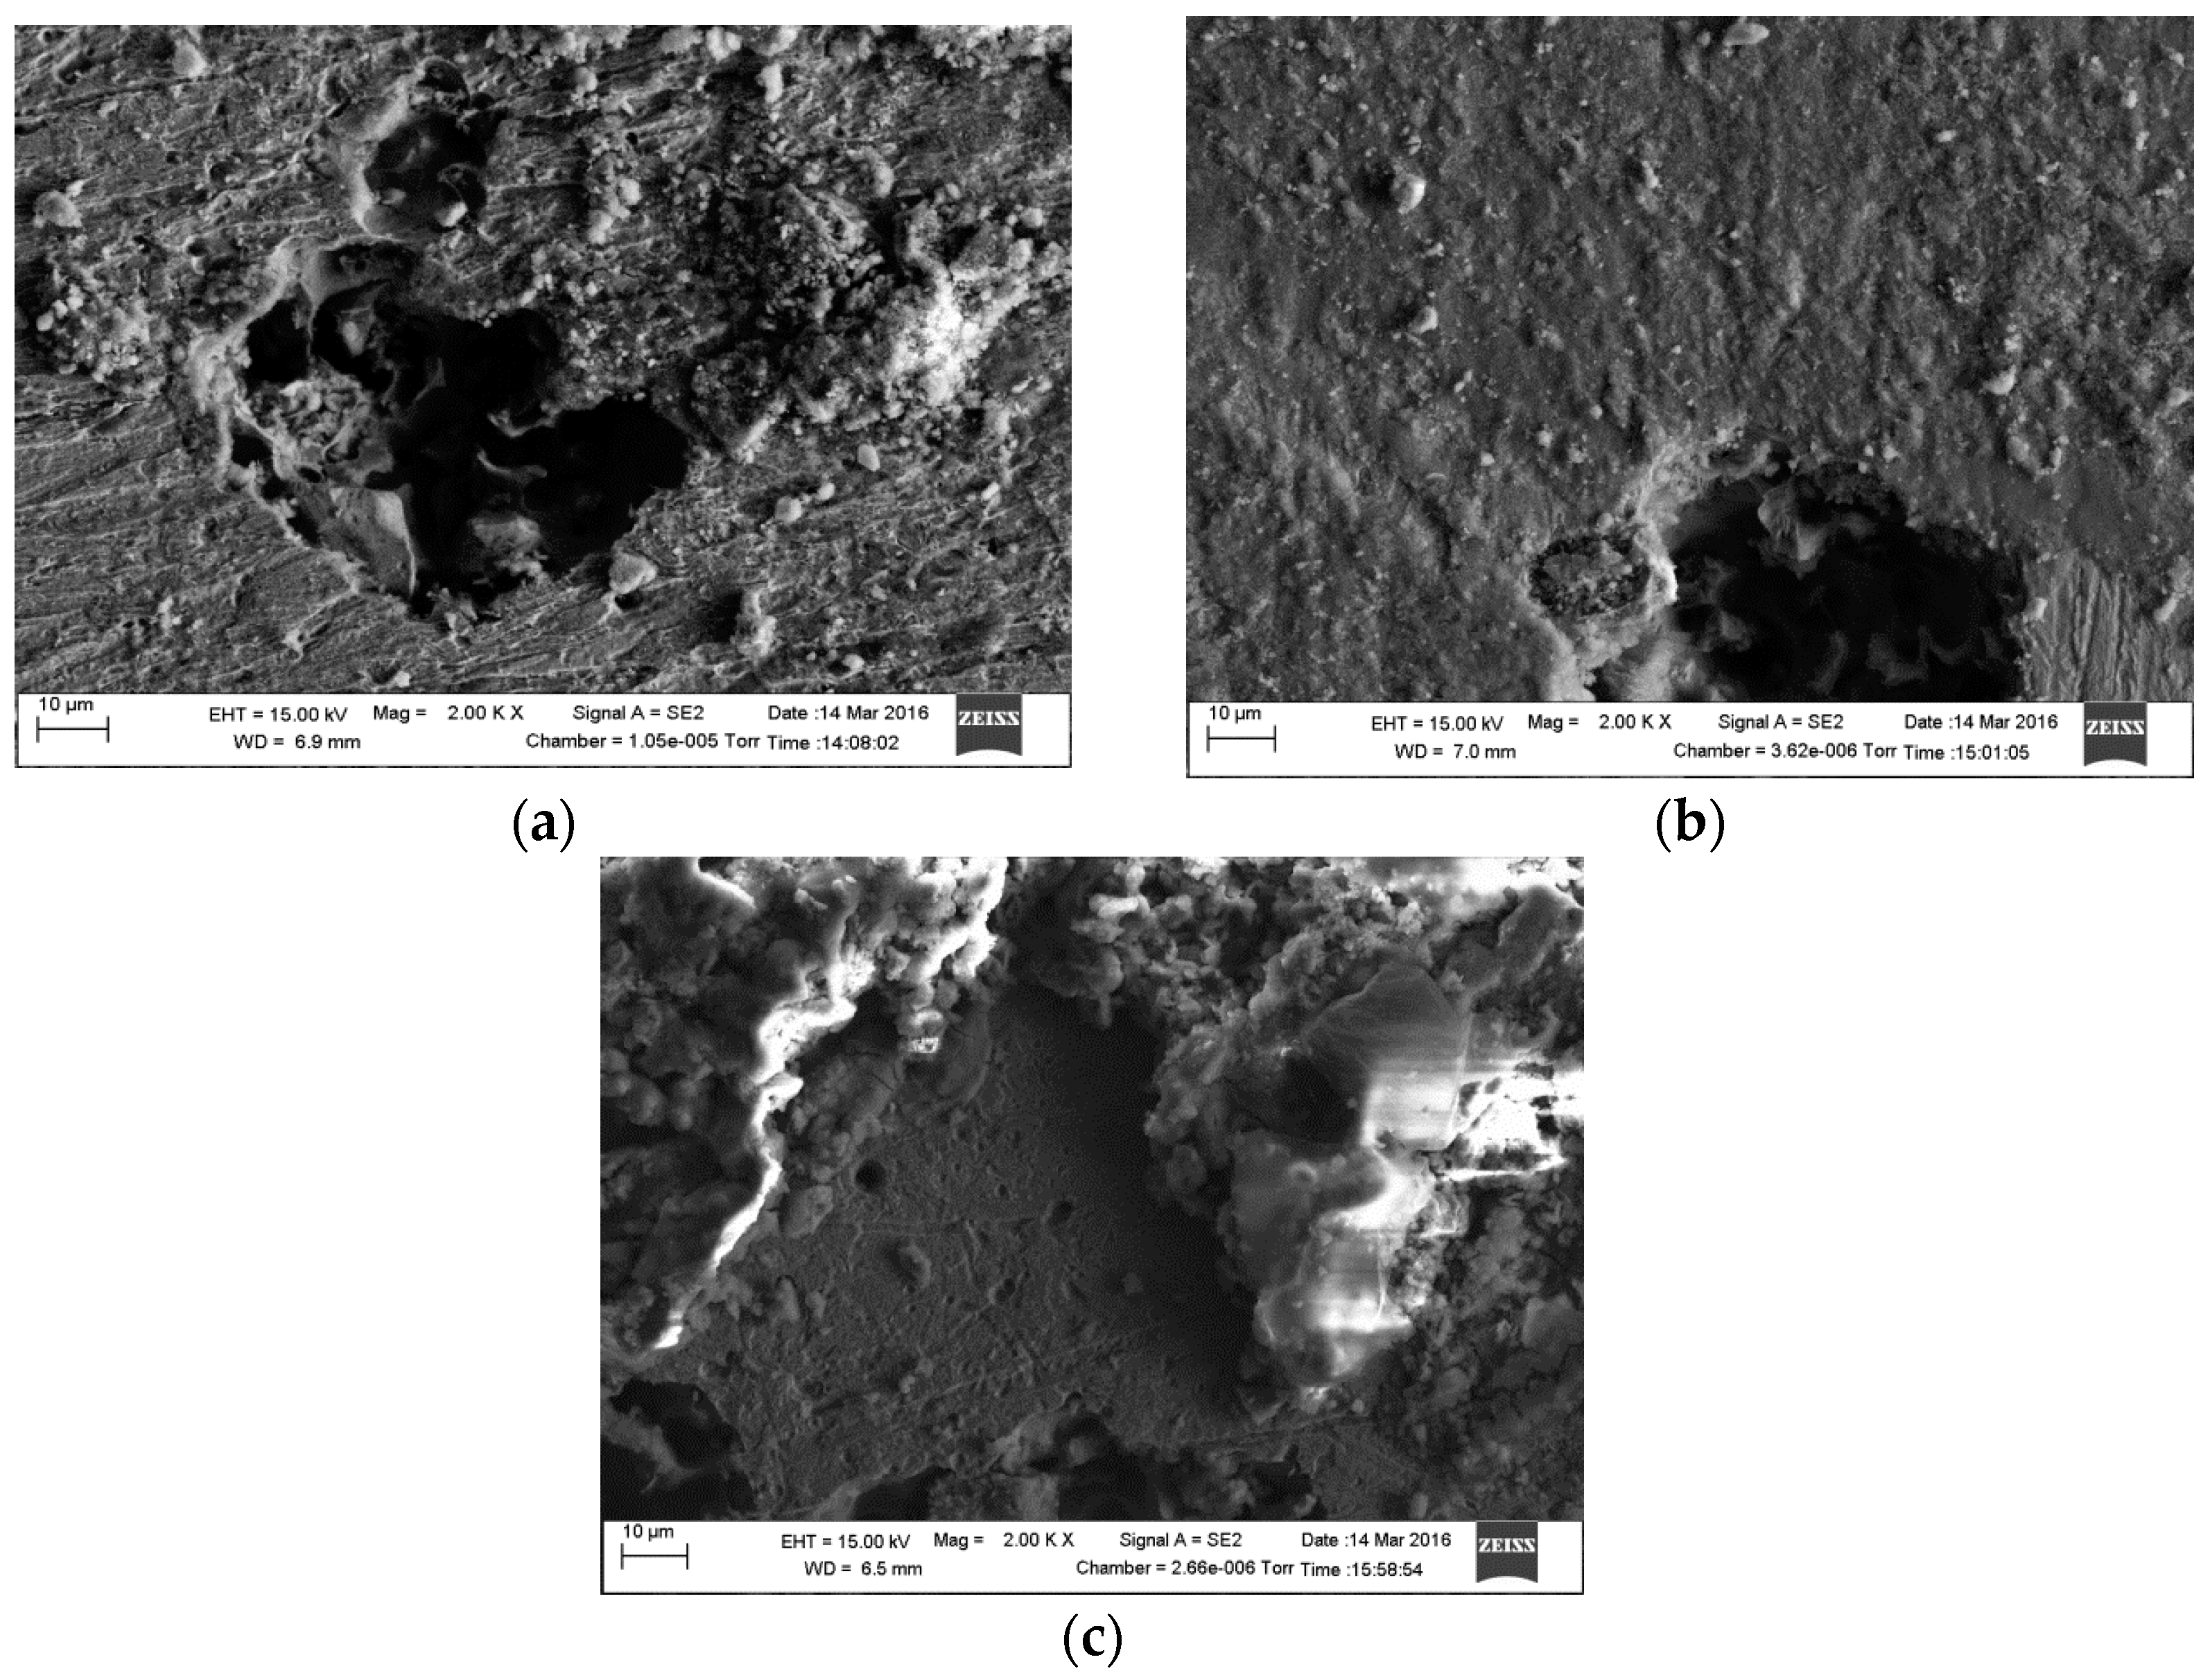
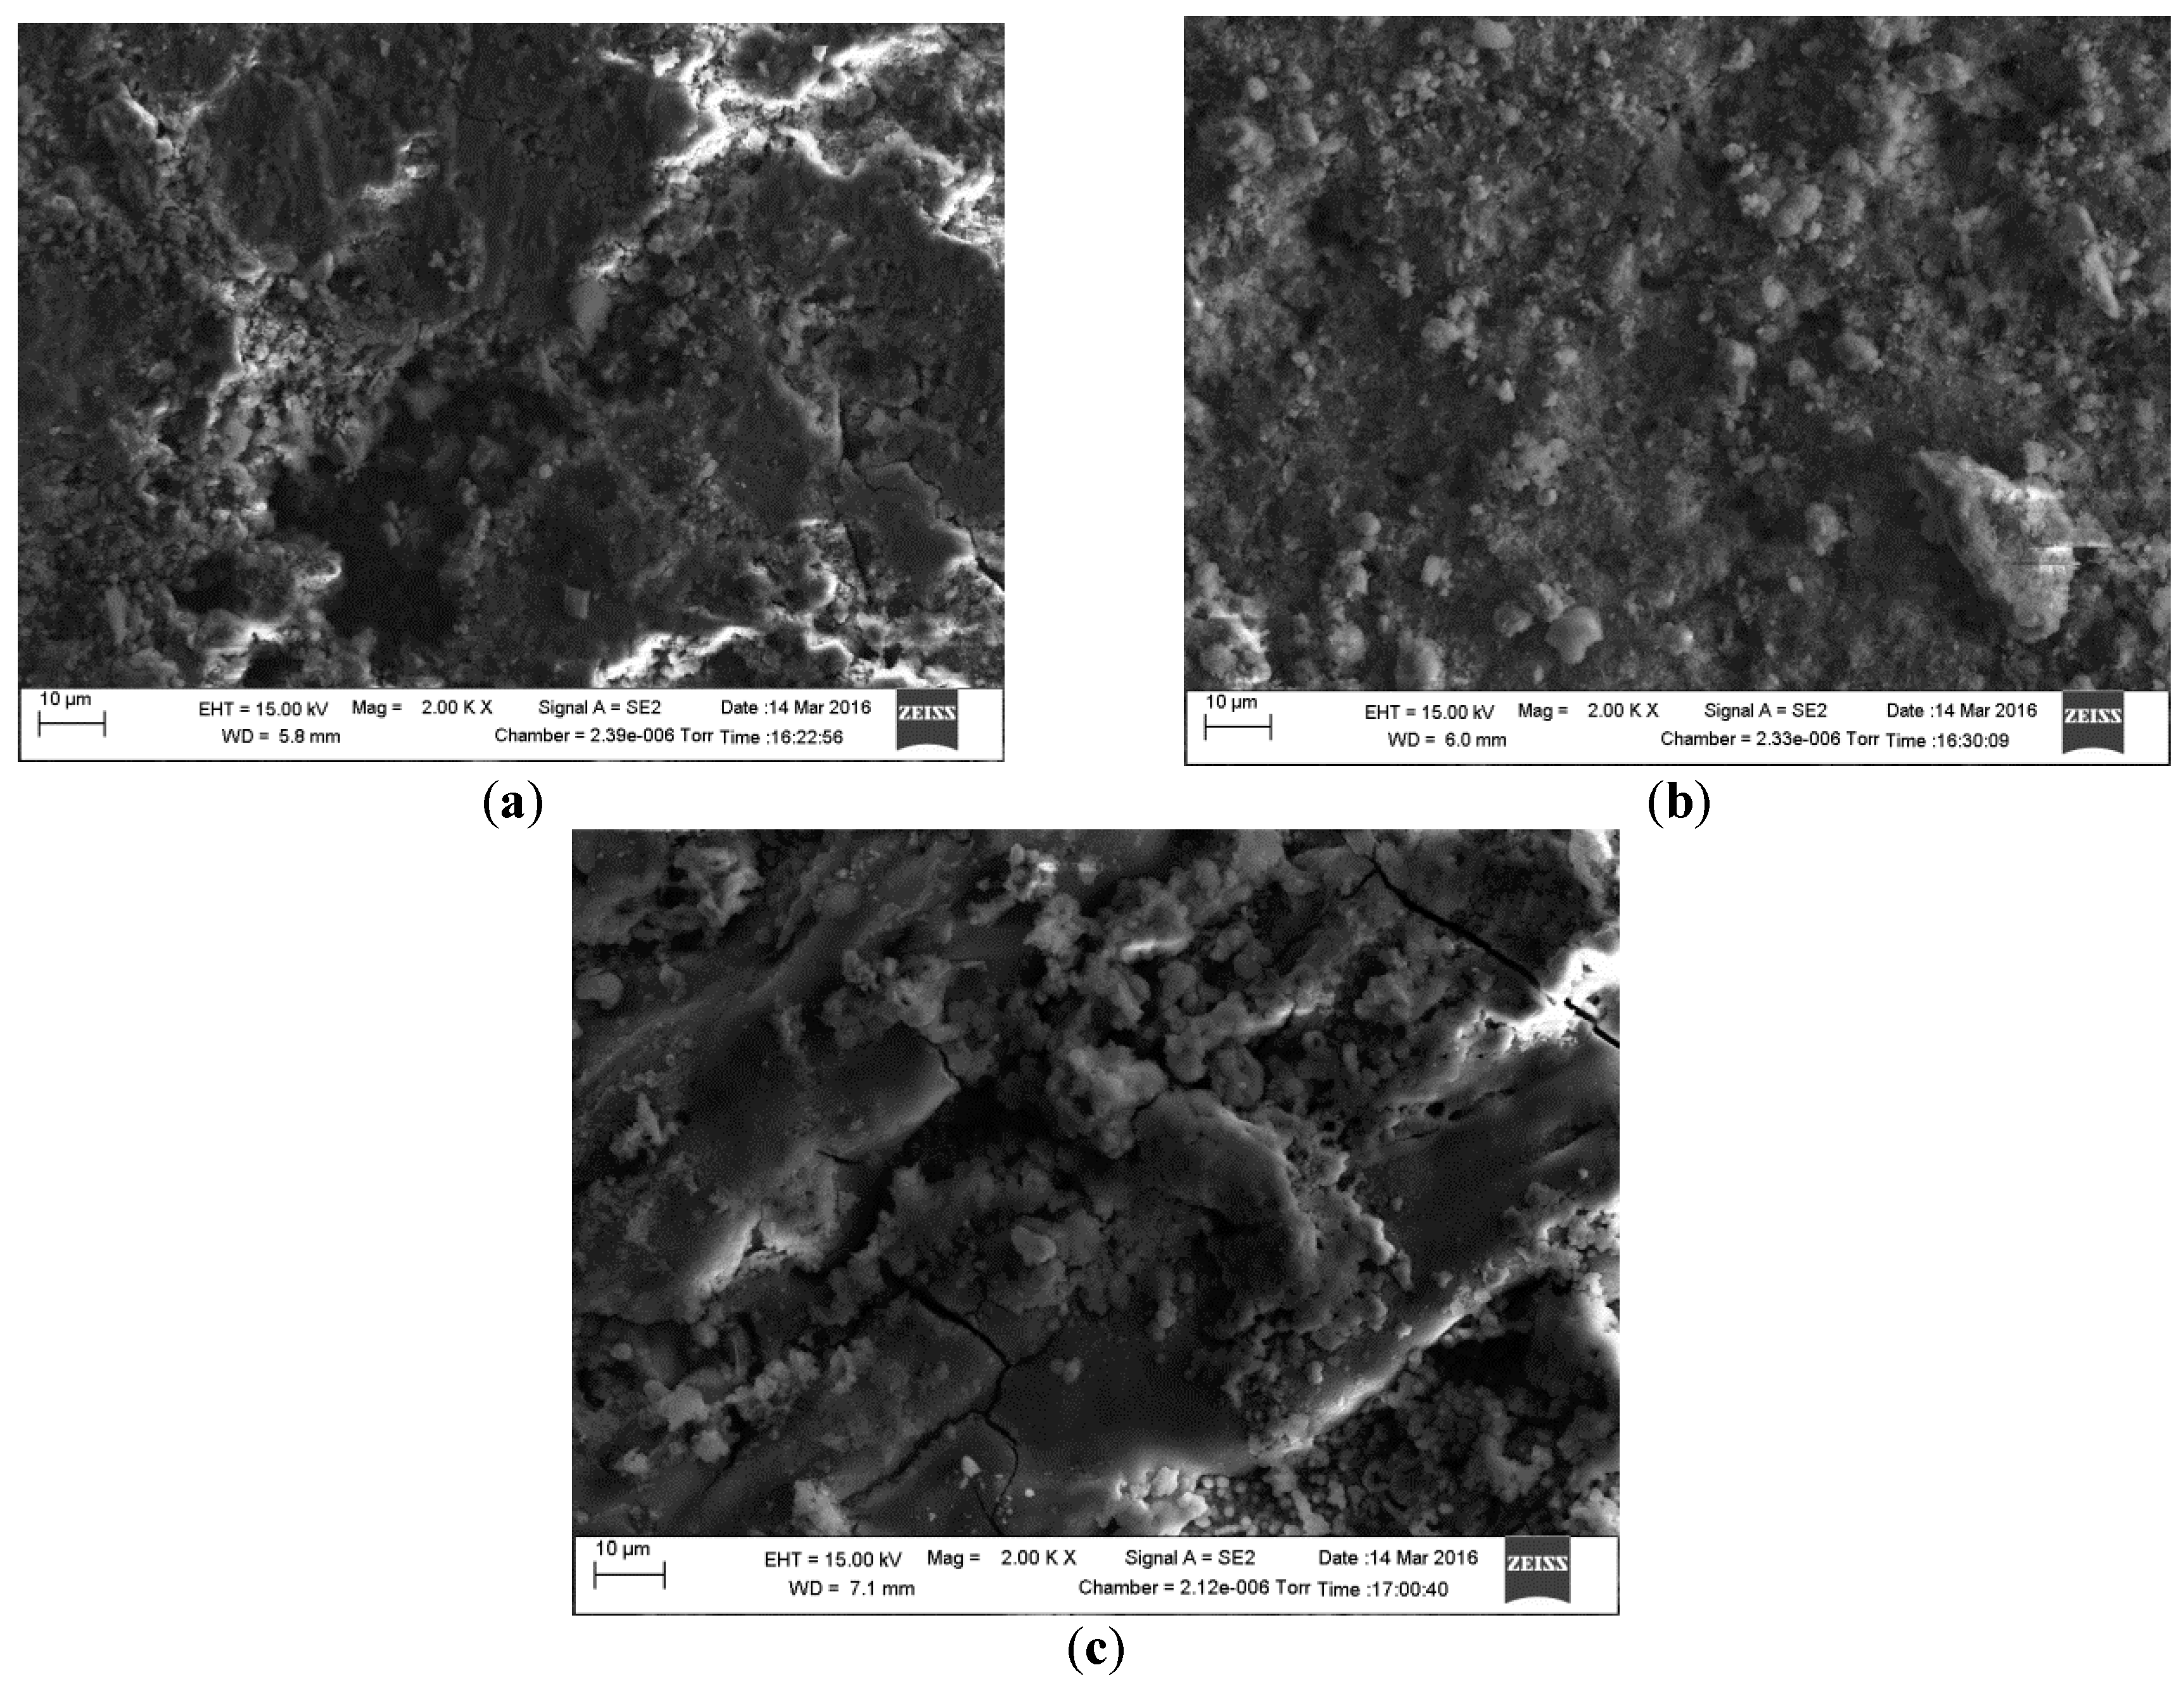
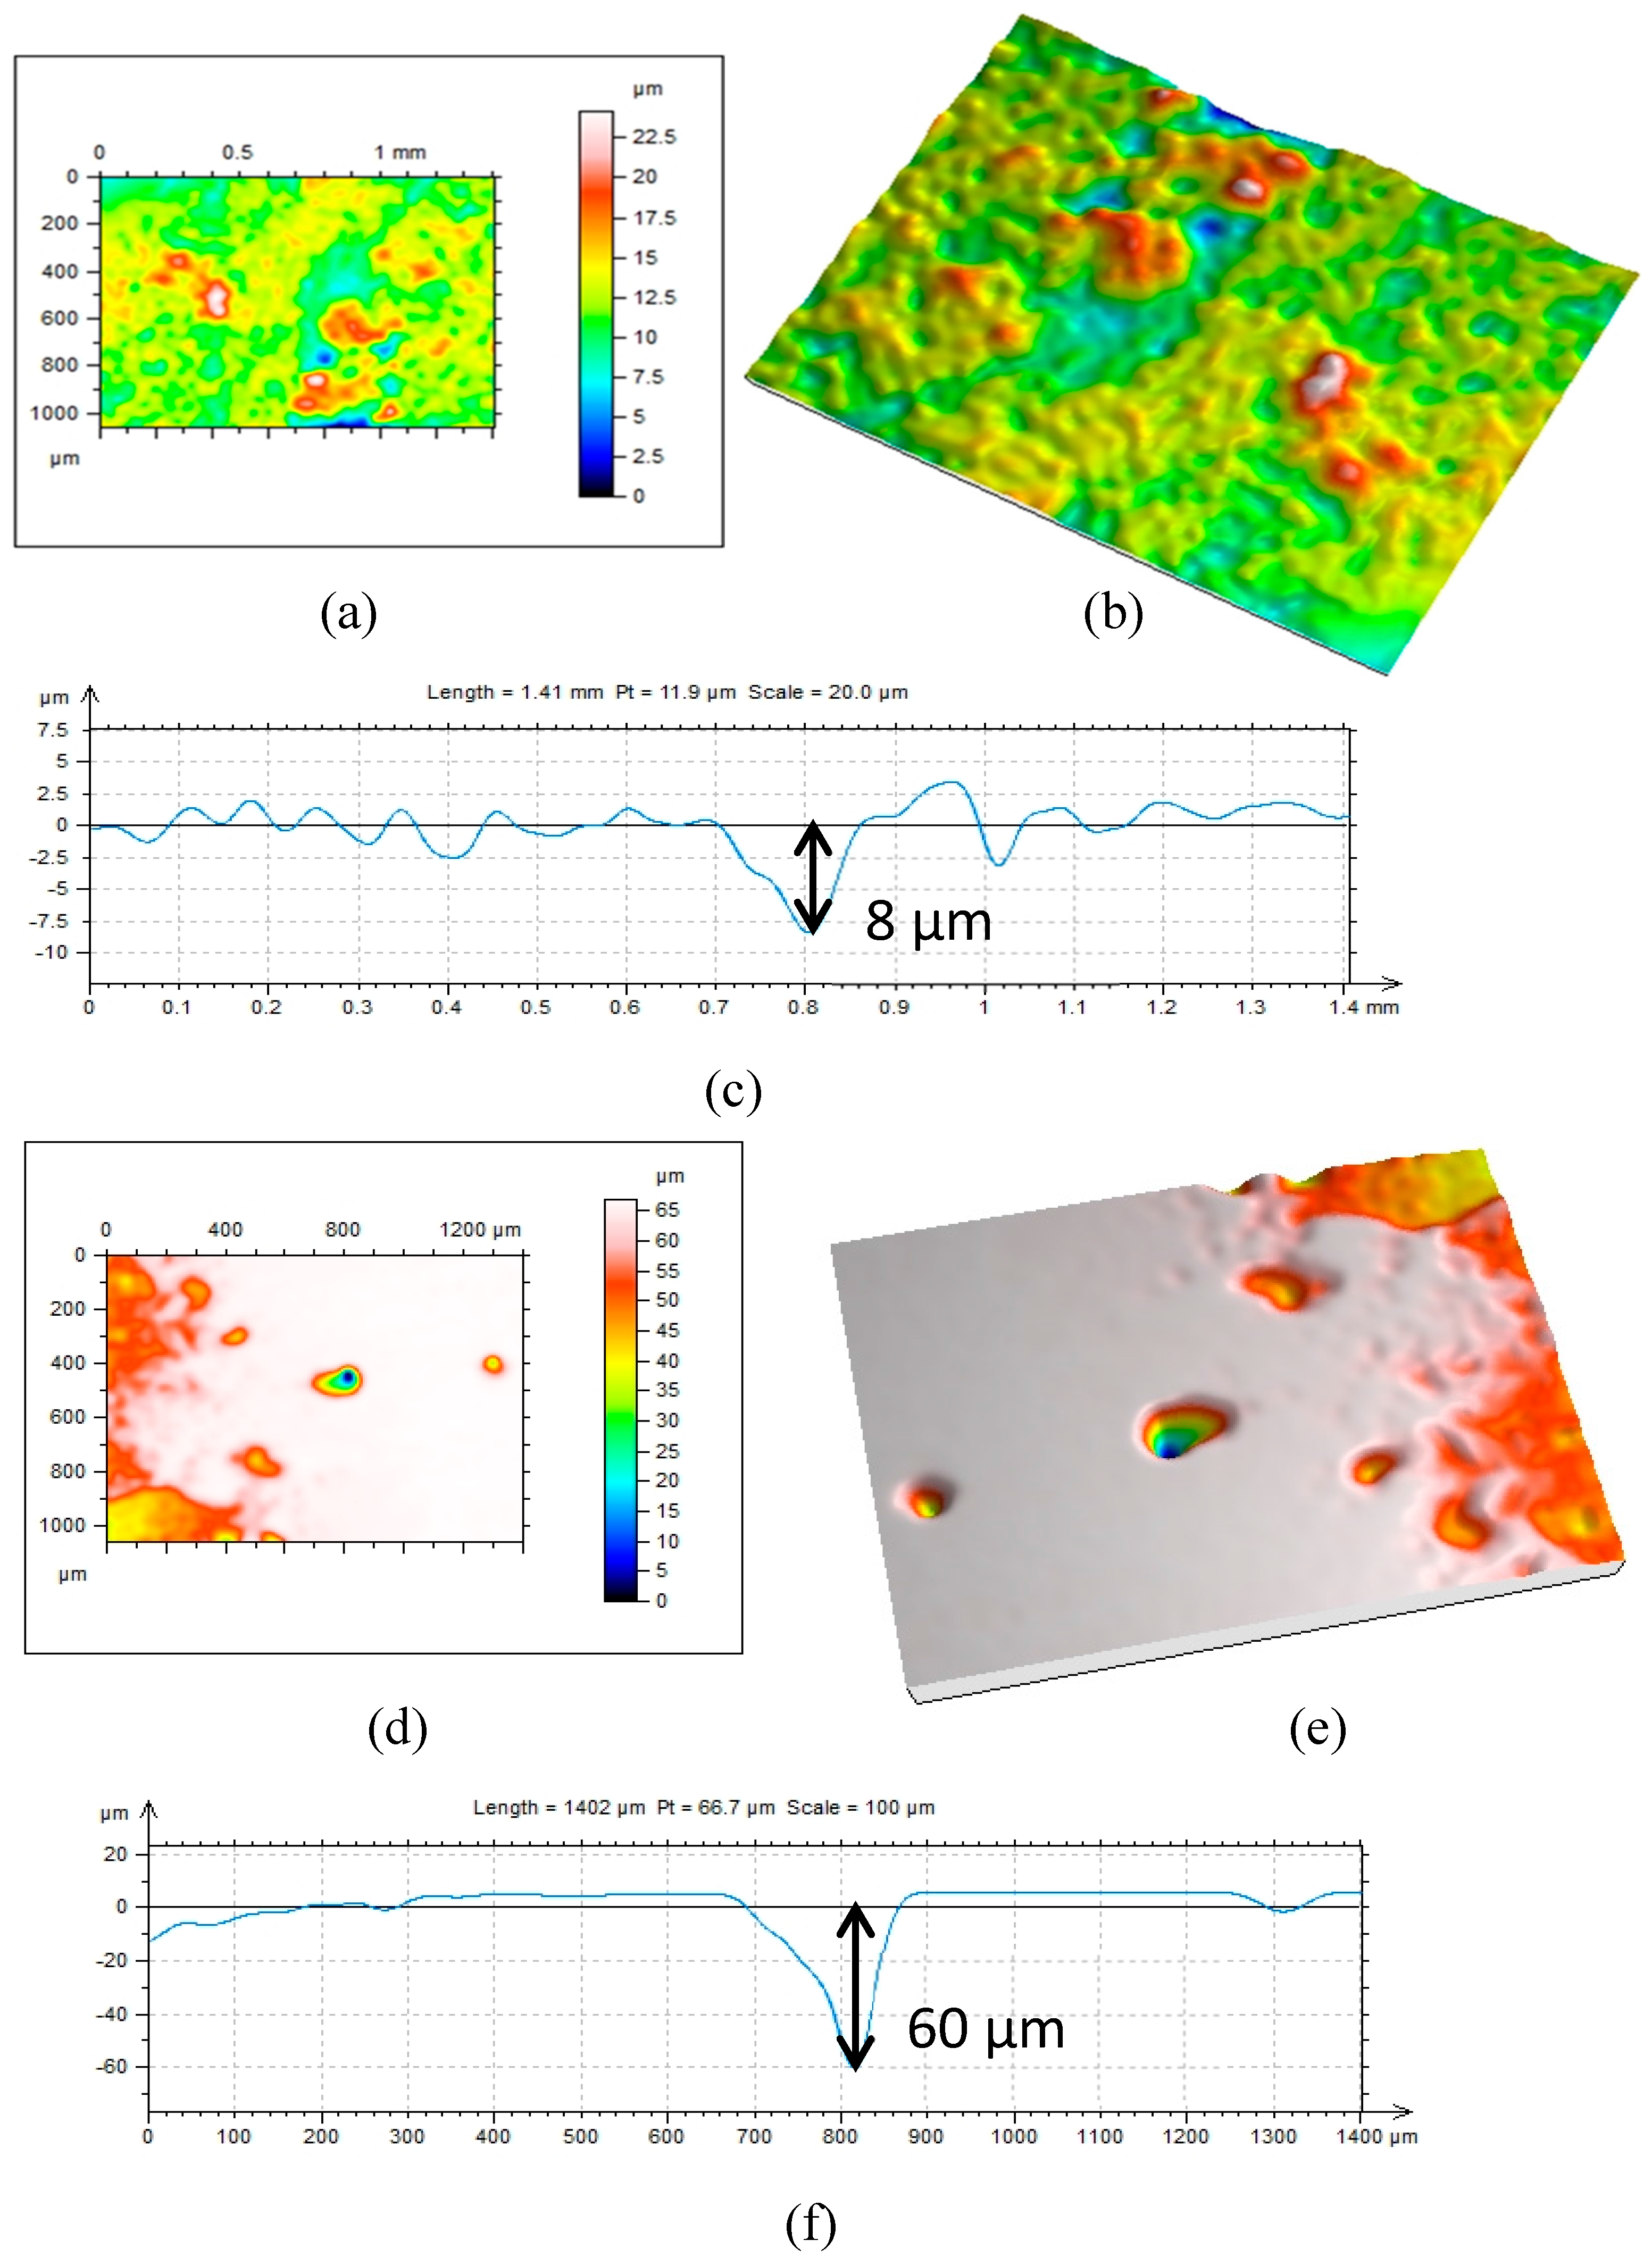
2.4. Surface Analysis
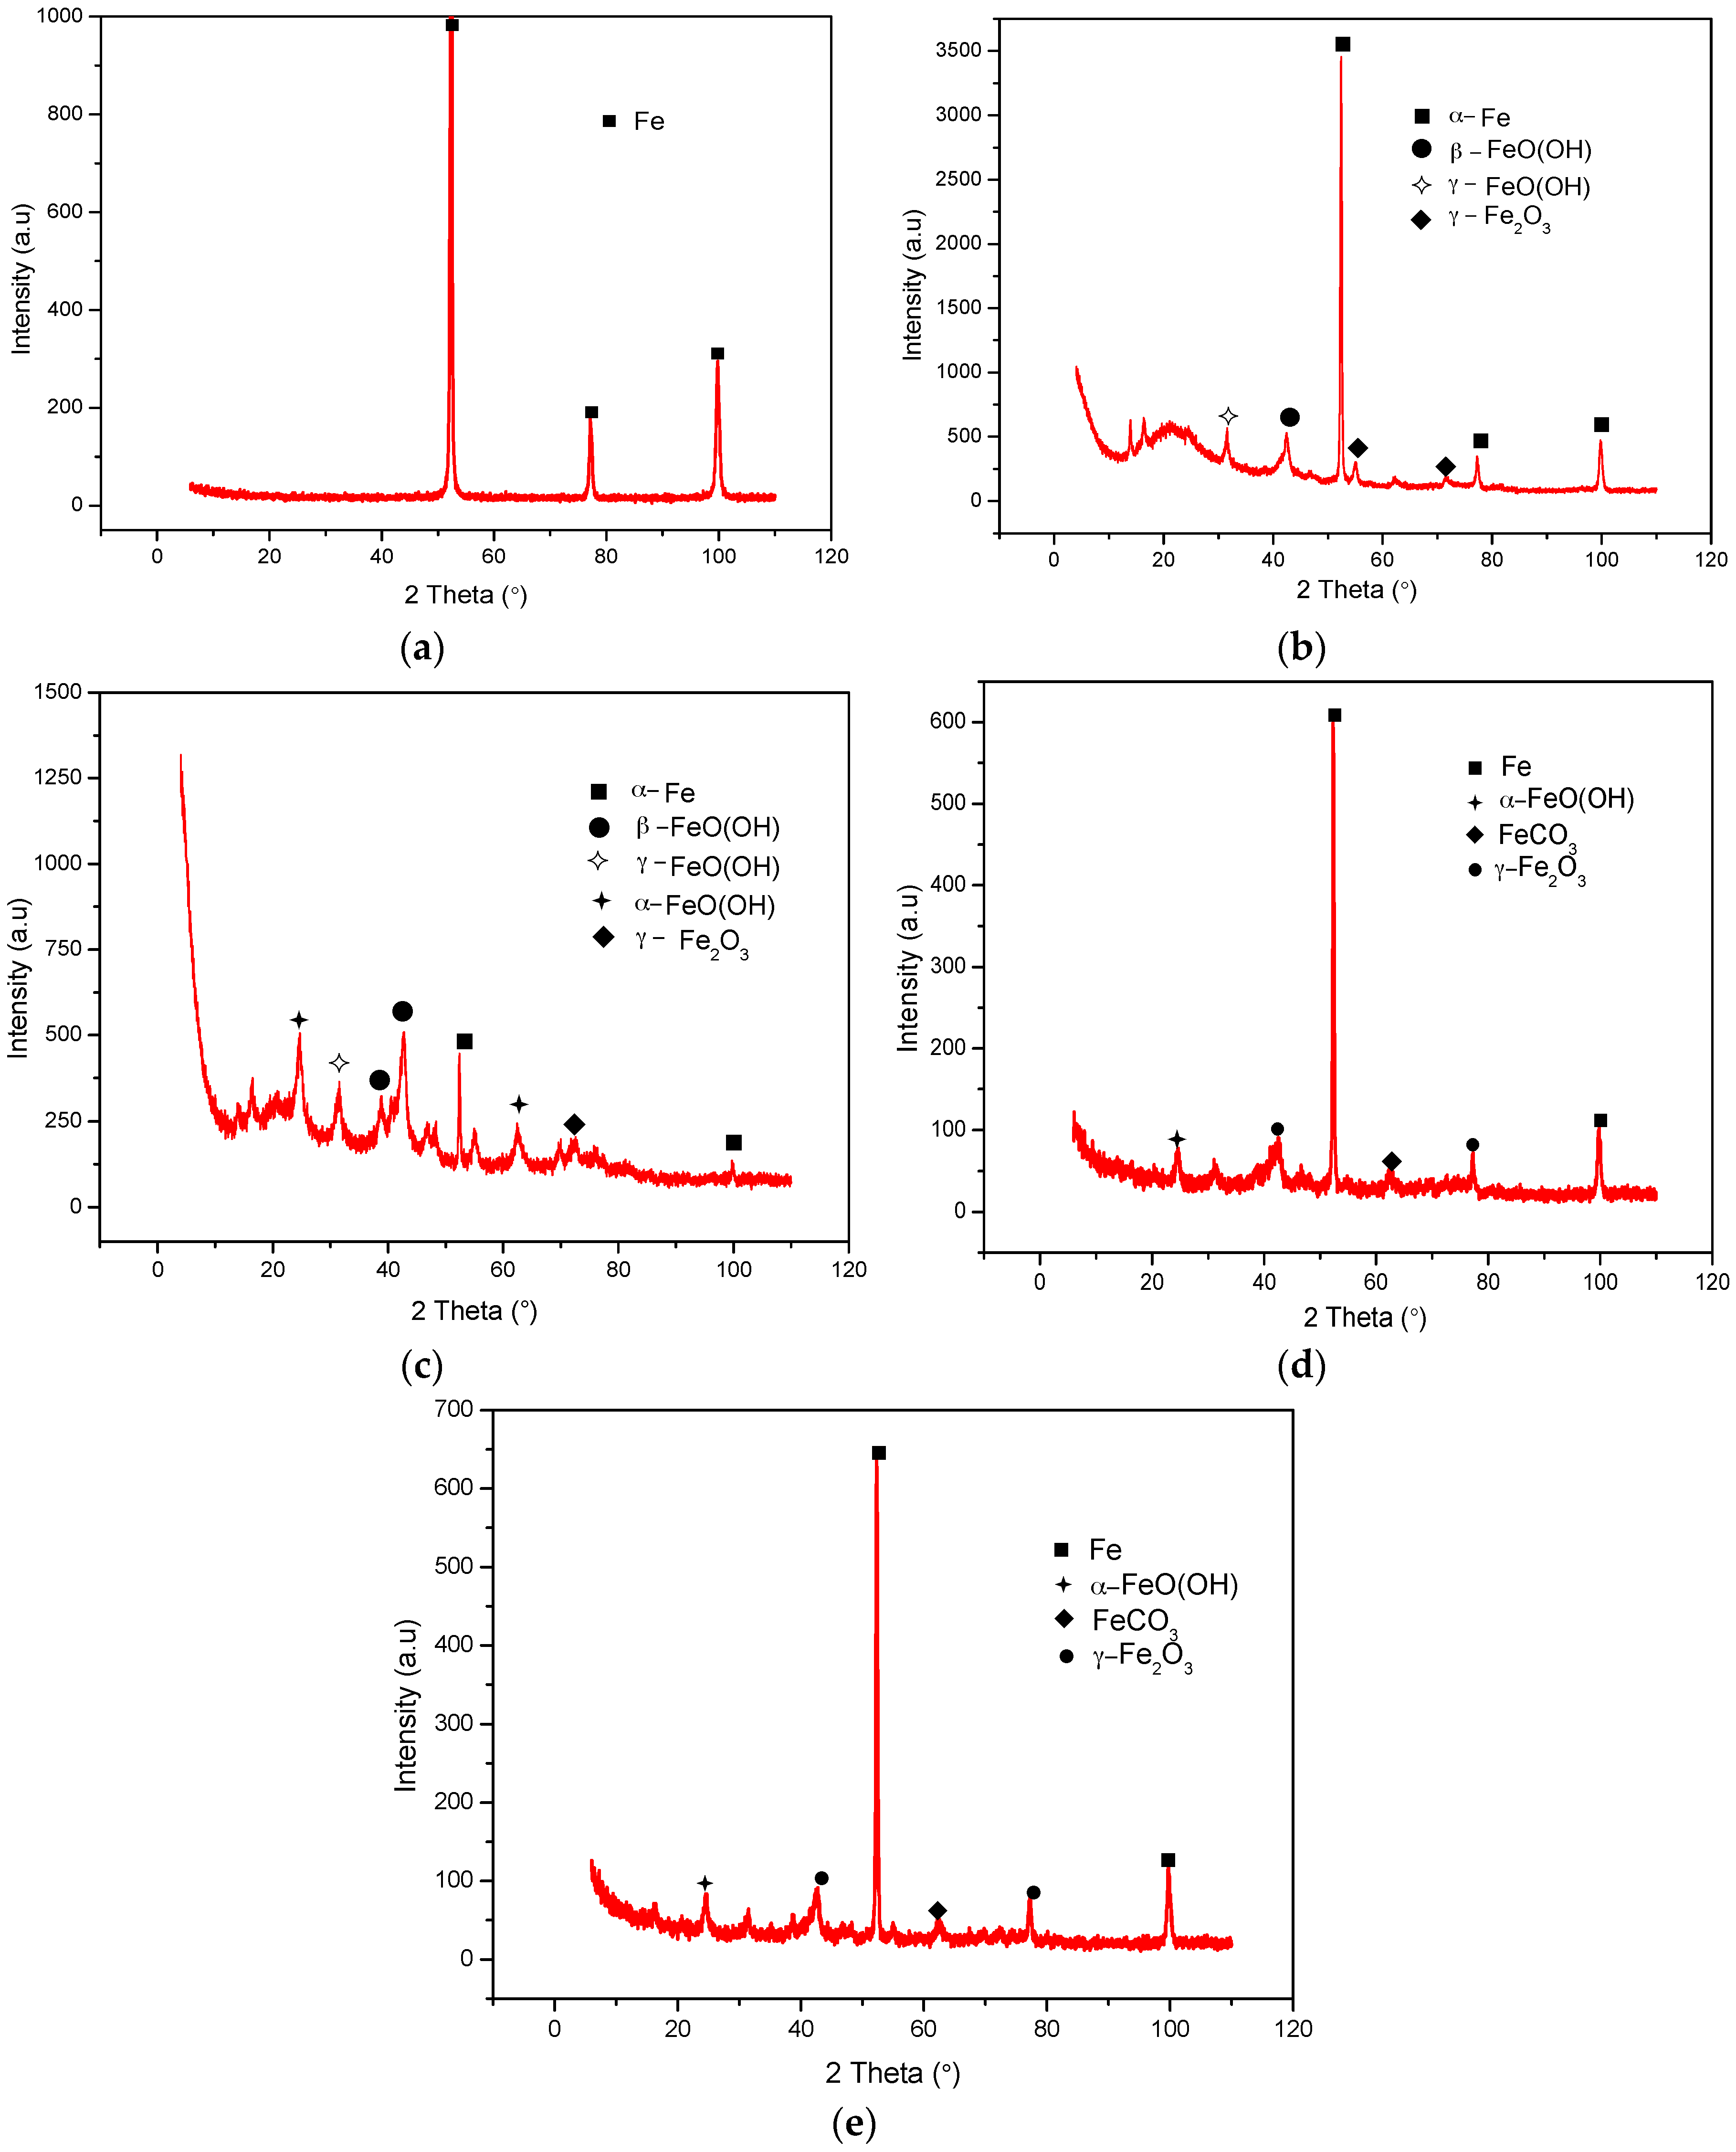
2.5. XRD Analyses
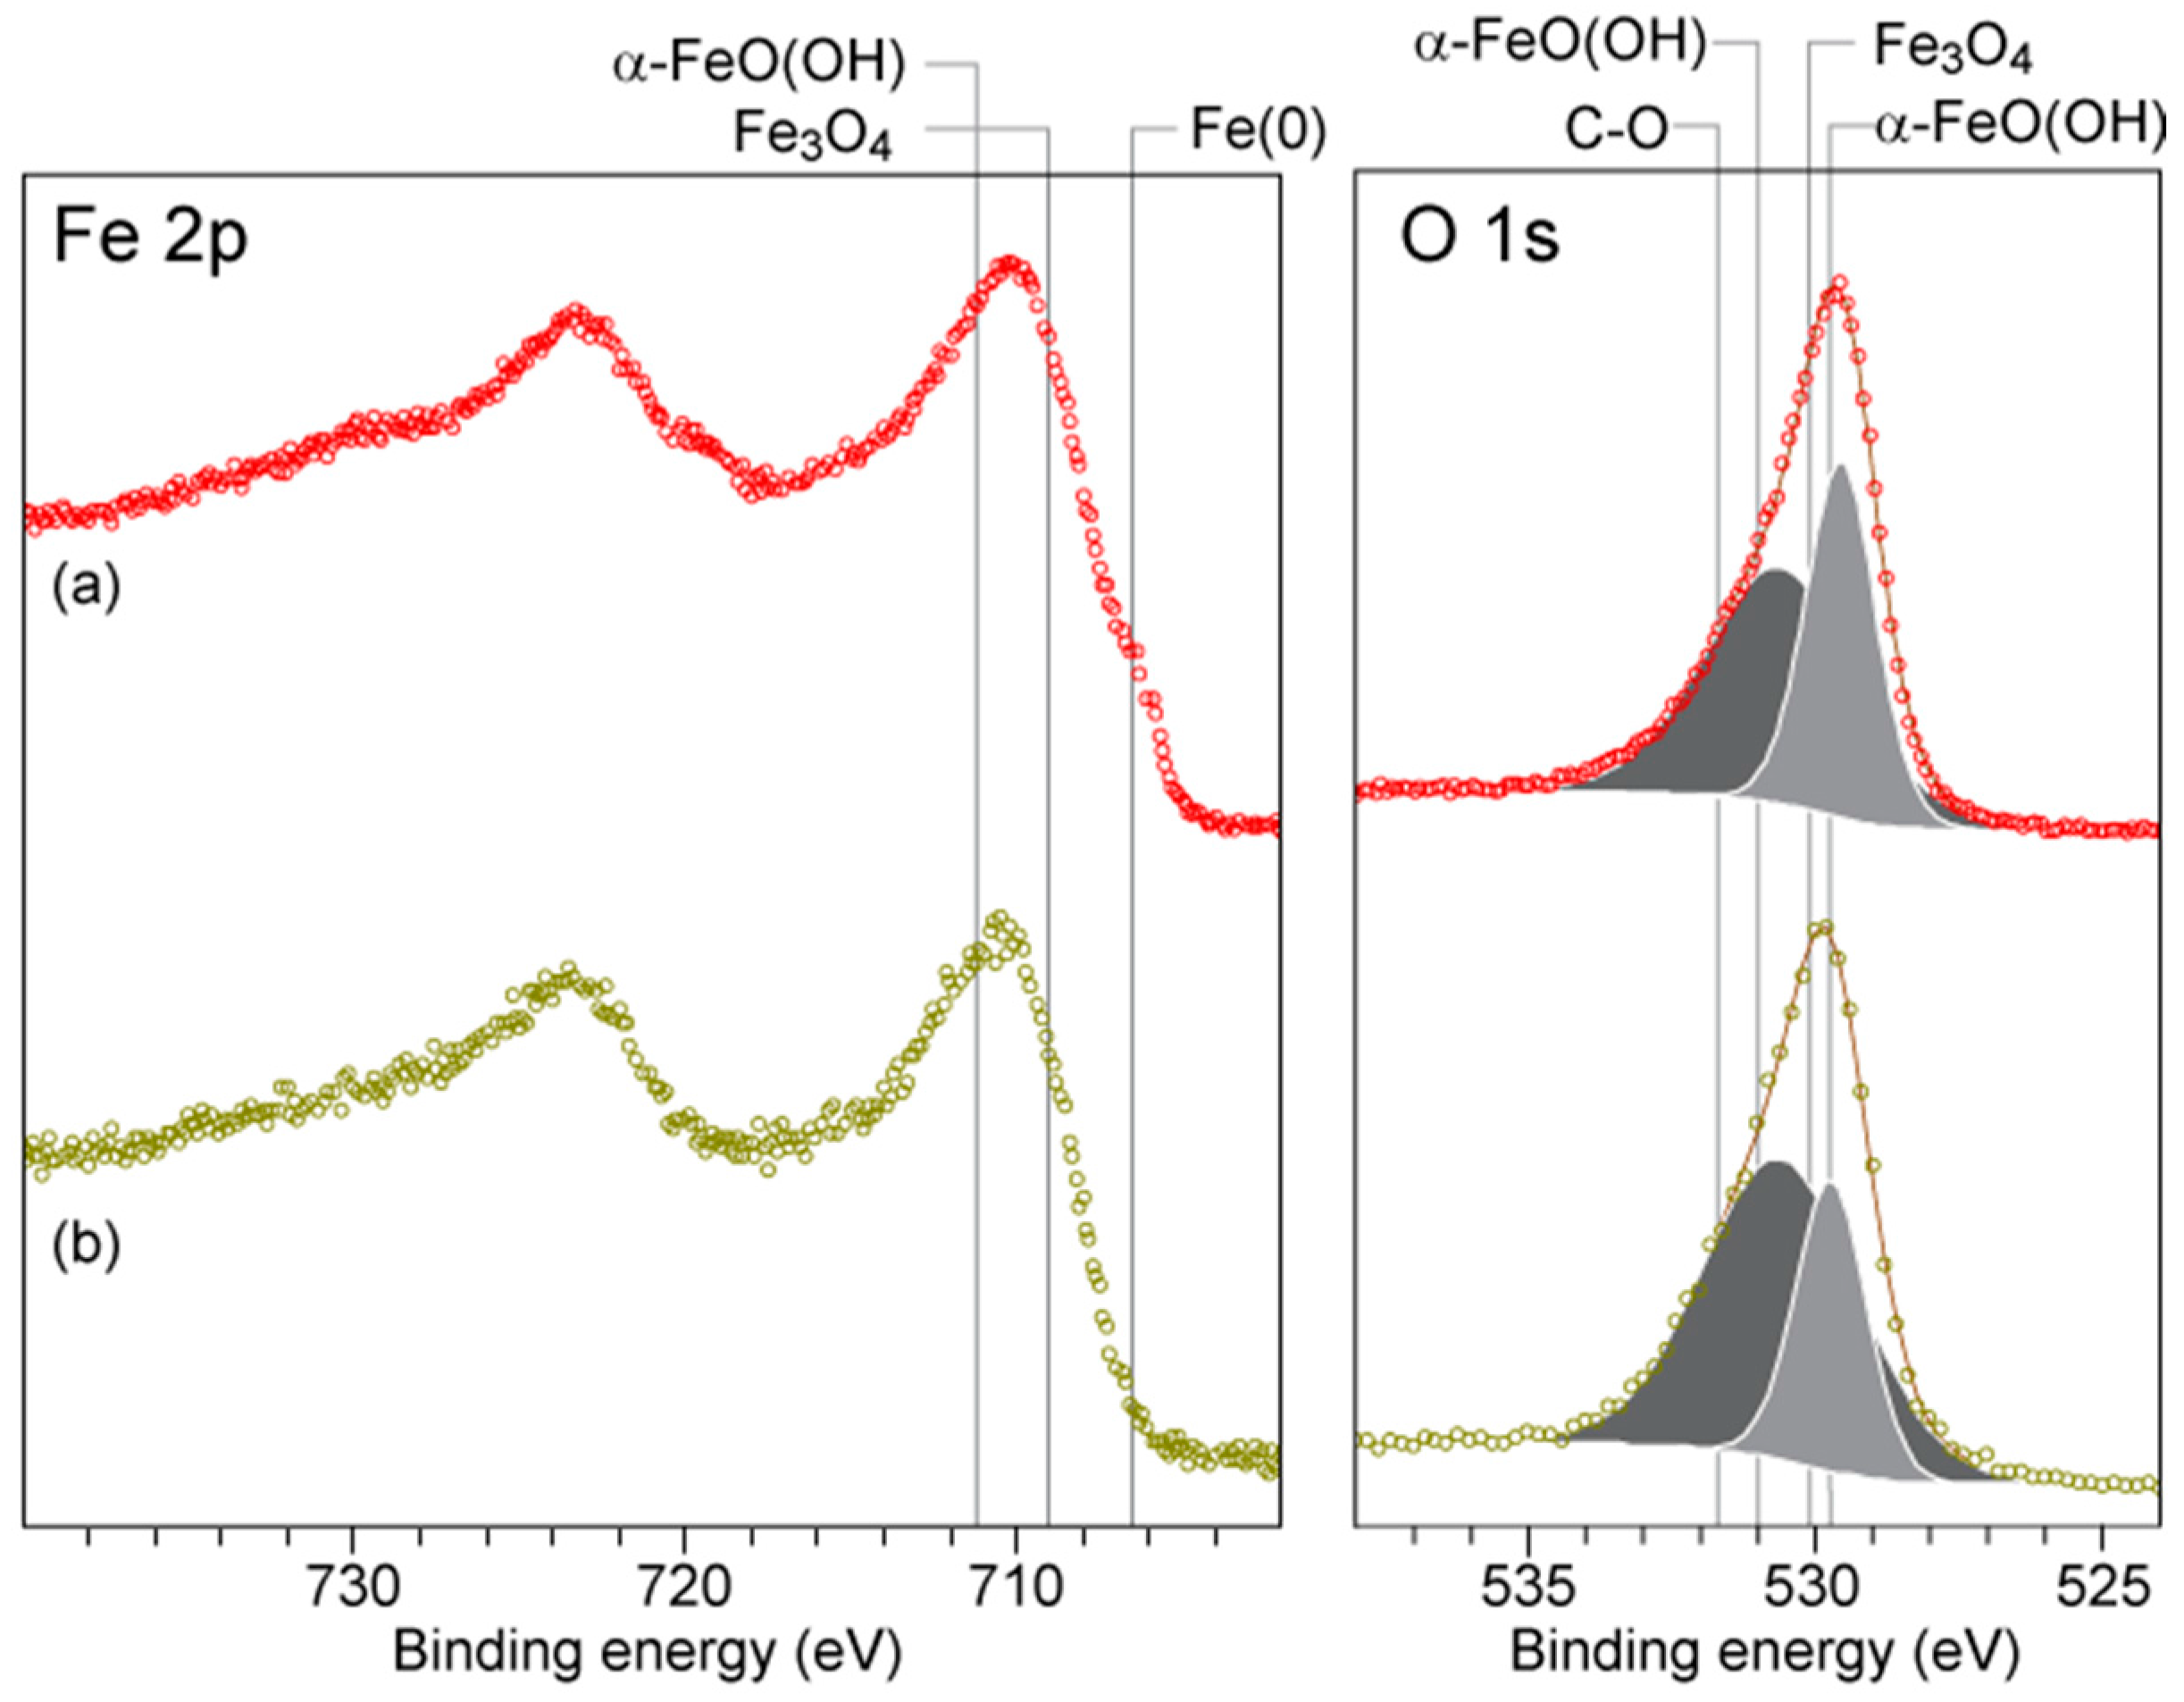
2.6. XPS Analyses
3. Experimental Section
3.1. Materials and Solutions
3.2. Electrochemical Test
3.3. Surface Analysis
3.4. X-ray Diffraction
3.5. X-ray Photoelectron Spectroscopy
4. Conclusions
Acknowledgments
Author Contributions
Conflicts of Interest
References
- King, F. Overview of a Carbon Steel Container Corrosion Model for a Deep Geological Repository in Sedimentary Rock; Nuclear Waste Management Organization Technical Report: Toronto, ON, Canada, 2007. [Google Scholar]
- Castro, E.; Vilche, J.; Arvia, A. Iron dissolution and passivation in K2CO3/KHCO3 solutions. Rotating ring disc electrode and XPS studies. Corros. Sci. 1991, 32, 37–50. [Google Scholar]
- Davies, D.; Burstein, G. The effects of bicarbonate on the corrosion and passivation of iron. Corrosion 1980, 36, 416–422. [Google Scholar] [CrossRef]
- Linter, B.; Burstein, G. Reactions of pipeline steels in carbon dioxide solutions. Corros. Sci. 1999, 41, 117–139. [Google Scholar] [CrossRef]
- Tan, Y.T.; Wijesinghe, S.L.; Blackwood, D.J. The inhibitive effect of bicarbonate and carbonate ions on carbon steel in simulated concrete pore solution. Corros. Sci. 2014, 88, 152–160. [Google Scholar] [CrossRef]
- Moreno, M.; Morris, W.; Alvarez, M.G.; Duffó, G.S. Corrosion of reinforcing steel in simulated concrete pore solutions: Effect of carbonation and chloride content. Corros. Sci. 2004, 46, 2681–2699. [Google Scholar] [CrossRef]
- Might, J.; Duquette, D. Stress corrosion cracking of high-purity carbon steel in carbonate solutions. Corrosion 1996, 52, 428–434. [Google Scholar] [CrossRef]
- Pilkey, A.; Lambert, S.; Plumtree, A. Stress corrosion cracking of X-60 line pipe steel in a carbonate-bicarbonate solution. Corrosion 1995, 51, 91–96. [Google Scholar] [CrossRef]
- Mao, X.; Liu, X.; Revie, R. Pitting corrosion of pipeline steel in dilute bicarbonate solution with chloride ions. Corrosion 1994, 50, 651–657. [Google Scholar] [CrossRef]
- Thomas, J.; Davies, J. Influence of hydrogen carbonate and chloride ions on the stability of oxide films on mild steel in near-neutral solutions. Br. Corros. J. 1977, 12, 108–114. [Google Scholar] [CrossRef]
- Abdulrahman, A.; Ismail, M.; Hussain, M.S. Inhibition of corrosion of mild steel in hydrochloric acid by Bambusa arundinacea. Int. Rev. Mech. Eng. 2011, 5, 59–63. [Google Scholar]
- Lu, Z.; Huang, C.; Huang, D.; Yang, W. Effects of a magnetic field on the anodic dissolution, passivation and transpassivation behaviour of iron in weakly alkaline solutions with or without halides. Corros. Sci. 2006, 48, 3049–3077. [Google Scholar] [CrossRef]
- Xue, H.; Cheng, Y. Passivity and pitting corrosion of X80 pipeline steel in carbonate/bicarbonate solution studied by electrochemical measurements. J. Mater. Eng. Perform. 2010, 19, 1311–1317. [Google Scholar] [CrossRef]
- Cáceres, L.; Vargas, T.; Herrera, L. Influence of pitting and iron oxide formation during corrosion of carbon steel in unbuffered NaCl solutions. Corros. Sci. 2009, 51, 971–978. [Google Scholar] [CrossRef]
- Gadala, I.M.; Alfantazi, A. Electrochemical behavior of API-X100 pipeline steel in NS4, near-neutral, and mildly alkaline pH simulated soil solutions. Corros. Sci. 2014, 82, 45–57. [Google Scholar] [CrossRef]
- Kermani, M.; Morshed, A. Carbon dioxide corrosion in oil and gas production-A compendium. Corrosion 2003, 59, 659–683. [Google Scholar] [CrossRef]
- Han, J.; Zhang, J.; Carey, J.W. Effect of bicarbonate on corrosion of carbon steel in CO2 saturated brines. Int. J. Greenh. Gas Control 2011, 5, 1680–1683. [Google Scholar] [CrossRef]
- Yunovich, M.; Xia, Z.; Szklarska-Smialowska, Z. Factors influencing stress corrosion cracking of carbon steel in diluted bicarbonate environments. Corrosion 1998, 54, 155–161. [Google Scholar] [CrossRef]
- Delanty, B.; O’Beirne, J. Major field study compares pipeline SSC with coatings. Oil Gas J. 1992, 90, 39–44. [Google Scholar]
- Gedge, G. Corrosion of cast Iron in potable water service. In Proceedings of the Institute of Materials Conference, London, UK, 1993; pp. 18–28.
- Abdallah, M. Corrosion behaviour of 304 stainless steel in sulphuric acid solutions and its inhibition by some substituted pyrazolones. Mater. Chem. Phys. 2003, 82, 786–792. [Google Scholar] [CrossRef]
- Finnegan, T.J.; Corey, R.C. Corrosion of Steel Quantitative Effect of Dissolved Oxygen and carbon Dioxide. Ind. Eng. Chem. 1935, 27, 774–780. [Google Scholar] [CrossRef]
- Oldfield, J.; Todd, B. Corrosion considerations in selecting metals for flash chambers. Desalination 1979, 31, 365–383. [Google Scholar] [CrossRef]
- Oldfield, J.W.; Todd, B. Technical and economic aspects of stainless steels in MSF desalination plants. Desalination 1999, 124, 75–84. [Google Scholar] [CrossRef]
- Beckett, M.; Beckett, M.; Snoeyink, V.; Jim, K.; Sarin, P.; Kriven, W.; Lytle, D.; Clement, J. A pipe loop system for evaluating iron uptake in distribution systems. In Proceedings of the Water Quality Technology Conference, San Diego, CA, USA, 1–4 November 1998.
- Sarin, P.; Sarin, P.; Bebee, J.; Beckett, M.; Jim, K.; Lytle, D.; Clement, J.; Kriven, W.; Snoeyink, V. Mechanism of release of iron from corroded iron/steel pipes in water distribution systems. In Proceedings of the Annual Technology Confrence, Denver, CO, USA, 11–15 June 2000.
- Mcneiill, L.S.; Edwards, M. Iron pipe corrosion in distribution systems. Am. Water Works Assoc. 2001, 93, 88–100. [Google Scholar]
- Kuch, A. Investigations of the reduction and re-oxidation kinetics of iron (III) oxide scales formed in waters. Corros. Sci. 1988, 28, 221–231. [Google Scholar] [CrossRef]
- Baek, W.-C.; Kang, T.; Sohn, H.-J.; Kho, Y.T. In situ surface enhanced Raman spectroscopic study on the effect of dissolved oxygen on the corrosion film on low carbon steel in 0.01 M NaCl solution. Electrochim. Acta 2001, 46, 2321–2325. [Google Scholar] [CrossRef]
- Eliyan, F.F.; Mahdi, E.; Alfantazi, A. Investigating the corrosion of API-X100 pipeline steel in aerated carbonate solutions by electrochemical methods. Int. J. Electrochem. Sci. 2013, 8, 578–590. [Google Scholar]
- Eyu, G.D.; Will, G.; Dekkers, W.; Macleod, J. Effect of hydrodynamics and surface roughness on the electrochemical behaviour of carbon steel in CSG produced water. Appl. Surf. Sci. 2015, 357, 506–515. [Google Scholar] [CrossRef]
- Popova, A.; Sokolova, E.; Raicheva, S.; Christov, M. AC and DC study of the temperature effect on mild steel corrosion in acid media in the presence of benzimidazole derivatives. Corros. Sci. 2003, 45, 33–58. [Google Scholar] [CrossRef]
- Khaled, K.; Hackerman, N. Investigation of the inhibitive effect of ortho-substituted anilines on corrosion of iron in 1 M HCl solutions. Electrochim. Acta 2003, 48, 2715–2723. [Google Scholar] [CrossRef]
- Eliyan, F.F.; Mahdi, E.-S.; Alfantazi, A. Electrochemical evaluation of the corrosion behaviour of API-X100 pipeline steel in aerated bicarbonate solutions. Corros. Sci. 2012, 58, 181–191. [Google Scholar] [CrossRef]
- Zhang, L.; Li, X.G.; Du, C.W.; Cheng, Y.F. Corrosion and stress corrosion cracking behavior of X70 pipeline steel in a CO2-containing solution. J. Mater. Eng. Perform. 2009, 18, 319–323. [Google Scholar] [CrossRef]
- Park, J.-J.; Pyun, S.-I.; Lee, W.-J.; Kim, H.-P. Effect of bicarbonate ion additives on pitting corrosion of type 316L stainless steel in aqueous 0.5 M sodium chloride solution. Corrosion 1999, 55, 380–387. [Google Scholar]
- Ståhl, K.; Nielsen, K.; Jiang, J.; Lebech, B.; Hanson, J.C.; Norby, P.; Lanschot, J.V. On the akaganéite crystal structure, phase transformations and possible role in post-excavational corrosion of iron artifacts. Corros. Sci. 2003, 45, 2563–2575. [Google Scholar] [CrossRef]
- Heuer, J.; Stubbins, J. An XPS characterization of FeCO3 films from CO2 corrosion. Corros. Sci. 1999, 41, 1231–1243. [Google Scholar] [CrossRef]
- Grosvenor, A.; Kobe, B.A.; Biesinger, M.C.; Mclntyre, N.S. Investigation of multiplet splitting of Fe 2p XPS spectra and bonding in iron compounds. Surf. Interface Anal. 2004, 36, 1564–1574. [Google Scholar] [CrossRef]
- Rowles, M.R.; Madsen, I.C. Whole-pattern profile fitting of powder diffraction data collected in parallel-beam flat-plate asymmetric reflection geometry. J. Appl. Crystallogr. 2010, 43, 632–634. [Google Scholar] [CrossRef]
- Toraya, H.; Huang, T.; Wu, Y. Intensity enhancement in asymmetric diffraction with parallel-beam synchrotron radiation. J. Appl. Crystallogr. 1993, 26, 774–777. [Google Scholar] [CrossRef]
- Haggerty, R.P.; Sarin, P.; Bérar, J.-F.; Apostolov, Z.D.; Kriven, W.M. Powder diffraction by fixed incident angle reflection using a curved position-sensitive detector. J. Appl. Crystallogr. 2010, 43, 560–569. [Google Scholar] [CrossRef]


| DO (ppm) | Icorr (µA·cm−2) | Ecorr (mV) | ba (mV·dec−1) | −bc (mV·dec−1) |
|---|---|---|---|---|
| 0.8 | 22.28 | −767.5 | 163.0 | 302.9 |
| 1 | 25.24 | −780.6 | 138.5 | 222.9 |
| 4 | 201.52 | −369.2 | 243.5 | 240.3 |
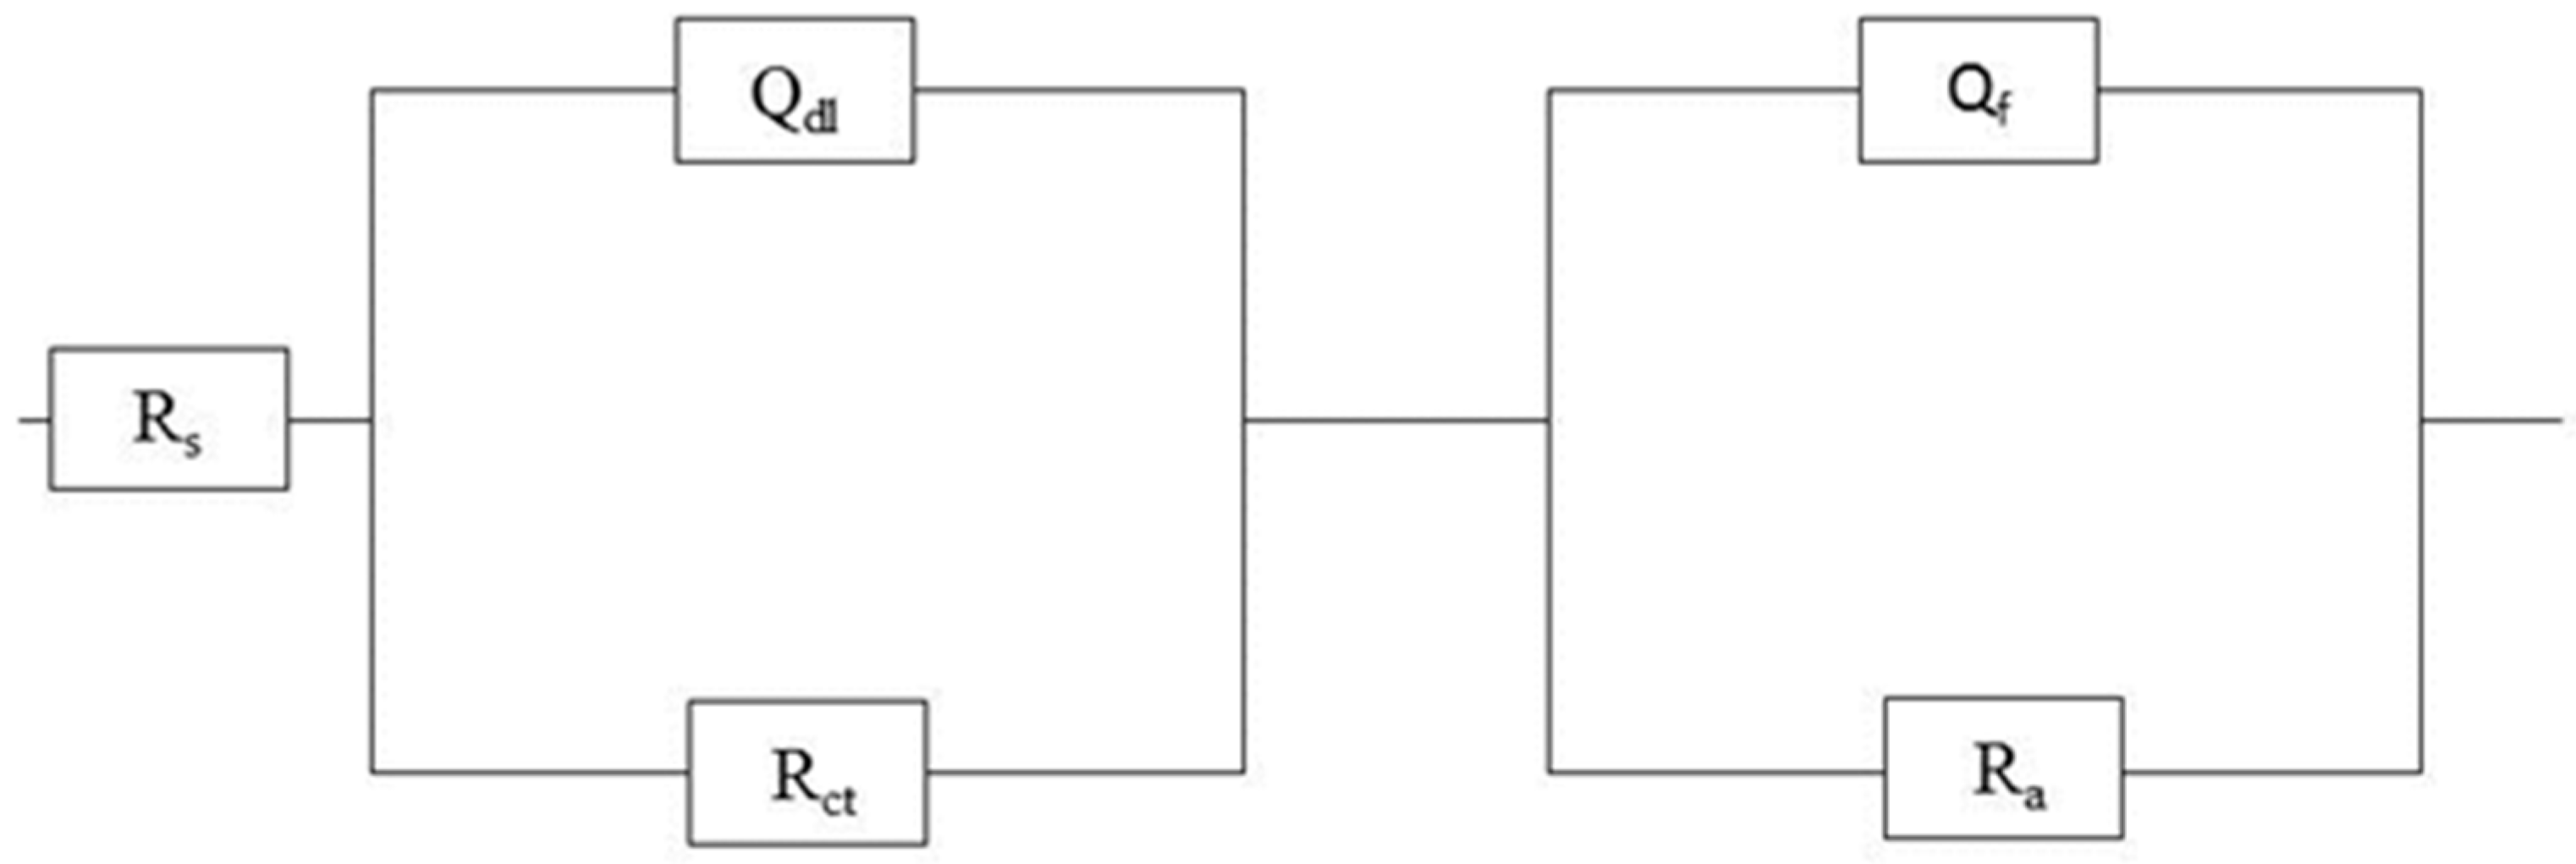
| DO (ppm) | Rs (Ω·cm2) | Rct (Ω·cm2) | Qdl (F·cm−2) | n | Ra (Ω·cm2) | Qa (F·cm−2) |
|---|---|---|---|---|---|---|
| 0.8 | 46.3 | 1015 | 1.76 × 10⁻³ | 0.77 | 440.04 | 5.9 × 10⁻⁴ |
| 1 | 53.8 | 874.7 | 1.18 × 10⁻³ | 0.66 | 90.49 | 1.39 × 10⁻³ |
| 4 | 63.5 | 104.7 | 6.88 × 10⁻³ | 0.59 | 33.04 | 3.75 × 10⁻³ |
| Immersion Time (h) | Icorr (µA·cm−2) | Eb (mV) | Ecorr (mV) | ba (mV·dec−1) | −bc (mV·dec−1) |
|---|---|---|---|---|---|
| 2 | 22.28 | −355.0 | −767.5 | 163.0 | 302.9 |
| 4 | 8.98 | −292.3 | −820.4 | 126.6 | 138.0 |
| 8 | 6.04 | −229.1 | −833.9 | 145.6 | 134.8 |
| Immersion Time (h) | Rs (Ω·cm2) | Rct (Ω·cm2) | Qdl (F·cm−2) | n | Ra (Ω·cm2) | Qa (F·cm−2) |
|---|---|---|---|---|---|---|
| 2 | 46.3 | 1015 | 1.76 × 10⁻³ | 0.77 | 440.04 | 5.9 × 10⁻⁴ |
| 4 | 30.5 | 1370 | 1.65 × 10⁻³ | 1 | 804.0 | 5.04 × 10⁻⁴ |
| 8 | 41.6 | 2700 | 7.28 × 10⁻⁴ | 0.82 | 618.6 | 5.83 × 10⁻⁴ |
| C | Si | Mn | Cr | Cu | Ni | Fe |
|---|---|---|---|---|---|---|
| 0.20 | 0.32 | 0.79 | 0.01 | 0.01 | 0.01 | Bal |
© 2016 by the authors; licensee MDPI, Basel, Switzerland. This article is an open access article distributed under the terms and conditions of the Creative Commons Attribution (CC-BY) license (http://creativecommons.org/licenses/by/4.0/).
Share and Cite
Eyu, G.D.; Will, G.; Dekkers, W.; MacLeod, J. Effect of Dissolved Oxygen and Immersion Time on the Corrosion Behaviour of Mild Steel in Bicarbonate/Chloride Solution. Materials 2016, 9, 748. https://doi.org/10.3390/ma9090748
Eyu GD, Will G, Dekkers W, MacLeod J. Effect of Dissolved Oxygen and Immersion Time on the Corrosion Behaviour of Mild Steel in Bicarbonate/Chloride Solution. Materials. 2016; 9(9):748. https://doi.org/10.3390/ma9090748
Chicago/Turabian StyleEyu, Gaius Debi, Geoffrey Will, Willem Dekkers, and Jennifer MacLeod. 2016. "Effect of Dissolved Oxygen and Immersion Time on the Corrosion Behaviour of Mild Steel in Bicarbonate/Chloride Solution" Materials 9, no. 9: 748. https://doi.org/10.3390/ma9090748