
Formation and Entrapment of Tris(8-hydroxyquinoline)aluminum from 8-Hydroxyquinoline in Anodic Porous Alumina

Abstract
:
1. Introduction
2. Results
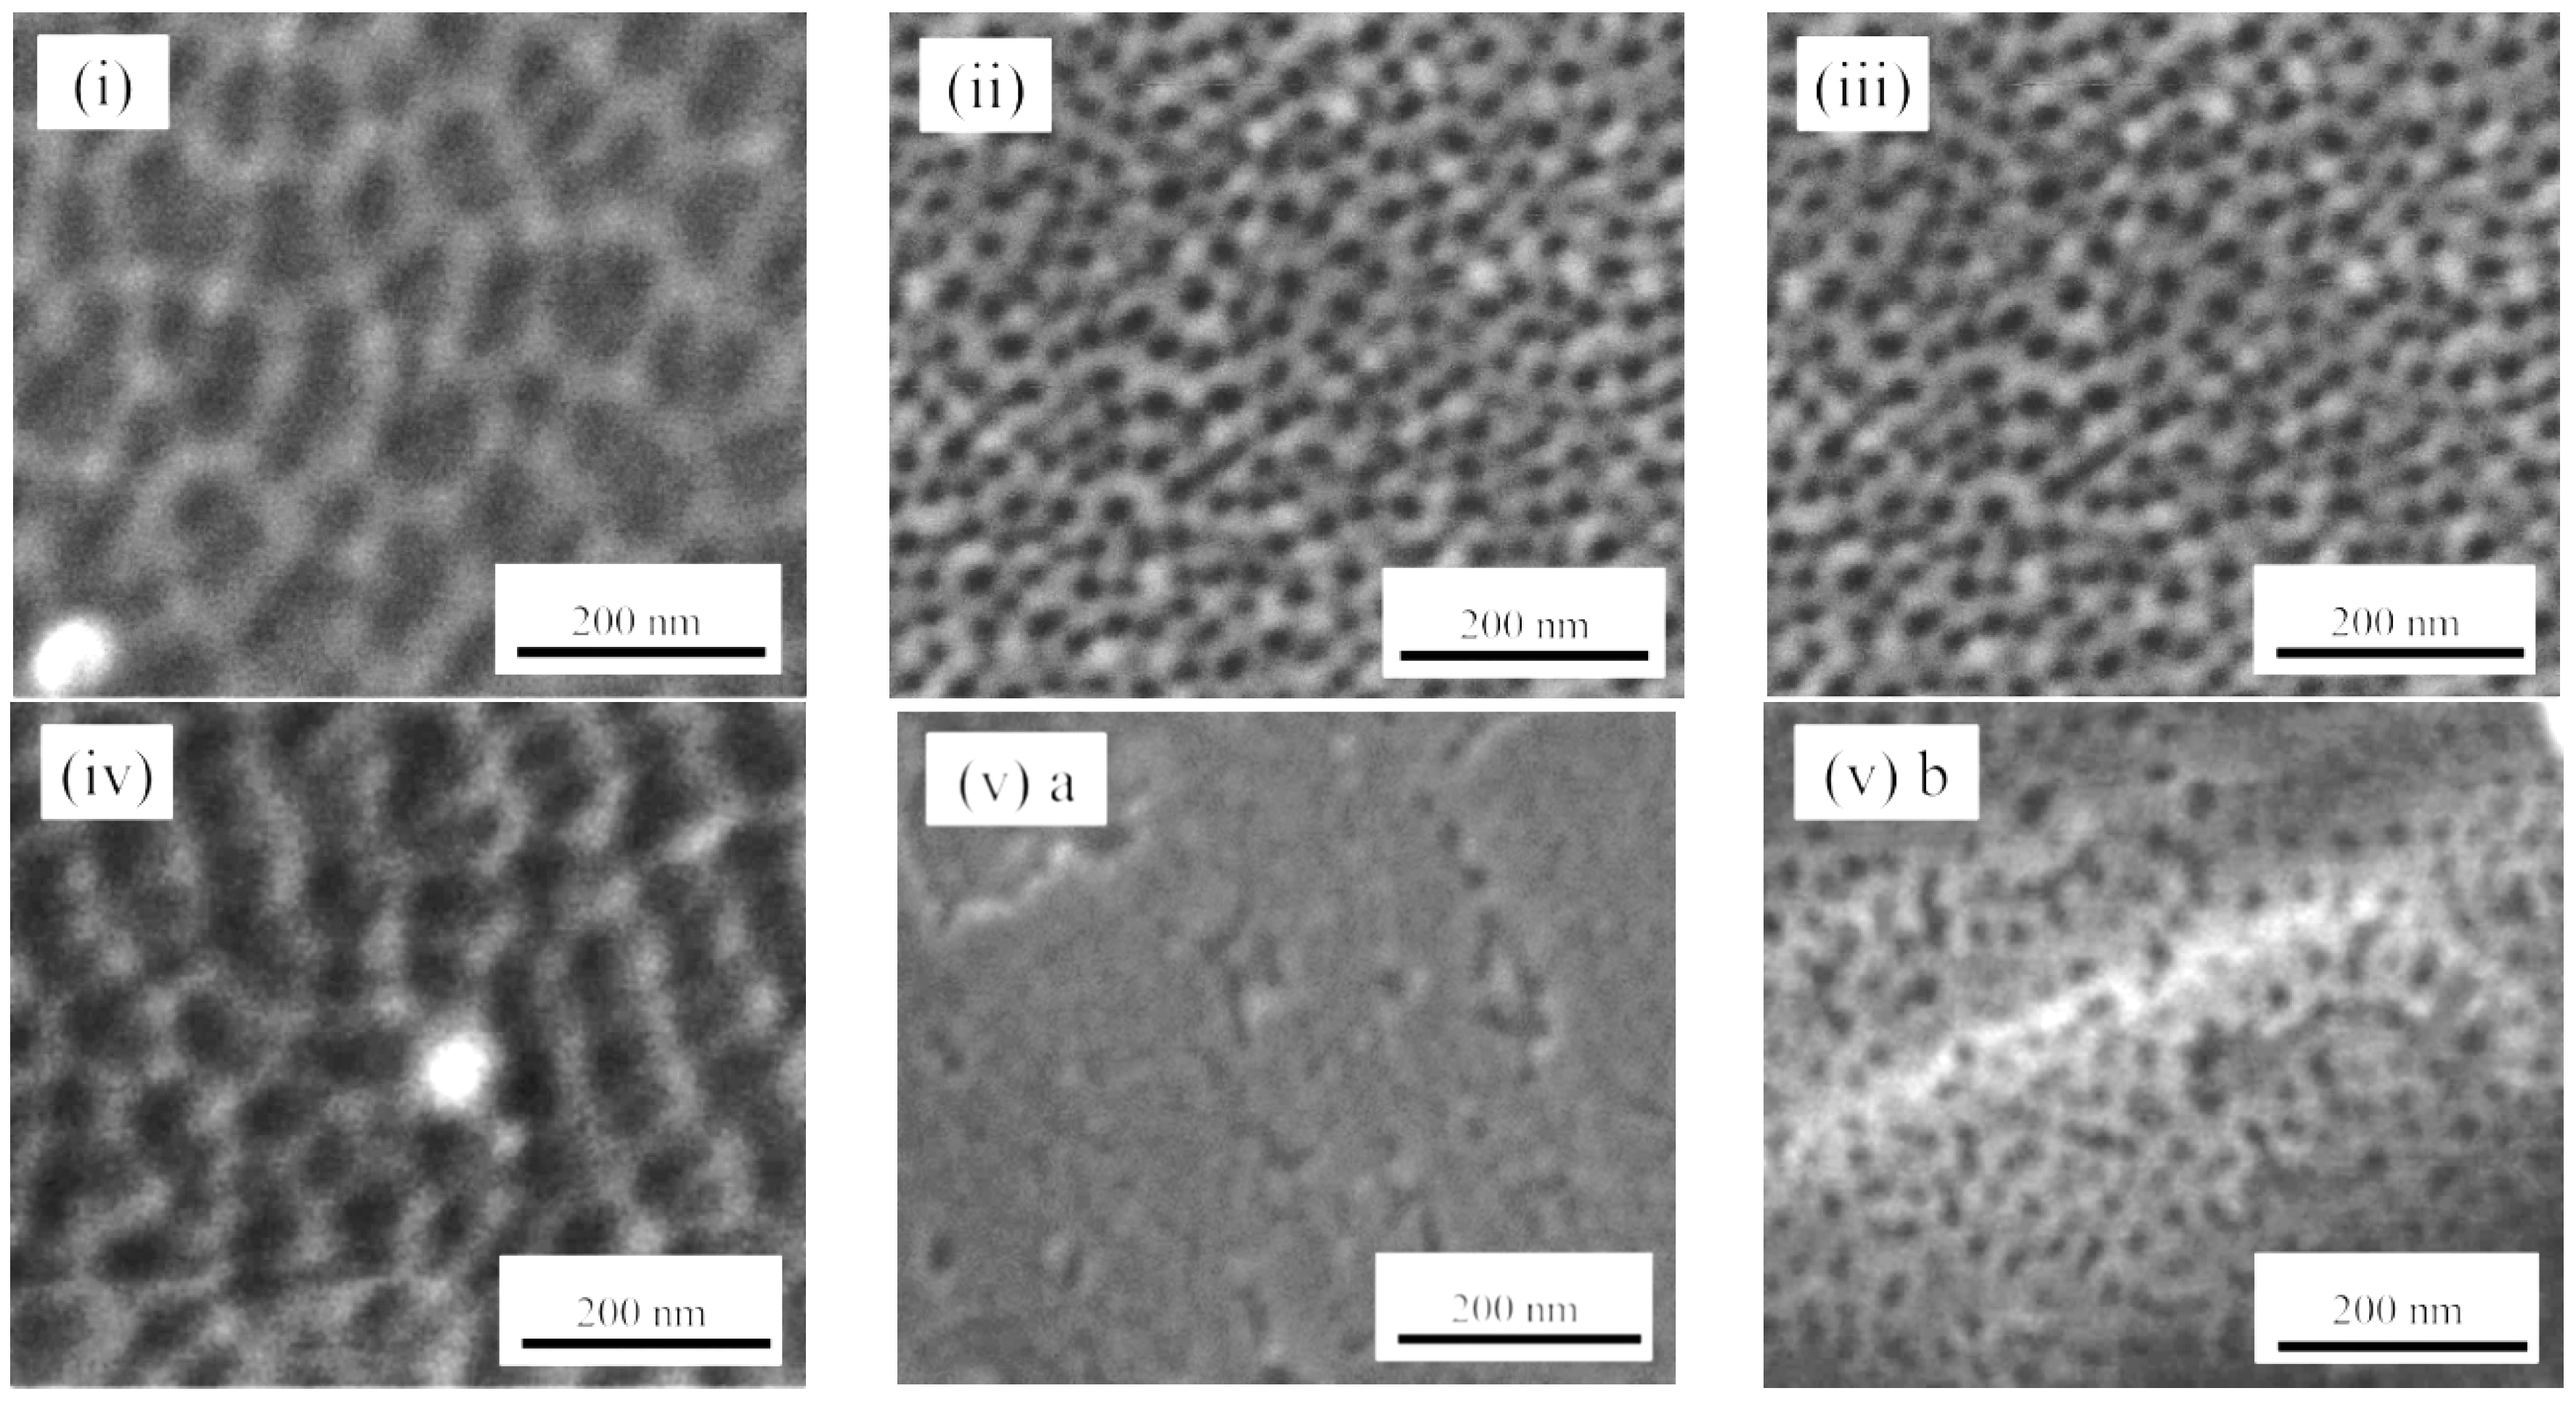
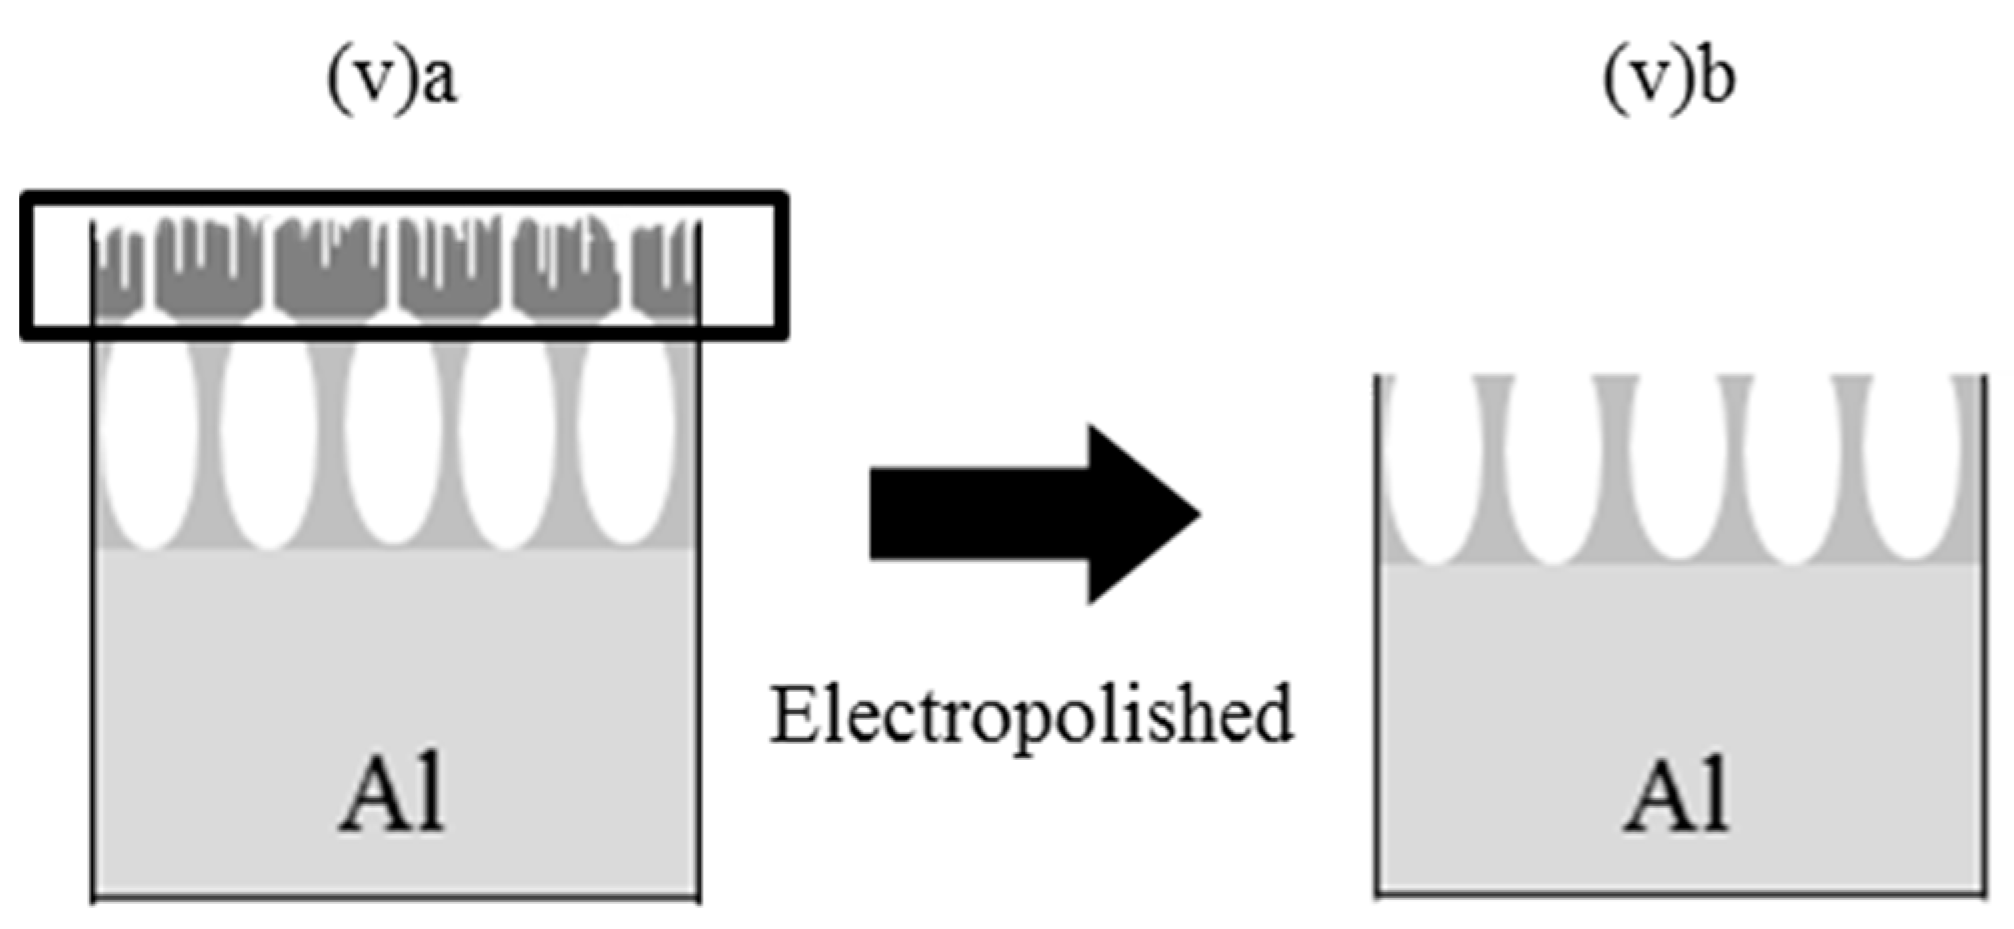
2.1. SEM Analysis of APA Surfaces
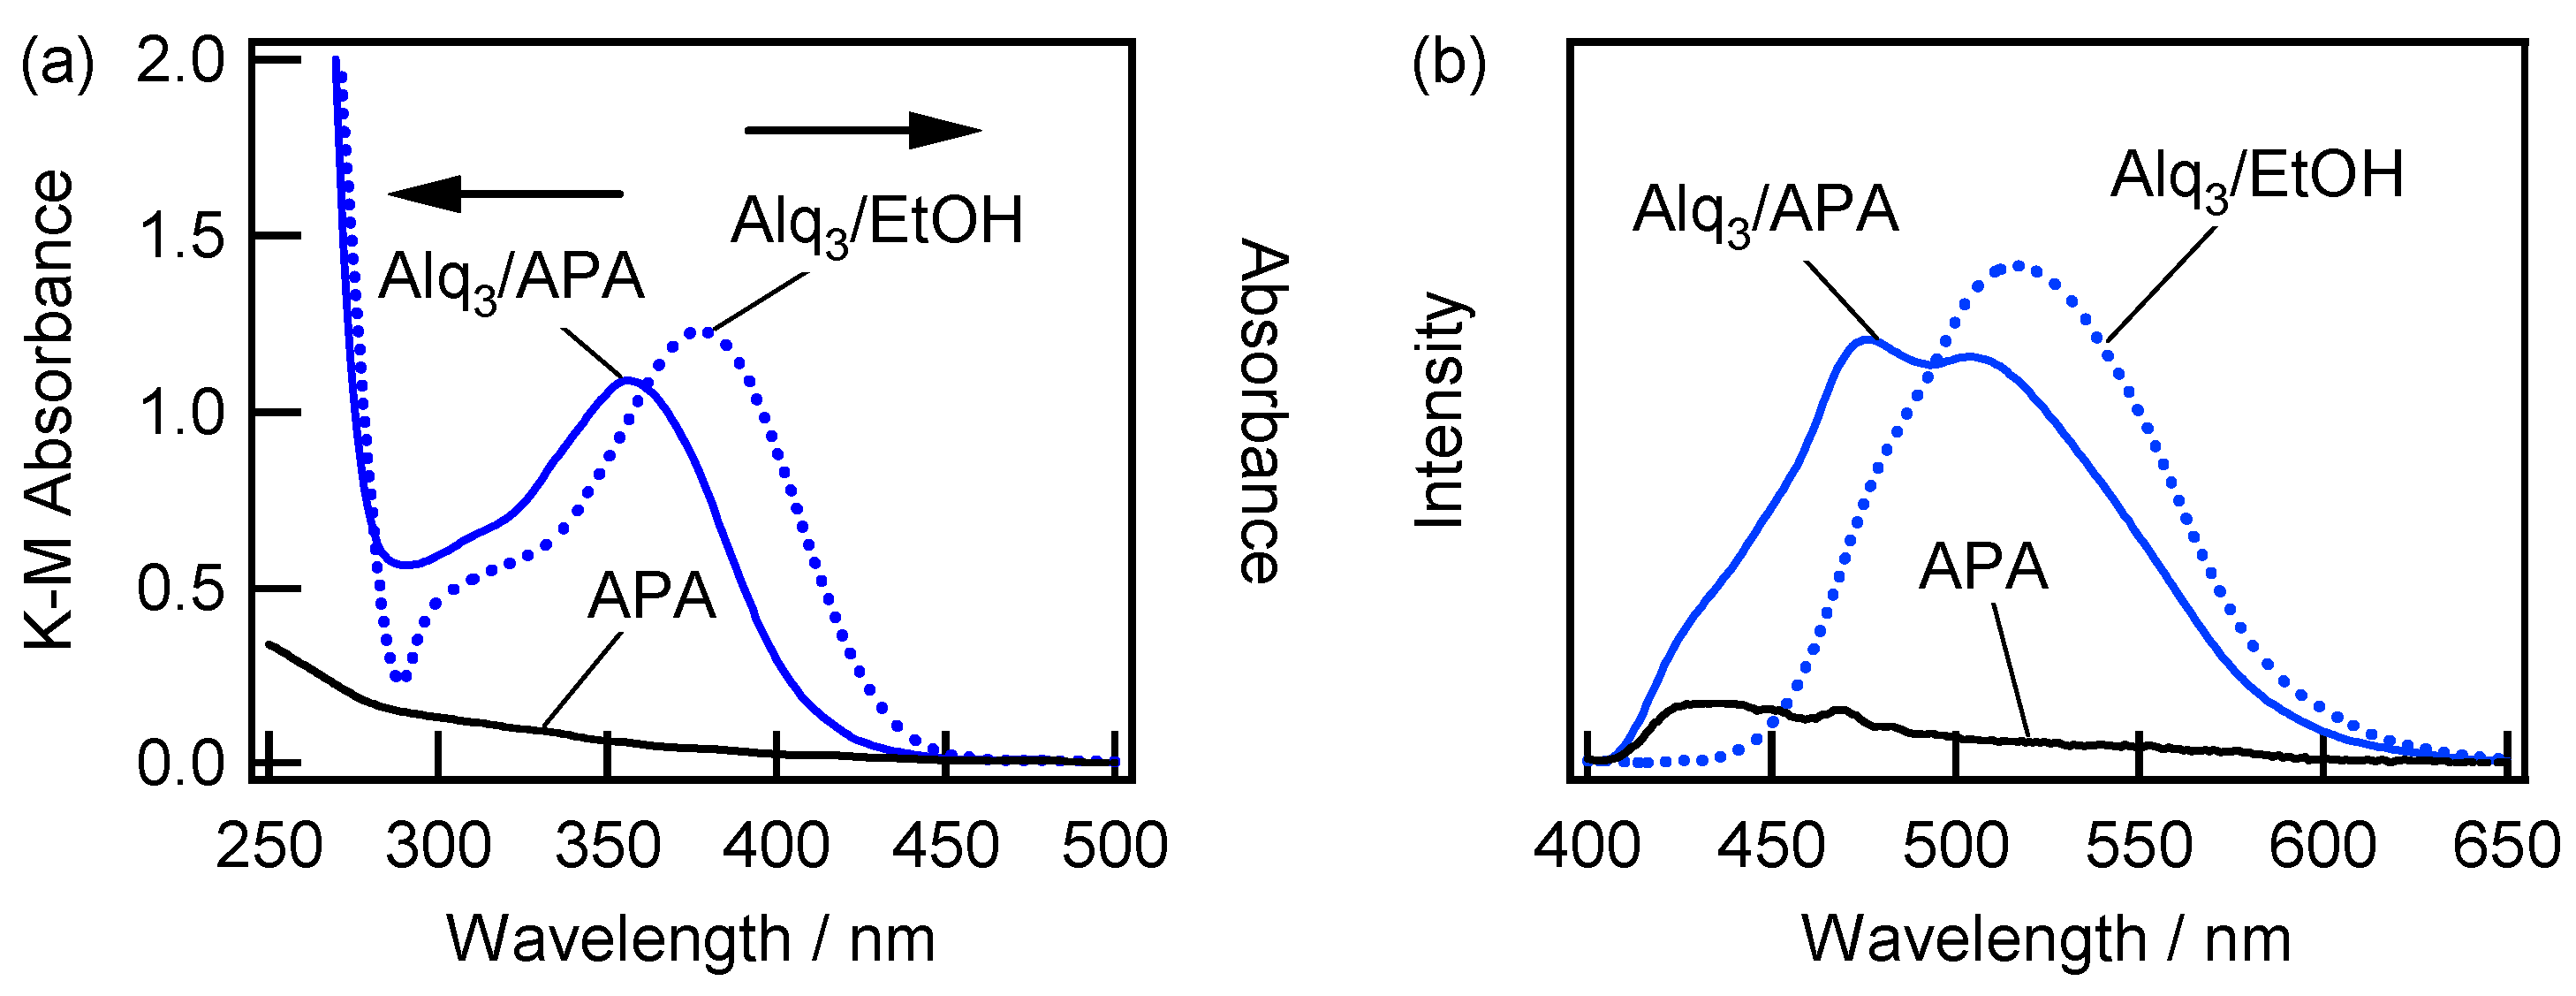
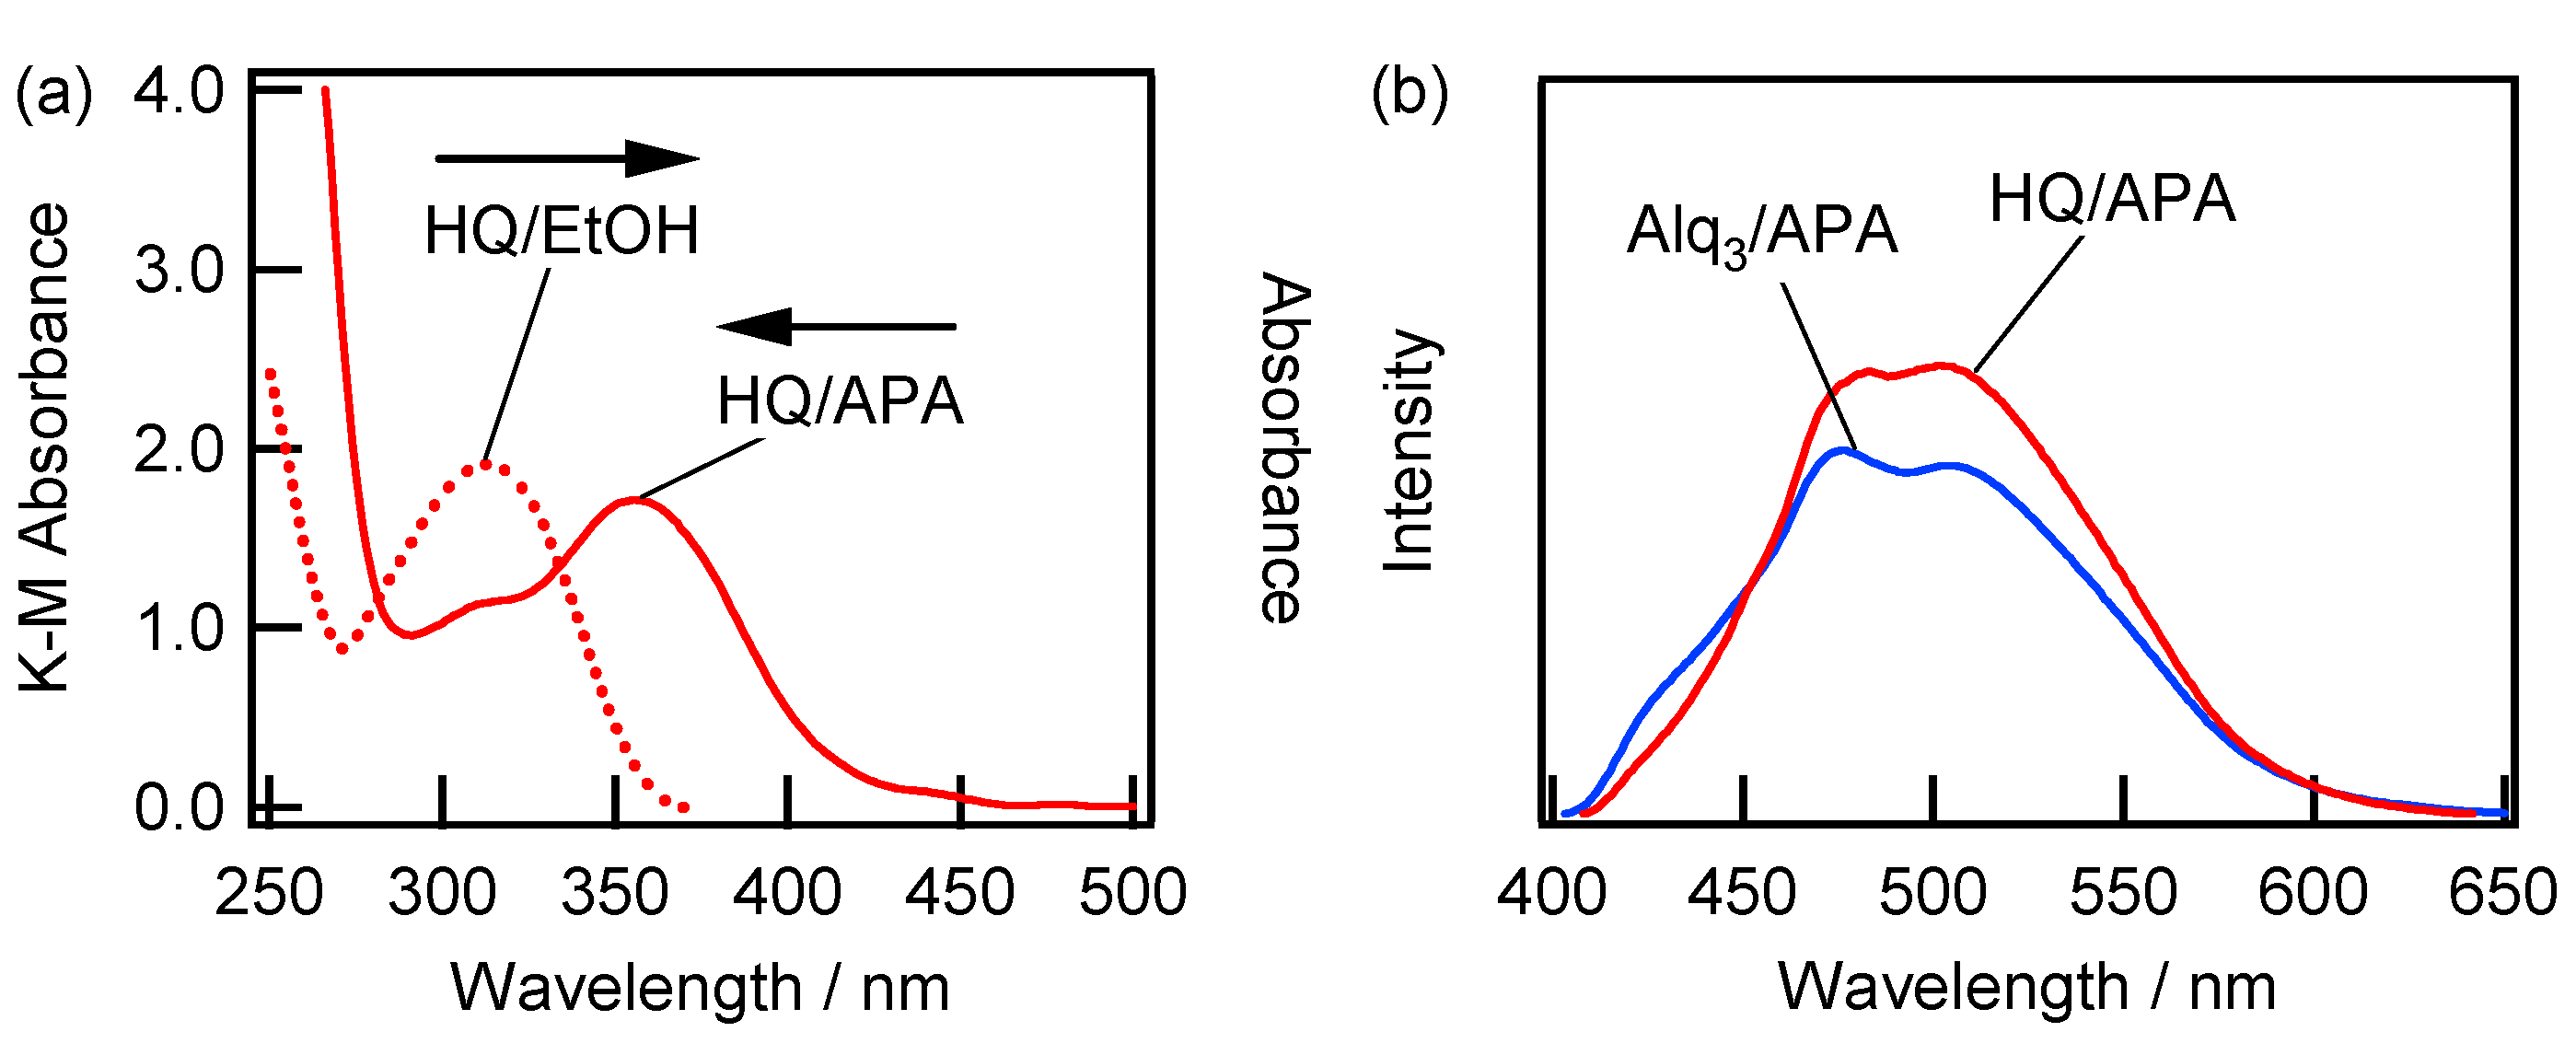
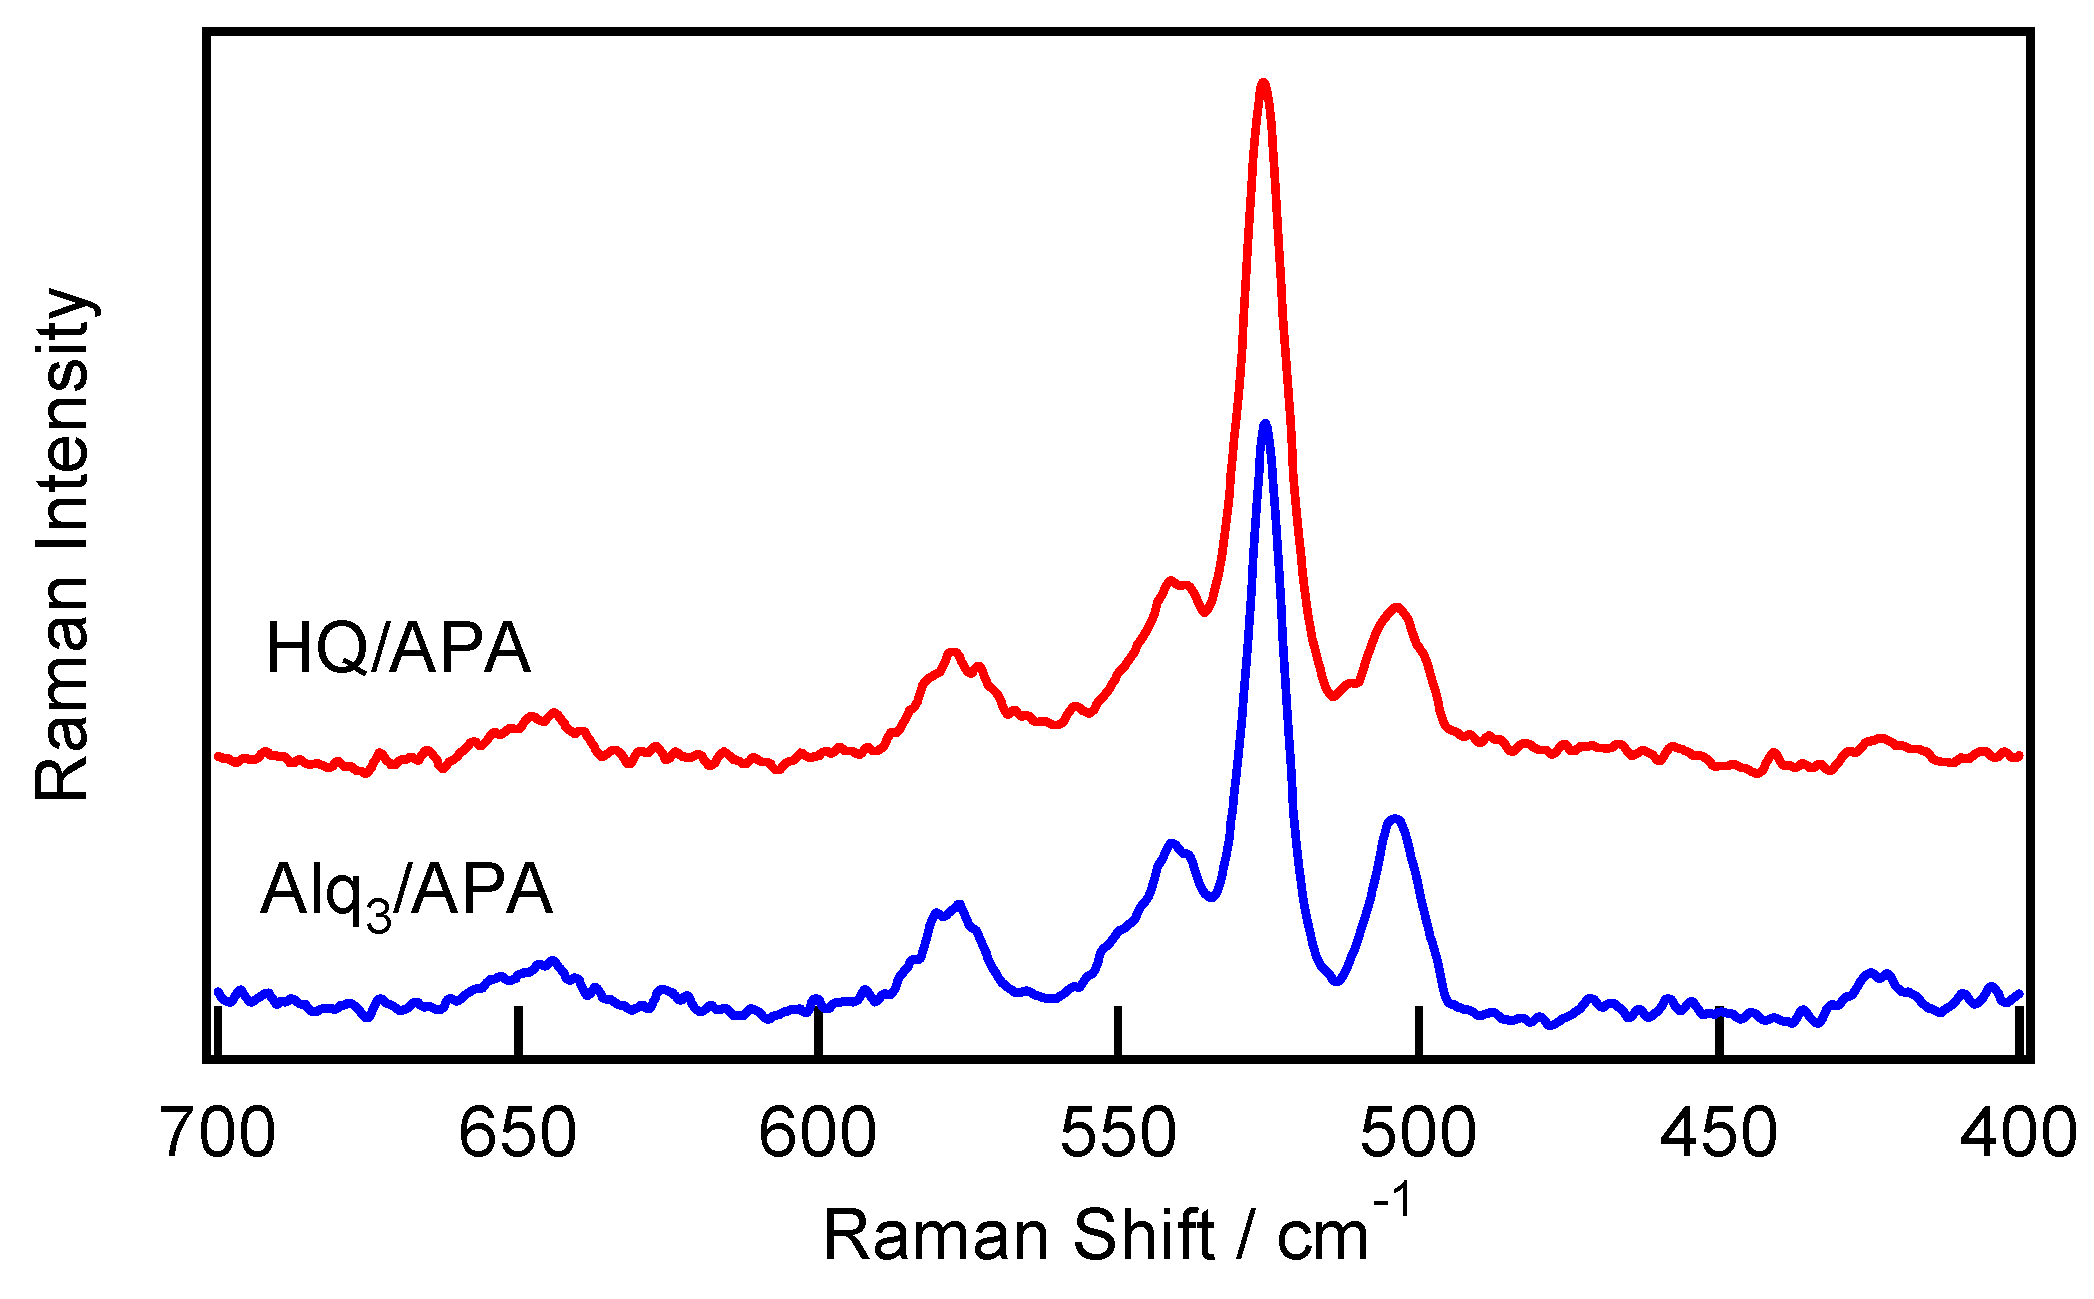
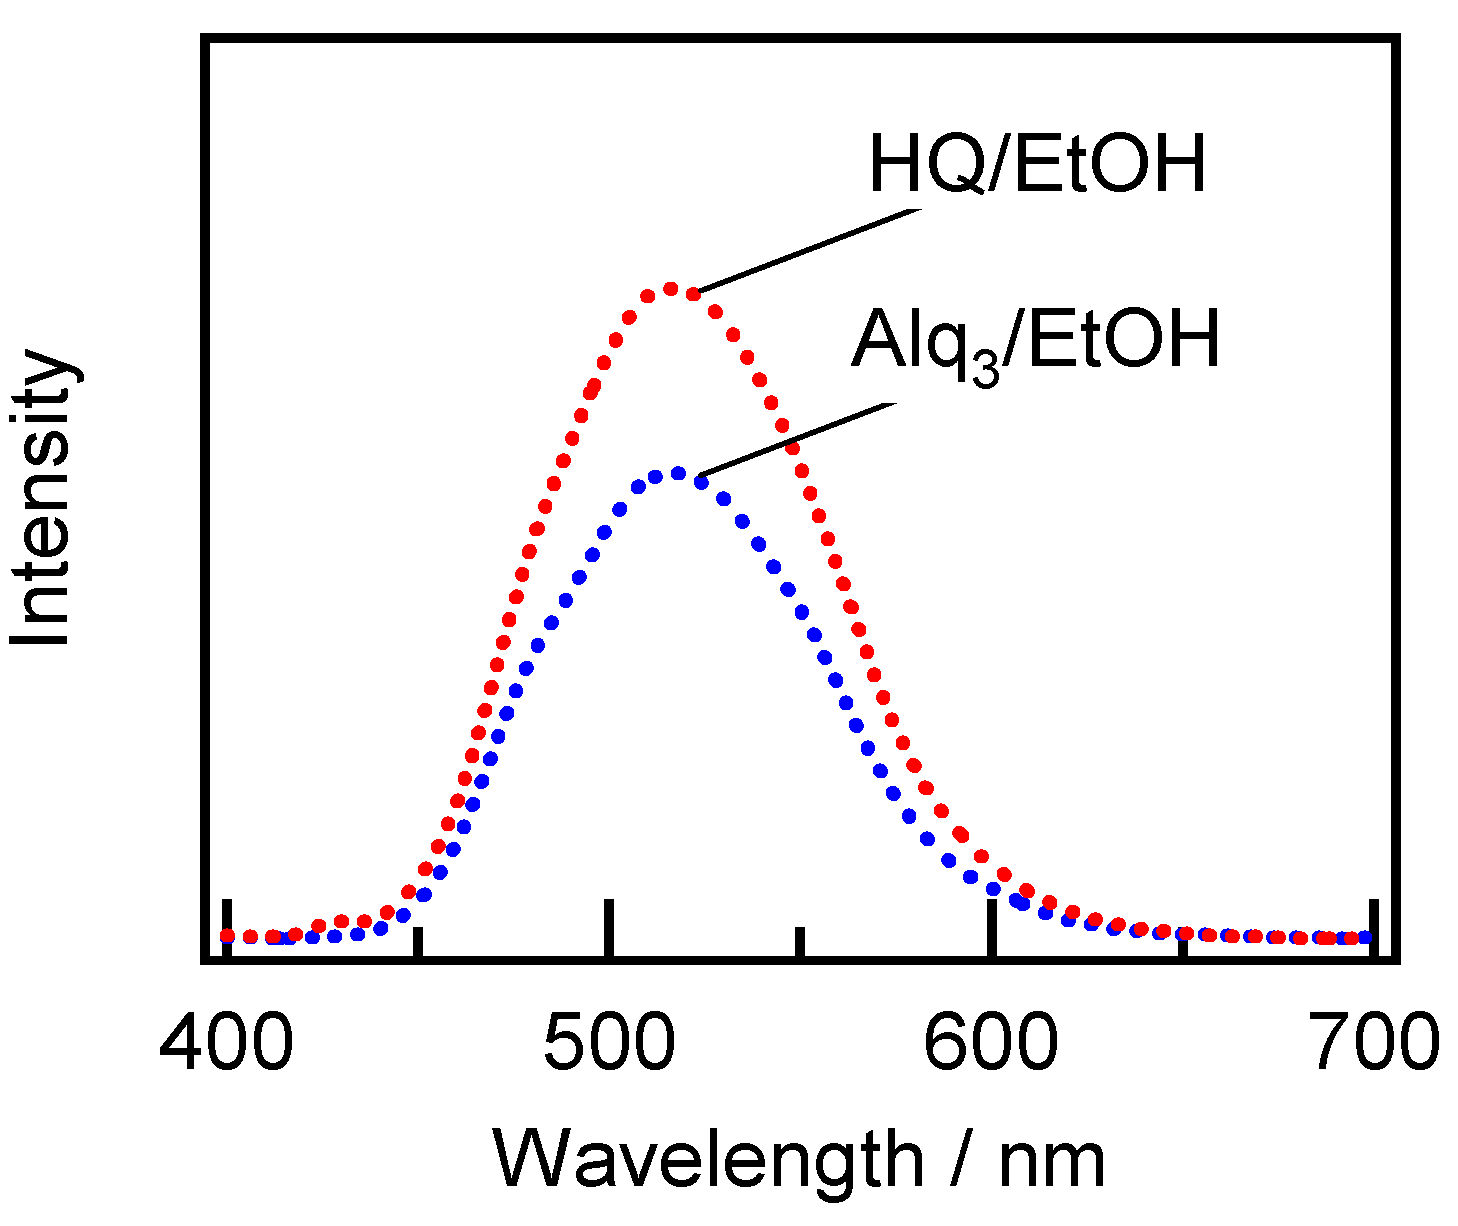
2.2. Spectroscopic Characterization of the Alq3- and HQ-Species Adsorbed on the APA Samples Prepared under the Galvanostatic Method via One-Step Anodization of Degreased Al
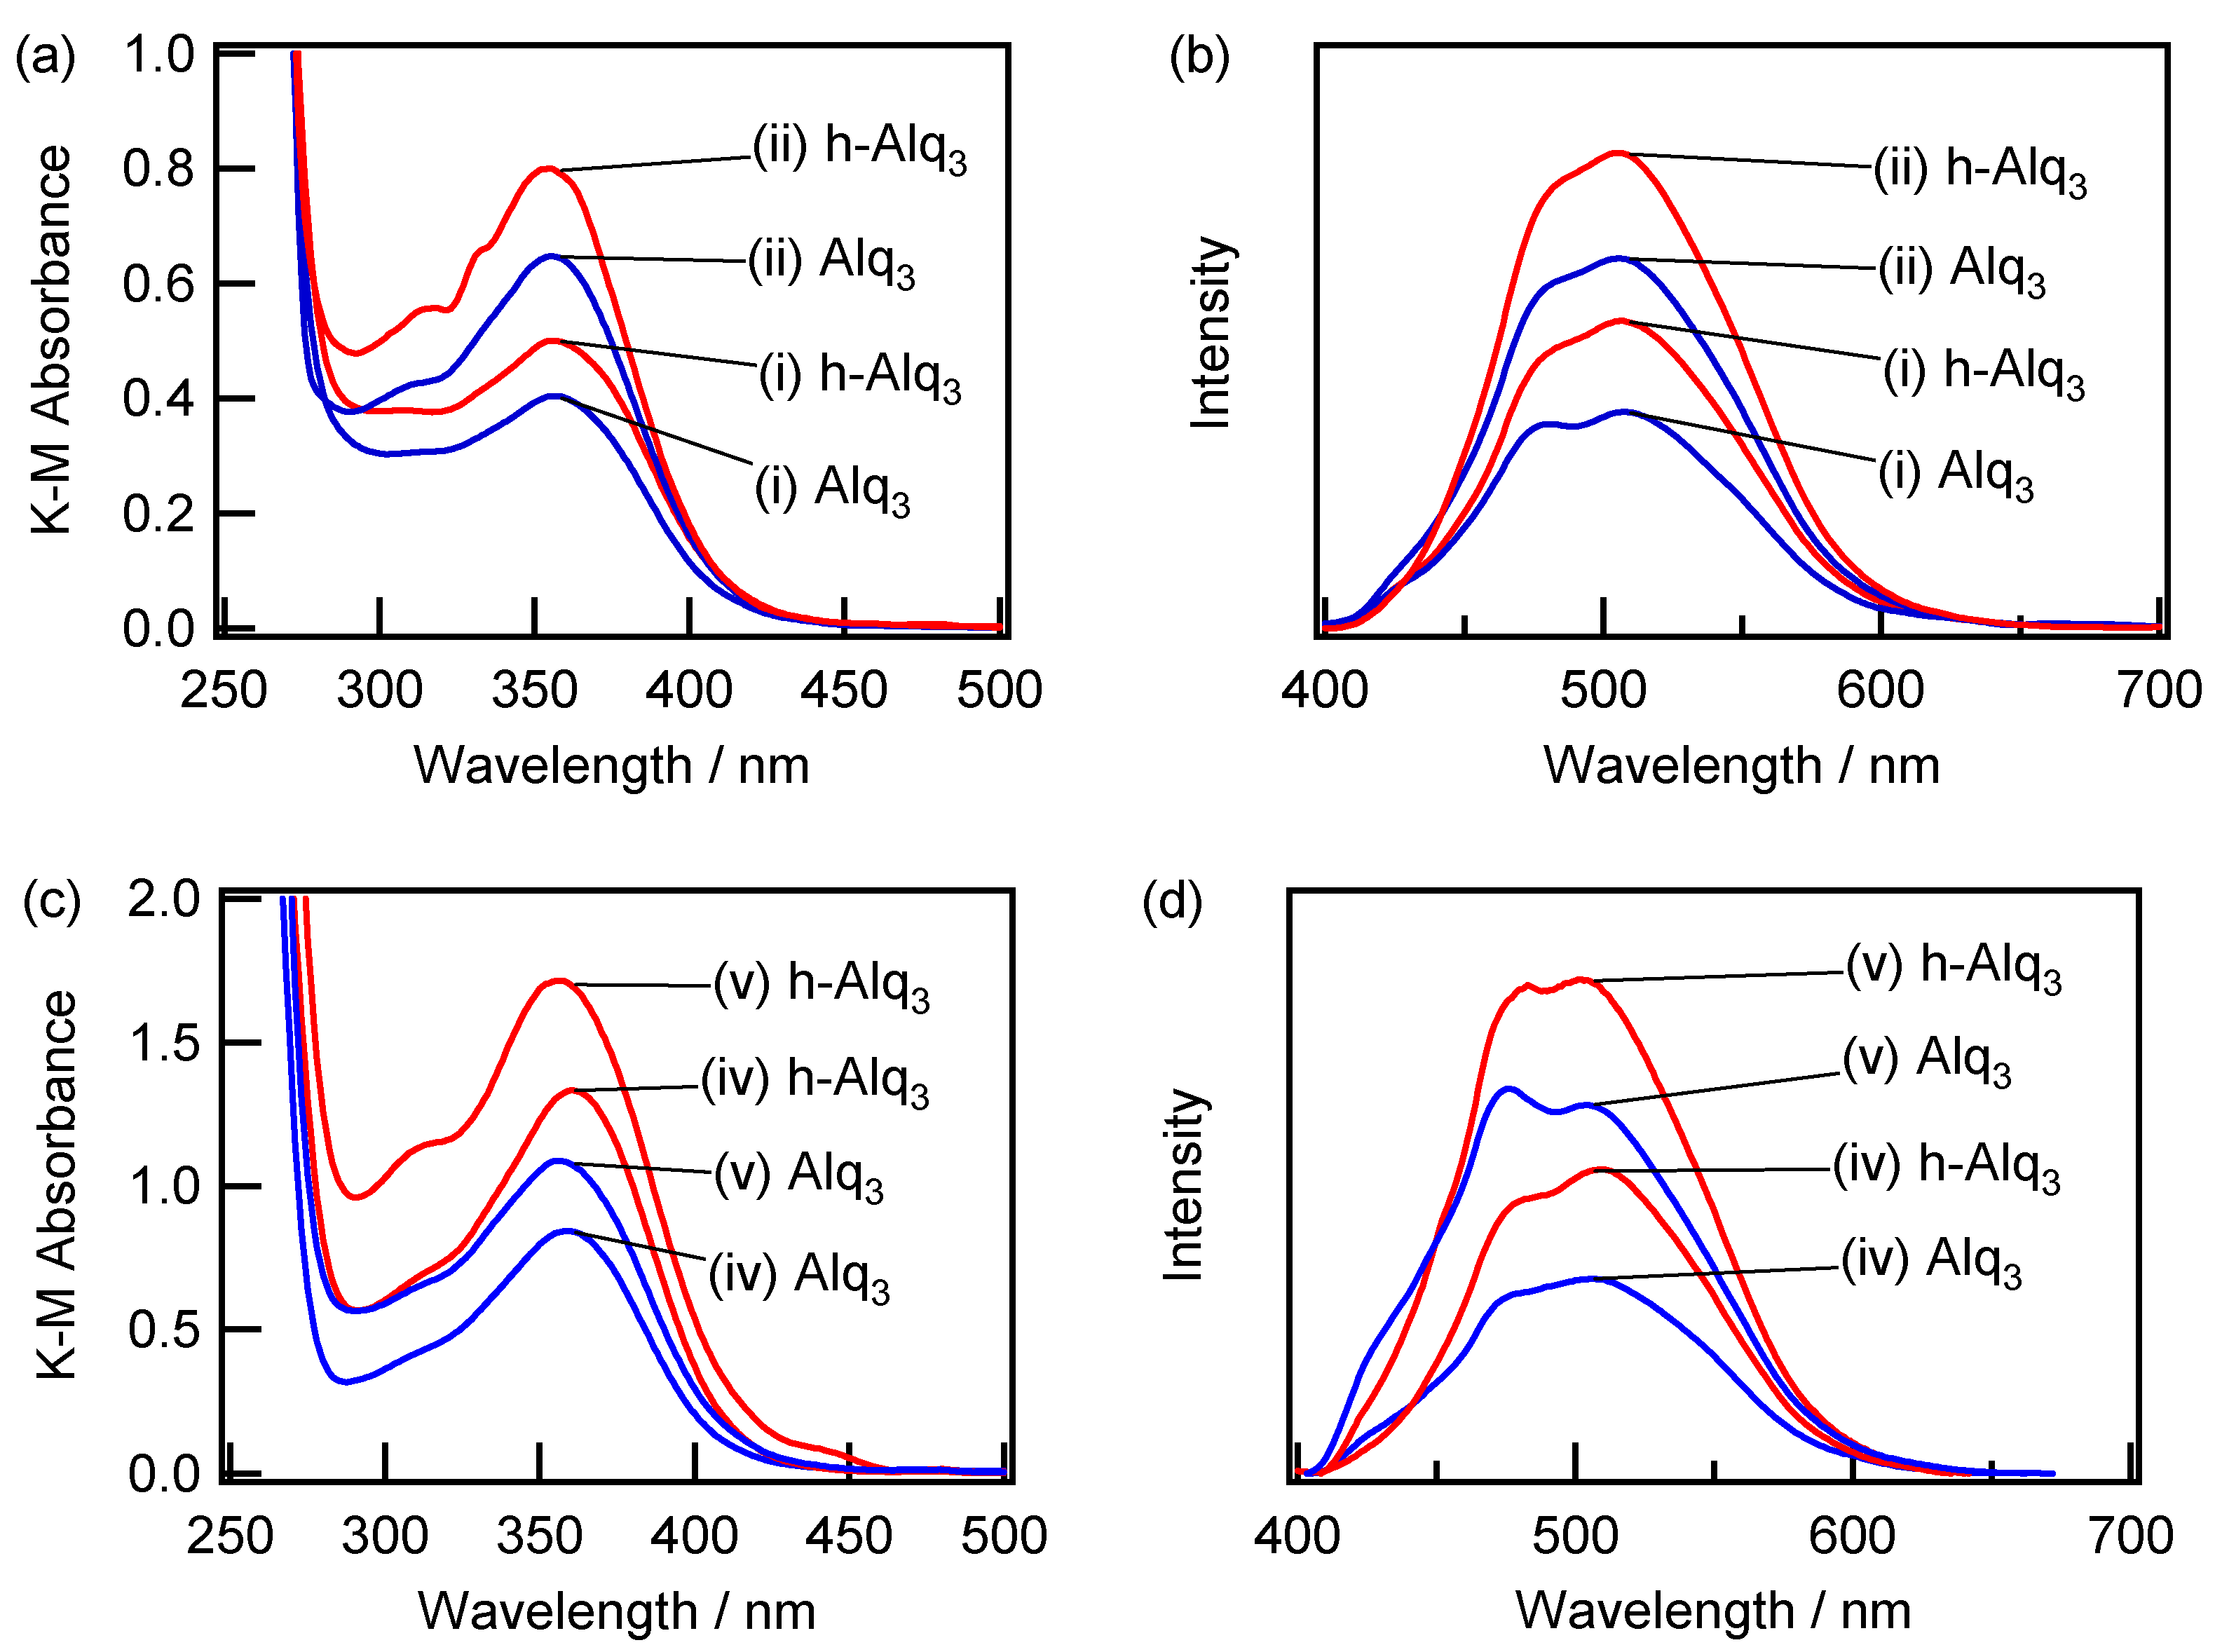
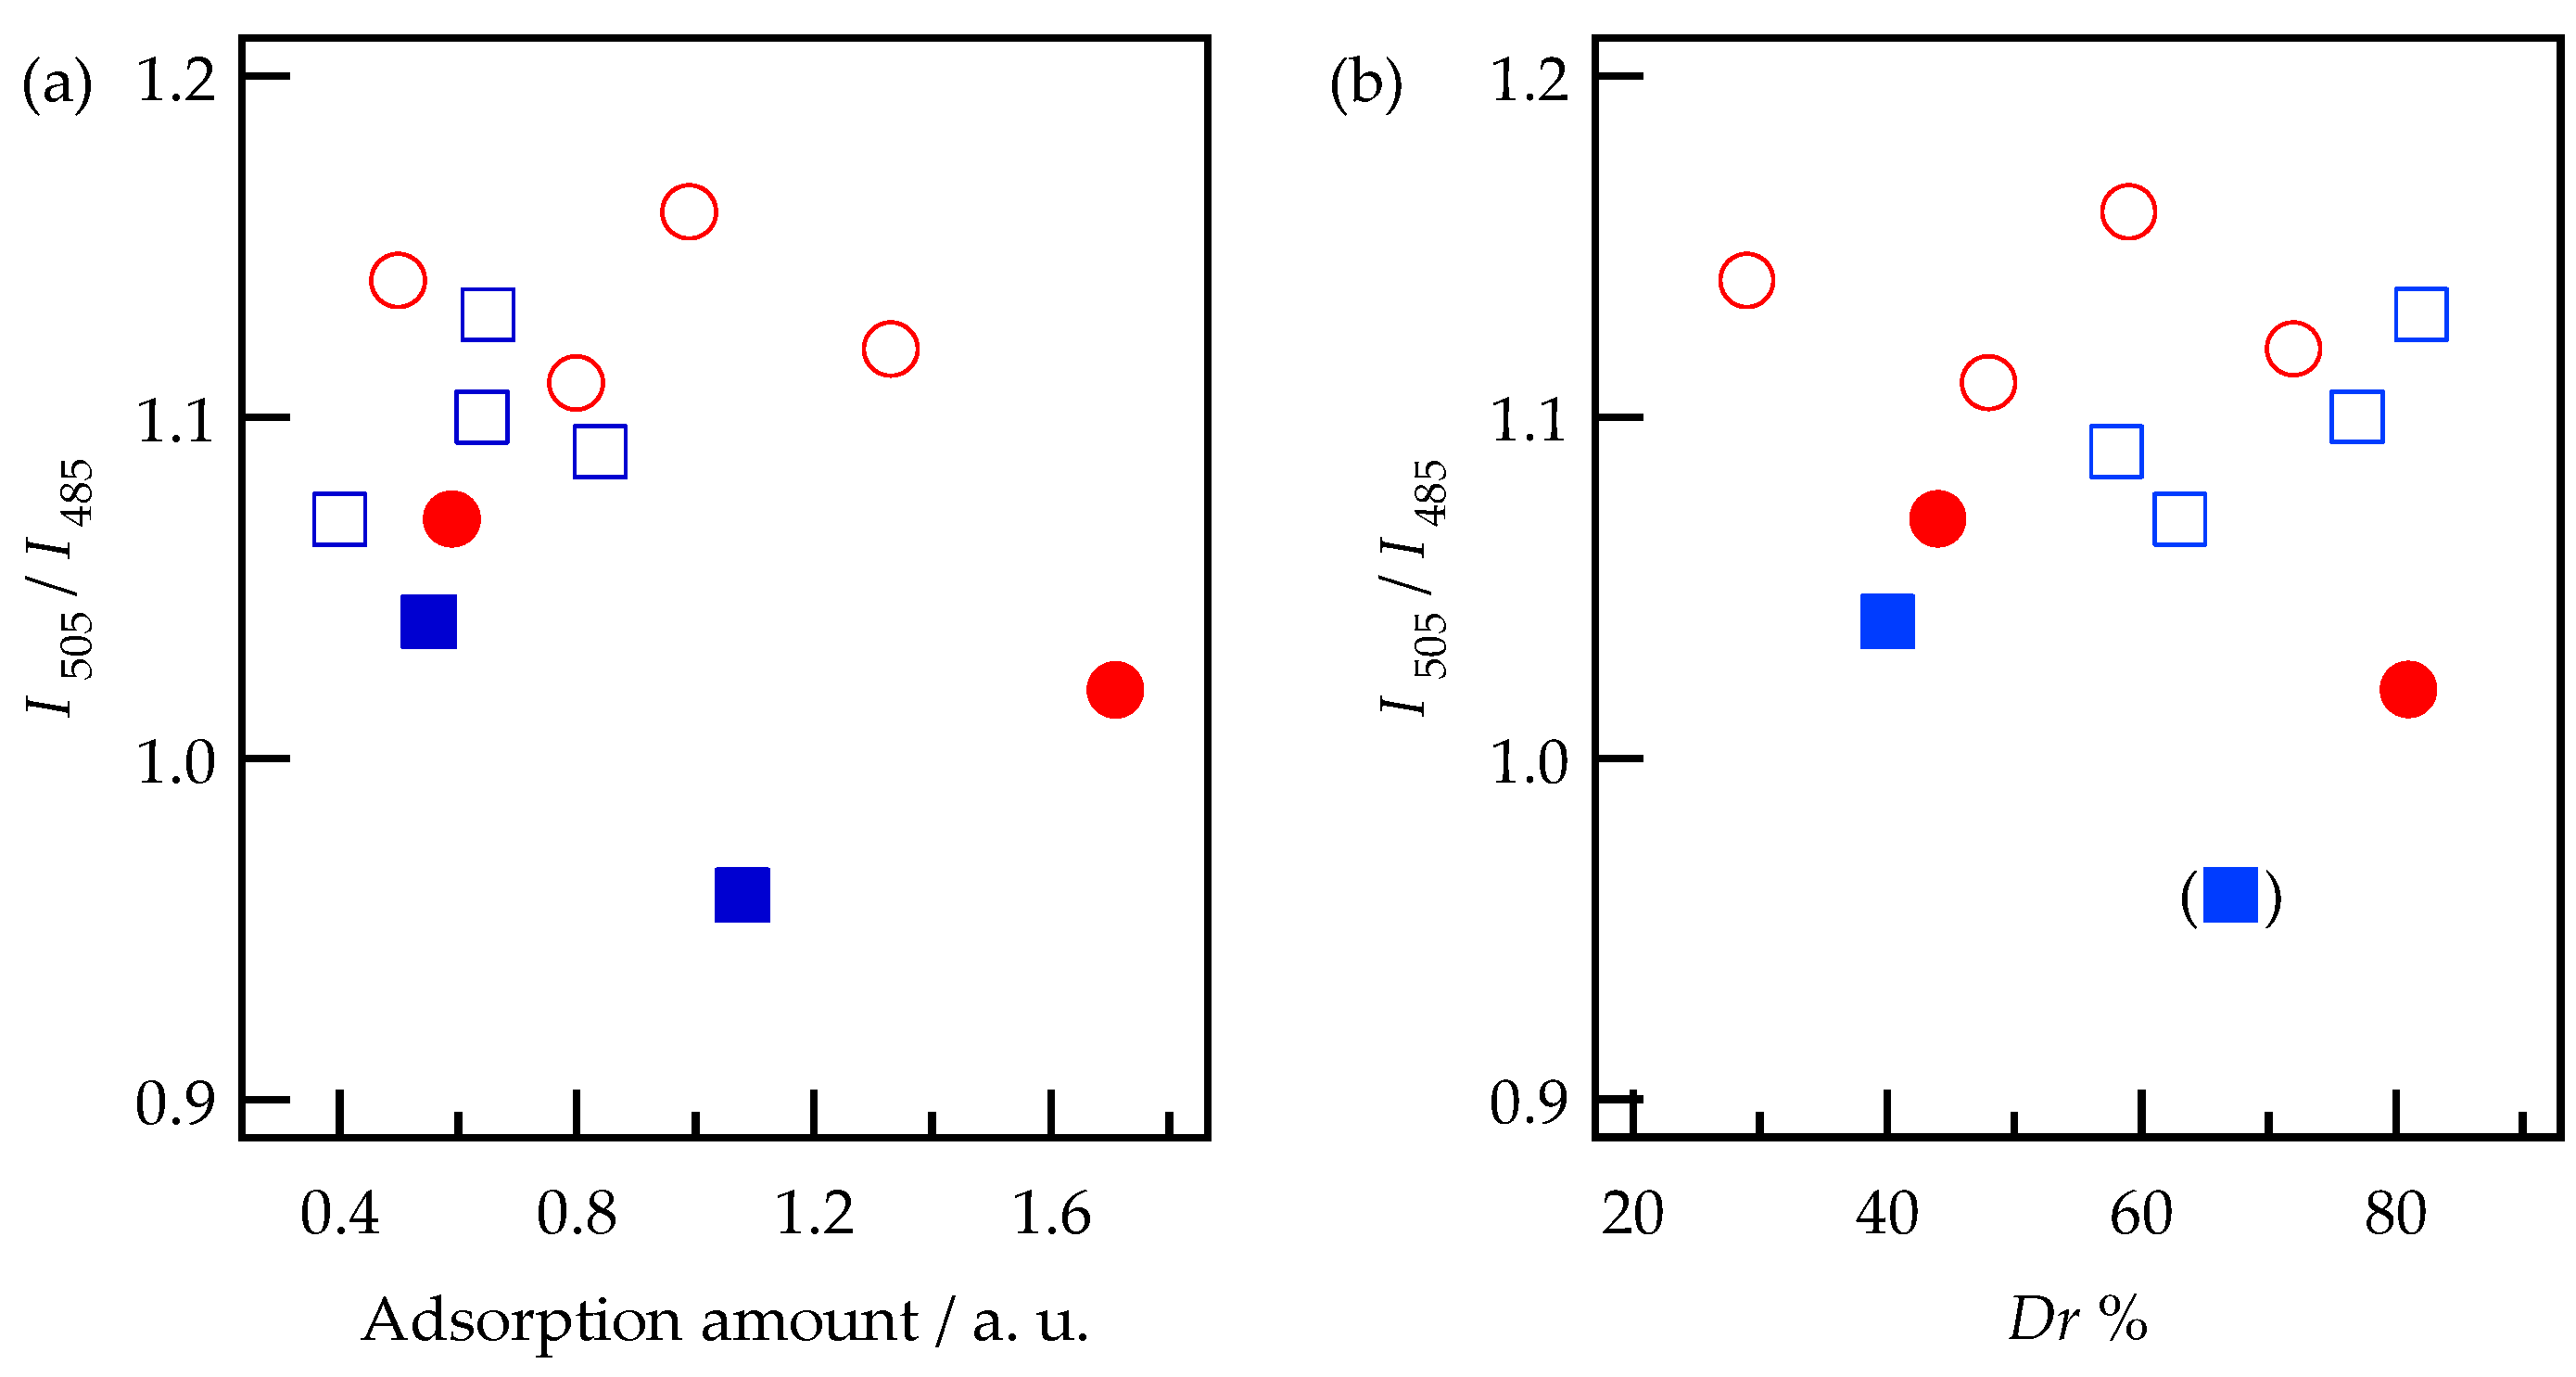
2.3. Spectroscopic Characterization of Alq3- and h-Alq3-Species on the APA Samples Anodized under Various Conditions
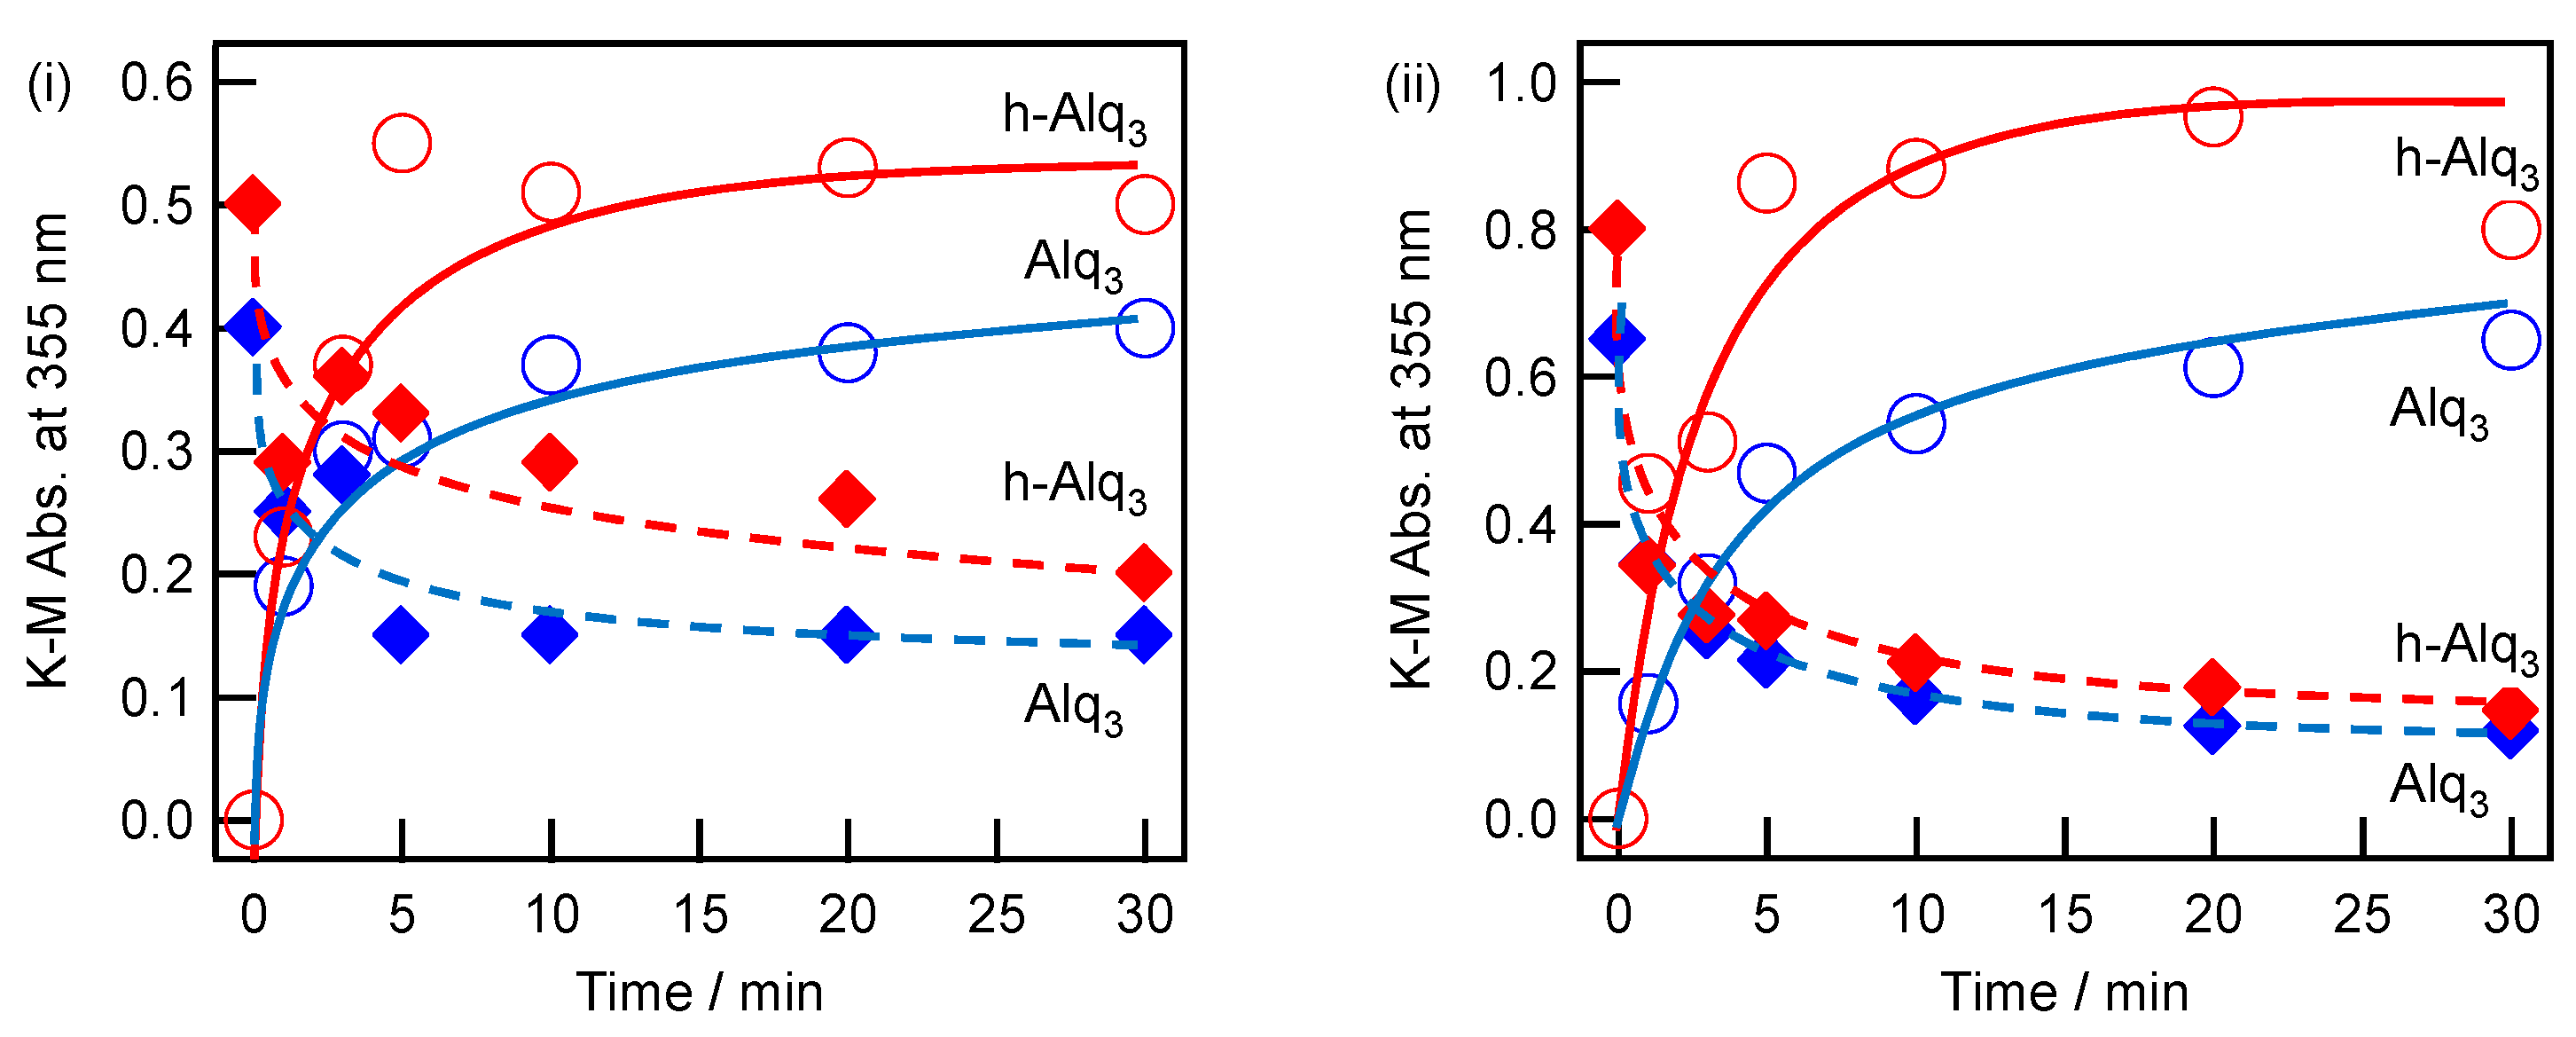
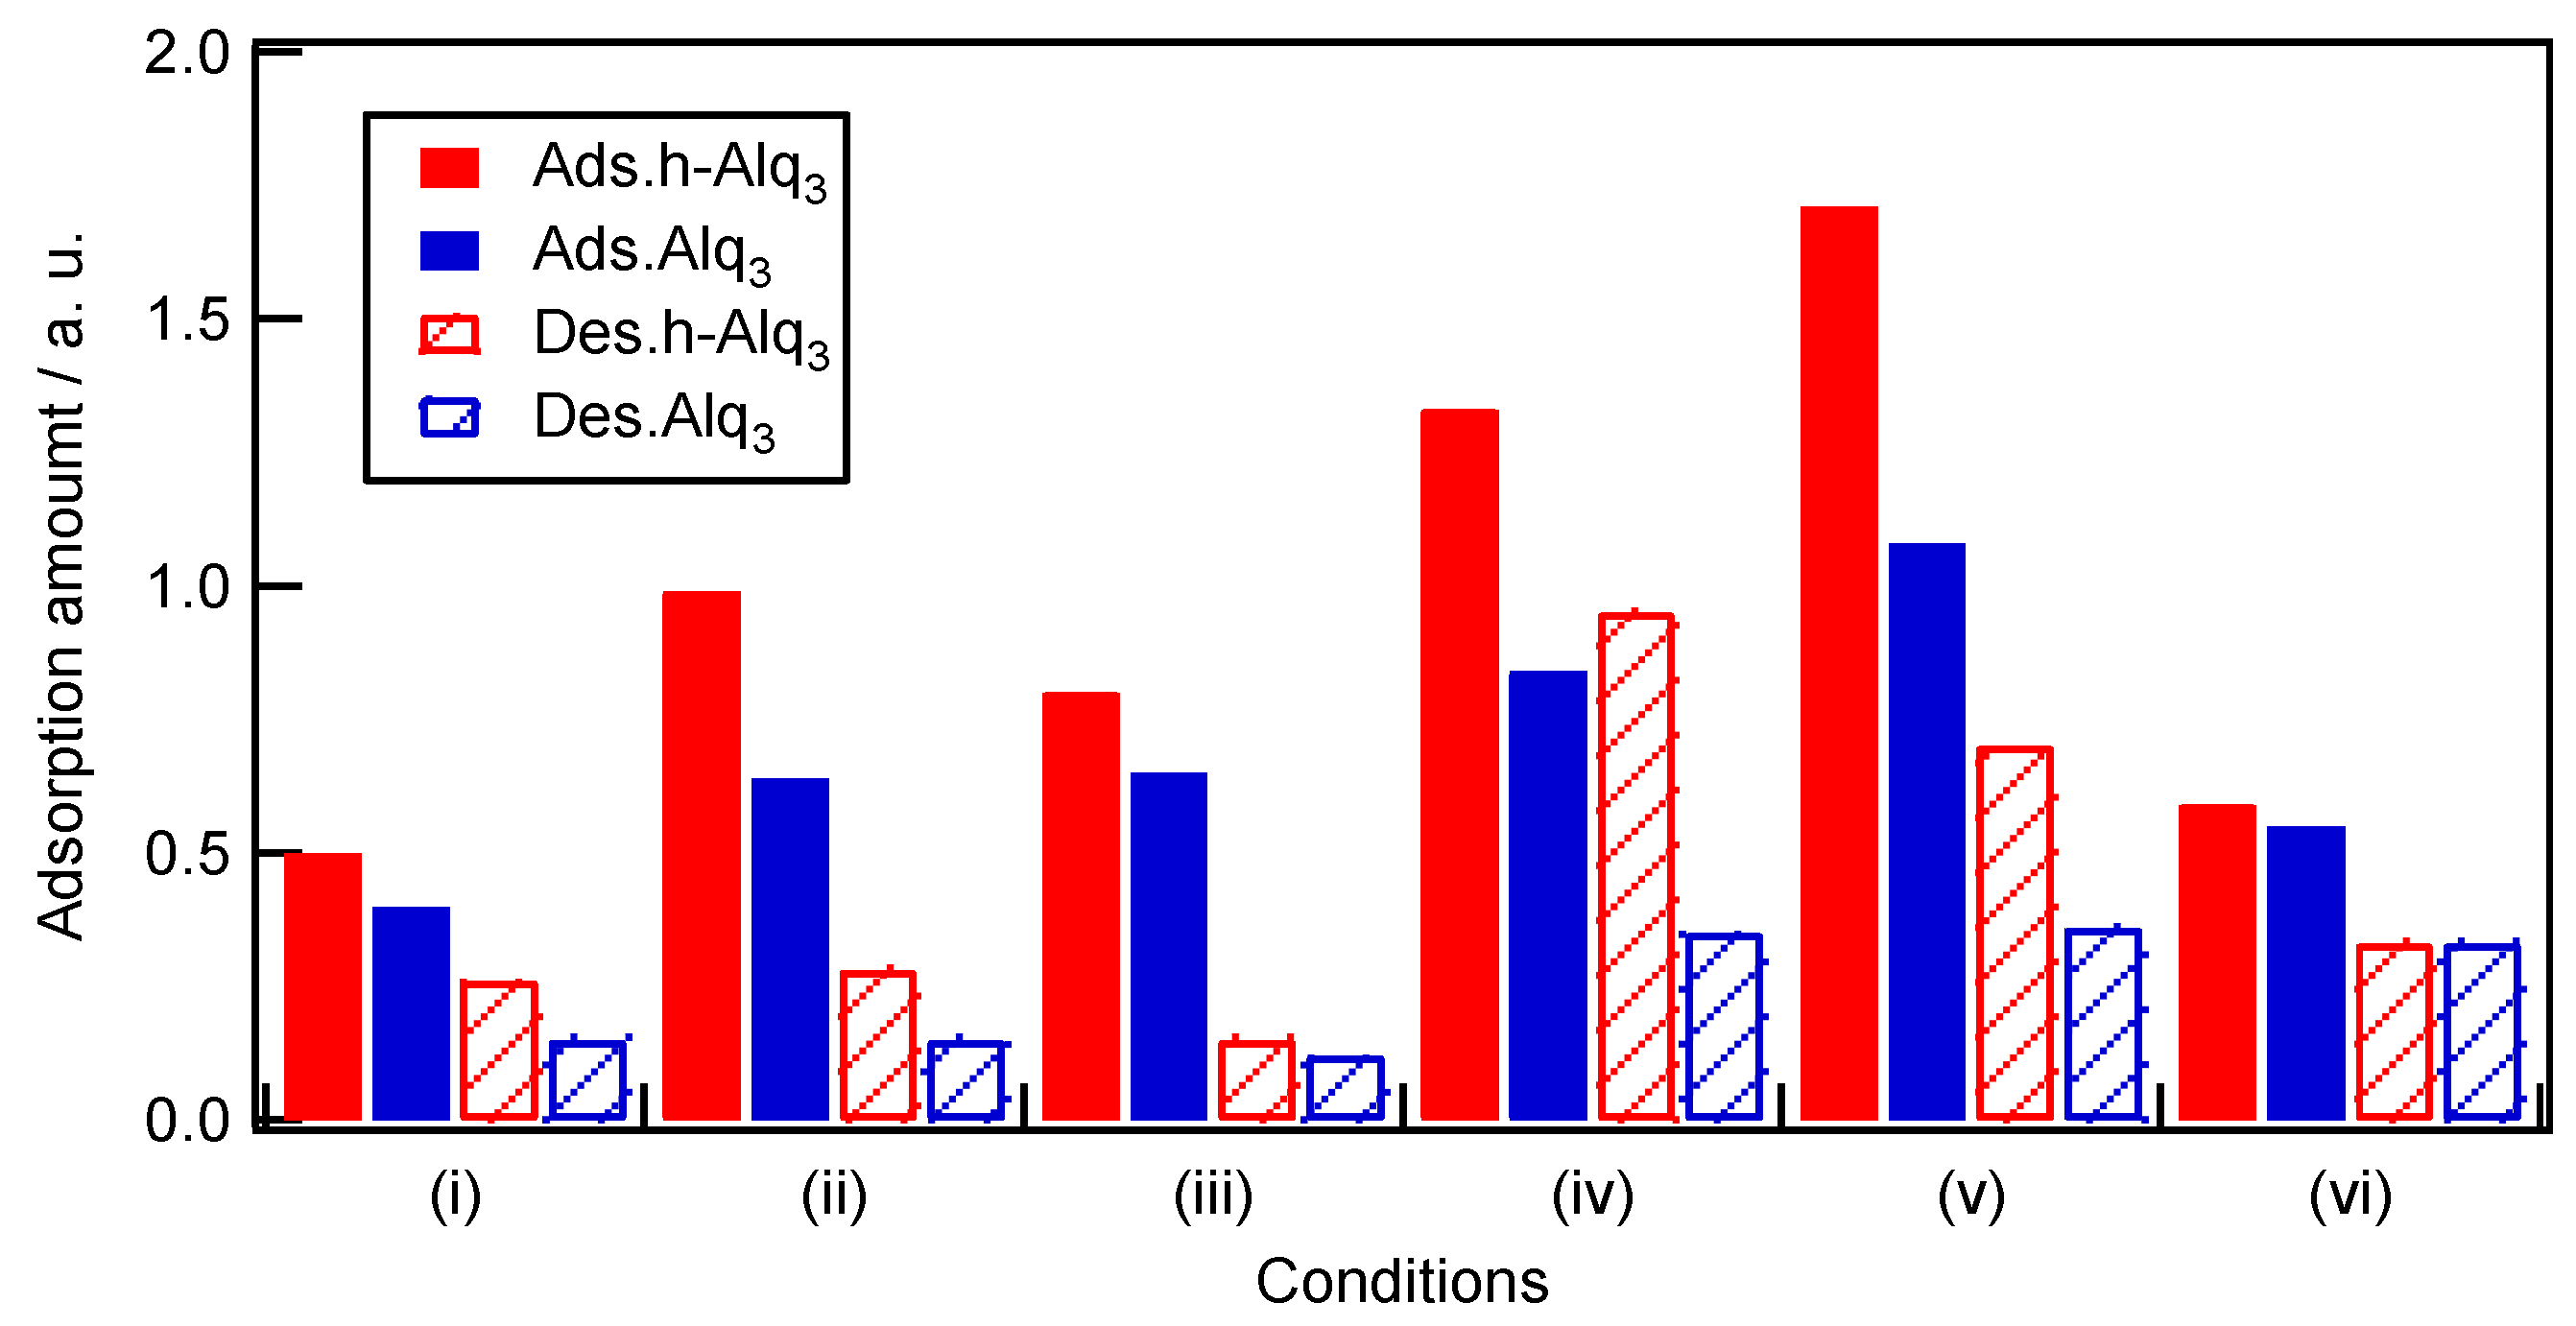
2.4. Adsorption and Desorption Characteristics of Alq3 and h-Alq3 Species on Various APA Surfaces
3. Discussion
3.1. Adsorption and Desorption of Alq3 and h-Alq3 Species
3.2. Alq3 and h-Alq3 Adsorption Sites
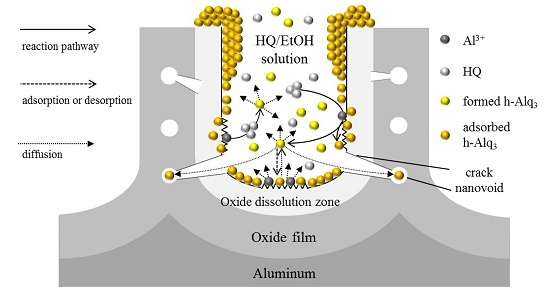
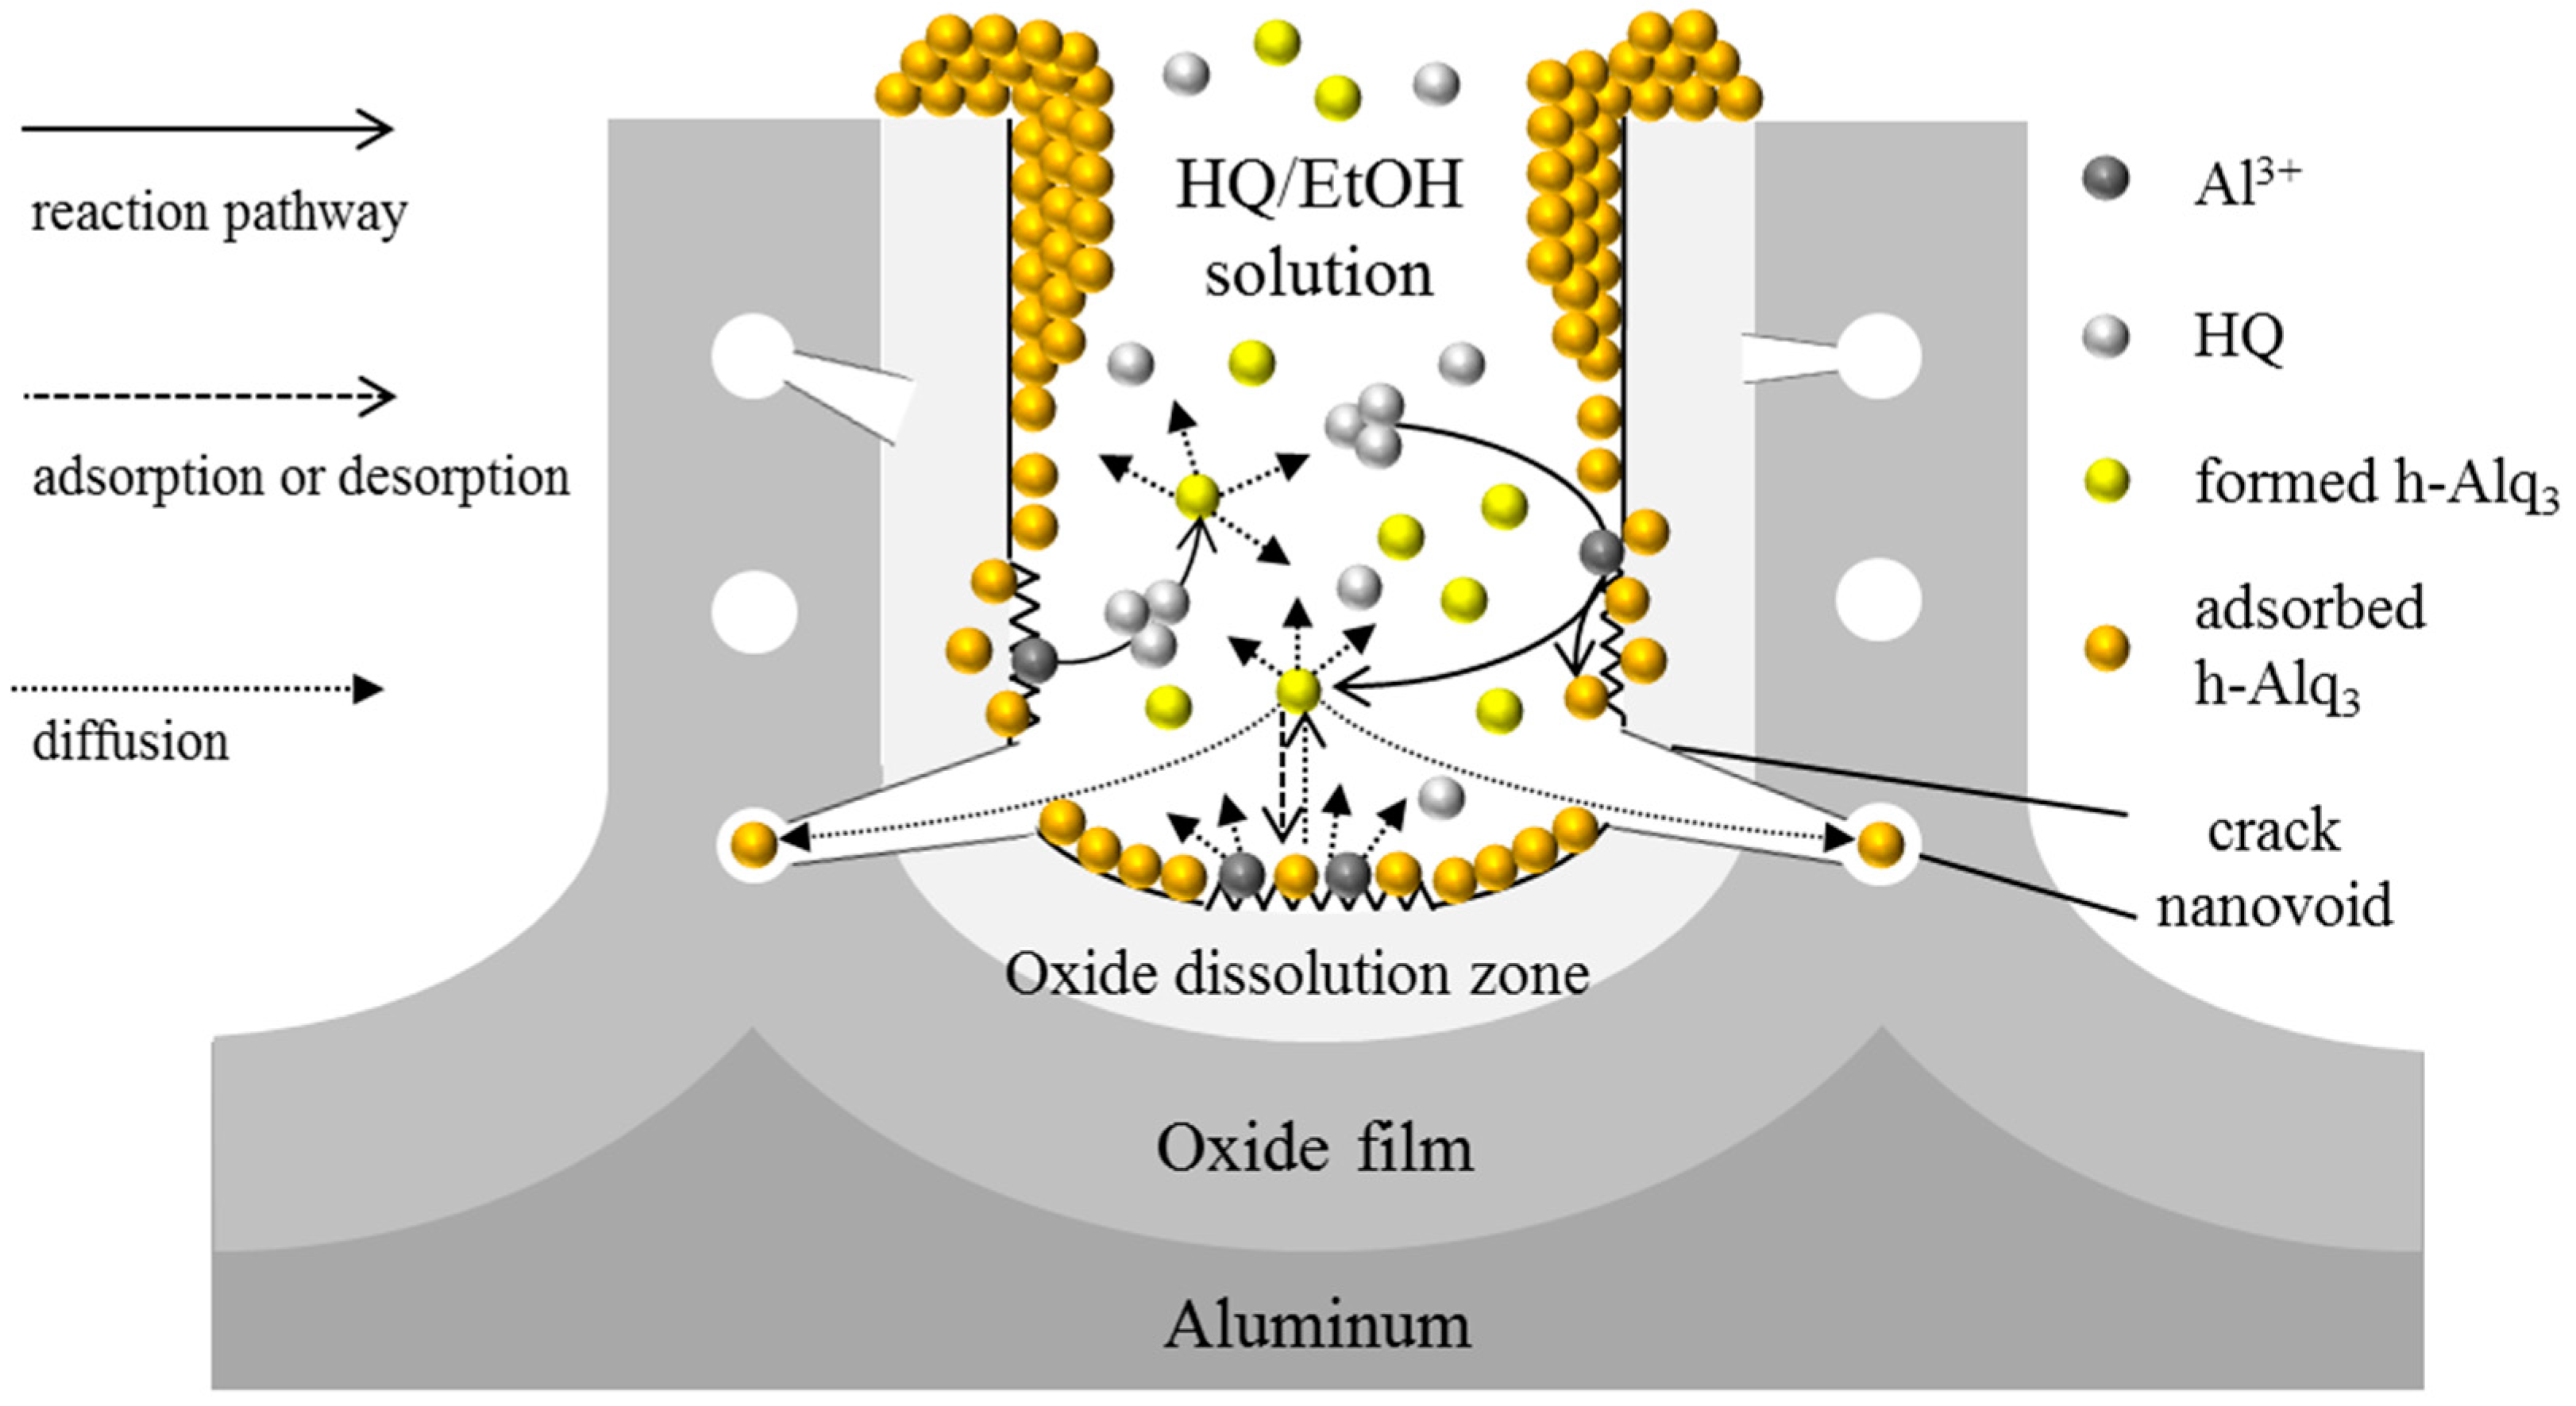
3.3. Reaction and Entrapment of HQ Species with APA Surface
4. Materials and Methods
4.1. APA Preparation
4.2. Treatment of APA Samples with Alq3- and HQ-Containing EtOH Solutions
4.3. APA Surface Characterization
5. Conclusions
Acknowledgments
Author Contributions
Conflicts of Interest
Abbreviations
| APA | Anodic porous alumina |
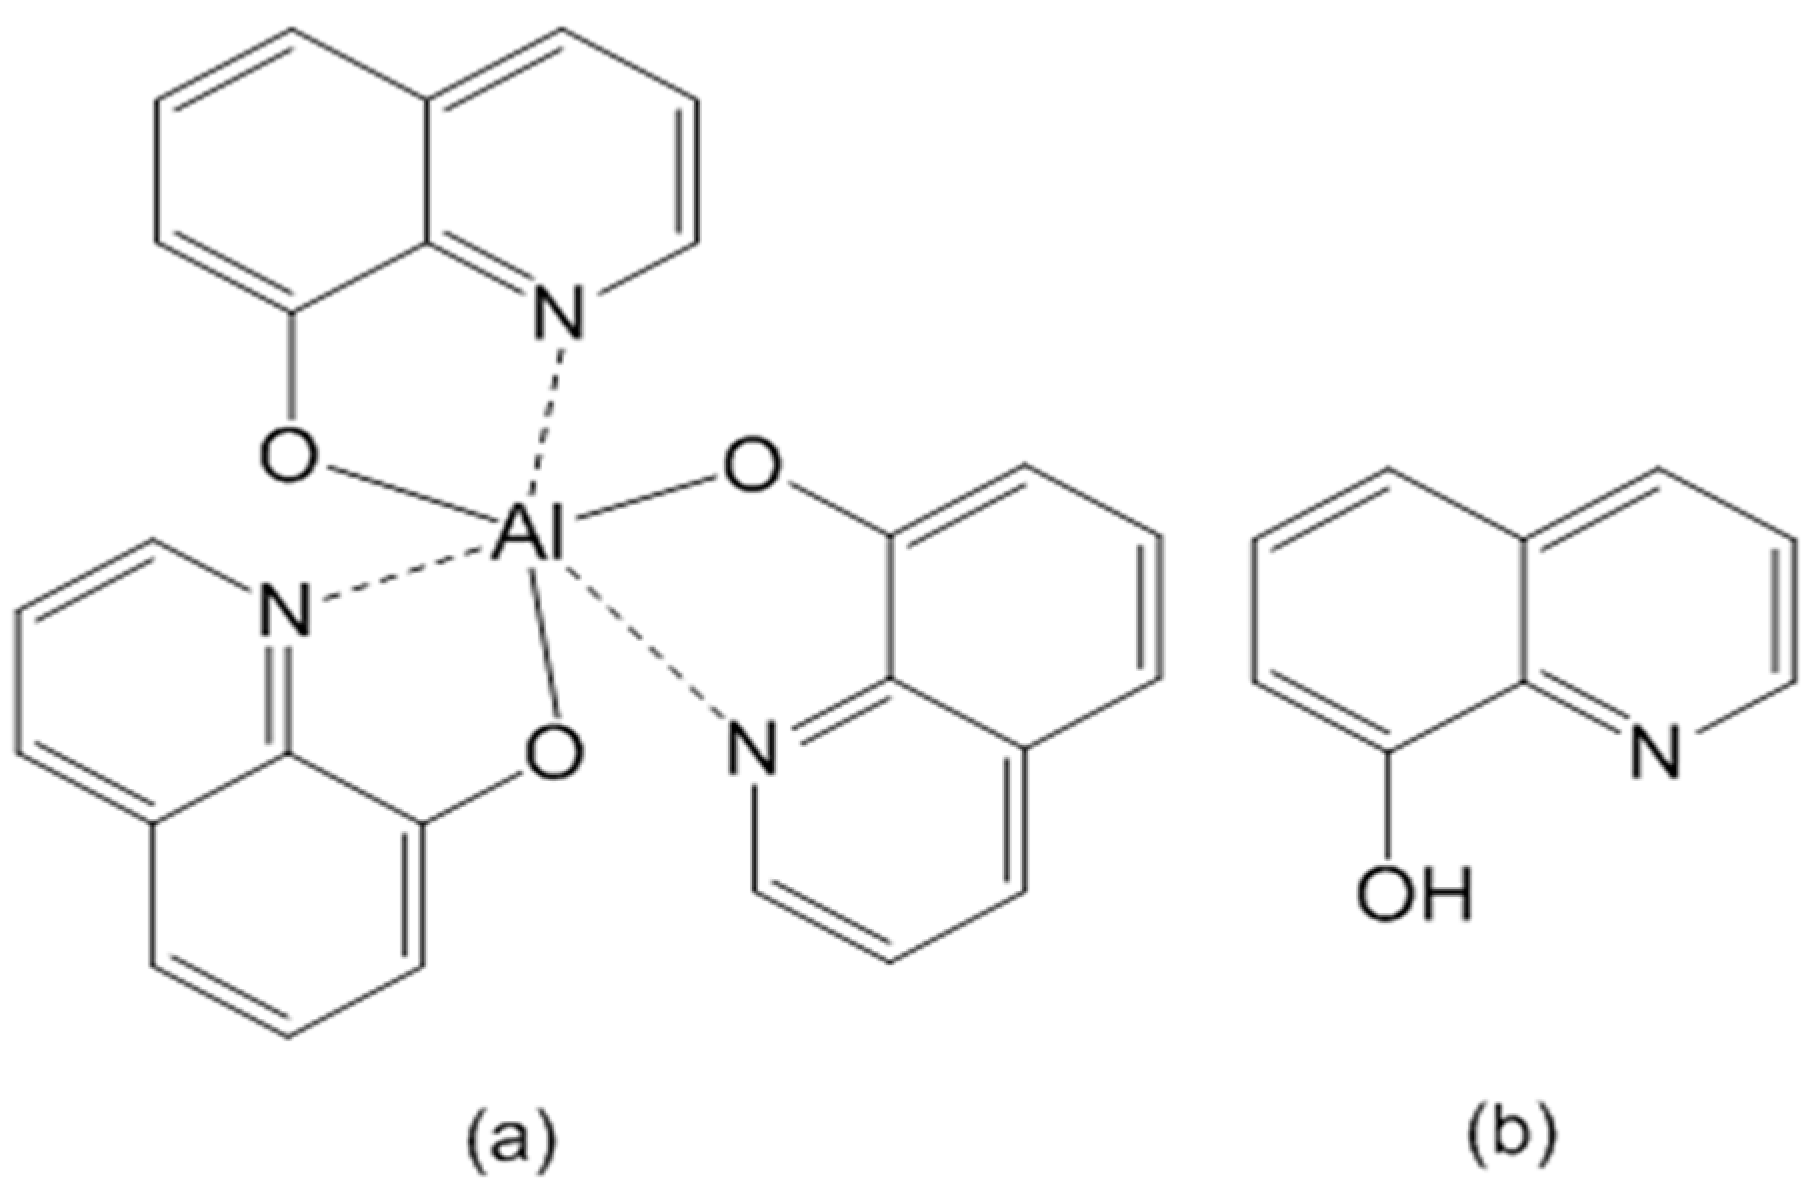
| Alq3 | Tris(8-hydqoxyquinolin)aluminum |
| HQ | 8-Hydroxyquinoline |
| Alq3/EtOH | An ethanol solution containing Alq3 |
| HQ/EtOH | An ethanol solution containing HQ |
| Alq3/APA | APA immersed in an Alq3/EtOH solution |
| HQ/APA | APA immersed in a HQ/EtOH solution |
| h-Alq3 | Alq3 formed from HQ/APA |
References
- Sulka, G.D. Nanostructured Materials in Electrochemistry; Eftekhari, A., Ed.; WILEY-VCH: Weinheim, Germany, 2008; pp. 1–116. [Google Scholar]
- Diggle, J.W.; Downie, T.C.; Goulding, C.W. Anodic oxide films on aluminum. Chem. Rev. 1966, 69, 365–405. [Google Scholar] [CrossRef]
- Lee, W.; Park, S.-J. Porous Anodic Aluminum Oxide: Anodization and Templated Synthesis of Functional Nanostructures. Chem. Rev. 2014, 114, 7487–7556. [Google Scholar] [CrossRef] [PubMed]
- Masuda, H.; Fukuda, K. Ordered Metal Nanohole Arrays Made by a Two-Step Replication of Honeycomb Structures of Anodic Alumina. Science 1995, 268, 1466–1468. [Google Scholar] [CrossRef] [PubMed]
- Oliveria, C.P.; Freitas, R.G.; Mattoso, L.H.C.; Pereira, E.C. Nanostructured Materials in Electrochemistry; Eftekhari, A., Ed.; WILEY-VCH: Weinheim, Germany, 2008; pp. 117–186. [Google Scholar]
- Santos, A.; Kumeria, T.; Losic, D. Nanoporous Anodic Alumina: A Versatile Platform for Optical Biosensors. Materials 2014, 7, 343–351. [Google Scholar] [CrossRef]
- Kukhta, A.V.; Gorokh, G.G.; Kolesnik, E.E.; Mitkovets, A.I.; Taoubi, M.I.; Koshin, Y.A.; Mozalev, A.M. Nanostructured alumina as a cathode of organic light-emitting device. Surf. Sci. 2002, 507, 593–597. [Google Scholar] [CrossRef]
- Miura, I.; Okada, Y.; Kudoh, S.; Nakata, M. Organic electroluminescence in porous alumina. Jpn. J. Appl. Phys. 2004, 43, 7552–7553. [Google Scholar] [CrossRef]
- Huang, G.S.; Wu, X.L.; Xie, Y.; Kong, F.; Zhang, Z.Y.; Sie, G.G.; Chu, O.K. Photoluminescence from 8-hydroxyquinoline aluminum embedded in porous anodic alumina membrane. Appl. Phys. Lett. 2005, 87. [Google Scholar] [CrossRef]
- Wang, Z.; Chen, Z.; Lan, Z.; Zhai, X.; Du, W.; Gong, Q. Enhancement of Alq3 fluorescence by nanotextured silver films deposited on porous alumina substrates. Appl. Phys. Lett. 2007, 90. [Google Scholar] [CrossRef]
- Nuntawong, N.; Horprathum, M.; Eiamchai, P.; Wong-ek, K.; Patthansasettakul, V.; Chindaudom, P. Surface-enhanced Raman scattering substrate of silver nanoparticles depositing on AAO template fabricated by magnetron sputtering. Vacuum 2010, 84, 1415–1418. [Google Scholar] [CrossRef]
- Das, G.; Patra, N.; Gopalakrishnan, A.; Proietti Zaccaria, R.; Toma, A.; Thorat, S.; Fabrizio, E.D.; Diaspro, A.; Salerno, M. Fabrication of large-area ordered and reproducible nanostructures for SERS biosensor application. Analyst 2012, 137, 1785–1792. [Google Scholar] [CrossRef] [PubMed]
- Tang, C.W.; Vansyke, S.A. Organic electroluminescent diodes. Appl. Phys. Lett. 1987, 51, 913–915. [Google Scholar] [CrossRef]
- Xu, C.; Xue, Q.; Ba, L.; Zhao, B.; Gu, N.; Cui, Y. Spectral behavior of 8-hydroxyquinoline aluminum in nanometer-sized holes of porous alumina. Chin. Sci. Bull. 2001, 46, 1839–1841. [Google Scholar] [CrossRef]
- Xu, C.; Xue, Q.; Zhong, Y.; Cui, Y.; Ba, L.; Zhao, B.; Gu, N. Photoluminescent blue-shift of organic molecules in nanometre pores. Nanotechnology 2002, 13, 47–50. [Google Scholar] [CrossRef]
- Mohammadpour, A.; Utkin, I.; Bodepudi, S.C.; Kar, P.; Fedosejevs, R.; Pramanik, S.; Shankar, K. Photophysics and Energy Transfer Studies of Alq3 Confined in the Voids of Nanoporous Anodic Alumina. J. Nanosci. Nanotechnol. 2013, 13, 2647–2655. [Google Scholar] [CrossRef] [PubMed]
- Ono, S.; Ichinose, H.; Masuko, N. Defects in Porous Anodic Films Formed on High Purity Aluminum. J. Electrochem. Soc. 1991, 138, 3705–3710. [Google Scholar] [CrossRef]
- Macdonald, D.D. On the Formation of Voids in Anodic Oxide Films on Aluminum. J. Electrochem. Soc. 1993, 140, L27–L30. [Google Scholar] [CrossRef]
- Du, Y.; Cai, W.L.; Mo, C.M.; Chen, J.; Zhang, L.D.; Zhu, X.G. Preparation and photoluminescence of alumina membranes with ordered pore arrays. Appl. Phys. Lett. 1999, 74, 2951–2953. [Google Scholar] [CrossRef]
- Huang, G.S.; Wu, X.L.; Mei, Y.F.; Shao, X.F.; Siu, G.G. Strong blue emission from anodic alumina membranes with ordered nanopore array. J. Appl. Phys. 2003, 93, 582–585. [Google Scholar] [CrossRef]
- Santos, A.; Alba, M.; Rahman, M.M.; Formentín, P.; Ferré-Borrull, J.; Pallarés, J.; Marsal, L.F. Structural tuning of photoluminescence in nanoporous anodic alumina by hard anodization in oxalic and malonic acids. Nanoscale Res. Lett. 2012, 7. [Google Scholar] [CrossRef] [PubMed]
- Yamaguchi, S.; Hidaka, Y.; Matsui, K. Dyeing of Anodic Porous Alumina Using a Micellar Solution of Sodium Dodecyl Sulfate. Trans. Mater. Res. Soc. Jpn. 2015, 40, 207–209. [Google Scholar] [CrossRef]
- Yamaguchi, S.; Matsui, K. Synthesis of Alq3 by the Reaction of 8-Quinolinol with Anodic Porous Alumina. In Proceedings of the 7th International Symposium on Surface Science, Matsue, Japan, 2–6 November 2014; p. 27.
- Yamaguchi, S.; Matsui, K. Absorption and Fluorescence Properties of 8-Hydroxyquinoline in Anodic Porous Alumina with Ordered Holes. In Proceedings of the IEEE International Conference on Applied System Innovation, Okinawa, Japan, 28 May–1 June 2016.
- Sulka, G.D.; Stępniowsli, W.J. Structural features of self-organized nanopore arrays formed by anodization of aluminum in oxalic acid at relatively high temperatures. Electrochem. Acta 2009, 54, 3683–3691. [Google Scholar] [CrossRef]
- Hoshi, T.; Kumagai, K.; Inoue, K.; Enomoto, S.; Nobe, Y.; Kobayashi, M. Electronic absorption and emission spectra of Alq3 in solution with special attention to a delayed fluorescence. J. Lumin. 2008, 128, 1353–1358. [Google Scholar] [CrossRef]
- Braun, M.; Gmeiner, J.; Tzolov, M.; Coelle, M.; Meyer, F.D.; Milius, W.; Hillebrecht, H.; Wendland, O.; von Schütz, J.U.; Brütting, W. A new crystalline phase of the electroluminescent material tris(8-hydroxyquinoline)aluminum exhibiting blueshifted fluorescence. J. Chem. Phys. 2001, 114, 9625–9632. [Google Scholar] [CrossRef]
- Antropova, T.V.; Baran, J.; Gavrilko, T.; Gnatyuk, I.; Morawska-Kowal, T.; Melnik, V.; Puchkovska, G.; Vorobjev, V. Interface interactions and optical properties of novel photonic nanocomposites consisting of porous glasses doped with organic luminophore molecules. Opt. Appl. 2005, 35, 725–733. [Google Scholar]
- Baldacchini, G.; Chiacchiaretta, P.; Reisfeld, R.; Zignsky, E. The origin of luminescence blueshifts in Alq3 composites. J. Lumin. 2009, 129, 1849–1852. [Google Scholar] [CrossRef]
- Tagaya, M.; Ogawa, M. Luminescence of Tris(8-quinolinato)aluminum(III) (Alq3) Adsorbed into Mesoporous Silica. Chem. Lett. 2006, 35, 108–109. [Google Scholar] [CrossRef]
- Tagaya, M.; Ogawa, M. Possible pore size effects on the state of tris(8-quinolinato)aluminum(III) (Alq3) adsorbed into mesoporous silicas and their temperature dependence. Phys. Chem. Chem. Phys. 2008, 10, 6849–6855. [Google Scholar] [CrossRef] [PubMed]


| Anodization Method | # | Number of Steps | H2SO4 (M) | Potential (V) | Current Density (A/dm2) | Time (min) | Pre-Treatment |
|---|---|---|---|---|---|---|---|
| Potentio-static | i | 1 | 0.3 | 20 | ca. 1.5 | 60 | EP |
| ii | 2 | 0.3 | 20 | ca. 1.5 | 60 | EP | |
| iii | 2 | 0.3 | 10 | ca. 0.4 | 120 | EP | |
| Galvano-static | iv | 1 | 1.5 | ca. 15 | 3 | 30 | EP |
| v | 1 | 1.5 | ca. 14 | 3 | 30 | AD | |
| vi | 1 | 0.3 | ca. 25 | 3 | 30 | AD |
| # | Dp (nm) | Dc (nm) | t (μm) | n (1010 cm−2) | Sp (1016 nm2·cm−2) |
|---|---|---|---|---|---|
| i | 47 | 65 | 12 | 1.37 | 2.44 |
| ii | 33 | 52 | 14 | 2.14 | 3.11 |
| iii | 18 | 35 | 10 | 4.71 | 2.66 |
| iv | 41 | 75 | 16 | 1.03 | 2.12 |
| v | 20 * | 35 * | 15 | 4.71 * | 4.44 * |
| vi | 44 * | 74 * | 12 | 1.05 * | 1.74 * |
| APA | K–M Absorbance at 355 nm | |||
|---|---|---|---|---|
| h-Alq3 Ads.30:Des.30 | h-Alq3 ∆ (Dr%) | Alq3 Ads.30:Des.30 | Alq3 ∆ (Dr%) | |
| (i) | 0.50:0.26 | 0.24 (48) | 0.40:0.15 | 0.25 (63) |
| (ii) | 0.99:0.28 | 0.71 (72) | 0.64:0.15 | 0.49 (77) |
| (iii) | 0.80:0.15 | 0.65 (81) | 0.65:0.12 | 0.53 (82) |
| (iv) | 1.33:0.95 | 0.38 (29) | 0.84:0.35 | 0.49 (58) |
| (v) | 1.71:0.70 | 1.01 (59) | 1.08:0.36 | 0.72 (67) |
| (vi) | 0.59:0.33 | 0.26 (44) | 0.55:0.33 | 0.23 (40) |
| APA | K–M Absorbance Ratio at 355 nm | |
|---|---|---|
| Ads.30 Ratio of h-Alq3 to Alq3 | Des.30 Ratio of h-Alq3 to Alq3 | |
| (i) | 1.3 | 1.7 |
| (ii) | 1.5 | 1.9 |
| (iii) | 1.2 | 1.3 |
| (iv) | 1.6 | 2.7 |
| (v) | 1.6 | 1.9 |
| (vi) | 1.1 | 1.0 |
© 2016 by the authors; licensee MDPI, Basel, Switzerland. This article is an open access article distributed under the terms and conditions of the Creative Commons Attribution (CC-BY) license (http://creativecommons.org/licenses/by/4.0/).
Share and Cite
Yamaguchi, S.; Matsui, K. Formation and Entrapment of Tris(8-hydroxyquinoline)aluminum from 8-Hydroxyquinoline in Anodic Porous Alumina. Materials 2016, 9, 715. https://doi.org/10.3390/ma9090715
Yamaguchi S, Matsui K. Formation and Entrapment of Tris(8-hydroxyquinoline)aluminum from 8-Hydroxyquinoline in Anodic Porous Alumina. Materials. 2016; 9(9):715. https://doi.org/10.3390/ma9090715
Chicago/Turabian StyleYamaguchi, Shohei, and Kazunori Matsui. 2016. "Formation and Entrapment of Tris(8-hydroxyquinoline)aluminum from 8-Hydroxyquinoline in Anodic Porous Alumina" Materials 9, no. 9: 715. https://doi.org/10.3390/ma9090715