
Crystal Structures and Mechanical Properties of Ca2C at High Pressure


1
School of Physics and Optoelectronic Engineering, Xidian University, Xi’an 710071, China
2
School of Microelectronics, Xidian University, Xi’an 710071, China
3
College of Physics and Optoelectronic Technology, Baoji University of Arts and Sciences, Baoji 721016, China
*
Authors to whom correspondence should be addressed.
Materials 2016, 9(7), 570; https://doi.org/10.3390/ma9070570
Submission received: 17 May 2016
/
Revised: 17 June 2016
/
Accepted: 6 July 2016
/
Published: 14 July 2016
(This article belongs to the Special Issue Computational Multiscale Modeling and Simulation in Materials Science)
Abstract
:Recently, a new high-pressure semiconductor phase of Ca2C (space group Pnma) was successfully synthesized, it has a low-pressure metallic phase (space group C2/m). In this paper, a systematic investigation of the pressure-induced phase transition of Ca2C is studied on the basis of first-principles calculations. The calculated enthalpy reveals that the phase transition which transforms from C2/m-Ca2C to Pnma-Ca2C occurs at 7.8 GPa, and it is a first-order phase transition with a volume drop of 26.7%. The calculated elastic constants show that C2/m-Ca2C is mechanically unstable above 6.4 GPa, indicating that the structural phase transition is due to mechanical instability. Both of the two phases exhibit the elastic anisotropy. The semiconductivity of Pnma-Ca2C and the metallicity of C2/m-Ca2C have been demonstrated by the electronic band structure calculations. The quasi-direct band gap of Pnma-Ca2C at 0 GPa is 0.86 eV. Furthermore, the detailed analysis of the total and partial density of states is performed to show the specific contribution to the Fermi level.
1. Introduction
Hitherto, the pressure-composition (P-x) phases of binary systems have gained increasing interest and been extensively researched. Among these predicted compounds, some of them have been successfully synthesized [1,2], but the others still need further experiments to confirm their theoretical predictions [3,4]. For the Ca-C system, there are many works that have been done and obtained remarkable achievements [5,6,7,8,9,10,11,12,13,14,15,16]. Gauzzi et al. [5] found the superconductivity will be enhanced in the intercalated graphite CaC6 at high pressure. It performs the structural instability and leads to a structural transition with pressure. Nylen et al. [6] studied the structural behavior of CaC2 at high pressure via the first-principles calculations. Their results suggest an irreversible amorphization, corroborating the structural peculiarities of acetylide carbides, which persists at high pressure conditions. Li et al. analyzed the pressure-induced superconductivity of CaC2 [7]. They uncovered that it is calcium that contributes to the superconducting behavior, and it is capable of stabilizing carbon sp2 hybridization at a larger range of pressure. Nourbakhsh et al. [8] investigated the magnetism in CaC ionic compound and observed a perfect Fermi level spin polarization and a half-metallic behavior.
Recently, Li et al. [9] systematically explored all the stable calcium carbides at pressures from 0 to 100 GPa. This resulted in five newly predicted stable stoichiometries (Ca5C2, Ca2C, Ca3C2, CaC and Ca2C3). Using in situ synchrotron powder X-ray diffraction measurements, they successfully synthesized the Ca2C and Ca2C3. The Ca2C has two phases: the semiconducting phase Pnma-Ca2C at high pressure and the metallic metastable phase C2/m-Ca2C at low pressure. The Pnma-Ca2C exists in the pressure range of 7.5–100 GPa and possesses the isolated C anions. Carbon atoms polymerize to isolated dumbbells, occurring a unique metallic metastable C2/m-Ca2C which provides an example of 2D metal. The metal calcium atom of C2/m-Ca2C develops a negative Bader charge, confronting a more electronegative carbon atom. Due to these intriguing properties, in this paper, we will focus on the Ca2C, presenting its structural, elastic and electronic properties, and systematically investigating the pressure-induced phase transition mechanism. The enthalpy is calculated to reveal the phase transition pressure. In addition, the elastic constants, modulus and anisotropy are calculated to study the elastic properties. Meanwhile, the electronic band structures and the total and partial density of states are analyzed.
2. Results and Discussion
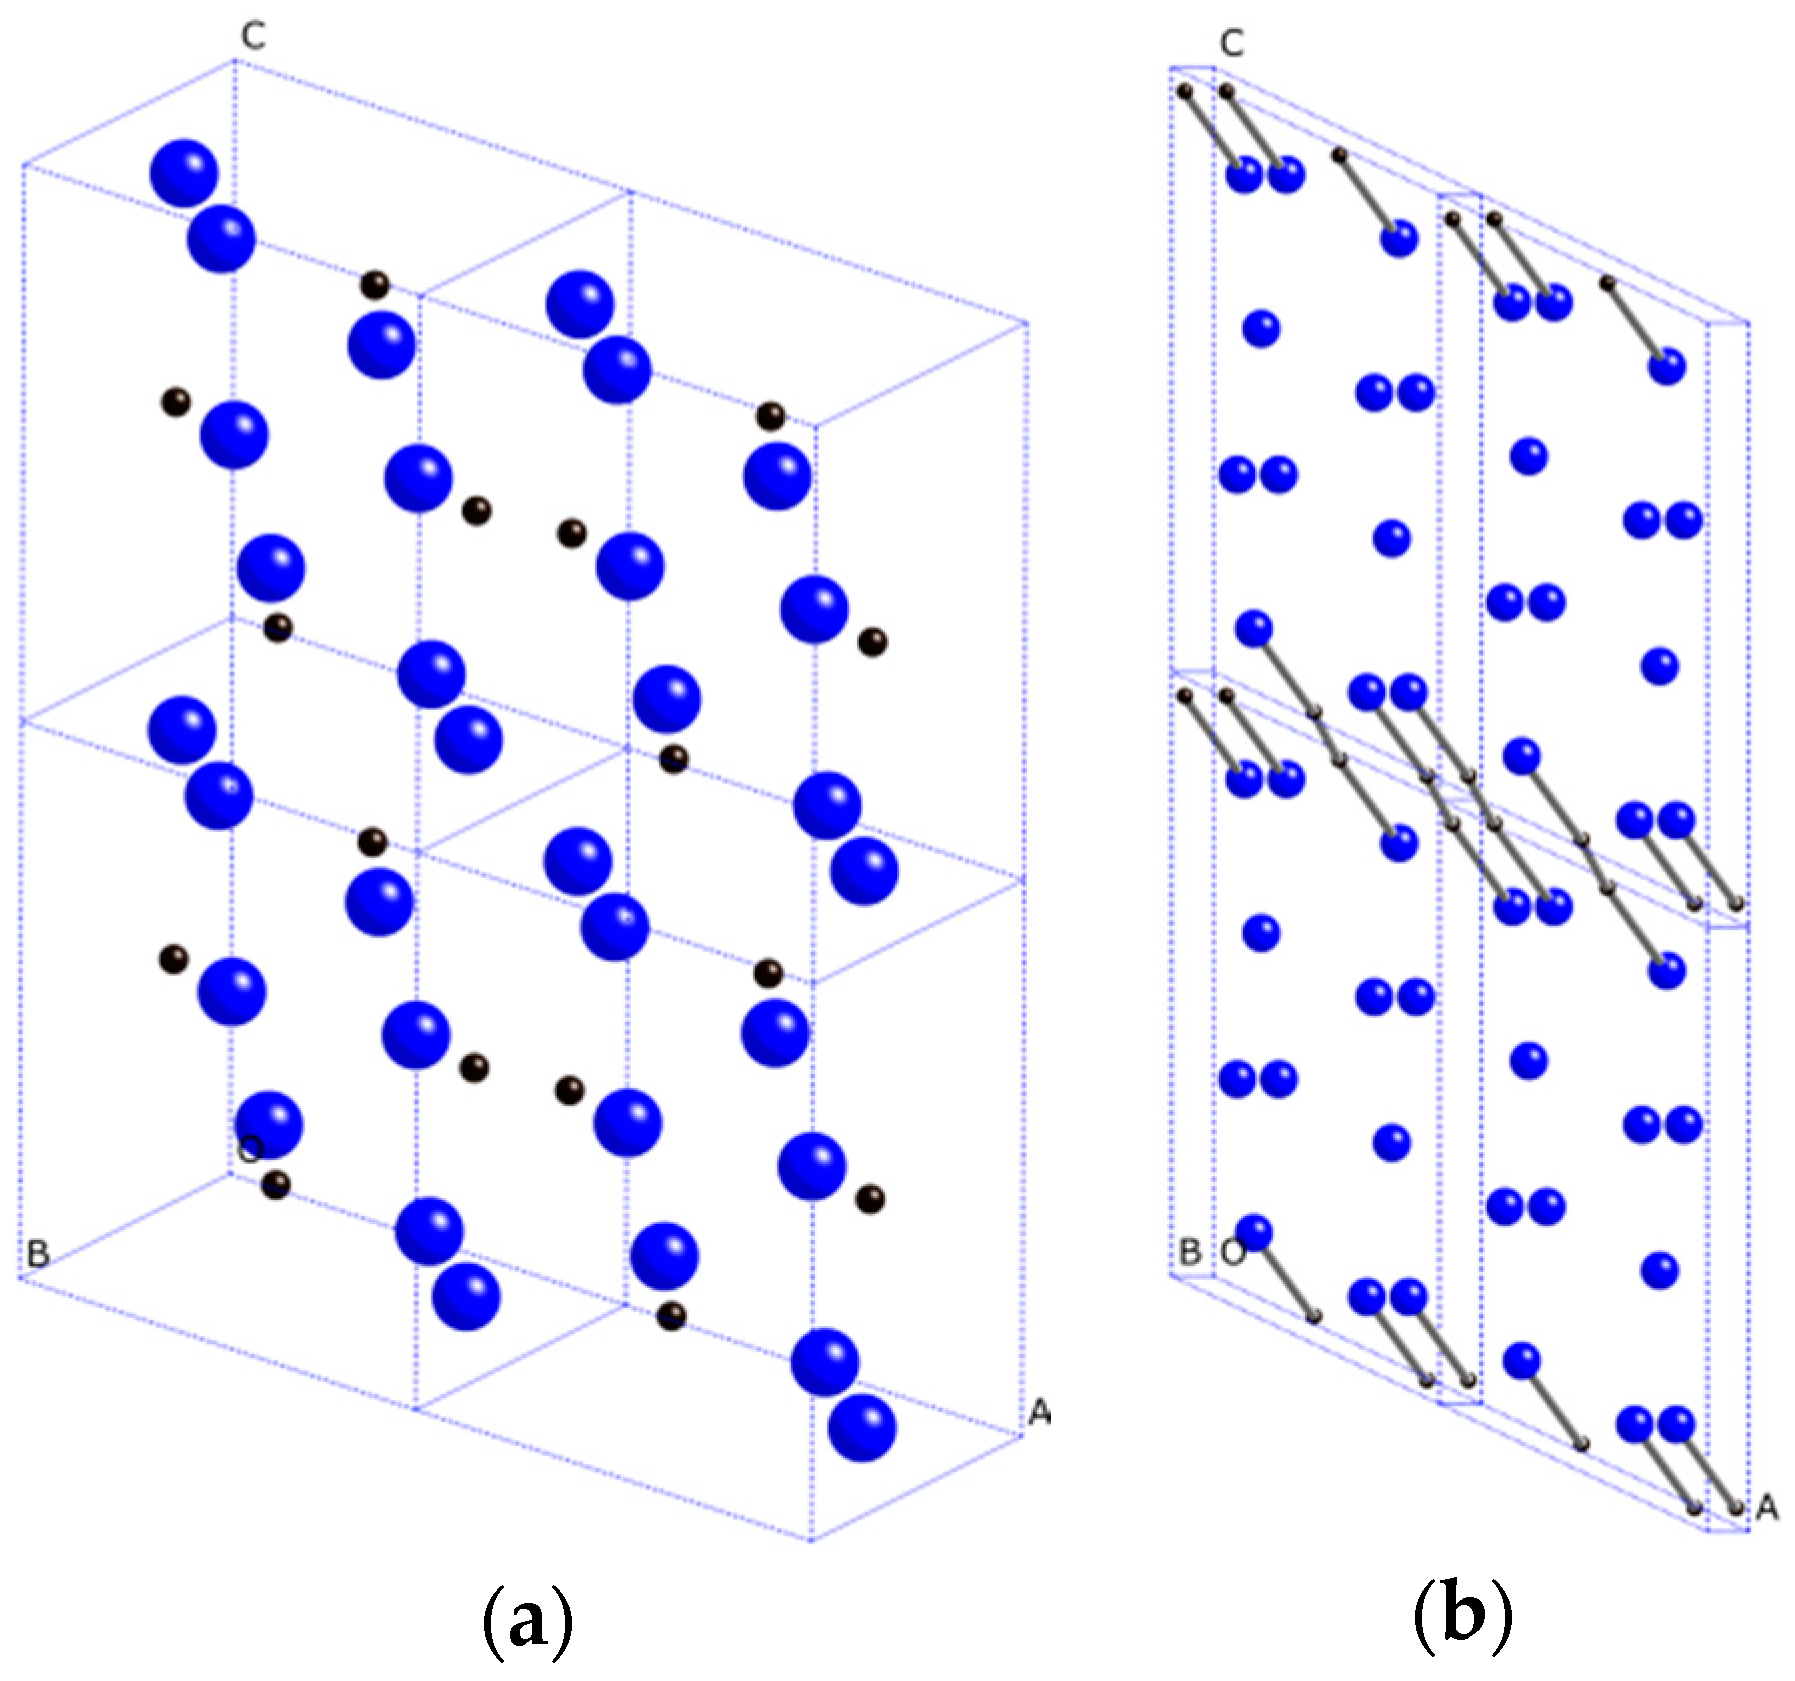
The 2 × 1 × 2 supercell structures of Ca2C are illustrated in Figure 1. The black and blue spheres represent C and Ca atoms, respectively. At zero pressure, the optimized lattice parameters of Pnma-Ca2C are a = 6.677 Å, b = 4.384 Å, c = 7.979 Å with two inequivalent Ca atoms occupying 4c (0.0119, 0.2500, 0.8302), 4c (0.1476, 0.2500, 0.4109) and C atoms occupying 4c (0.2521, 0.2500, 0.0918) Wyckoff positions. For C2/m-Ca2C, the optimized lattice parameters are a = 7.166 Å, b = 3.775 Å, c = 15.490 Å, and β = 122.9°. The Wyckoff positions of C2/m-Ca2C are Ca1: 4i (0.2715, 0.0000, −0.1120), Ca2: 4i (−0.2440, 0.0000, −0.3781) and C: 4i (−1.0479, 0.0000, −0.9705). For Pnma-Ca2C (see Figure 1a), carbon atoms are isolated anions, whereas the carbon dimers are observed in C2/m-Ca2C (Figure 1b). The interatomic distance of Ca-C for C2/m-Ca2C is 2.44 Å in length, and the C-C bond length is 1.29 Å.
To determine the phase transition pressure of Ca2C, the enthalpy differences between two structures are plotted as a function of pressure up to 100 GPa in Figure 2a. There is an intersection between the two enthalpy curves, indicating that the C2/m-Ca2C phase transforms to the Pnma-Ca2C phase at 7.8 GPa and the Pnma-Ca2C is more stable than the C2/m-Ca2C above this pressure point. The known transition pressure data is 7.5 GPa [9], and it is in a good agreement with our result. Meanwhile, the dependence of volume on pressure is presented in Figure 2b. The C2/m-Ca2C is larger than the Pnma-Ca2C in volume. The change of volume at 7.8 GPa shows that the phase transition is first-order with a volume drop of 26.7%. To interpret this large volume collapse, we estimated the ionic radii of the C and Ca within these two structures at 7.8 GPa through Bader charge analysis. The obtained results are listed in Table 1. The calculated charges of the two Ca2C phase show increasing trends from C2/m-Ca20.928C−0.928 to Pnma-Ca22.348C−2.348 at phase transition pressure point. Compared to C2/m-Ca2C phase (rCa = 1.871 Å, rC = 1.534 Å), the ionic radius of Ca in the Pnma-Ca2C phase is much shorter (1.485 Å), whereas the ionic radius of C (1.788 Å) in Pnma-Ca2C is relatively longer. Since the contribution from Ca atom is much more than that of C atom to the volume of Ca2C, the volume collapse from C2/m to Pnma phase is very large.
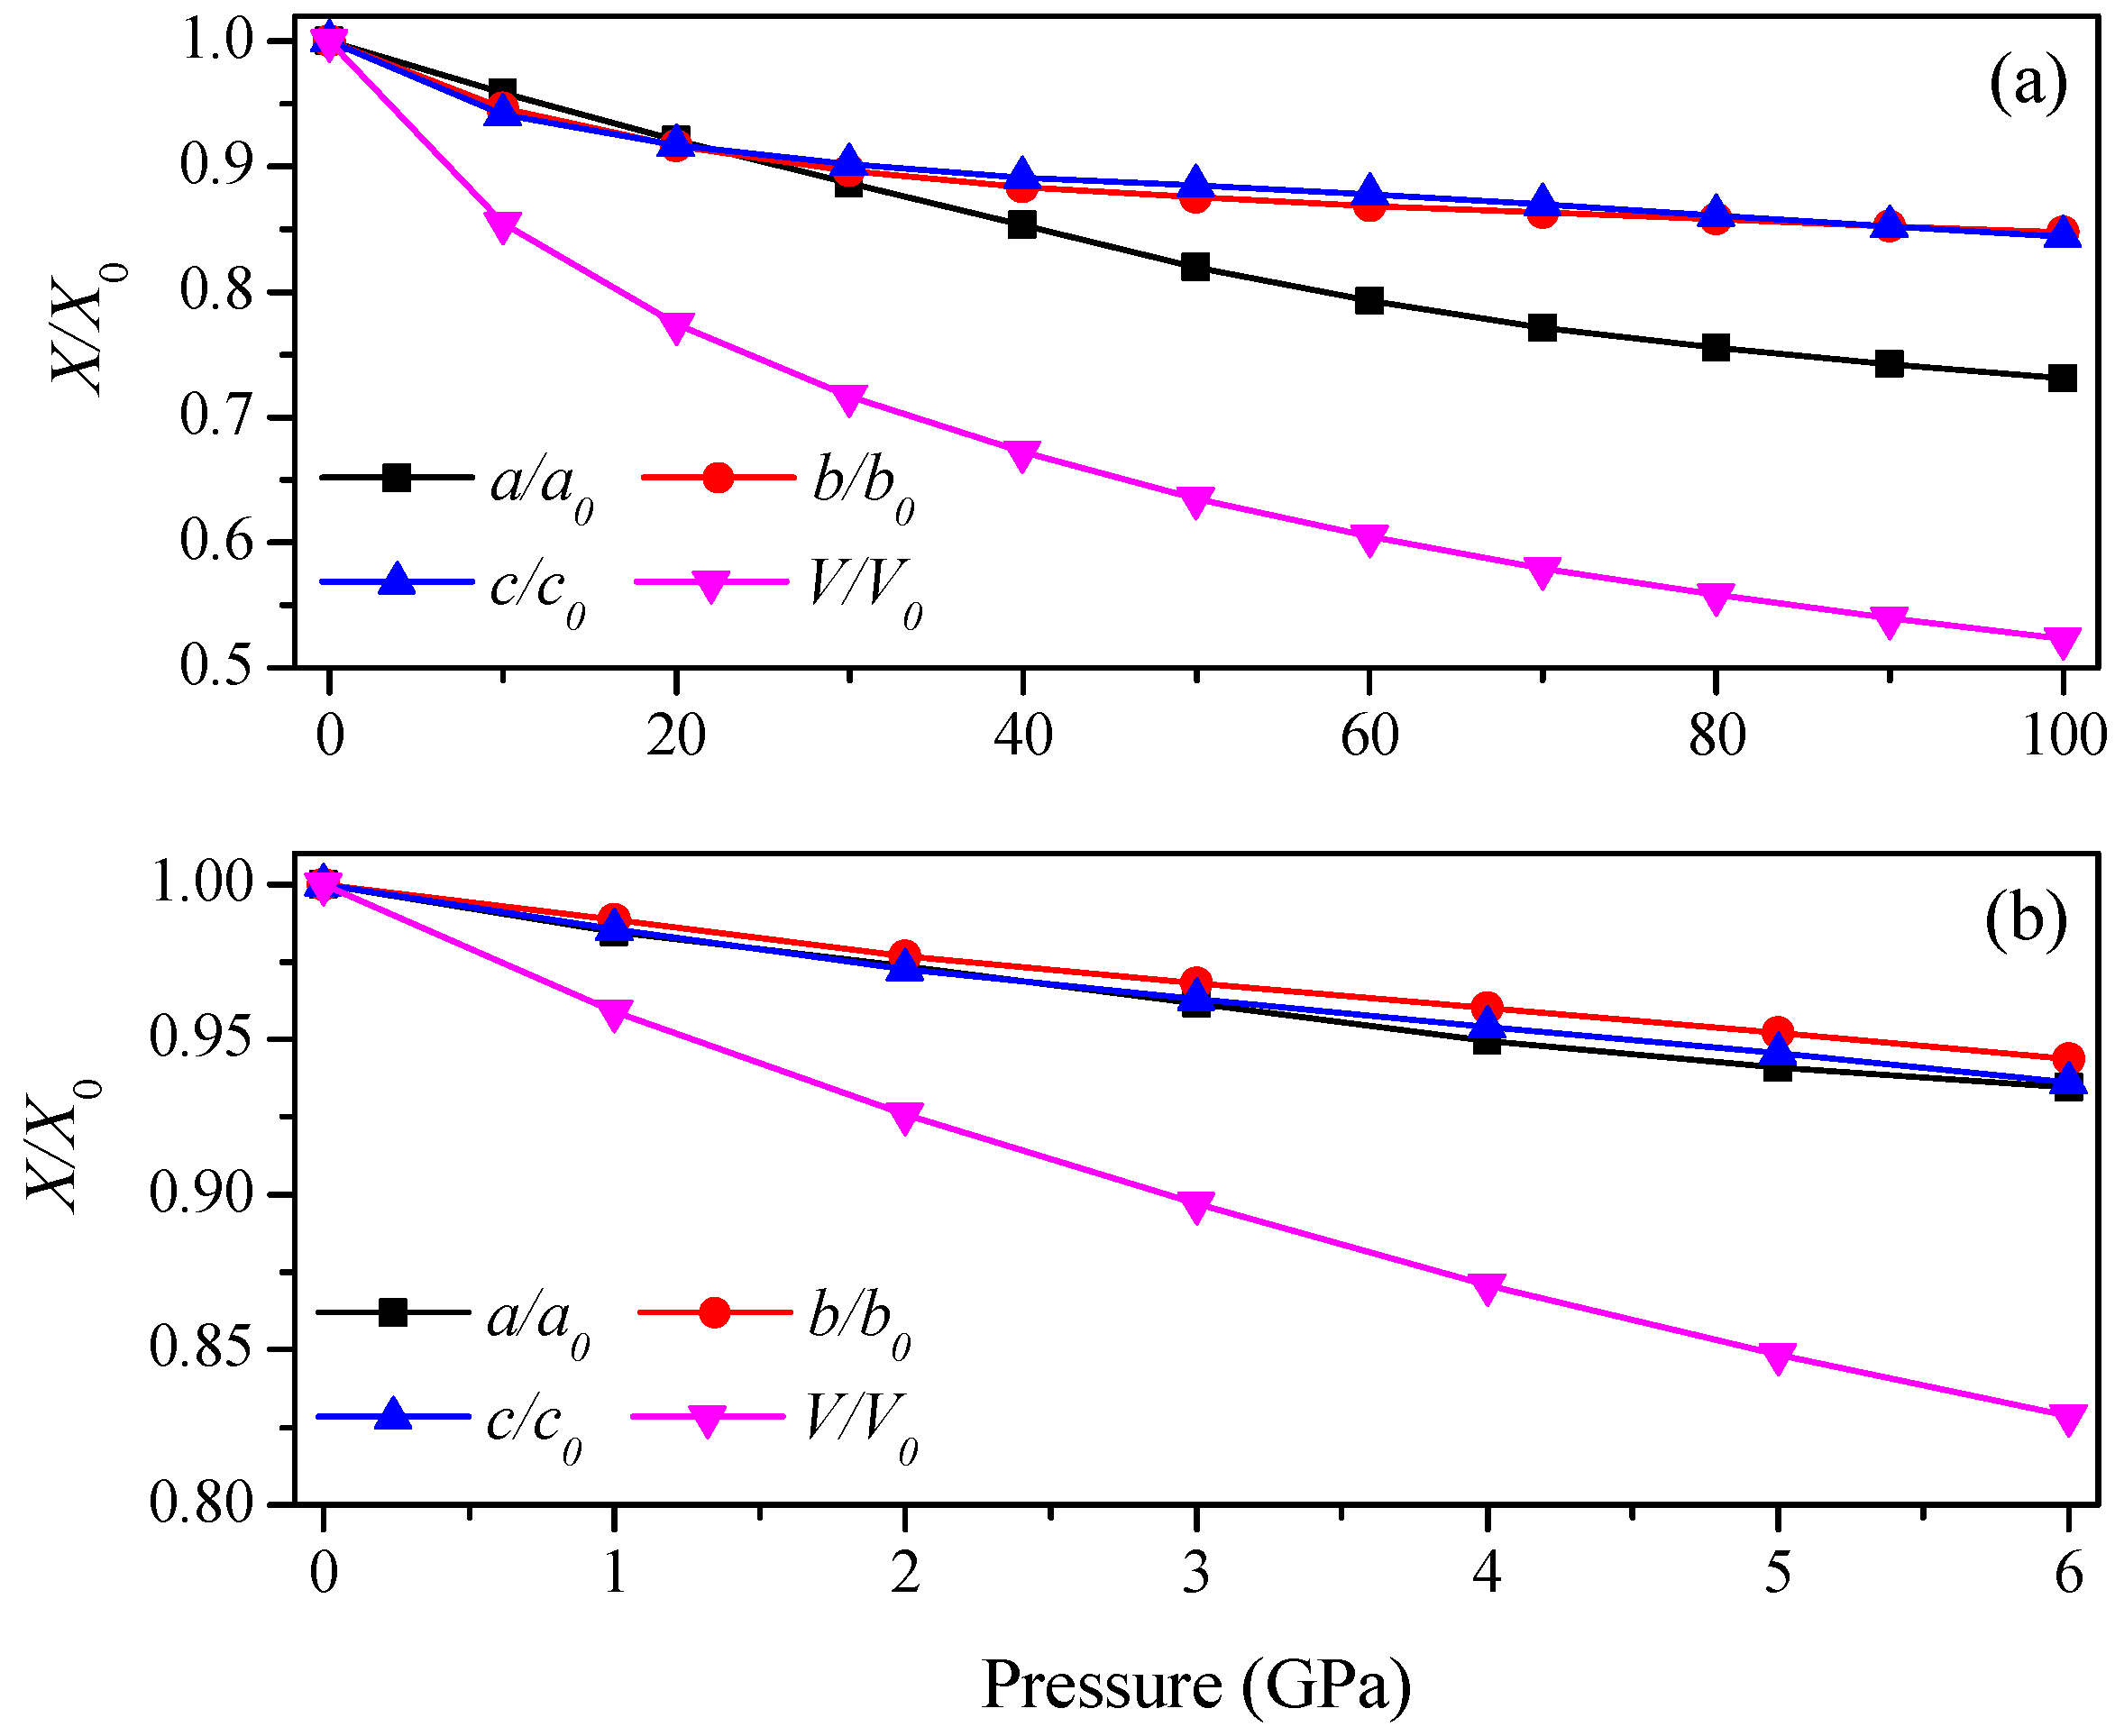
The lattice parameters of Ca2C at different pressures are listed in Table 2. In Table 2, an excellent agreement with the previous theoretical and experimental values is shown [9]. The calculated lattice parameters decrease with pressure. To get more details, the variations of lattice parameters X/X0 of the two Ca2C phases with pressure are shown in Figure 3. For Pnma-Ca2C (see Figure 3a), along the b- and c-axis, the degrees of anti-compression along these two directions are almost the same. At low pressure range (P < 23 GPa), the incompressibility along a-axis is larger than that along b- and c-axis, which is contrary to the case at high pressure range (P > 23 GPa). In Figure 3b, the changes of lattice parameters along the a-, b- and c-axis are similar for C2/m-Ca2C when below 6 GPa, suggesting the same incompressibility along these three directions.
The calculated elastic constants and moduli of Ca2C at 0 GPa and high pressures are shown in Table 3. The strain-stress method was used to calculate the single crystal elastic constants. A small finite strain was applied on the optimized structure and the atomic position was fully optimized. Then, the elastic constants were obtained from the stress of the strained structure. The generalized Born’s mechanical stability criteria of orthorhombic phase at 0 GPa are given by [17,18]:
The mechanical stability in crystals under isotropic pressure is provided by Ref. [19]. This requires the symmetric matrix
has a positive determinant. In Ĝ matrix,
where P is the isotropic pressure.
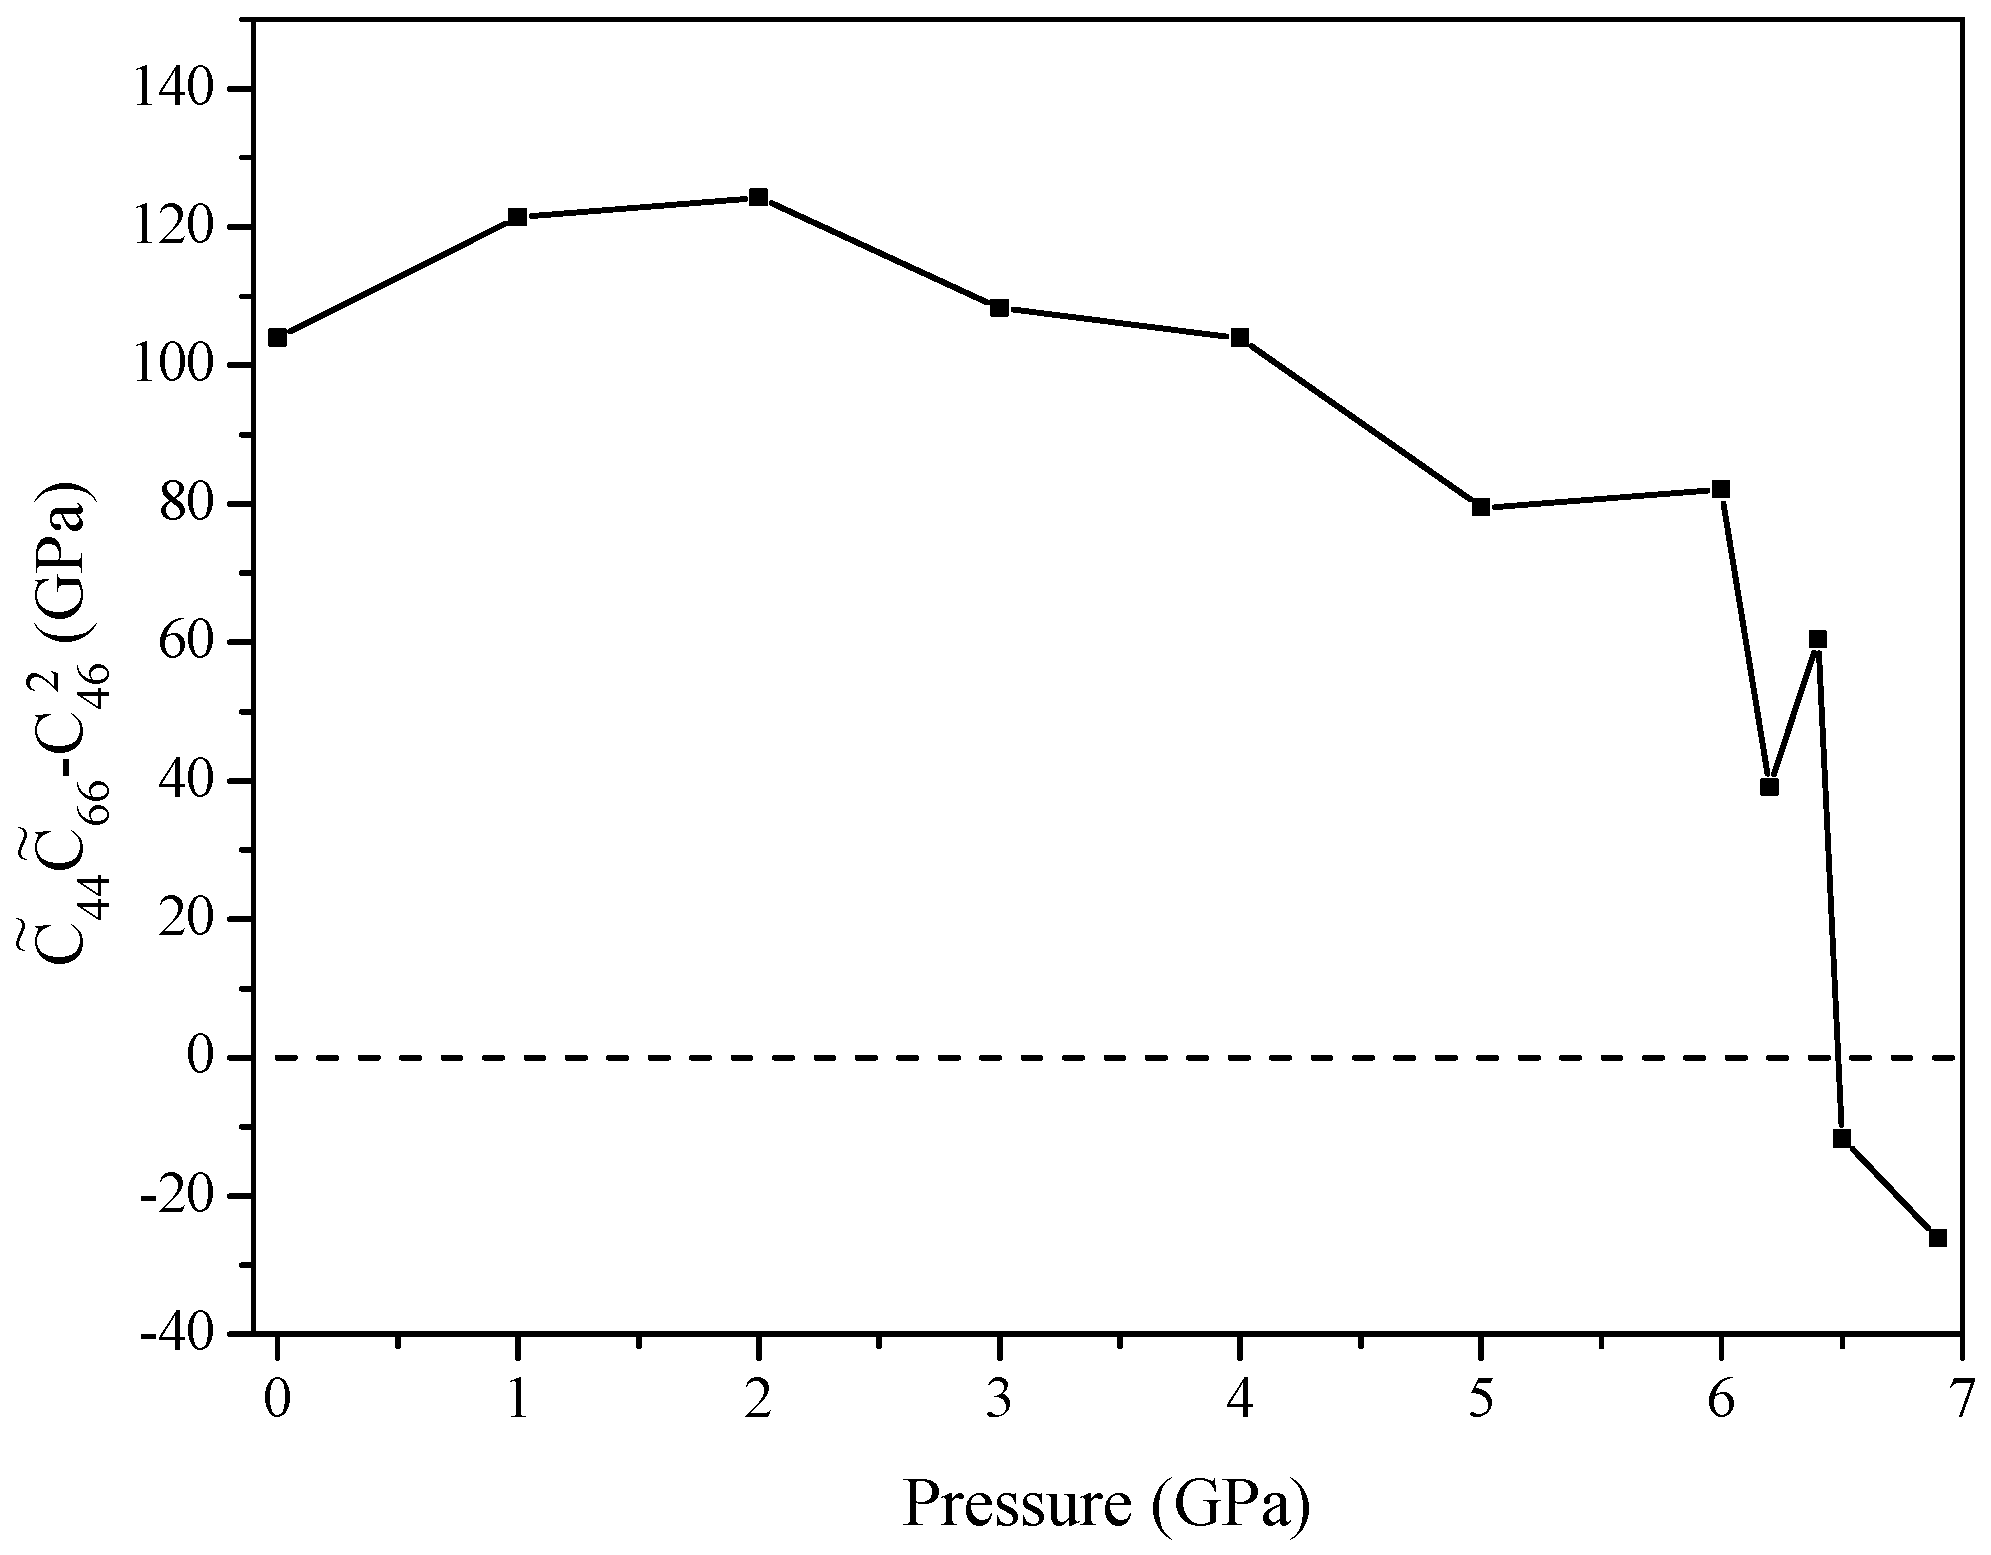
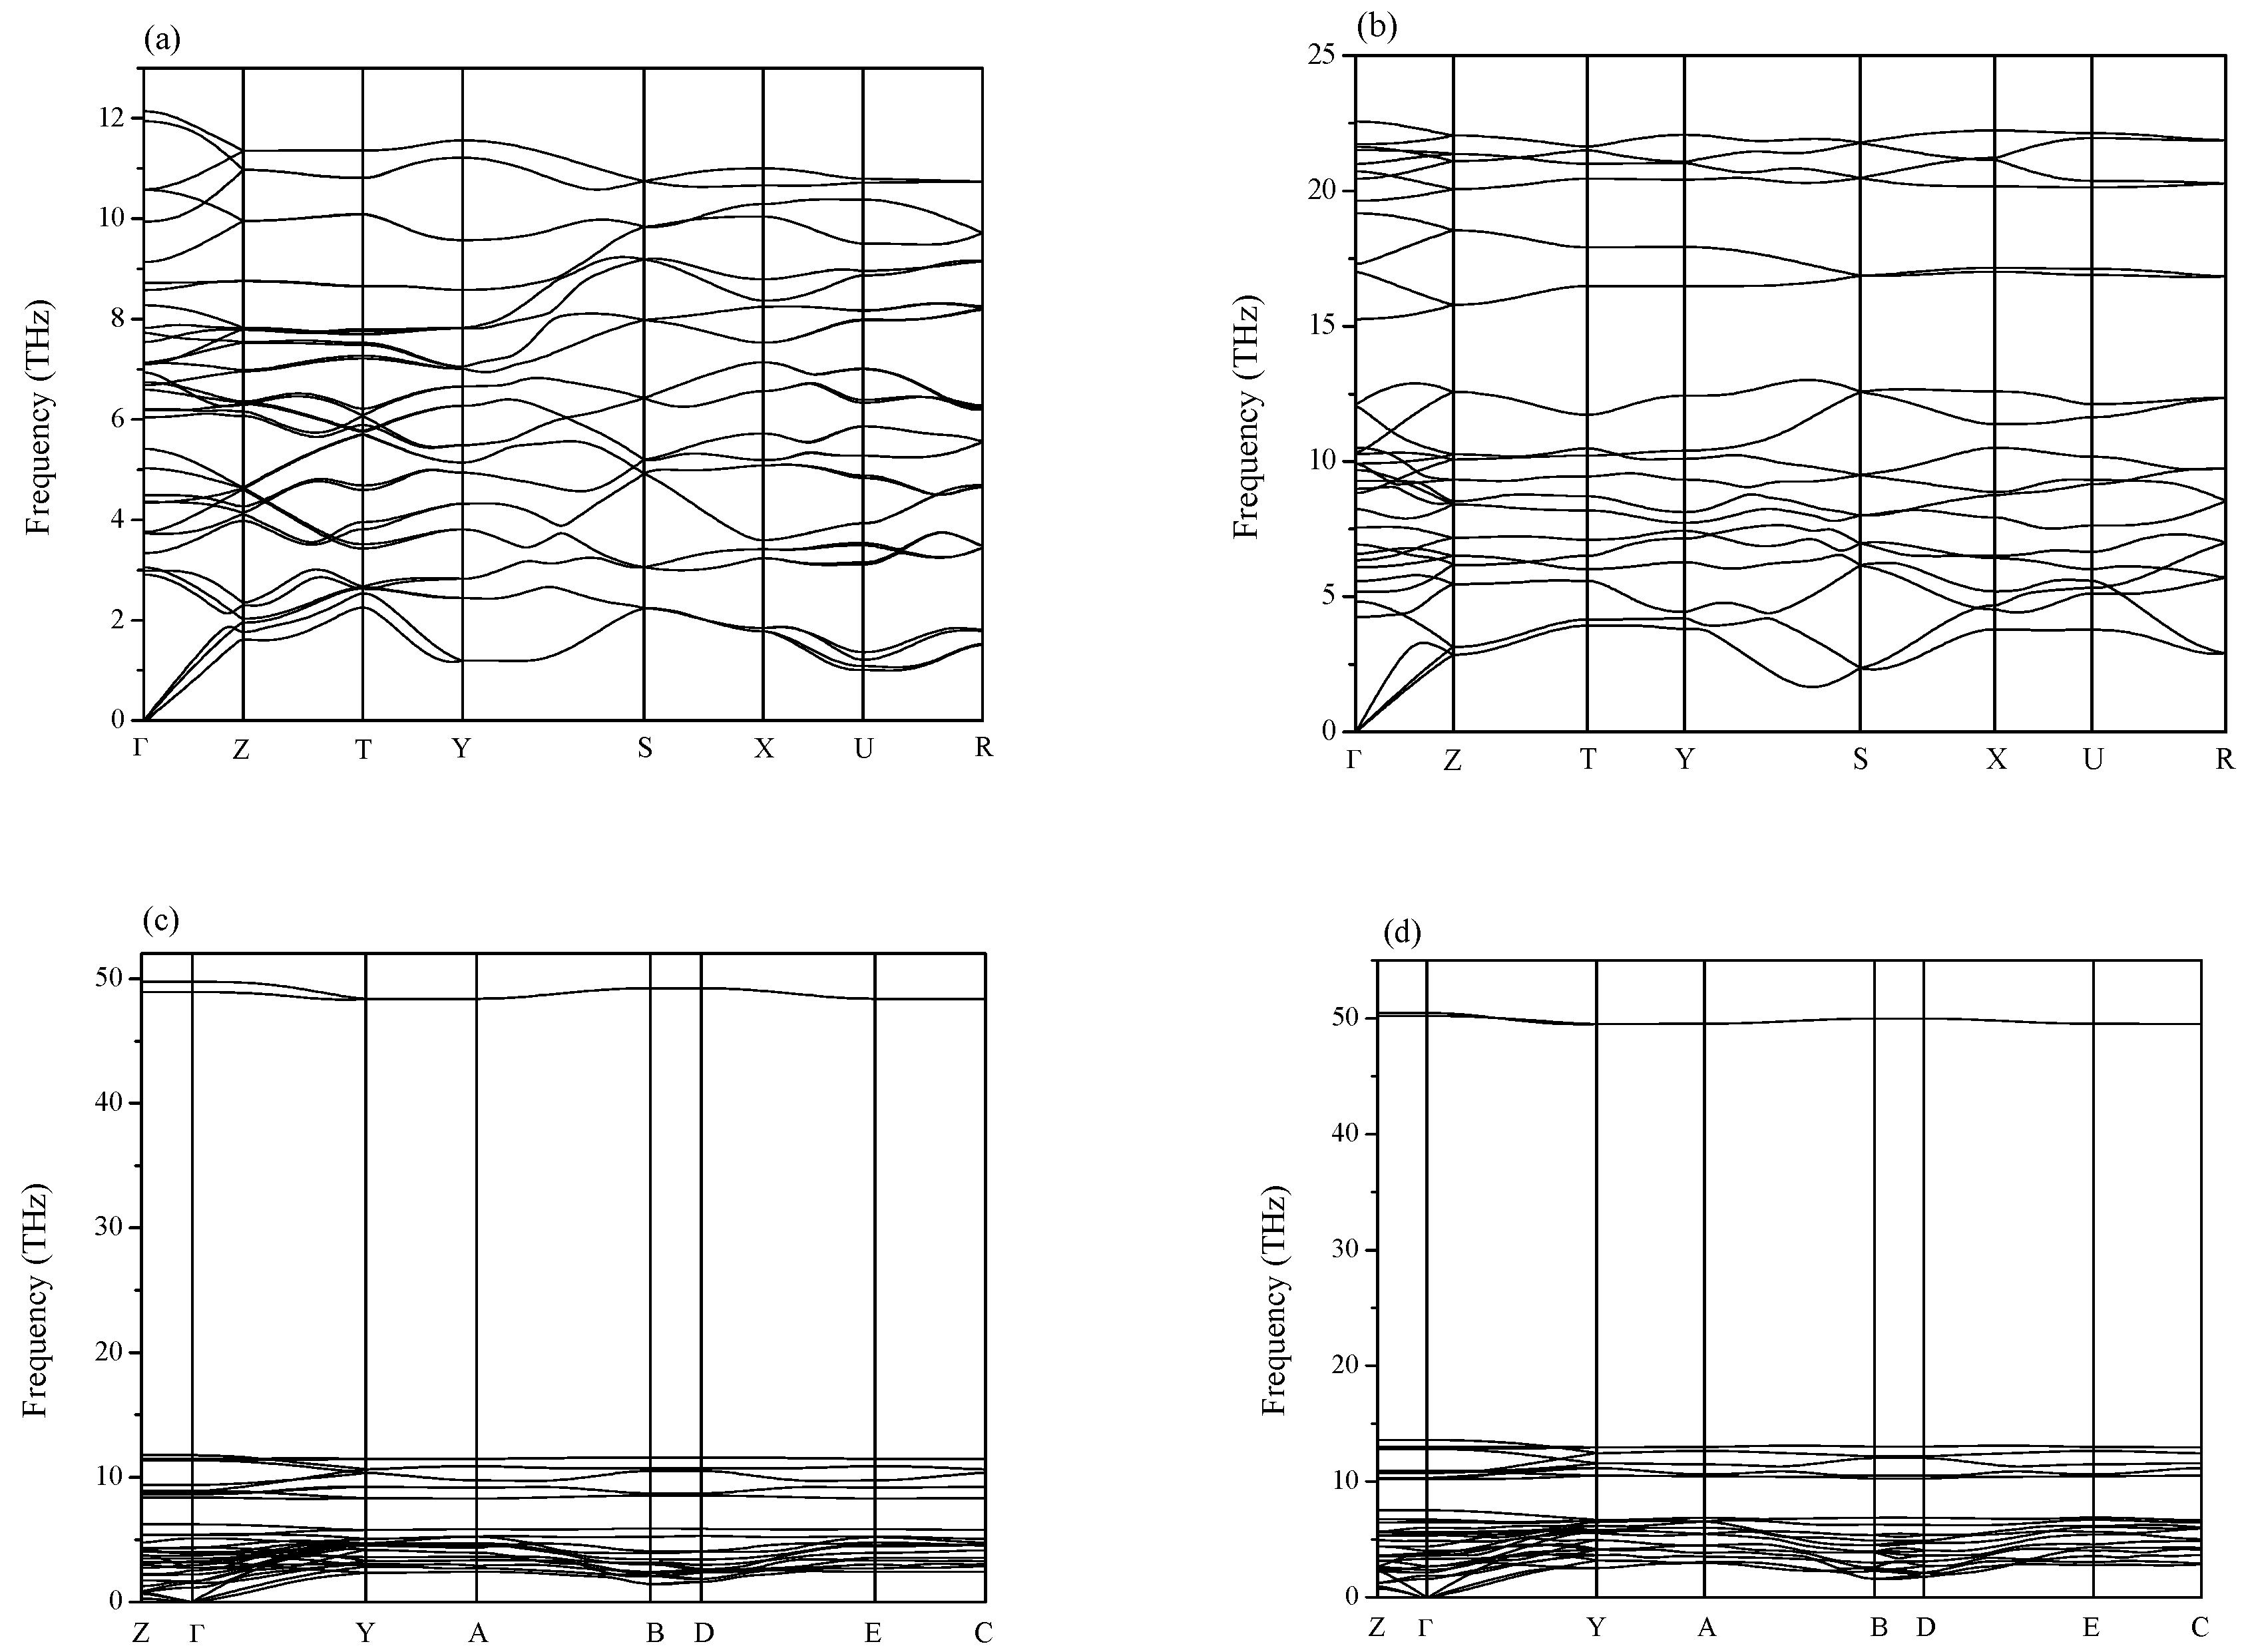
If the elastic constants satisfy these stability criteria, it means the structure is mechanically stable. From Table 3, one can see that orthorhombic Pnma-Ca2C is mechanical stable up to at least 100 GPa. For monoclinic C2/m-Ca2C, the criteria , which is similar to the Equation (9), is obeyed only up to 6.4 GPa, as seen in Figure 4, showing that it has mechanical stability below 6.4 GPa. Furthermore, the phonon spectra are presented in Figure 5 to ensure the dynamical stability. As observed, there is no imaginary frequency in the whole Brillouin zone, indicating that Pnma-Ca2C is dynamically stable up to at least 100 GPa and that the C2/m-Ca2C is dynamically stable below 6.4 GPa. The elastic constants as a function of pressure are displayed in Figure 6 with an approximately upward tendency. We noticed that, for Pnma-Ca2C, C11 is larger than C22 or C33 at 0 GPa, whereas it is less than C22 or C33 at high pressures, which is in consistent with our previous analyses on the incompressibility along the a-, b-, and c-axis.
In Table 3, the bulk modulus B and shear modulus G are calculated by Voigt-Reuss-Hill approximations [20,21,22]. The Young’s modulus E and Poisson’s ratio, υ are given by the following equations [22]:
The Pnma-Ca2C is larger than C2/m-Ca2C in bulk modulus, shear modulus and Young’s modulus at 0 GPa, as listed in Table 3. All the elastic modulus increase with pressure for Pnma-Ca2C. According to Pugh [23], the brittle material has a small B/G ratio (B/G < 1.75), whereas, the ductile material has a larger ratio (B/G > 1.75). It is interesting that Pnma-Ca2C and C2/m-Ca2C show the brittle manner at 0 GPa and transform to ductile manner at 9.3 GPa and 2.0 GPa, respectively.
Calculating the elastic anisotropy of crystal is of great importance to further study the physical and chemical properties. The calculated universal elastic anisotropy index (AU), shear anisotropic factors (A1, A2 and A3) and percentage of anisotropy in compressibility and shear (AB and AG) are listed in Table 4. For arbitrary symmetry, the universal elastic anisotropy index AU is obtained by [24,25]:
When AU is 0, it means the solid is isotropic, otherwise the solid is anisotropic. The results of Pnma-Ca2C are 0.37 at 0 GPa, 0.62 at 50 GPa and 0.15 at 100 GPa, respectively. And the results of C2/m-CaC2 are 0.95 at 0 GPa and 0.54 at 6 GPa, respectively. All of them are larger than 0, indicating an elastic anisotropy. The shear anisotropic factors provide a measure of the degree of anisotropy in the bonding between atoms in different planes. The shear anisotropic factor for the {100} shear plane between the <011> and <010> directions is [26,27]:
For the {010} shear plane between the <101> and <001> directions, it is:
For the {001} shear plane between the <110> and <010> directions, it is:
The factors A1, A2 and A3 are 1.0 for any isotropic crystals. As observed in Table 3, all the calculated shear anisotropic factors are not 1.0, presenting the elastic anisotropy. The percentage anisotropy in compressibility and shear are defined as [26]:
where B and G are the bulk and shear modulus, and the subscripts V and R represent the Voigt and Reuss bounds. The values of isotropic crystal are 0.0. In Table 3, the values of AB and AG suggest that these two structures of Ca2C are anisotropic in compressibility and shear.
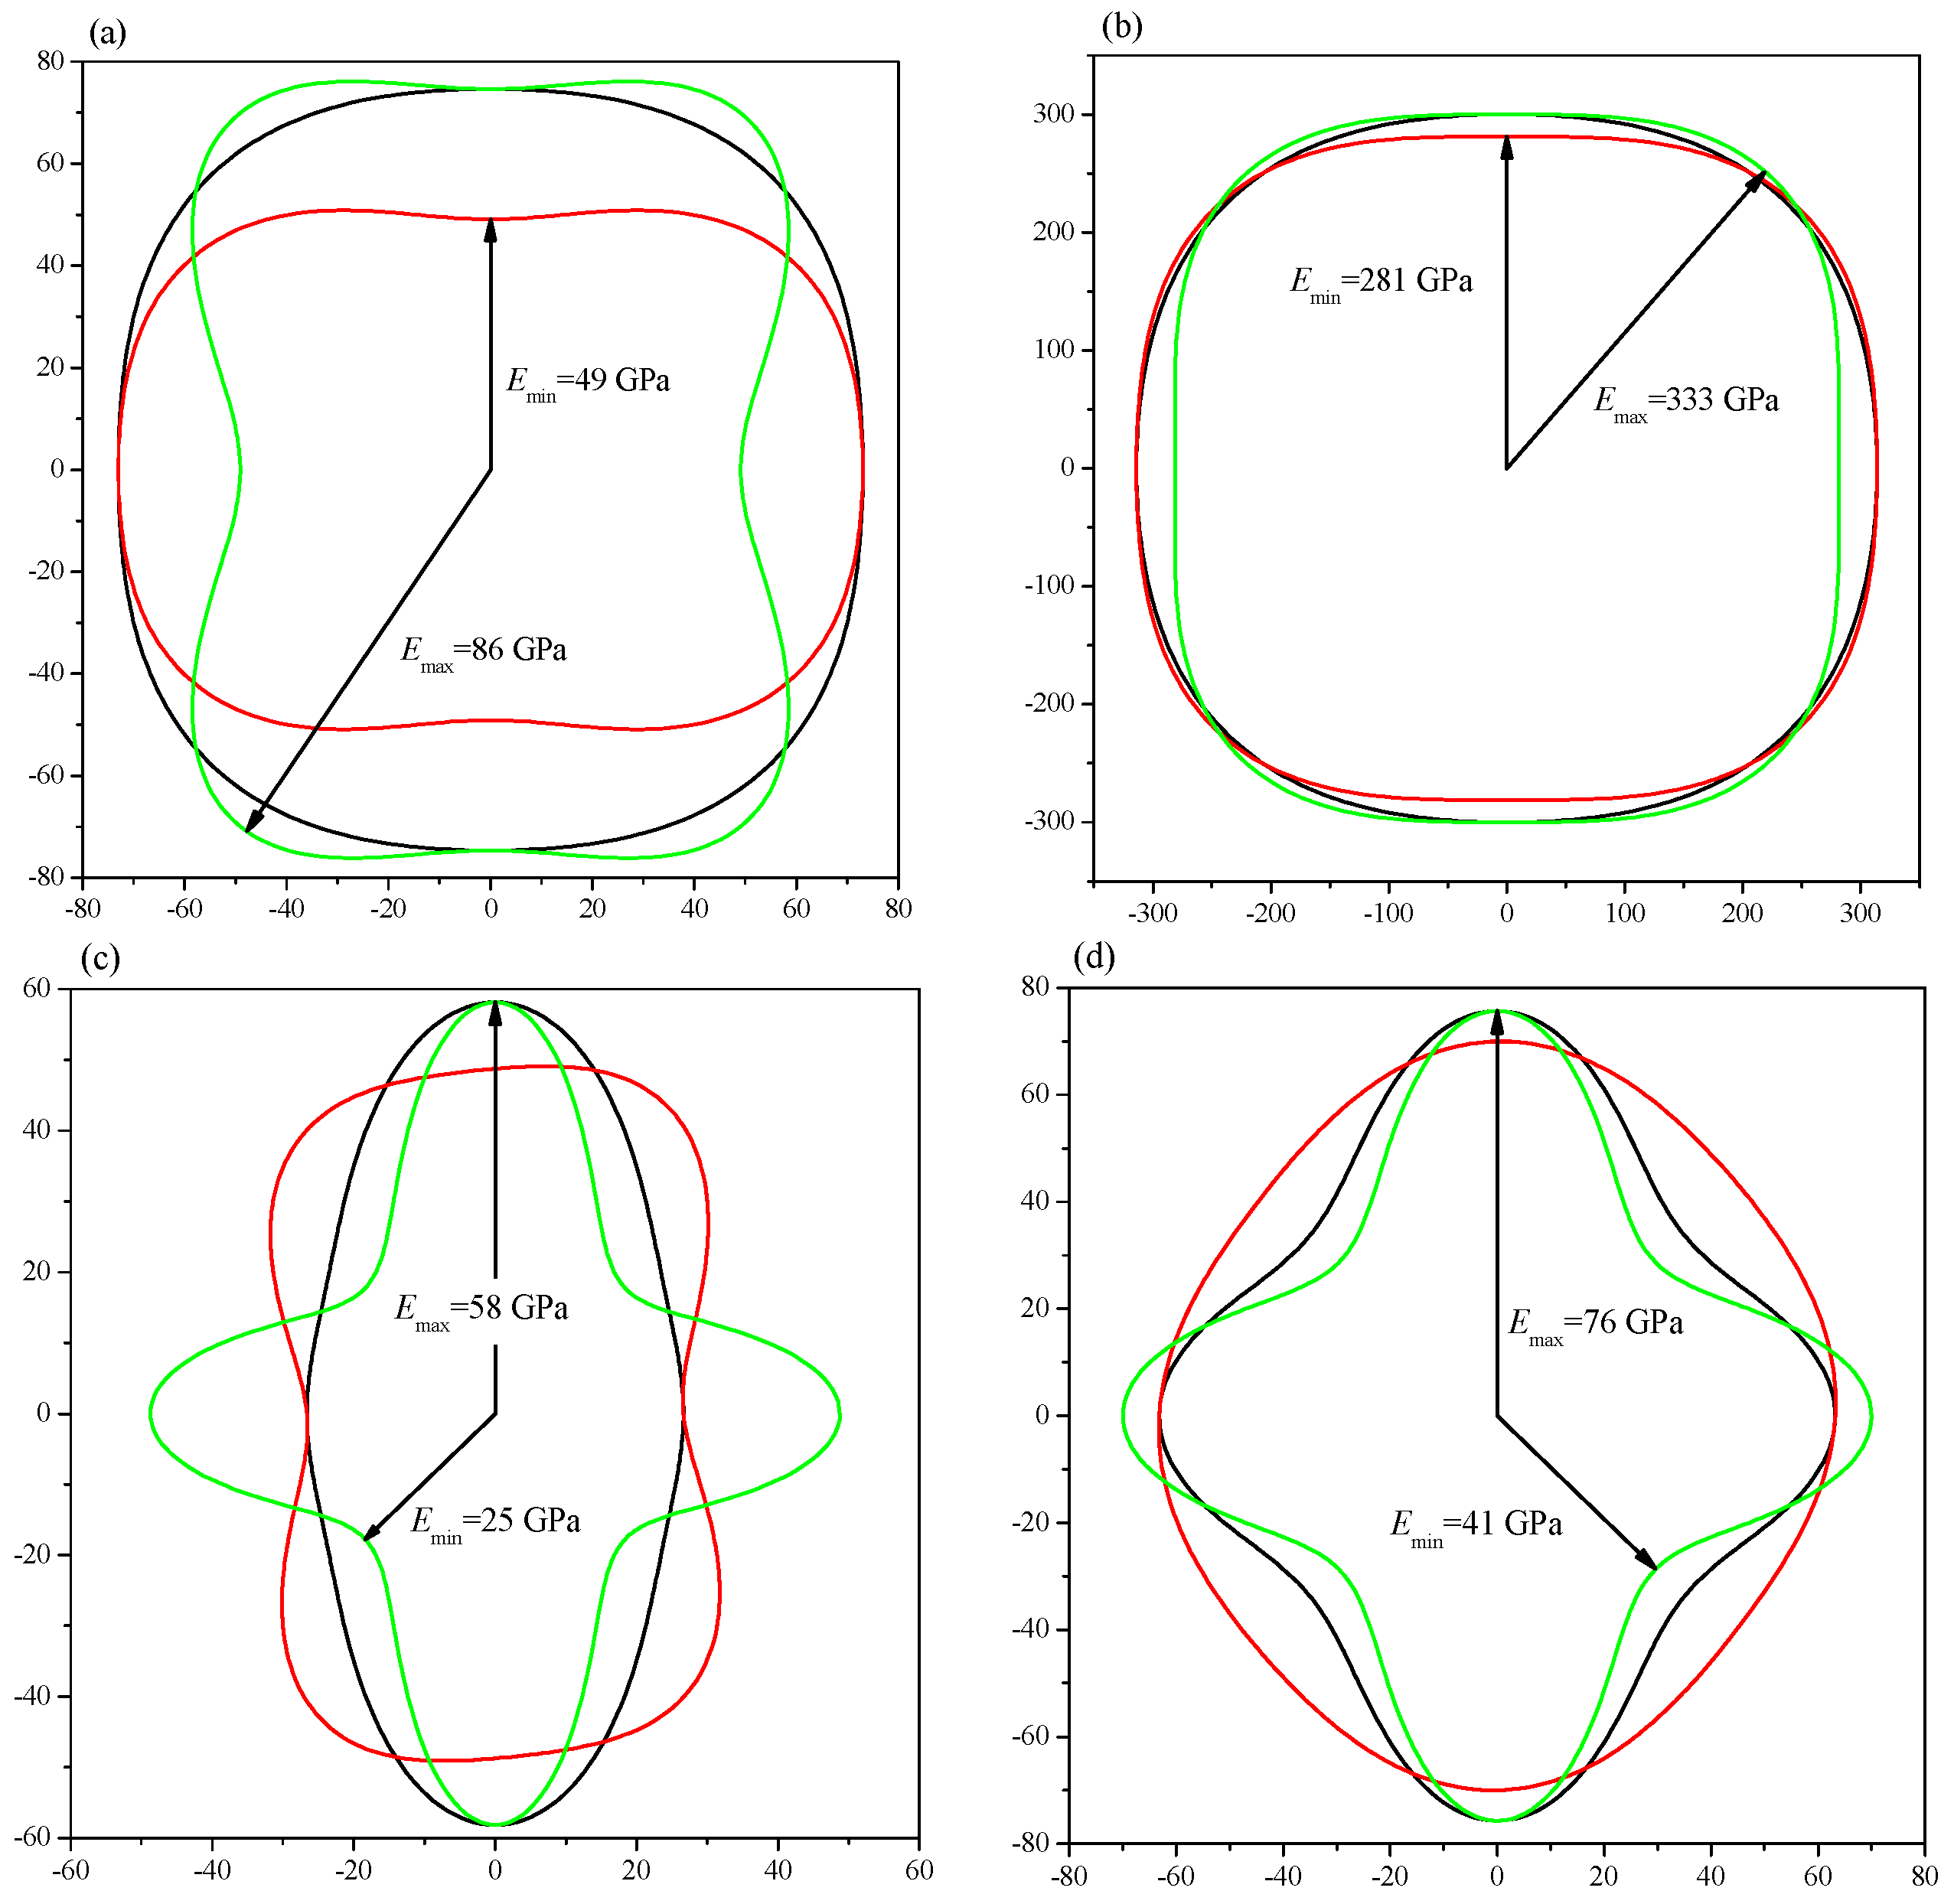
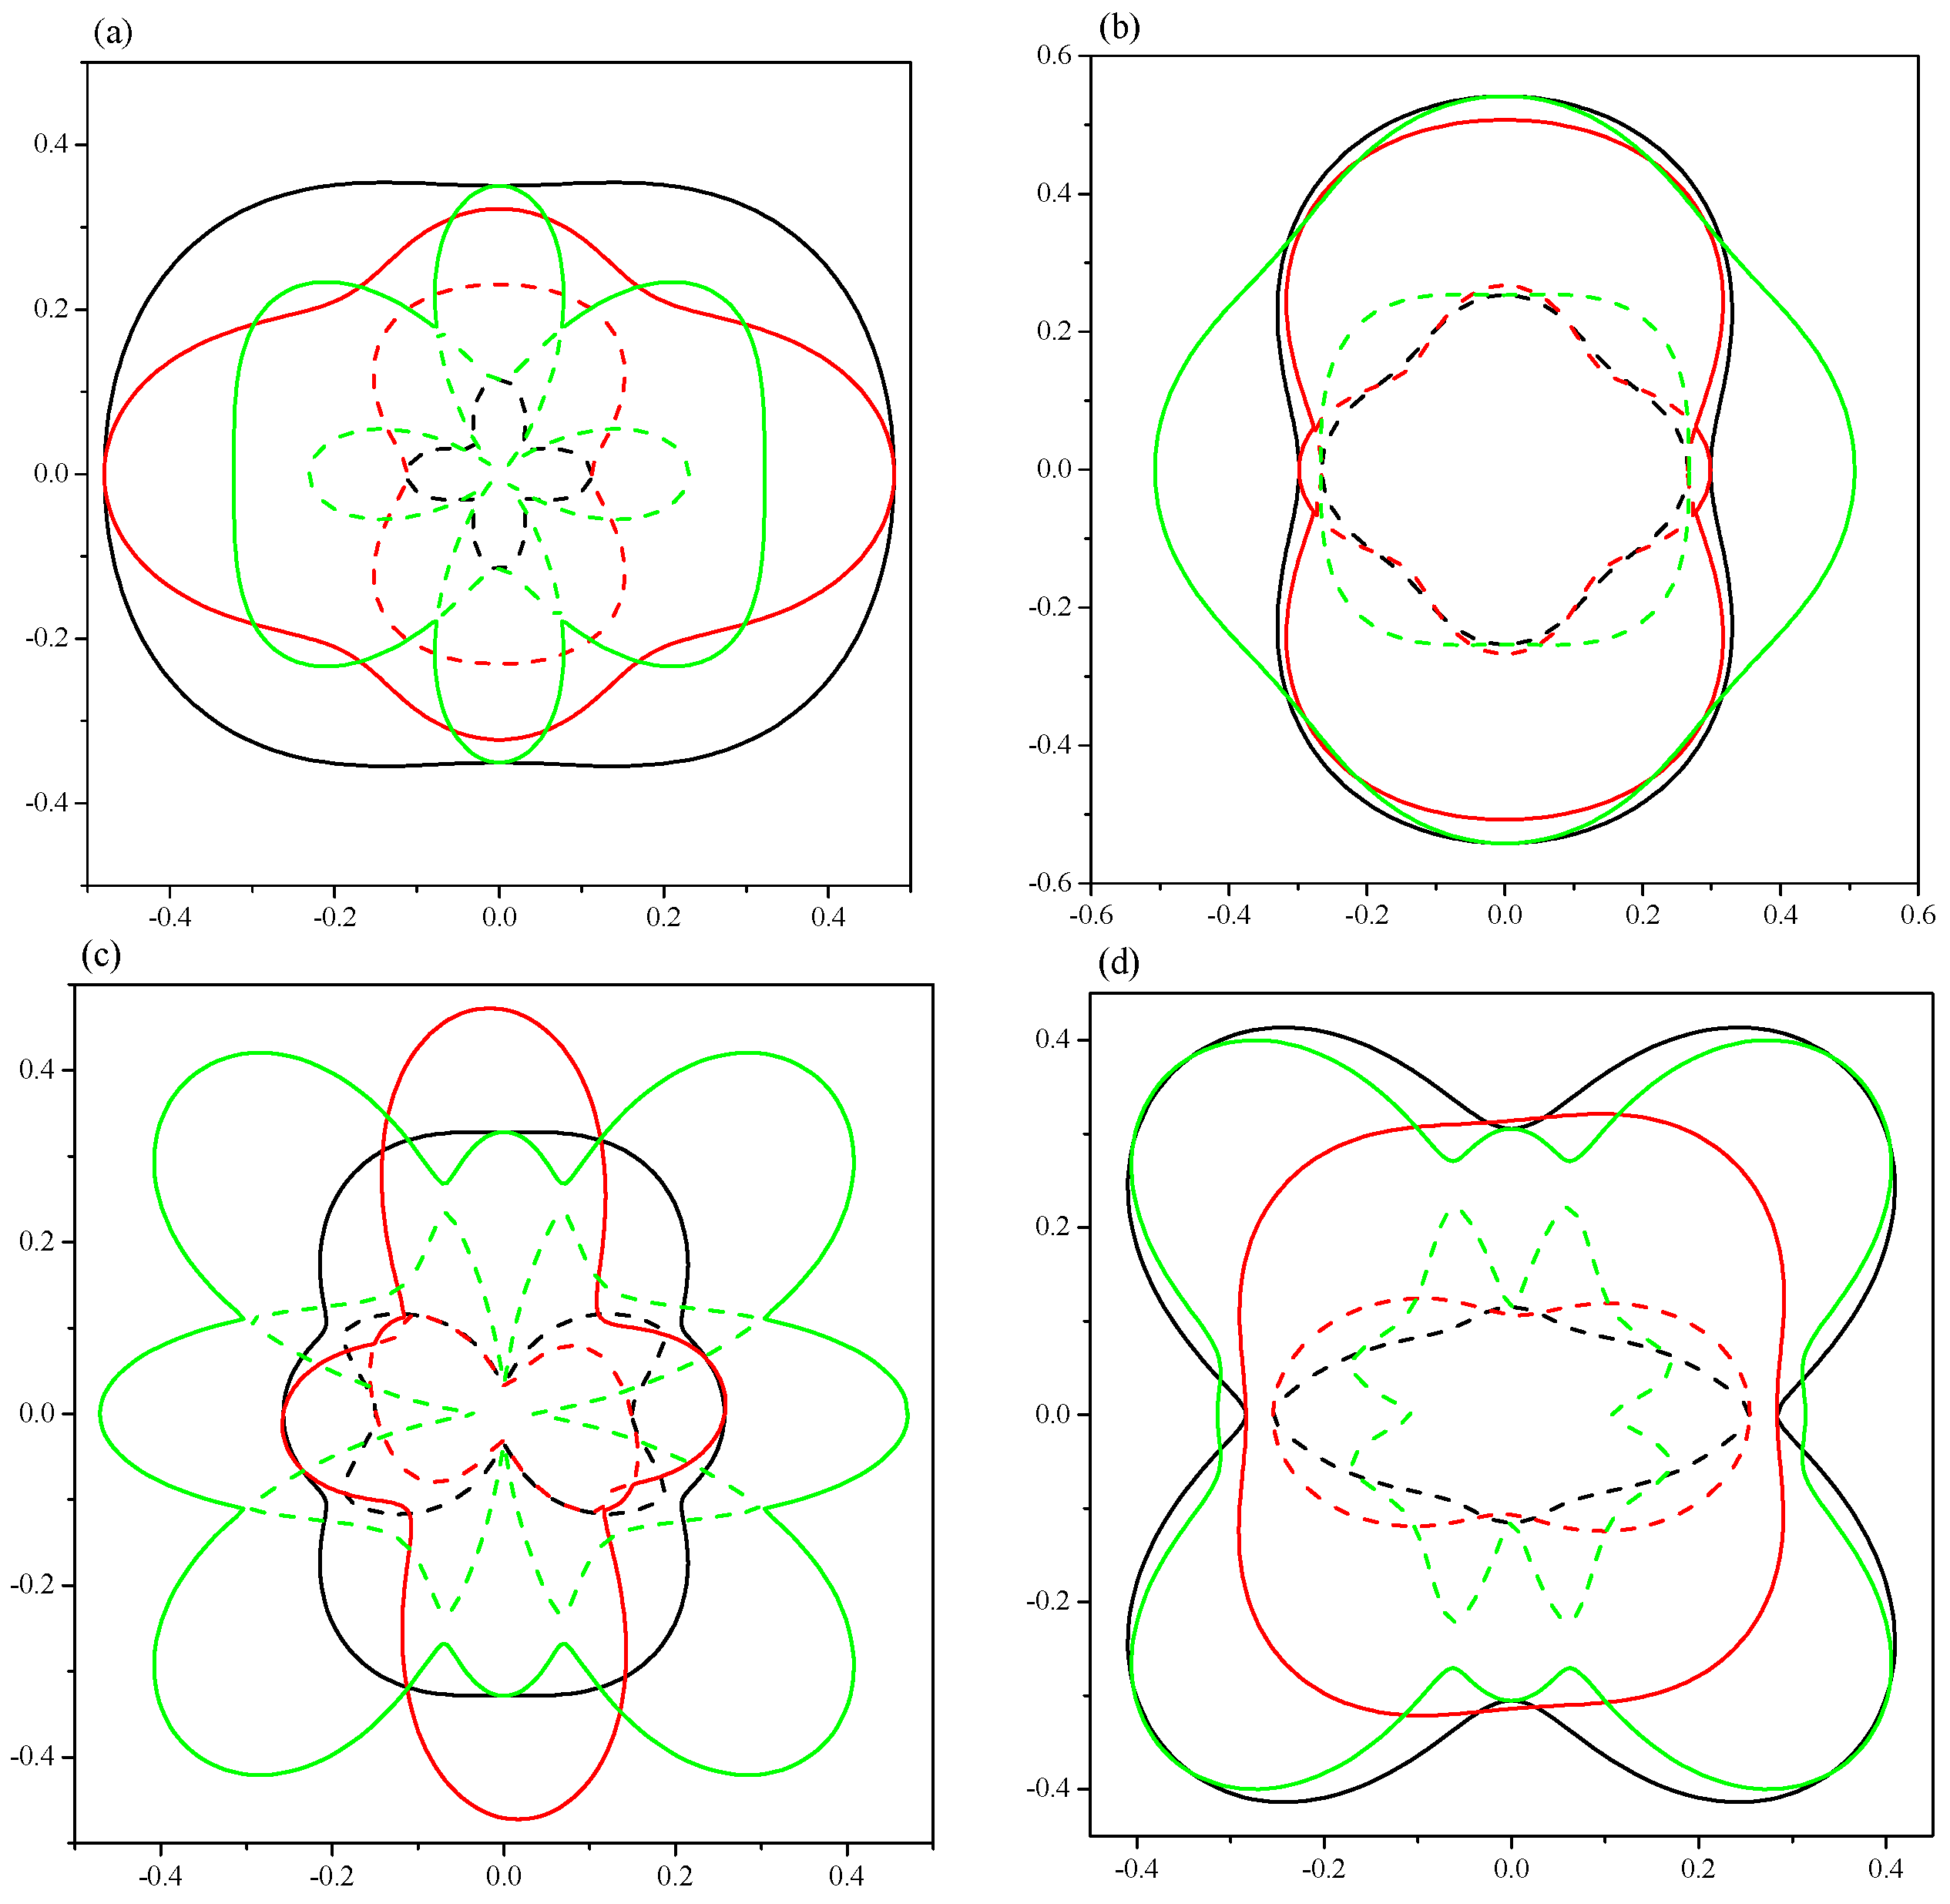
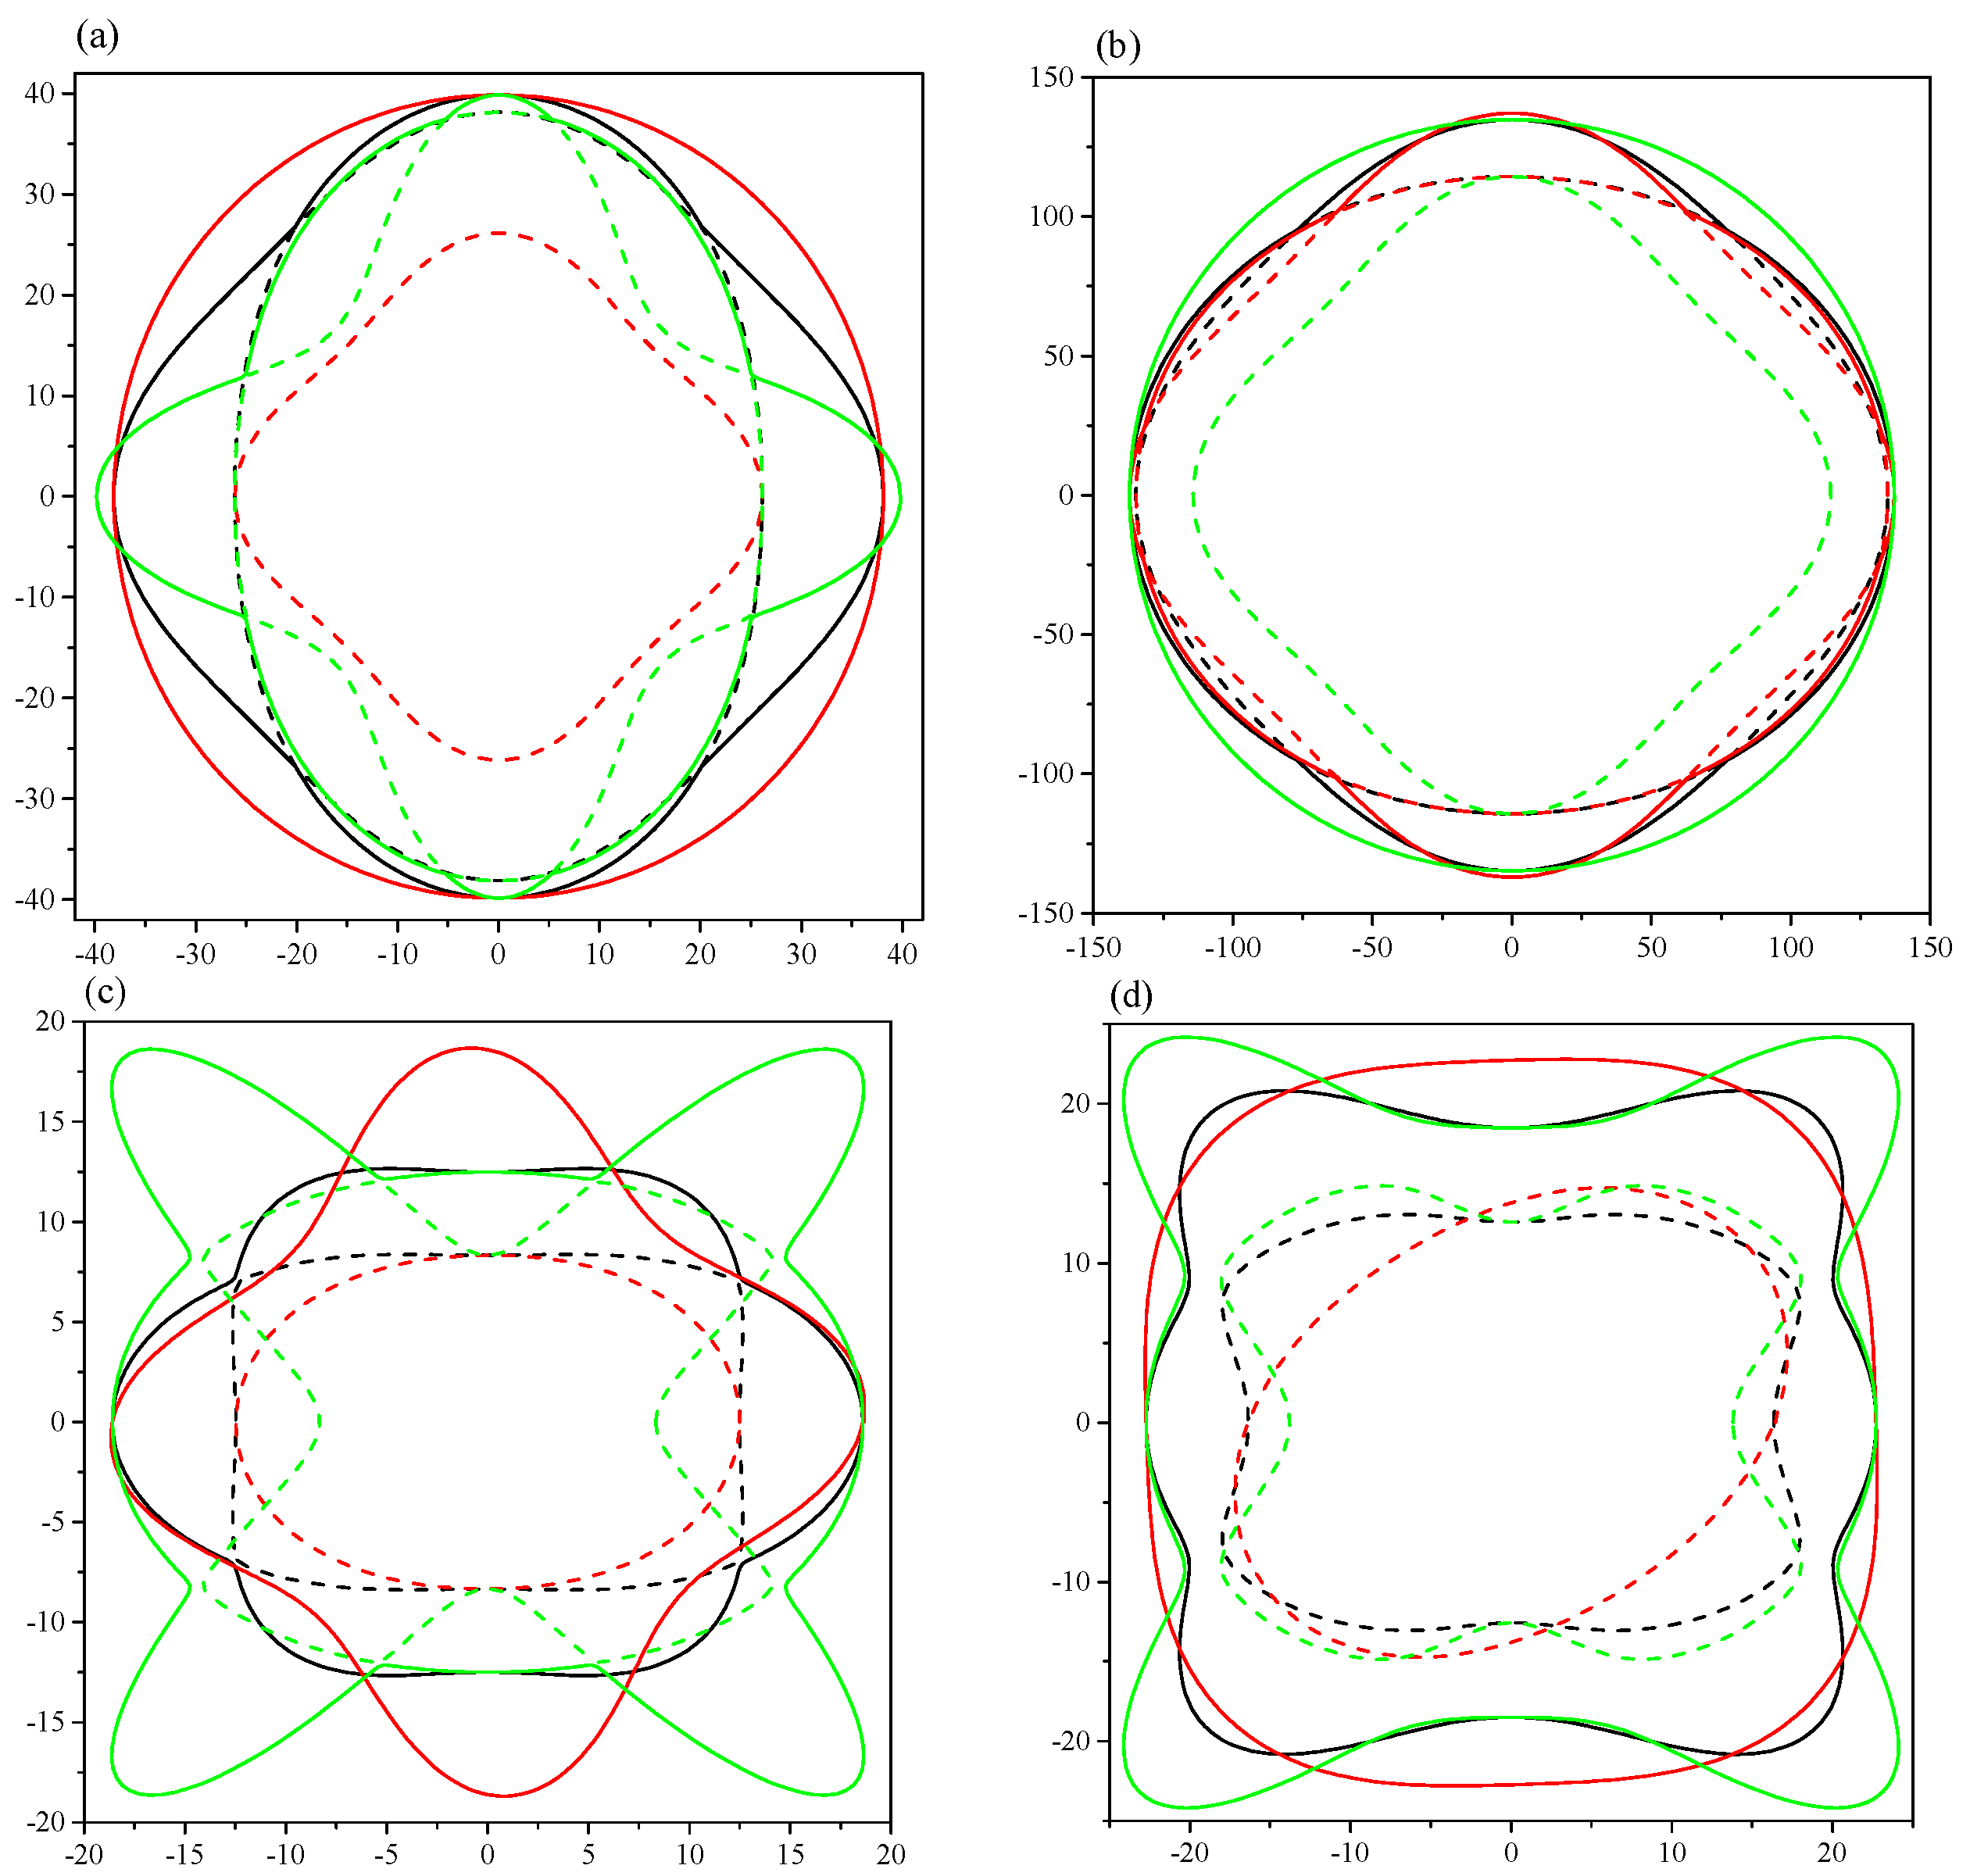
To intuitively illustrate the elastic anisotropy, the directional dependence of elastic anisotropy was calculated by the ELAM code [28], which shows the 2D figures of the differences in each direction. The calculated Young’s modulus along different directions as well as the projections in different planes are demonstrated in Figure 7. The ratios of Emax/Emin are 1.76 (1.19) and 2.32 (1.85) for Pnma-Ca2C at 0 (100) GPa and C2/m-Ca2C at 0 (6.0) GPa, respectively, which means C2/m-Ca2C has greater anisotropy. The anisotropy in yz plane is the greatest for Pnma-Ca2C at both 0 and 100 GPa (see Figure 7a,b). In Figure 7c,d, the C2/m-Ca2C also has the largest anisotropy in yz plane at both 0 and 6 GPa. The 2D representations of Poisson’s ratio are revealed in Figure 8. All of them show the elastic anisotropy. From Figure 8a,b, it can be found that the Pnma-Ca2C has the greatest anisotropy in yz plane at 0 GPa and in xz plane at 100 GPa. However, the greatest anisotropy of C2/m-Ca2C is in yz plane at both 0 and 6 GPa (see Figure 8c,d). The C2/m-Ca2C is more anisotropic than the Pnma-Ca2C in Poisson’s ratio. As far as the 2D projections of shear modulus in xy, yz, and xz planes shown in Figure 9, both C2/m-Ca2C and Pnma-Ca2C exhibit the obvious elastic anisotropy. From Figure 9a,b, it is seen that the 2D projections of shear modulus in xz plane at 0 GPa and in yz plane at 100 GPa are almost a perfect circle, showing a slight anisotropy character in these two cases. The anisotropy of Pnma-Ca2C at high pressure is smaller than that at 0 GPa. The same case occurred for C2/m-Ca2C, as seen in Figure 9c,d. Similar to the anisotropy of Poisson’s ratio, the shear modulus of Pnma-Ca2C has the greatest anisotropy in yz plane at 0 GPa and in xz plane at 100 GPa, and that of C2/m-Ca2C is the most anisotropic in yz plane at both 0 and 6 GPa.
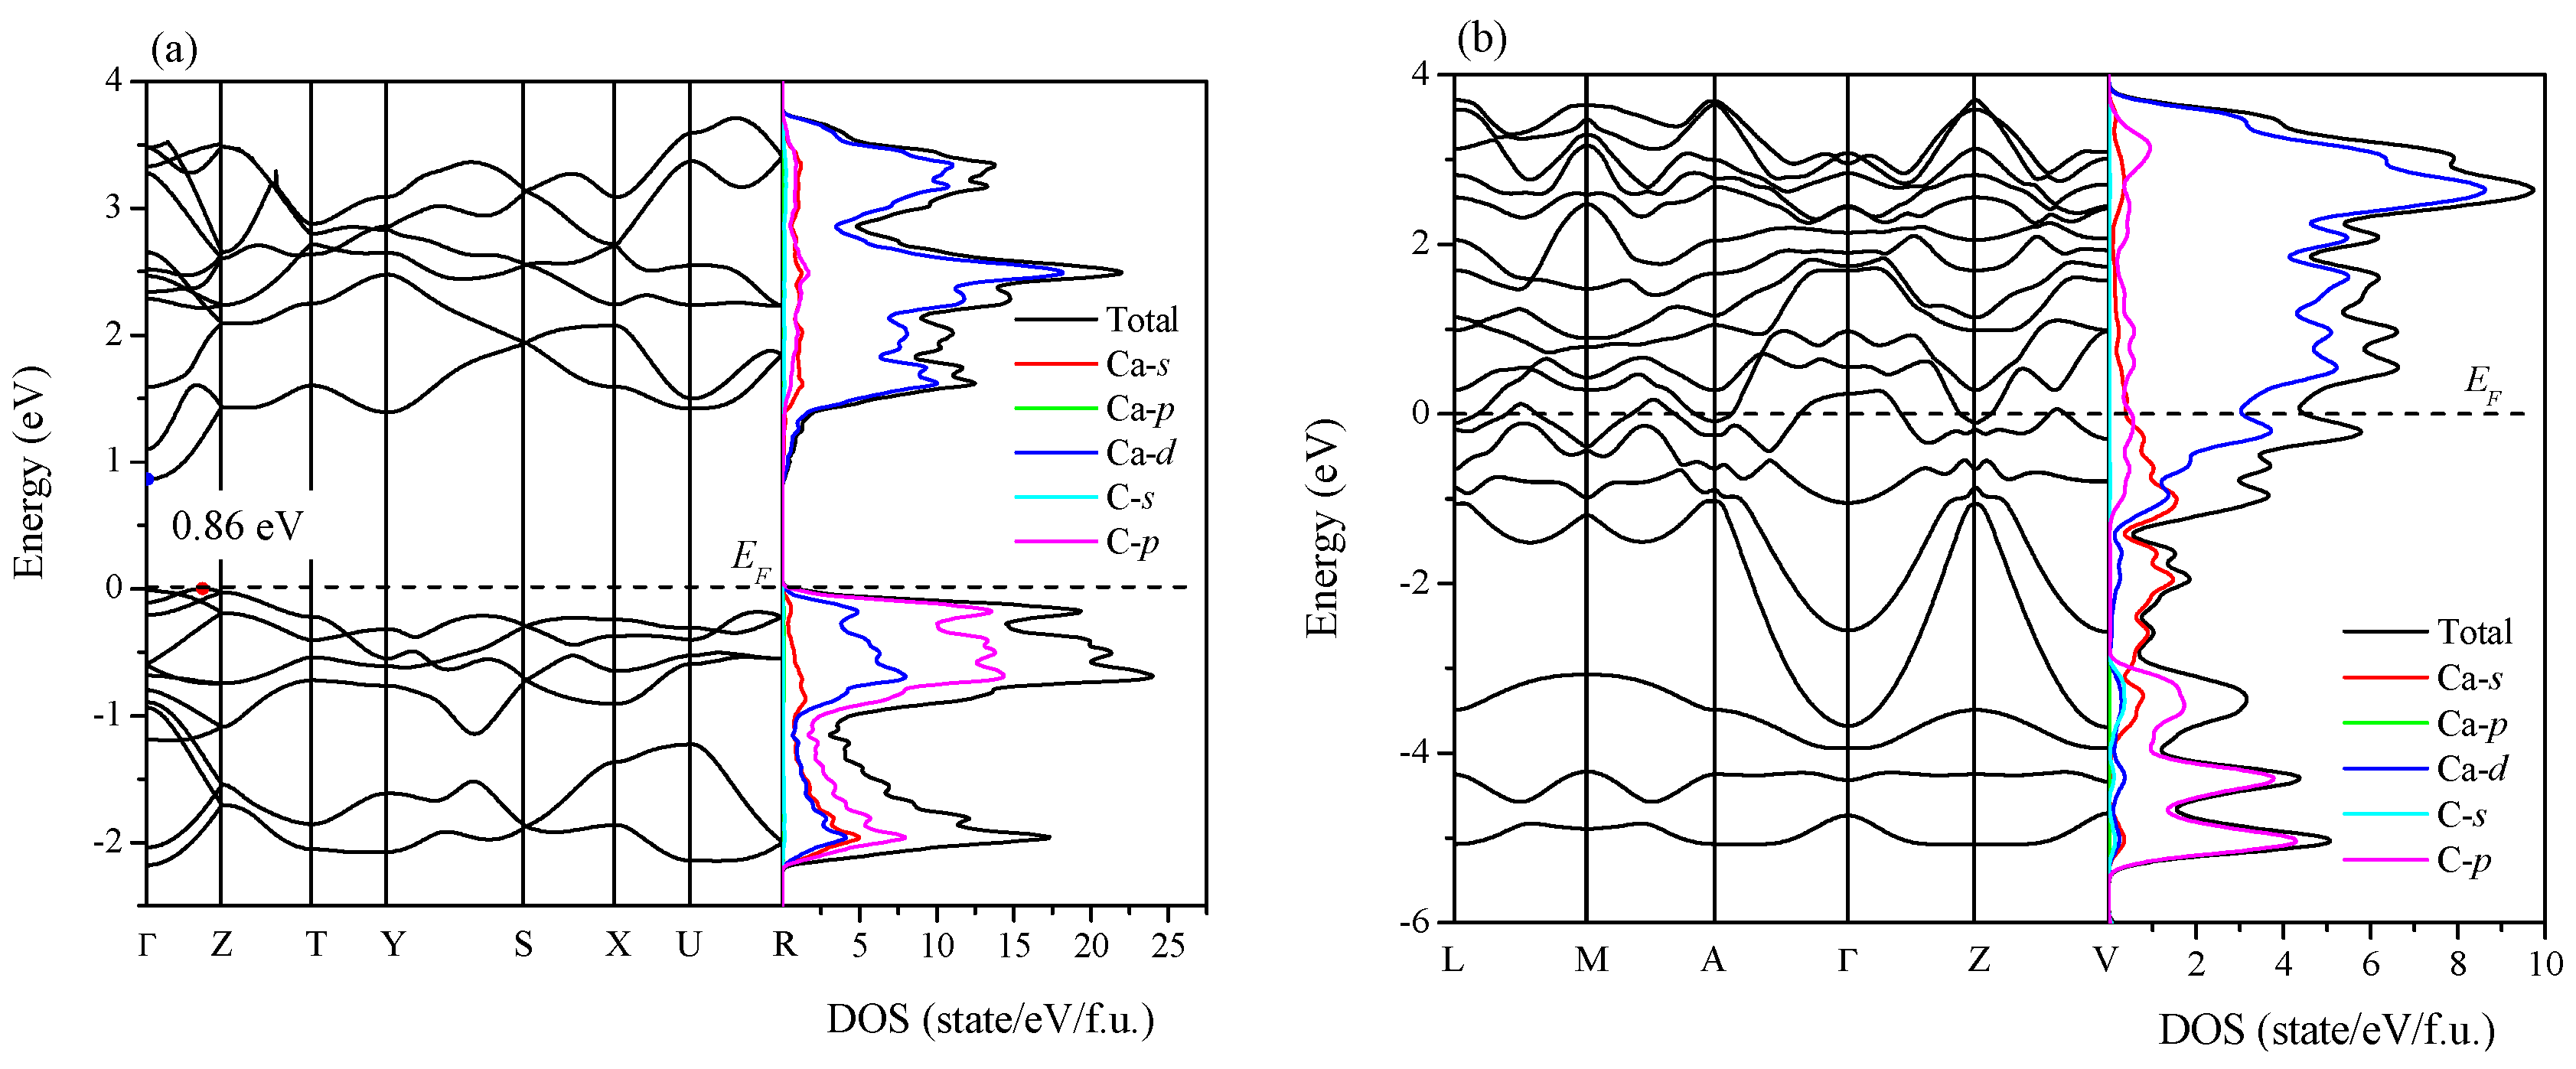
As shown in Figure 10, a research of the electronic band structure and density of state (DOS) of Ca2C at 0 GPa was also made. The dashed line represents the Fermi level (EF). From Figure 10a, one can see that Pnma-Ca2C is a semiconductor characterized by a quasi-direct band gap of 0.86 eV (the direct band gap at Γ point is 0.87 eV). The conduction band minimum (CBM) is just at Γ point, and the valence band maximum (VBM) locates at (0, 0, 0.378) along the Γ-Z direction. The calculated band gap of Pnma-Ca2C at 14 GPa is direct band gap with 0.65 eV, which is close to the previous value of 0.64 eV [9]. It is known that the calculated band gap with DFT is usually underestimated by 30%–50%, so the ideal band gap is larger than this calculated result. The DOS of Pnma-Ca2C near Fermi level is mainly originated from the contributions of C-p orbital electrons. In Figure 10b, the calculated electronic band structure crosses the Fermi level along many directions in the Brillouin zone, showing the metallic character. And the DOS near Fermi level is mainly characterized by the Ca-d orbital electrons.
3. Computational Methods
Our calculations are performed via the generalized gradient approximation (GGA) parameterized by Perdew-Burke-Eruzerhof (PBE) [29] in the Cambridge Serial Total Energy Package (CASTEP) code [30], which is based on the density functional theory (DFT) [31,32]. For the two Ca2C phases, the ultrasoft pseudo-potential [33] which describes the interactions between the ionic core and valence electrons is used with the cutoff energy of 420 eV. The k-points of Pnma-Ca2C (7 × 11 × 6) and C2/m-Ca2C (6 × 9 × 3) in the first irreducible Brillouin zone are generated using Monkhorst-Pack mesh scheme [34]. Furthermore, the Broyden-Fletcher-Goldfarb-Shanno (BFGS) minimization scheme [35] is used in geometry optimization. The convergence is within 1 meV/atom in the total energy convergence tests for all calculation parameters. The self-consistent convergence of the total energy is 5 × 10⁻⁶ eV/atom, the maximum force on the atom is 0.01 eV/Å, the maximum stress is 0.02 GPa and the maximum ionic displacement is 5 × 10⁻⁴ Å.
4. Conclusions
A systematic analysis of the pressure-induced phase transition of Ca2C is made by first-principles calculations. The enthalpy and dependence of volume on pressure of Ca2C are performed. We found that there is a phase transition which occurs at 7.8 GPa transforming from C2/m-Ca2C to Pnma-Ca2C with a volume drop of 26.7%. The Pnma-Ca2C is larger than C2/m-Ca2C in the calculated bulk modulus, shear modulus, Young’s modulus and Poisson’s ratio at 0 GPa. Both of them exhibit the elastic anisotropy. The low-pressure phase C2/m-Ca2C, which is mechanically stable up to 6.4 GPa, has the greater anisotropy over the Pnma-Ca2C. The electronic band structures reveal the semiconductivity of Pnma-Ca2C and the metallicity of C2/m-Ca2C. The quasi-direct band gap of Pnma-Ca2C at 0 GPa is 0.86 eV. Furthermore, the total and partial density of states is provided to study the specific contribution to Fermi level.
Acknowledgments
This work was financially supported by the Natural Science Foundation of China (No. 11204007), Natural Science Basic Research plan in Shaanxi Province of China (Nos. 2016JM1026 and 2016JM1016), and Education Committee Natural Science Foundation in Shaanxi Province of China (Grant No. 16JK1049). X. Dai (Xidian University) is thanked for allowing to use the Materials Studio, including CASTEP code.
Author Contributions
Qun Wei and Meiguang Zhang designed the project; Quan Zhang performed the calculations, Qun Wei and Quan Zhang prepared the manuscript, Meiguang Zhang revised the paper and coordinated this work, all authors discussed the results and commented on the manuscript.
Conflicts of Interest
The authors declare no conflict of interest.
References
- Zhang, W.; Oganov, A.R.; Goncharov, A.F.; Zhu, Q.; Boulfelfel, S.E.; Lyakhov, A.O.; Stavrou, E.; Somayazulu, M.; Prakapenka, V.B.; Konôpková, Z. Unexpected stable stoichiometries of Sodium Chlorides. Science 2013, 342, 1502–1505. [Google Scholar] [CrossRef] [PubMed]
- Kurakevych, O.O.; Strobel, T.A.; Kim, D.Y.; Cody, G.D. Synthesis of Mg2C: A Magnesium Methanide. Angew. Chem. Int. Ed. 2013, 52, 8930–8933. [Google Scholar] [CrossRef] [PubMed]
- Fan, Q.; Chai, C.; Wei, Q.; Yang, Y.; Yang, Q.; Chen, P.; Xing, M.; Zhang, J.; Yao, R. Prediction of novel phase of silicon and Si-Ge alloys. J. Solid State Chem. 2016, 233, 471–483. [Google Scholar] [CrossRef]
- Wei, Q.; Yan, H.; Zhu, X.; Lin, Z.; Yao, R. Theoretical investigations on the elastic and thermodynamic properties of Rhenium Phosphide. Z. Naturforsch. A 2016, 71, 1–8. [Google Scholar] [CrossRef]
- Gauzzi, A.; Takashima, S.; Takeshita, N.; Terakura, C.; Takagi, H.; Emery, N.; Hérold, C.; Lagrange, P.; Loupias, G. Enhancement of superconductivity and evidence of structural instability in intercalated Graphite CaC6 under high pressure. Phys. Rev. Lett. 2007, 98, 067002. [Google Scholar] [CrossRef] [PubMed]
- Nylén, J.; Konar, S.; Lazor, P.; Benson, D.; Häussermann, U. Structural behavior of the acetylide carbides Li2C2 and CaC2 at high pressure. J. Chem. Phys. 2012, 137, 224507. [Google Scholar] [CrossRef] [PubMed]
- Li, Y.L.; Luo, W.; Zeng, Z.; Lin, H.Q.; Mao, H.K.; Ahuja, R. Pressure-induced superconductivity in CaC2. Proc. Natl. Acad. Sci. USA 2013, 110, 9289–9294. [Google Scholar] [CrossRef] [PubMed]
- Nourbakhsh, Z.; Hashemifar, S.J.; Akbarzadeh, H. First-principles insights into p magnetism in CaC and CaN ionic compounds. J. Magn. Magn. Mater. 2013, 341, 56–59. [Google Scholar] [CrossRef]
- Li, Y.L.; Wang, S.N.; Oganov, A.R.; Gou, H.; Smith, J.S.; Strobel, T.A. Investigation of exotic stable calcium carbides using theory and experiment. Nat. Commun. 2015, 6, 6974. [Google Scholar] [CrossRef] [PubMed]
- Dong, S.; Ding, H.; Zhou, B.; Duan, C.; Wu, P.; Zhao, H. First-principles and Monte Carlo studies on the magnetic stability of half-metallic zinc-blende CaC and similar compounds. J. Magn. Magn. Mater. 2015, 378, 469–477. [Google Scholar] [CrossRef]
- Debessai, M.; Hamlin, J.J.; Schilling, J.S.; Rosenmann, D.; Hinks, D.G.; Claus, H. Superconductivity for CaC6 to 32 GPa hydrostatic pressure. Phys. Rev. B 2010, 82, 132502. [Google Scholar] [CrossRef]
- Mazin, I.I.; Boeri, L.; Dolgov, O.V.; Golubov, A.A.; Bachelet, G.B.; Giantomassi, M.; Andersen, O.K. Unresolved problems in superconductivity of CaC6. Physics C 2007, 460–462, 116–120. [Google Scholar] [CrossRef]
- Zhang, L.; Xie, Y.; Cui, T.; Li, Y.; He, Z.; Ma, Y.; Zou, G. Pressure-induced enhancement of electron-phonon coupling in superconducting CaC6 from first principles. Phys. Rev. B 2006, 74, 184519. [Google Scholar] [CrossRef]
- Moradi, M.; Mohammadi, A.; Afshari, M.; Soltani, Z. The half-metallicity of zinc-blende CaC/GaAs (001) heterojunction: A density functional theory study. J. Magn. Magn. Mater. 2013, 332, 81–84. [Google Scholar] [CrossRef]
- Nourbakhsh, Z.; Hashemifar, S.J.; Akbarzadeh, H. Ab initio study of different structures of CaC: Magnetism, bonding, and lattice dynamics. J. Alloys Compd. 2013, 579, 360–364. [Google Scholar] [CrossRef]
- Gao, G.Y.; Yao, K. Surface sp half-metallicity of zinc-blende calcium monocarbide. J. Appl. Phys. 2009, 106, 053703. [Google Scholar] [CrossRef]
- Wu, Z.-J.; Zhao, E.-J.; Xiang, H.-P.; Hao, X.-F.; Liu, X.-J.; Meng, J. Crystal structures and elastic properties of superhard IrN2 and IrN3 from first principles. Phys. Rev. B 2007, 76, 054115. [Google Scholar] [CrossRef]
- Fan, Q.Y.; Wei, Q.; Yan, H.Y.; Zhang, M.G.; Zhang, D.Y.; Zhang, J.Q. A New Potential Superhard Phase of OsN2. Acta Phys. Pol. A 2014, 126, 740–746. [Google Scholar] [CrossRef]
- Sin’Ko, G.V.; Smirnov, N.A. Ab initio calculations of elastic constants and thermodynamic properties of bcc, fcc, and hcp Al crystals under pressure. J. Phys. Condens. Matter 2002, 14, 6989–7005. [Google Scholar]
- Voigt, W. Lehrburch der Kristallphysik; Teubner: Leipzig, Germany, 1928. [Google Scholar]
- Reuss, A. Berechnung der Fließgrenze von Mischkristallen auf Grund der Plastizitätsbedingung für Einkristalle. J. Appl. Math. Mech. 1929, 9, 49–58. [Google Scholar] [CrossRef]
- Hill, R. The Elastic Behaviour of a Crystalline Aggregate. Phys. Soc. Lond. Sect. A 1952, 65, 349–354. [Google Scholar] [CrossRef]
- Pugh, S.F. Relations between the elastic moduli and the plastic properties of polycrystalline pure metals. Lond. Edinb. Dublin Philos. Mag. J. Sci. 1954, 45, 823–843. [Google Scholar] [CrossRef]
- Ranganathan, S.I.; Ostoja-Starzewski, M. Universal Elastic Anisotropy Index. Phys. Rev. Lett. 2008, 101, 055504. [Google Scholar] [CrossRef] [PubMed]
- Feng, J.; Xiao, B.; Zhou, R.; Pan, W.; Clarke, D.R. Anisotropic elastic and thermal properties of the double perovskite slab-rock salt layer Ln2SrAl2O7 (Ln = La, Nd, Sm, Eu, Gd or Dy) natural superlattice structure. Acta Mater. 2012, 60, 3380–3392. [Google Scholar] [CrossRef]
- Ravindran, P.; Fast, L.; Korzhavyi, P.A.; Johansson, B.; Wills, J.; Eriksson, O. Density functional theory for calculation of elastic properties of orthorhombic crystals: Application to TiSi2. J. Appl. Phys. 1998, 84, 4891–4904. [Google Scholar] [CrossRef]
- Wei, Q.; Zhang, M.; Yan, H.; Lin, Z.; Zhu, X. Structural, electronic and mechanical properties of Imma-carbon. Europhys. Lett. 2014, 107, 27007. [Google Scholar] [CrossRef]
- Marmiera, A.; Lethbridge, Z.A.D.; Walton, R.I.; Smith, C.W.; Parker, S.C.; Evans, K.E. ElAM: A computer program for the analysis and representation of anisotropic elastic properties. Comput. Phys. Commun. 2010, 181, 2102–2115. [Google Scholar] [CrossRef] [Green Version]
- Perdew, J.P.; Burke, K.; Ernzerhof, M. Generalized Gradient Approximation Made Simple. Phys. Rev. Lett. 1996, 77, 3865–3868. [Google Scholar] [CrossRef] [PubMed]
- Clark, S.J.; Segall, M.D.; Pickard, C.J.; Hasnip, P.J.; Probert, M.I.J.; Refson, K.; Payne, M.C. First principles methods using CASTEP. Z. Kristallogr. 2005, 220, 567–570. [Google Scholar] [CrossRef] [Green Version]
- Hohenberg, P.; Kohn, W. Inhomogeneous Electron Gas. Phys. Rev. 1964, 136, B864–B871. [Google Scholar] [CrossRef]
- Kohn, W.; Sham, L.J. Self-Consistent Equations Including Exchange and Correlation Effects. Phys. Rev. 1965, 140, A1133–A1138. [Google Scholar] [CrossRef]
- Vanderbilt, D. Soft self-consistent pseudopotentials in a generalized eigenvalue formalism. Phys. Rev. B 1990, 41, 7892–7895. [Google Scholar] [CrossRef]
- Monkhorst, H.J.; Pack, J.D. Special points for Brillouin-zone integrations. Phys. Rev. B 1976, 13, 5188–5192. [Google Scholar] [CrossRef]
- Pfrommer, B.G.; Côté, M.; Louie, S.G.; Cohen, M.L. Relaxation of Crystals with the Quasi-Newton Method. J. Comput. Phys. 1997, 131, 233–240. [Google Scholar] [CrossRef]
Figure 1.
Crystal structures of Ca2C. (a) Pnma-Ca2C; (b) C2/m-Ca2C. The black and blue spheres represent C and Ca atoms, respectively.
Figure 1.
Crystal structures of Ca2C. (a) Pnma-Ca2C; (b) C2/m-Ca2C. The black and blue spheres represent C and Ca atoms, respectively.

Figure 2.
Enthalpy (a) and volume (b) as a function of pressure. The black and red solid lines represent Pnma-Ca2C and C2/m-Ca2C, respectively.
Figure 2.
Enthalpy (a) and volume (b) as a function of pressure. The black and red solid lines represent Pnma-Ca2C and C2/m-Ca2C, respectively.
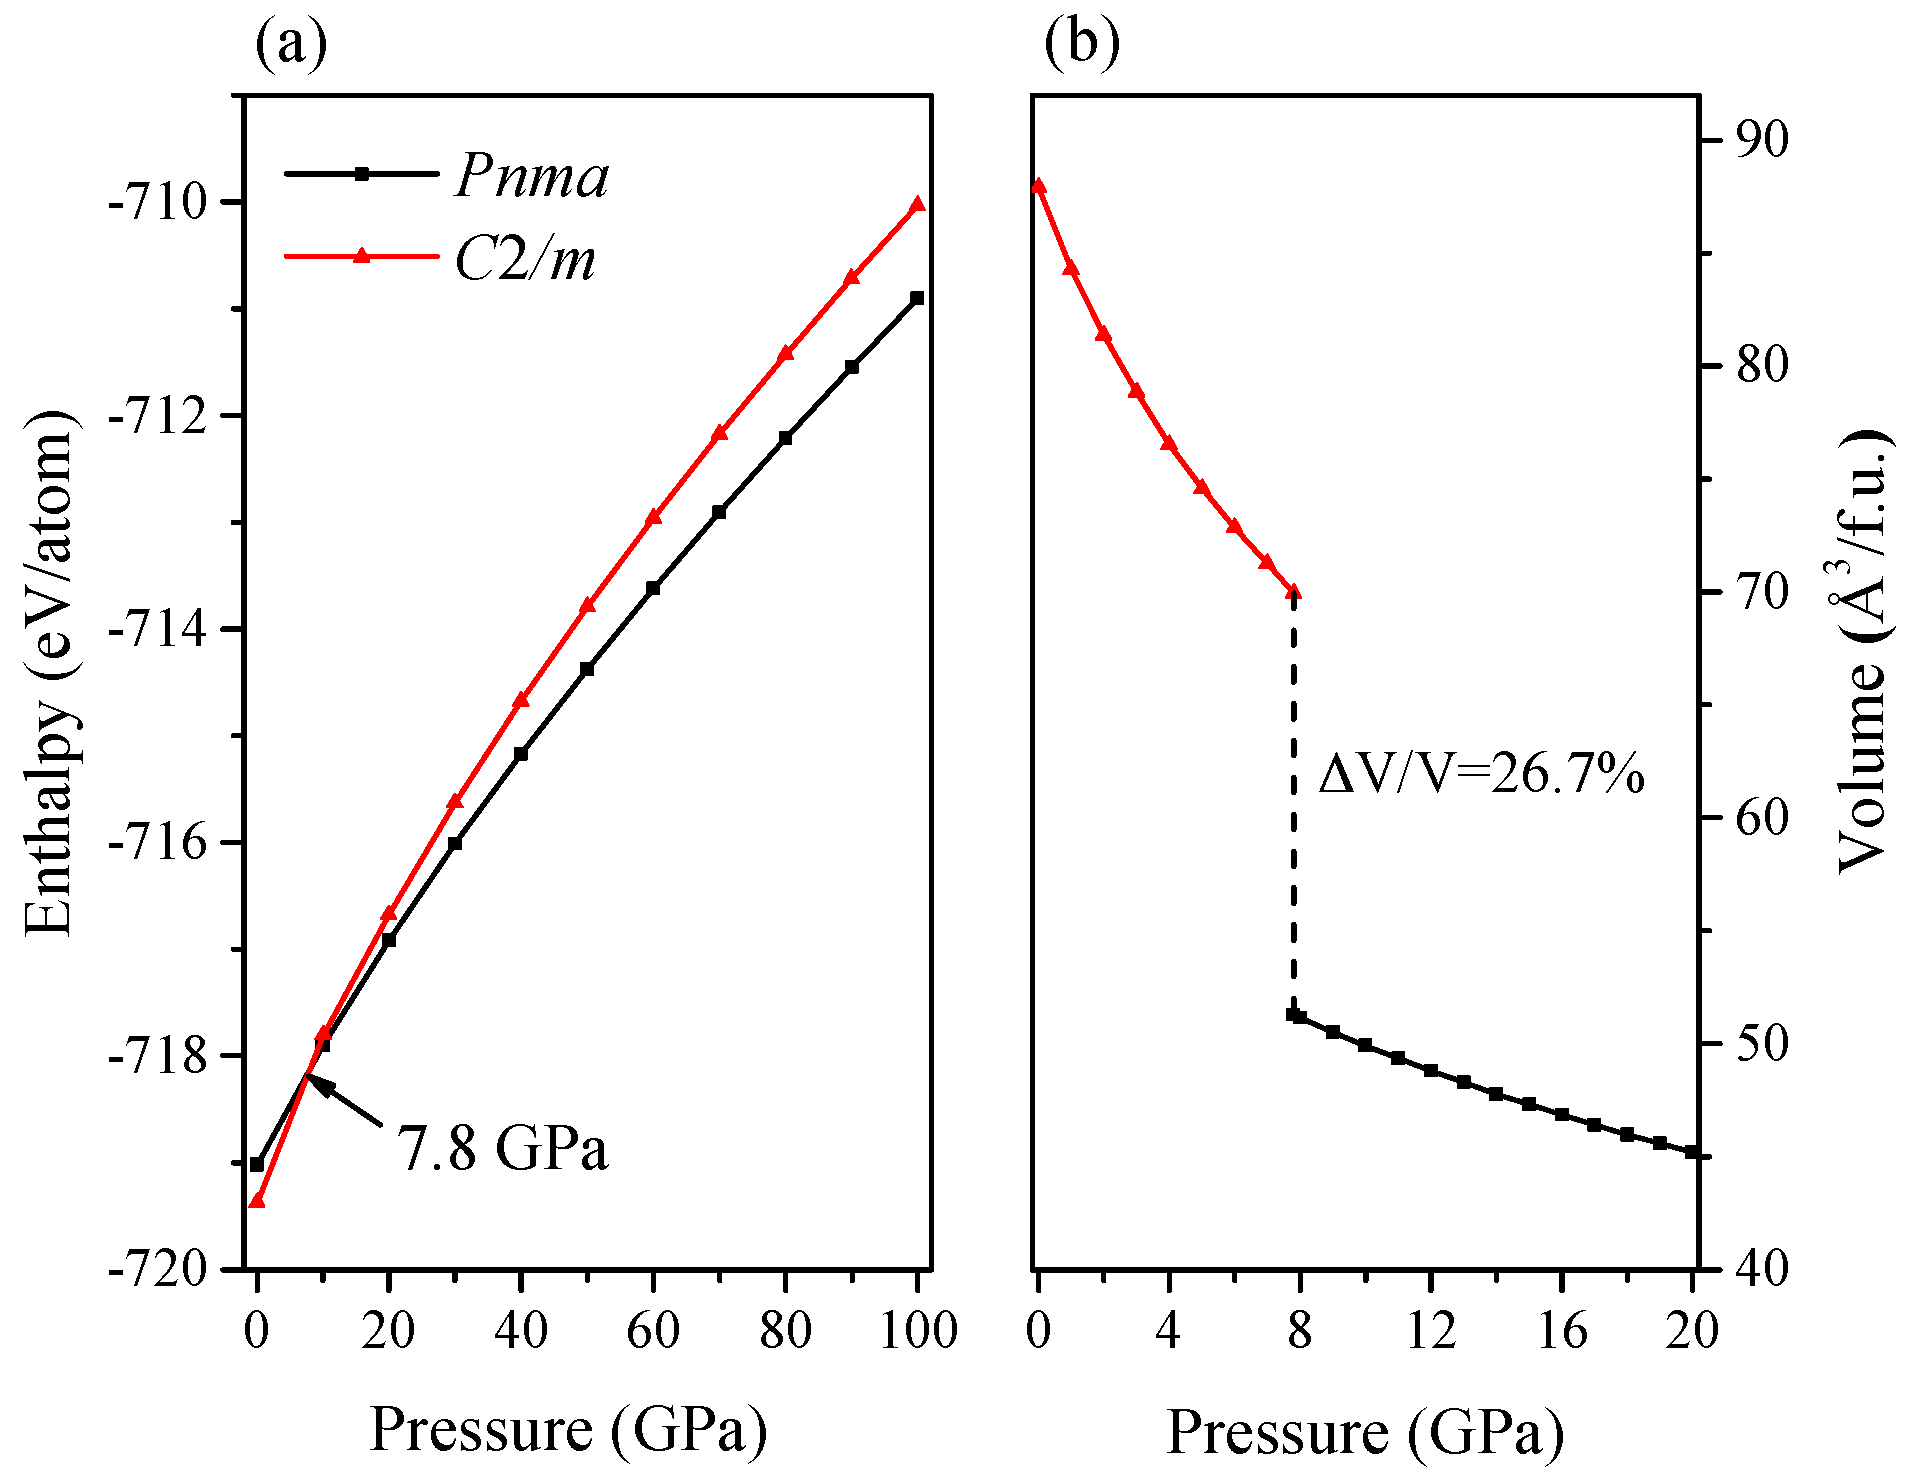
Figure 3.
Lattice parameters X/X0 as a function of pressure. (a) Pnma-Ca2C; (b) C2/m-Ca2C.

Figure 4.
Calculated of C2/m-Ca2C under different pressures.

Figure 5.
Phonon spectra for (a) Pnma-Ca2C at 0 GPa; (b) Pnma-Ca2C at 100 GPa; (c) C2/m-Ca2C at 0 GPa; (d) C2/m-Ca2C at 6.4 GPa.
Figure 5.
Phonon spectra for (a) Pnma-Ca2C at 0 GPa; (b) Pnma-Ca2C at 100 GPa; (c) C2/m-Ca2C at 0 GPa; (d) C2/m-Ca2C at 6.4 GPa.

Figure 6.
Elastic constants as a function of pressure. (a) Pnma-Ca2C; (b) C2/m-Ca2C.
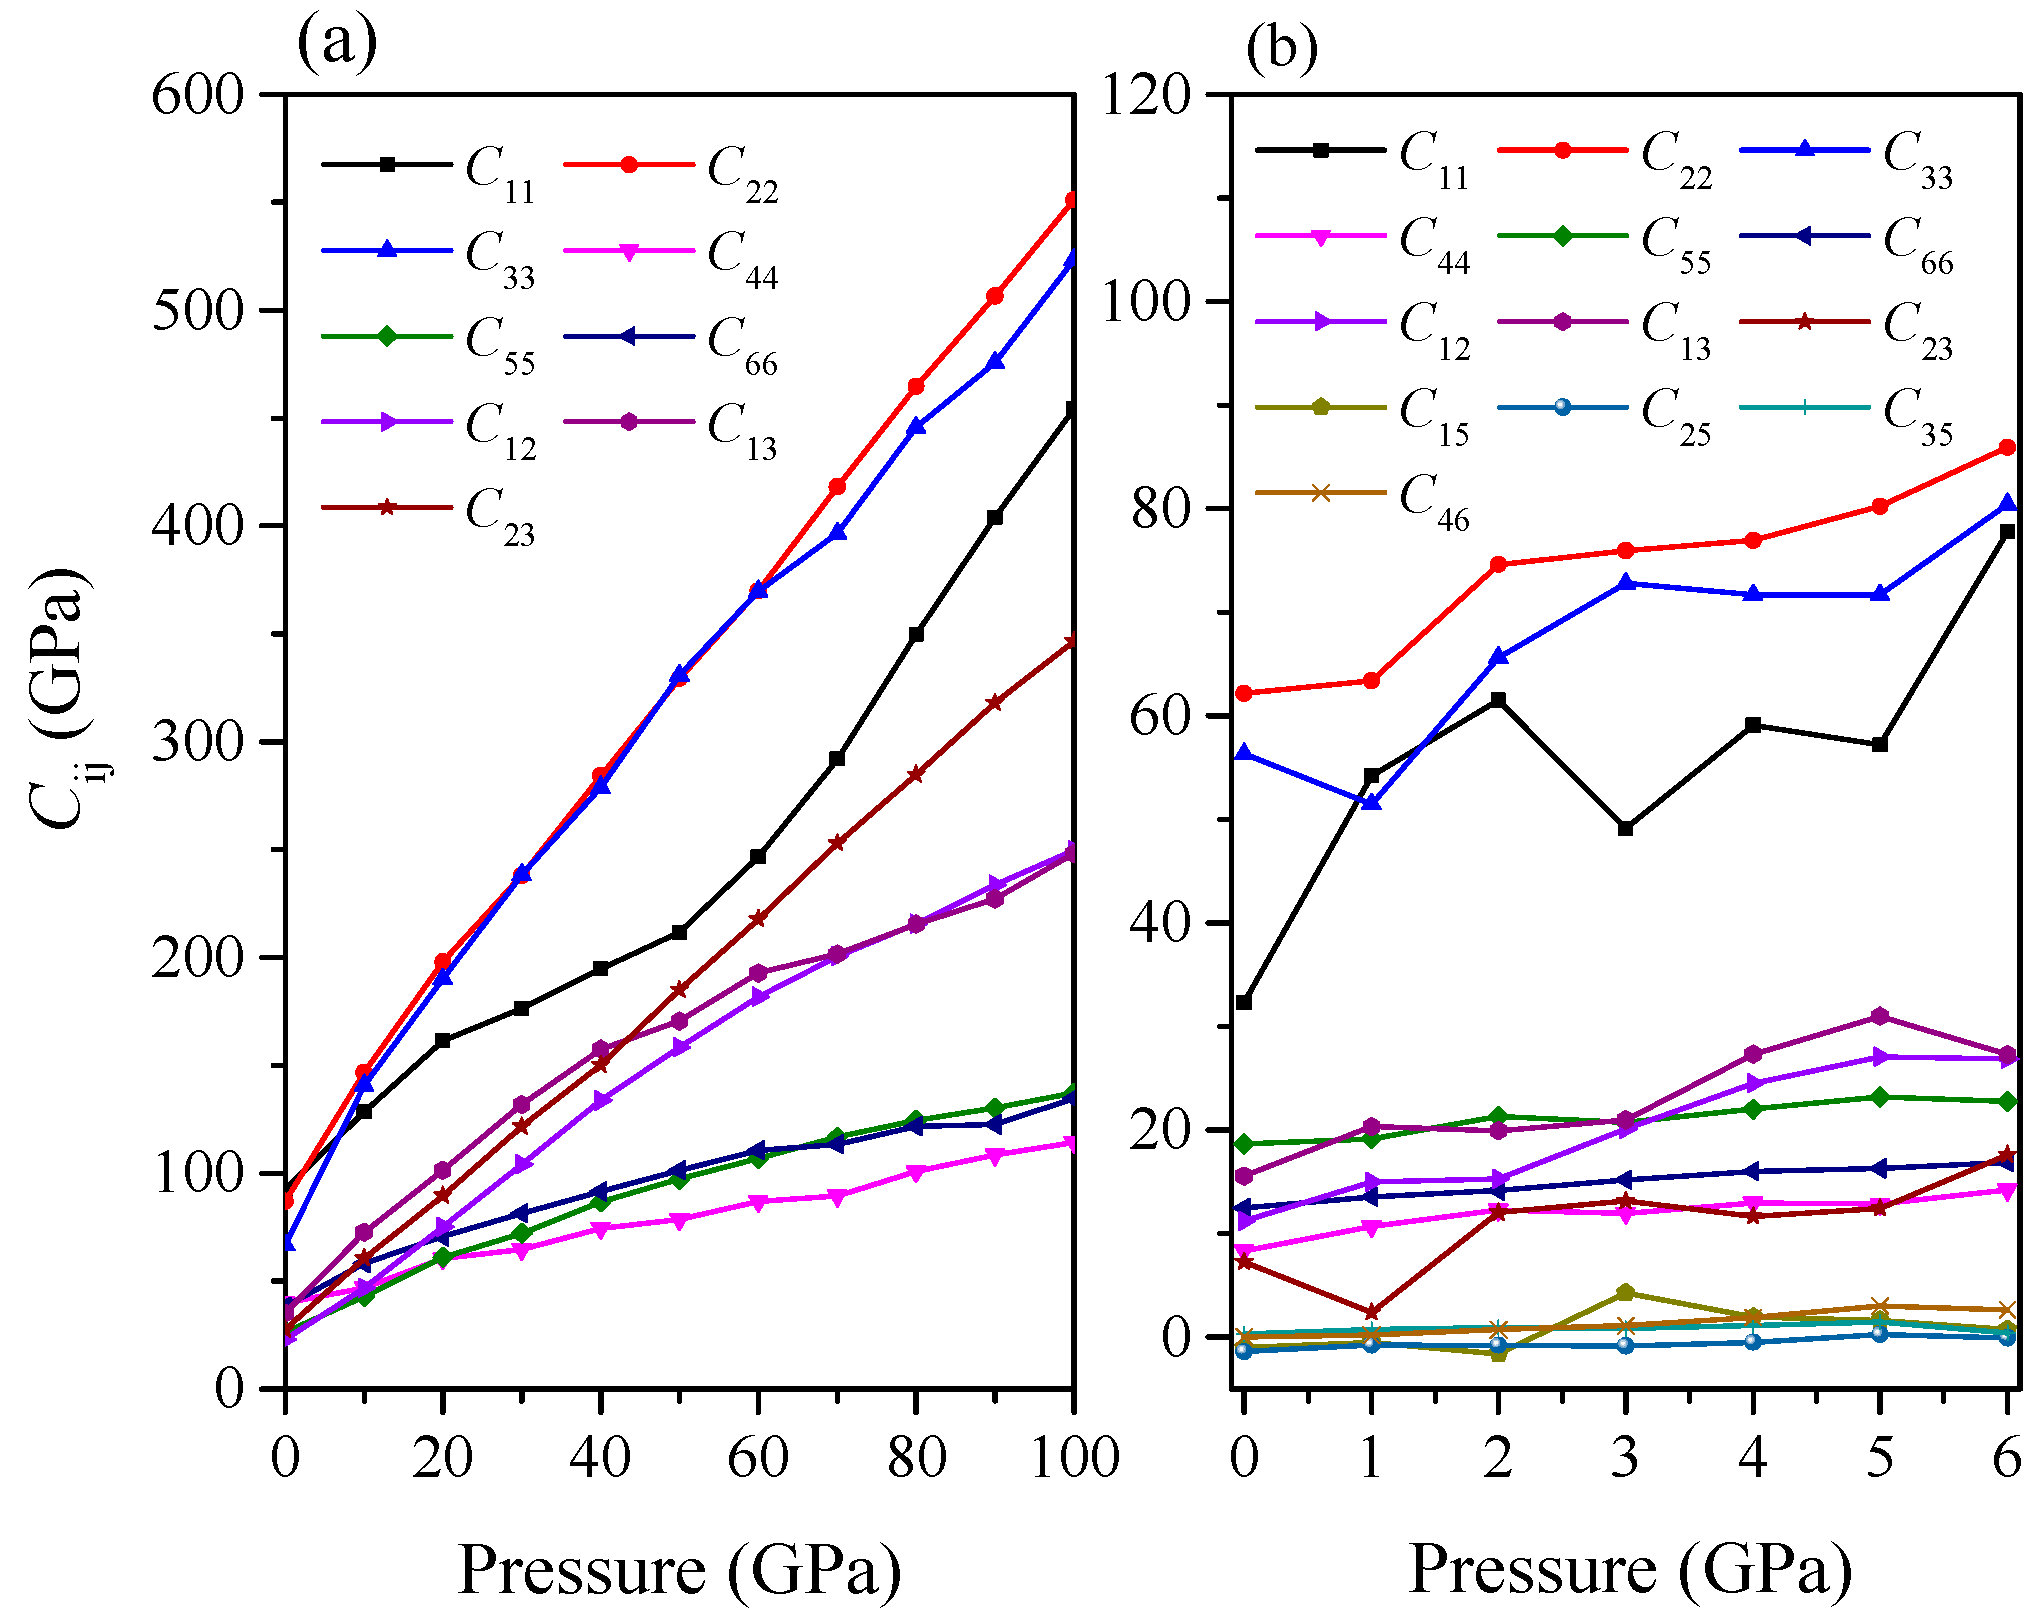
Figure 7.
2D representations of the Young’s modulus. (a) Pnma-Ca2C at 0 GPa; (b) Pnma-Ca2C at 100 GPa; (c) C2/m-Ca2C at 0 and 6 GPa; (d) C2/m-Ca2C at 6 GPa. The black, red and green lines represent the xy, xz and yz planes, respectively.
Figure 7.
2D representations of the Young’s modulus. (a) Pnma-Ca2C at 0 GPa; (b) Pnma-Ca2C at 100 GPa; (c) C2/m-Ca2C at 0 and 6 GPa; (d) C2/m-Ca2C at 6 GPa. The black, red and green lines represent the xy, xz and yz planes, respectively.

Figure 8.
2D representations of Poisson’s ratio. (a) Pnma-Ca2C at 0 GPa; (b) Pnma-Ca2C at 100 GPa; (c) C2/m-Ca2C at 0 GPa; (d) C2/m-Ca2C at 6 GPa. The solid and dash lines represent the maximal and minimal positive values, respectively. The black, red and green lines represent the xy, xz and yz planes, respectively.

Figure 9.
2D representations of shear modulus. (a) Pnma-Ca2C at 0 GPa; (b) Pnma-Ca2C at 100 GPa; (c) C2/m-Ca2C at 0 GPa; (d) C2/m-Ca2C at 6 GPa. The solid and dash lines represent the maximal and minimal positive values, respectively. The black, red and green lines represent the xy, xz and yz planes, respectively.

Figure 10.
Electronic band structure and density of state of Pnma-Ca2C (a) and C2/m-Ca2C (b) at 0 GPa.
Figure 10.
Electronic band structure and density of state of Pnma-Ca2C (a) and C2/m-Ca2C (b) at 0 GPa.


| Phase | Ionic Radius (Å) | Charge Transfers (e) | |
|---|---|---|---|
| C | Ca | Ca → C | |
| C2/m | 1.534 | 1.871 | 0.928 |
| Pnma | 1.788 | 1.485 | 2.348 |
| Phase | Pressure (GPa) | a (Å) | b (Å) | c (Å) | β (deg) | V (Å3) | |||||
|---|---|---|---|---|---|---|---|---|---|---|---|
| Pnma | 0 | 6.677 | 6.689 a | 4.384 | 4.389 a | 7.979 | 7.981 a | 233.58 | 234.32 a | ||
| 10 | 6.404 | 6.415 a | 4.150 | 4.154 a | 7.513 | 7.518 a | 199.68 | 200.35 a | |||
| 6.449 b | 4.157 b | 7.523 b | 201.7 b | ||||||||
| 30 | 5.919 | 5.929 a | 3.931 | 3.933 a | 7.195 | 7.204 a | 167.41 | 168.04 a | |||
| C2/m | 0 | 7.166 | 3.775 | 15.490 | 122.9 | 351.59 | |||||
| 5 | 6.743 | 6.701 a | 3.594 | 3.587 a | 14.65 | 14.68 a | 122.8 | 122 a | 298.32 | ||
| 6.4 | 6.674 | 3.554 | 14.45 | 122.6 | 288.87 | ||||||
Table 3.
Calculated elastic constants Cij (GPa), bulk modulus B (GPa), shear modulus G (GPa), Young’s modulus E (GPa), Poisson’s ratio υ, and B/G ratio of Ca2C at various pressures.
| Pressure (GPa) | Pnma-Ca2C | C2/m-Ca2C | ||||
|---|---|---|---|---|---|---|
| 0 | 50 | 100 | 0 | 6 | 6.4 | |
| C11 | 92 | 212 | 454 | 32 | 78 | 71 |
| C22 | 87 | 329 | 551 | 62 | 86 | 84 |
| C33 | 67 | 331 | 523 | 56 | 80 | 86 |
| C44 | 40 | 79 | 114 | 8 | 13 | 14 |
| C55 | 26 | 97 | 137 | 19 | 23 | 20 |
| C66 | 38 | 101 | 135 | 13 | 17 | 15 |
| C12 | 23 | 158 | 250 | 11 | 26 | 28 |
| C13 | 35 | 170 | 248 | 16 | 27 | 29 |
| C23 | 27 | 185 | 347 | 7 | 18 | 23 |
| C15 | −1 | 0.75 | 4 | |||
| C25 | −1.4 | −0.06 | 3 | |||
| C35 | 0.3 | 0.44 | −1.31 | |||
| C46 | 0.04 | 2.65 | 2.67 | |||
| B | 46 | 203 | 353 | 24 | 43 | 45 |
| G | 30 | 75 | 122 | 15 | 21 | 19 |
| E | 74 | 200 | 328 | 37 | 54 | 50 |
| υ | 0.23 | 0.34 | 0.35 | 0.24 | 0.29 | 0.31 |
| B/G | 1.53 | 2.71 | 2.89 | 1.60 | 2.05 | 2.37 |
Table 4.
Calculated universal elastic anisotropy index AU, shear anisotropic factors A1, A2 and A3, and percentage of anisotropy in compressibility and shear AB and AG (in %) of Ca2C.
| Phase | Pressure (GPa) | AU | A1 | A2 | A3 | AB | AG |
|---|---|---|---|---|---|---|---|
| Pnma | 0 | 0.37 | 1.79 | 1.06 | 1.14 | 0.6 | 3.5 |
| 50 | 0.62 | 1.56 | 1.34 | 1.81 | 3.8 | 5.1 | |
| 100 | 0.15 | 0.95 | 1.44 | 1.06 | 1.3 | 1.2 | |
| C2/m | 0 | 0.95 | 0.58 | 0.72 | 0.69 | 2.7 | 8.2 |
| 6 | 0.54 | 0.53 | 0.70 | 0.62 | 0.06 | 5.1 |
© 2016 by the authors; licensee MDPI, Basel, Switzerland. This article is an open access article distributed under the terms and conditions of the Creative Commons Attribution (CC-BY) license (http://creativecommons.org/licenses/by/4.0/).
Share and Cite
MDPI and ACS Style
Wei, Q.; Zhang, Q.; Zhang, M. Crystal Structures and Mechanical Properties of Ca2C at High Pressure. Materials 2016, 9, 570. https://doi.org/10.3390/ma9070570
AMA Style
Wei Q, Zhang Q, Zhang M. Crystal Structures and Mechanical Properties of Ca2C at High Pressure. Materials. 2016; 9(7):570. https://doi.org/10.3390/ma9070570
Chicago/Turabian StyleWei, Qun, Quan Zhang, and Meiguang Zhang. 2016. "Crystal Structures and Mechanical Properties of Ca2C at High Pressure" Materials 9, no. 7: 570. https://doi.org/10.3390/ma9070570
Note that from the first issue of 2016, this journal uses article numbers instead of page numbers. See further details here.