
In Vitro Corrosion Study of Friction Stir Processed WE43 Magnesium Alloy in a Simulated Body Fluid

Abstract
:1. Introduction
2. Results
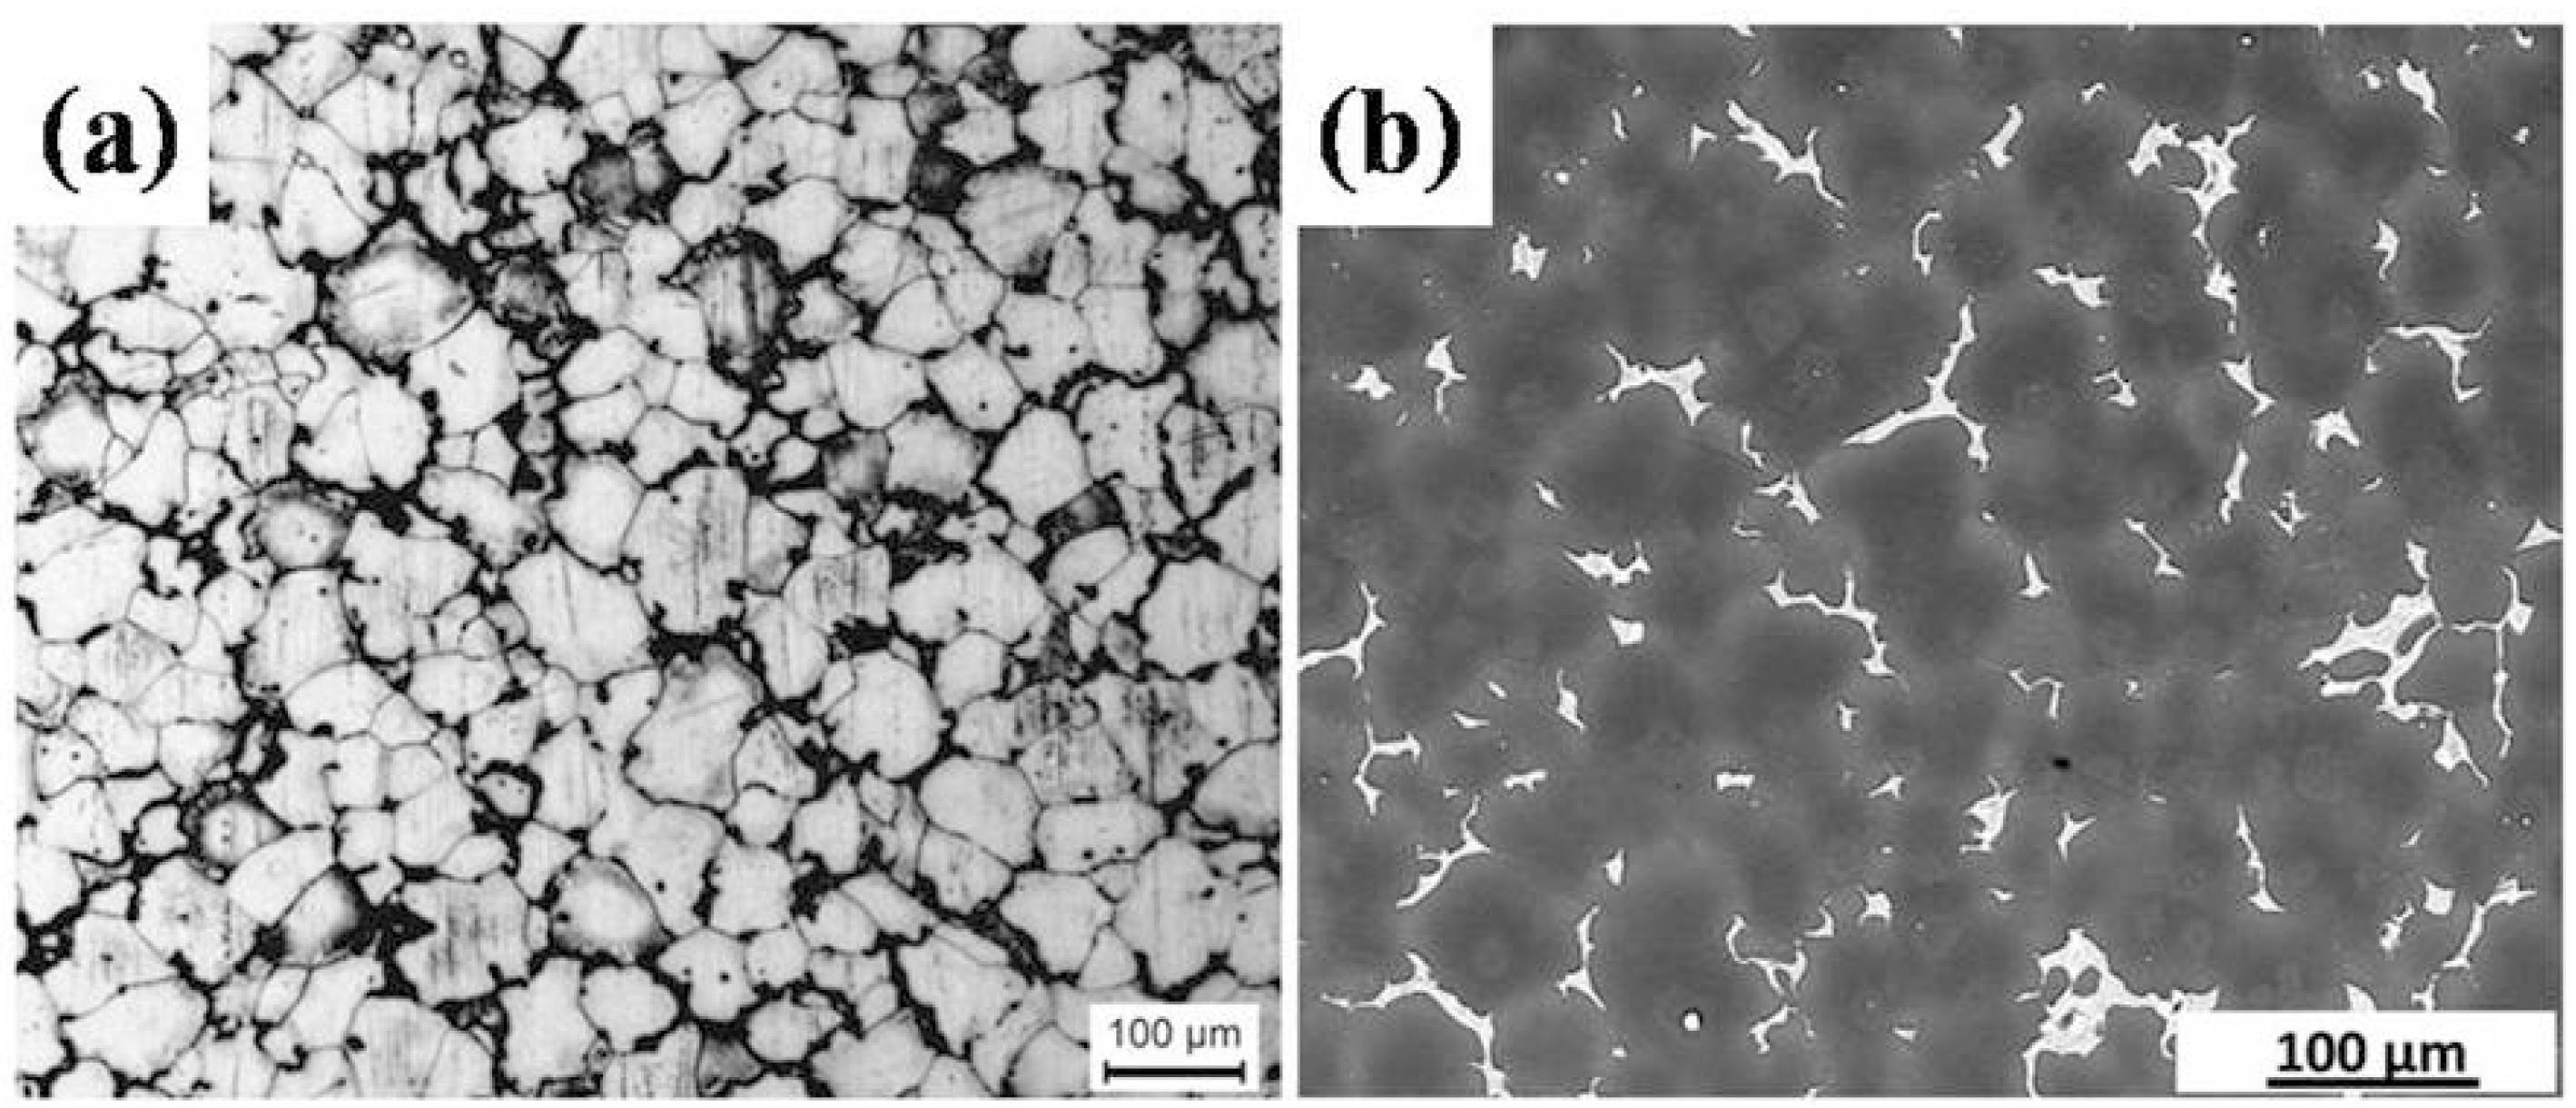
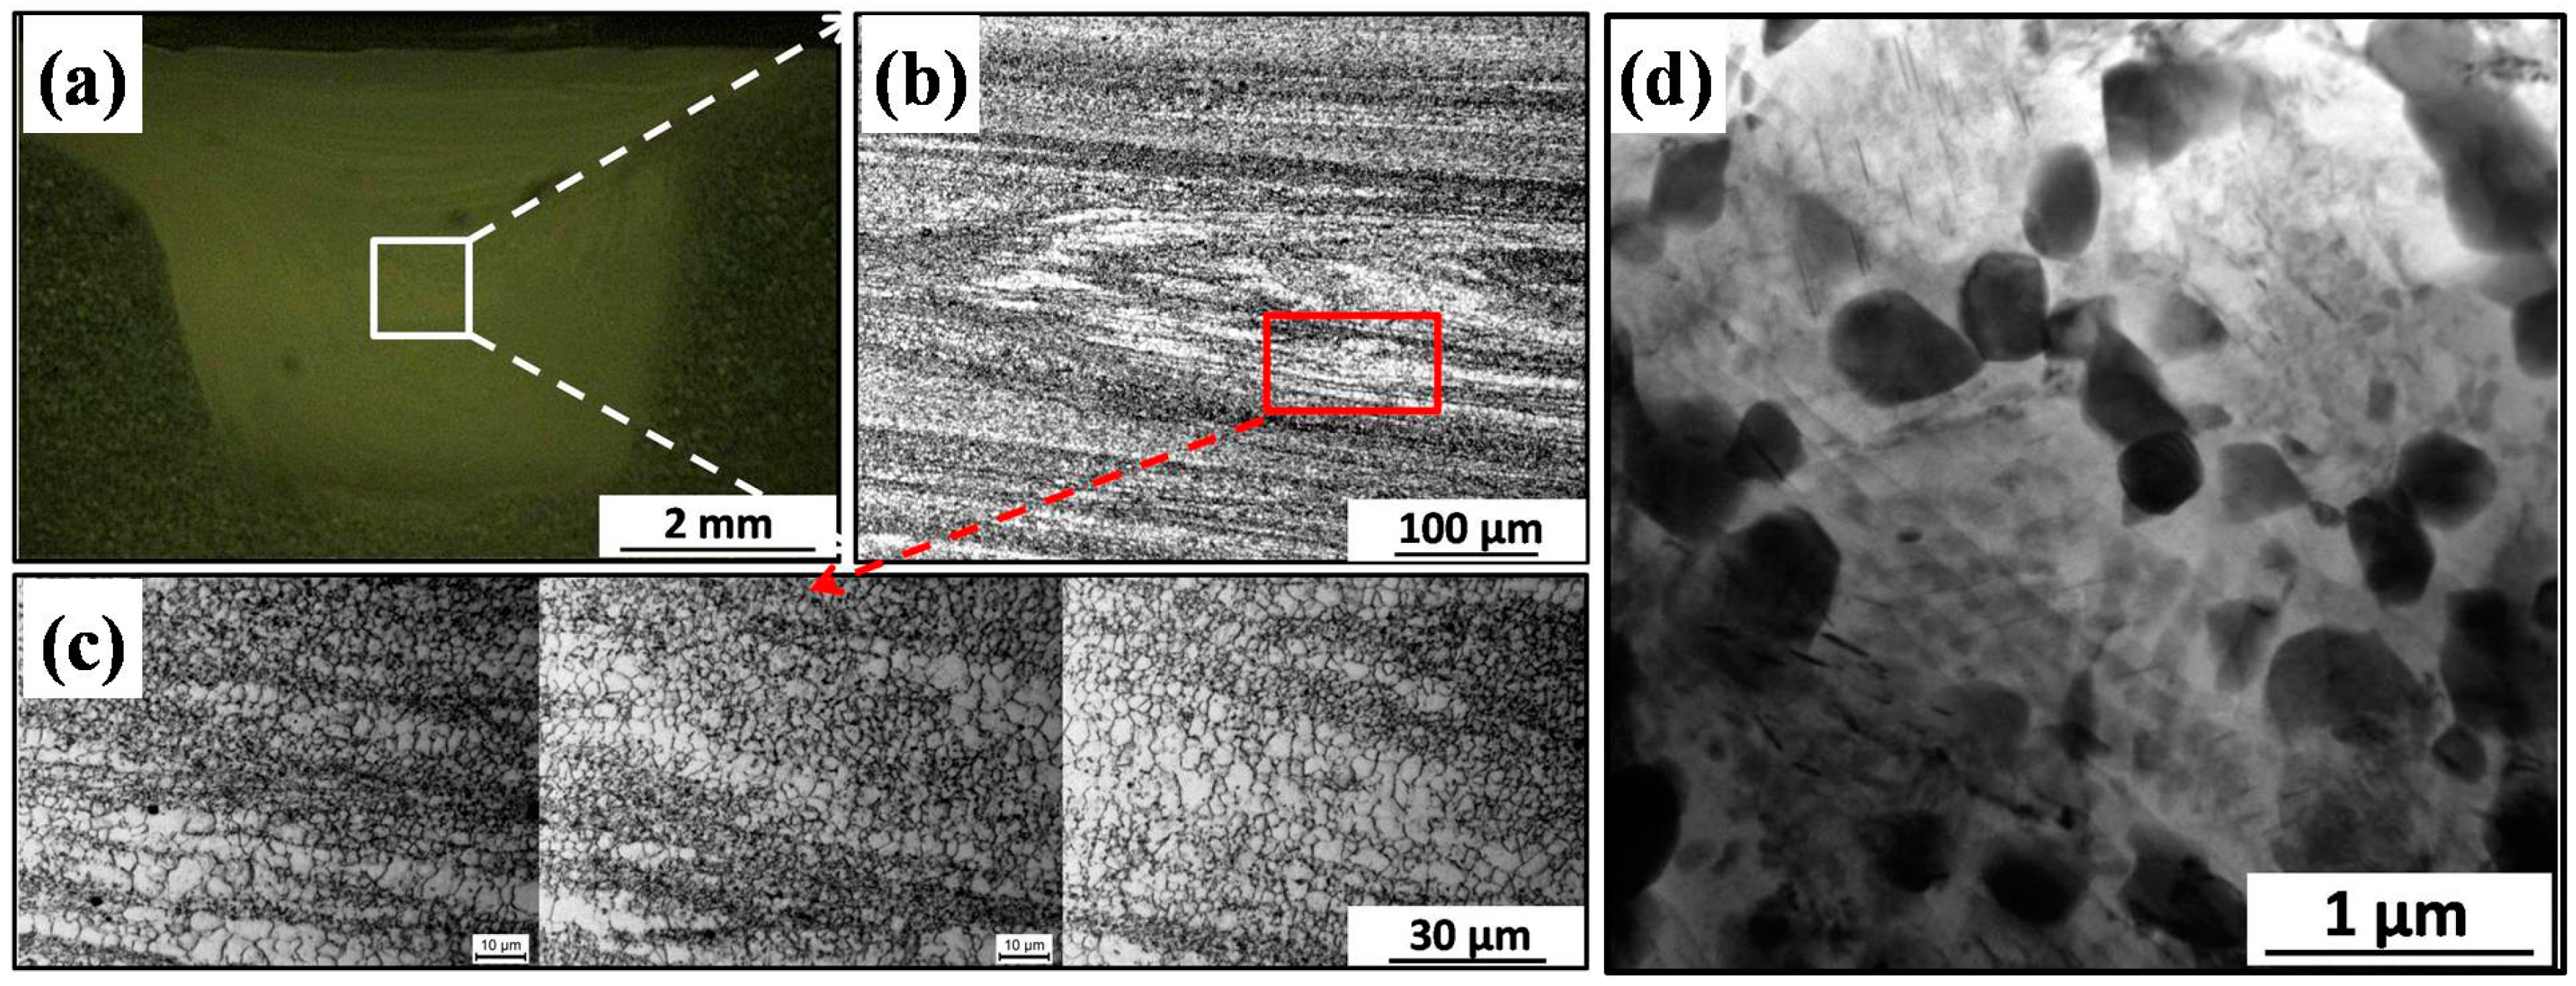
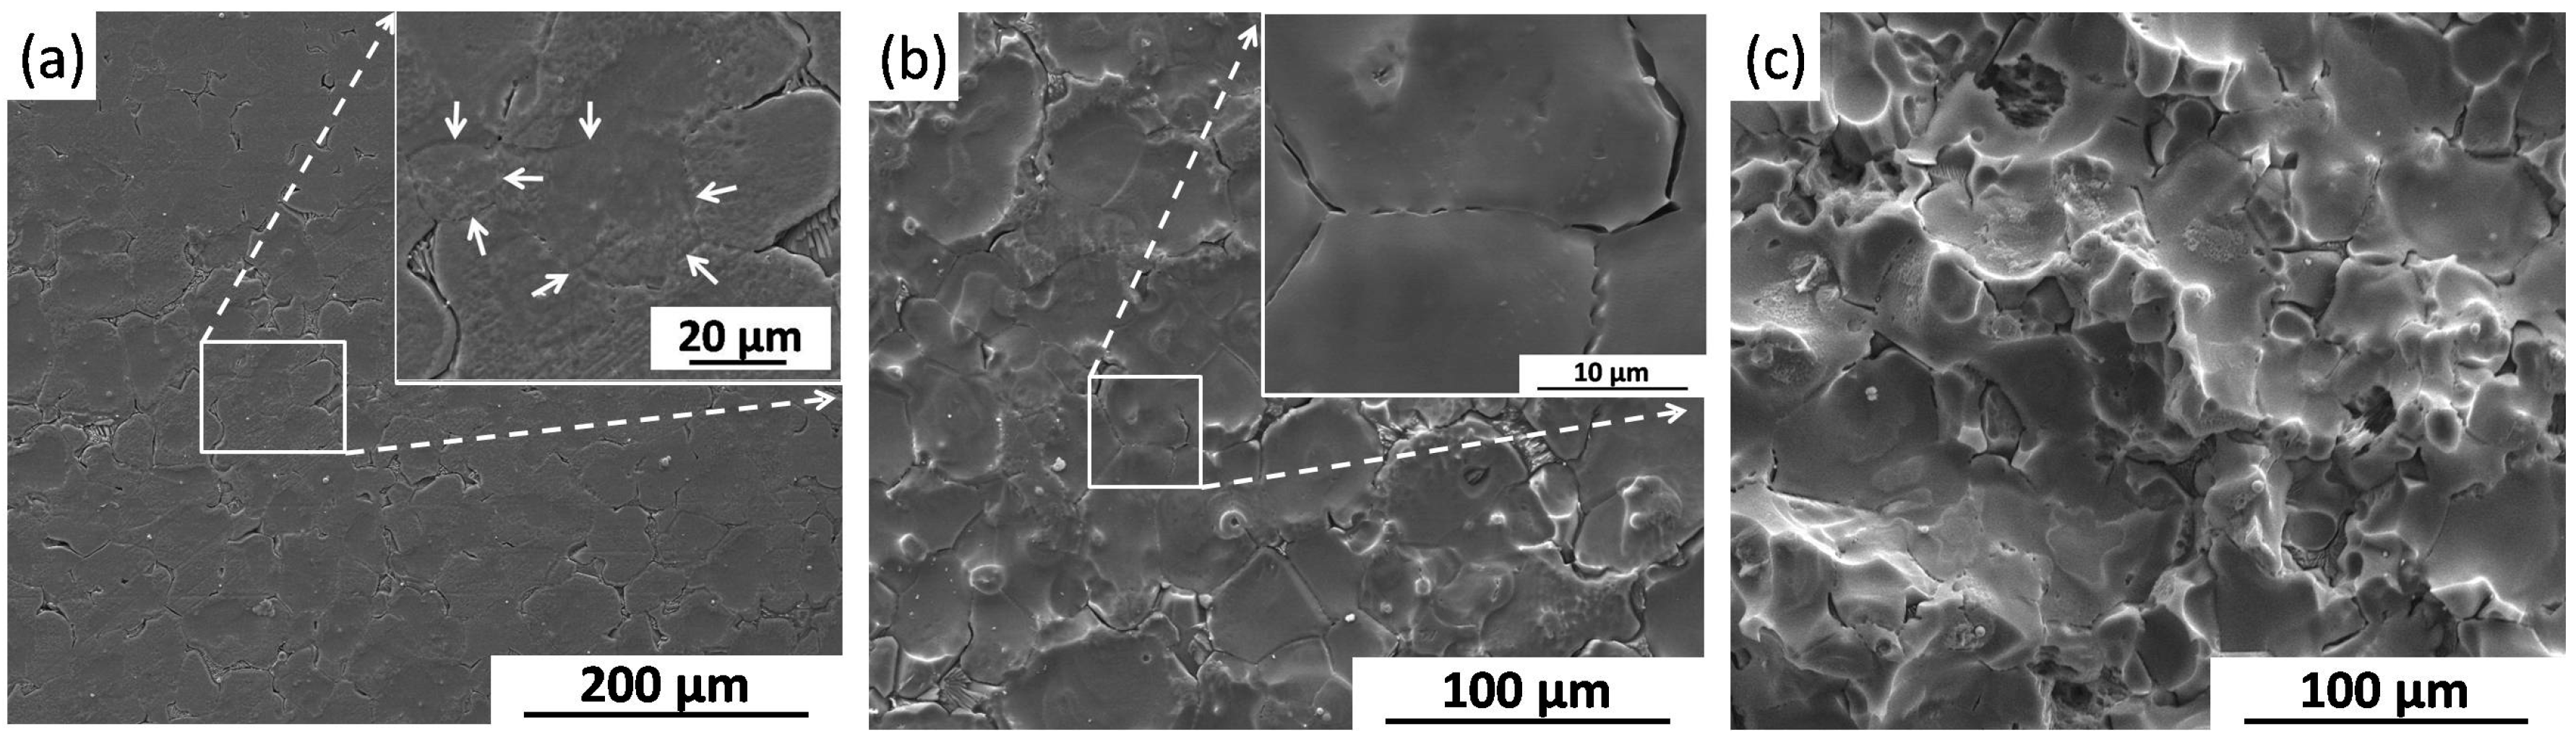
2.1. Microstructure
2.2. Corrosion Behavior
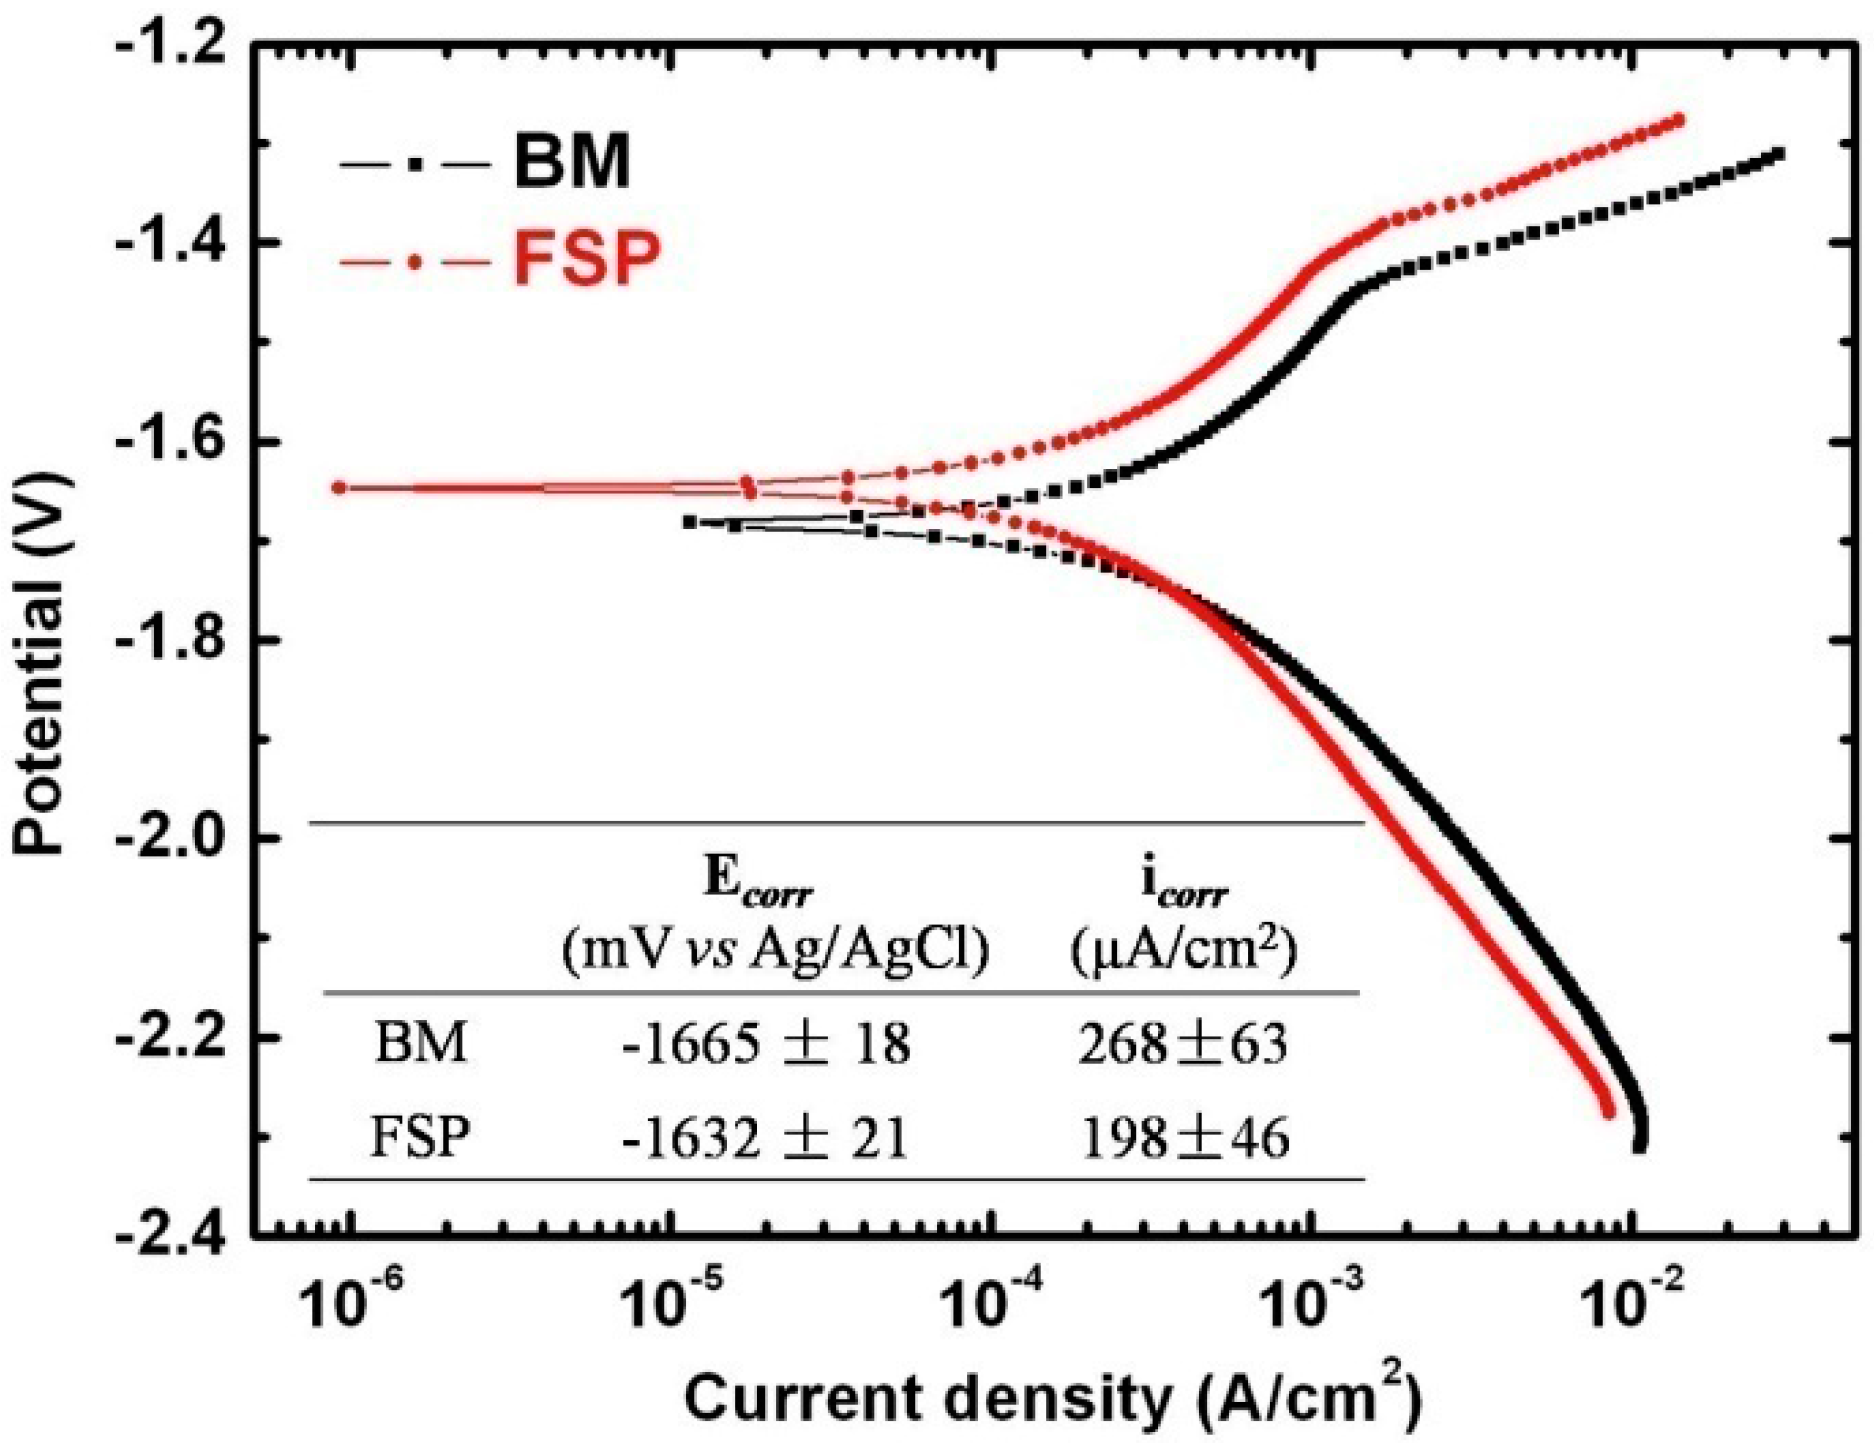
2.2.1. Electrochemical Corrosion Test
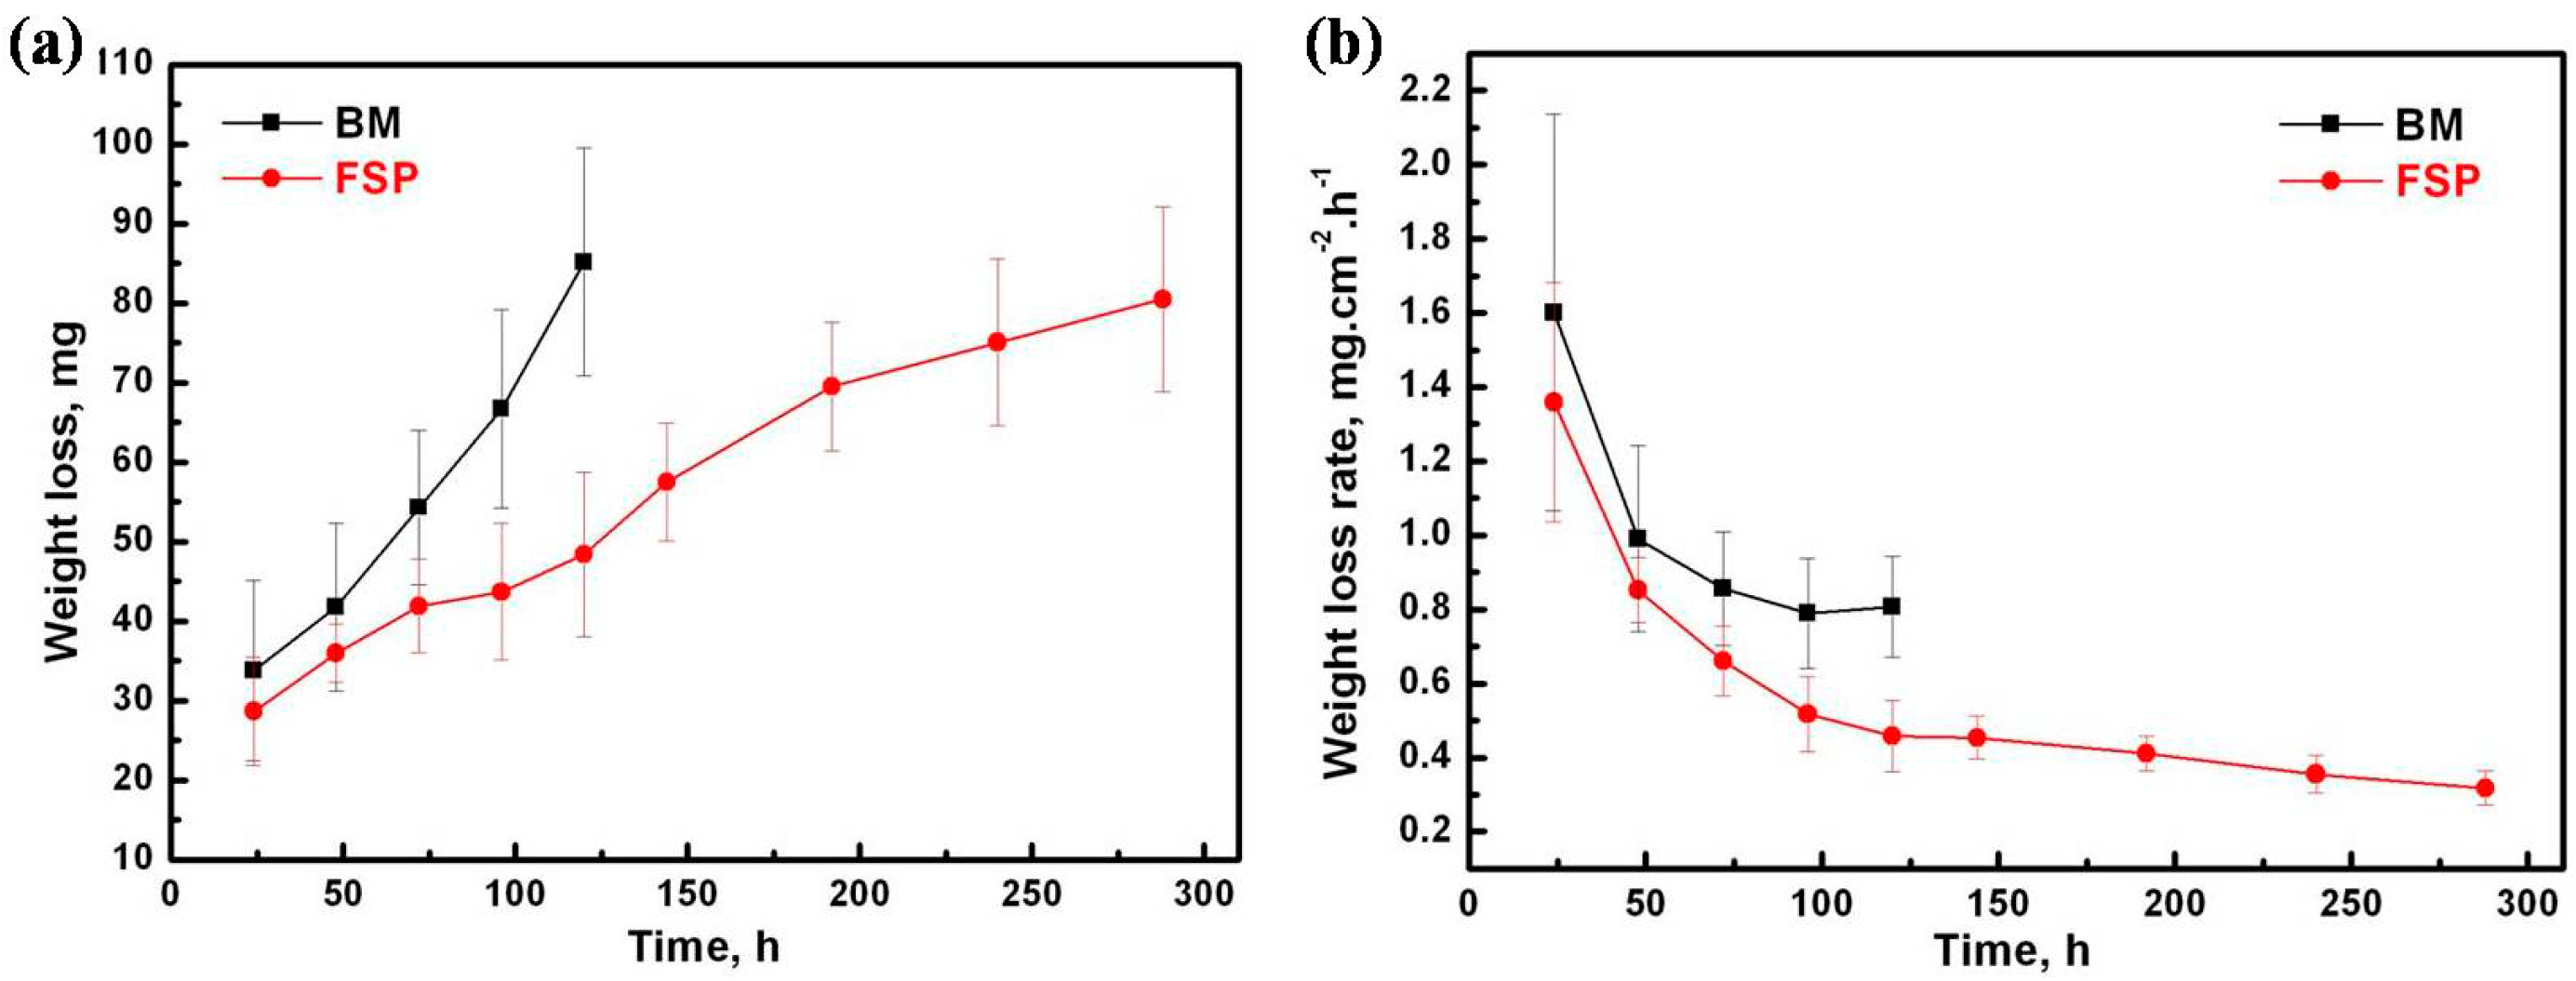
2.2.2. Immersion Corrosion Test
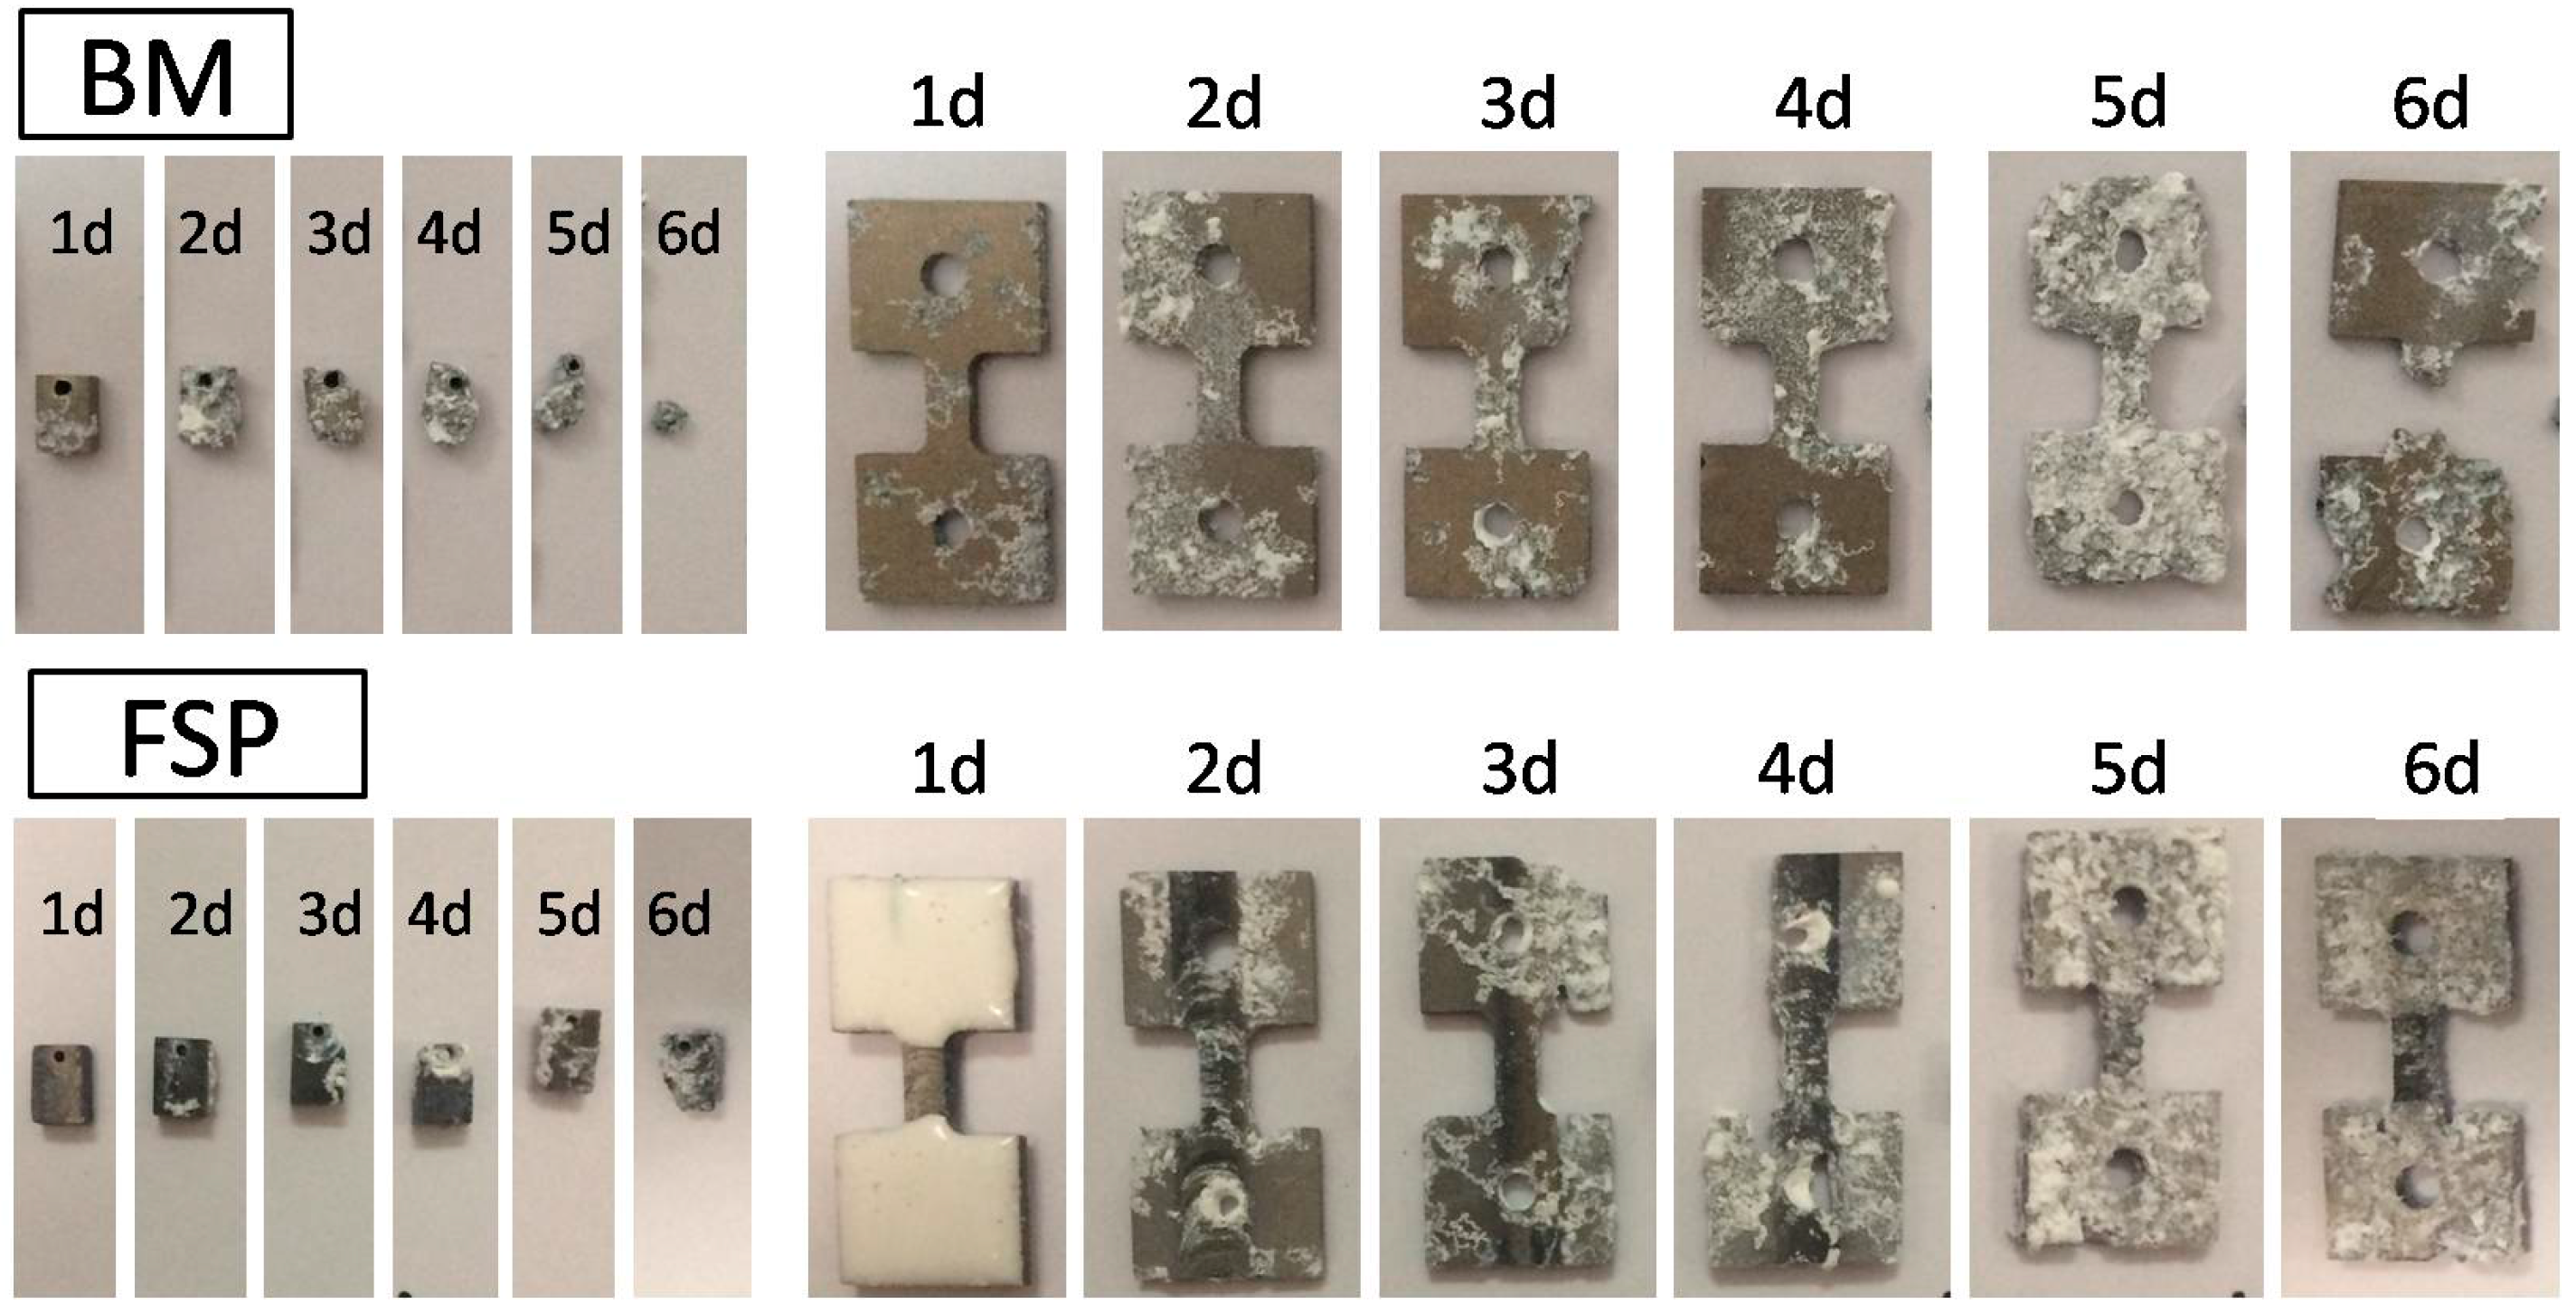
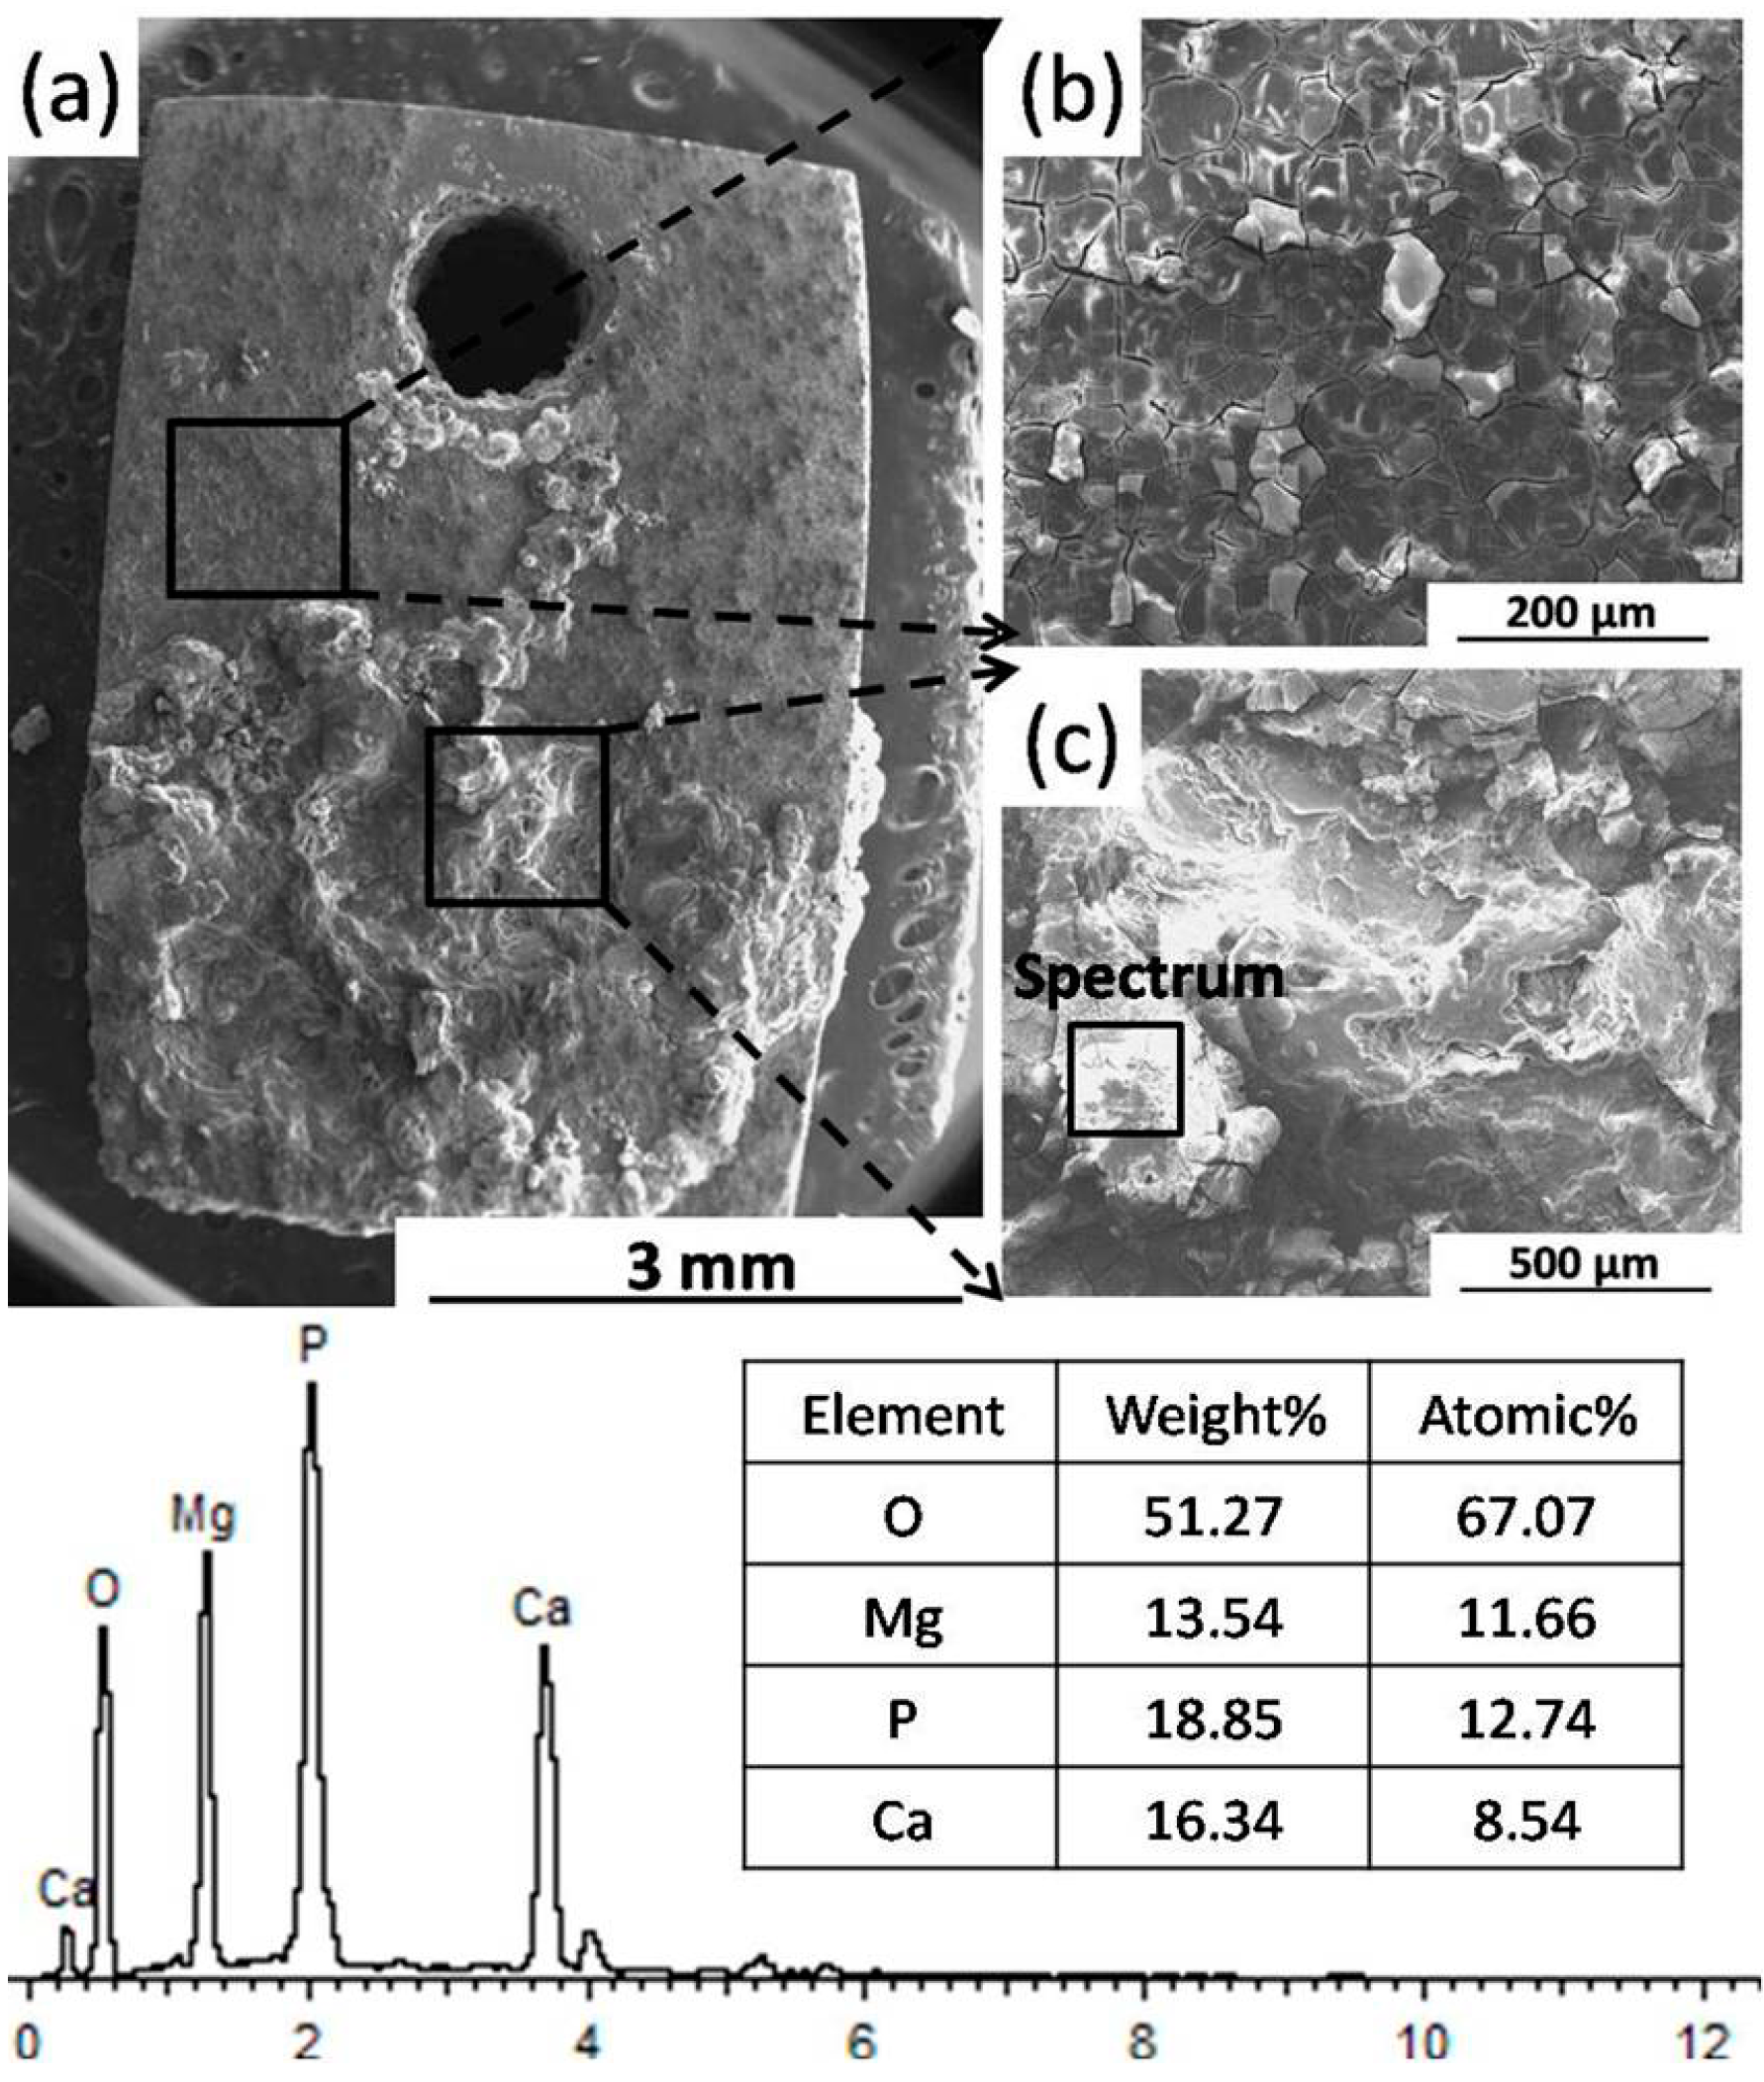
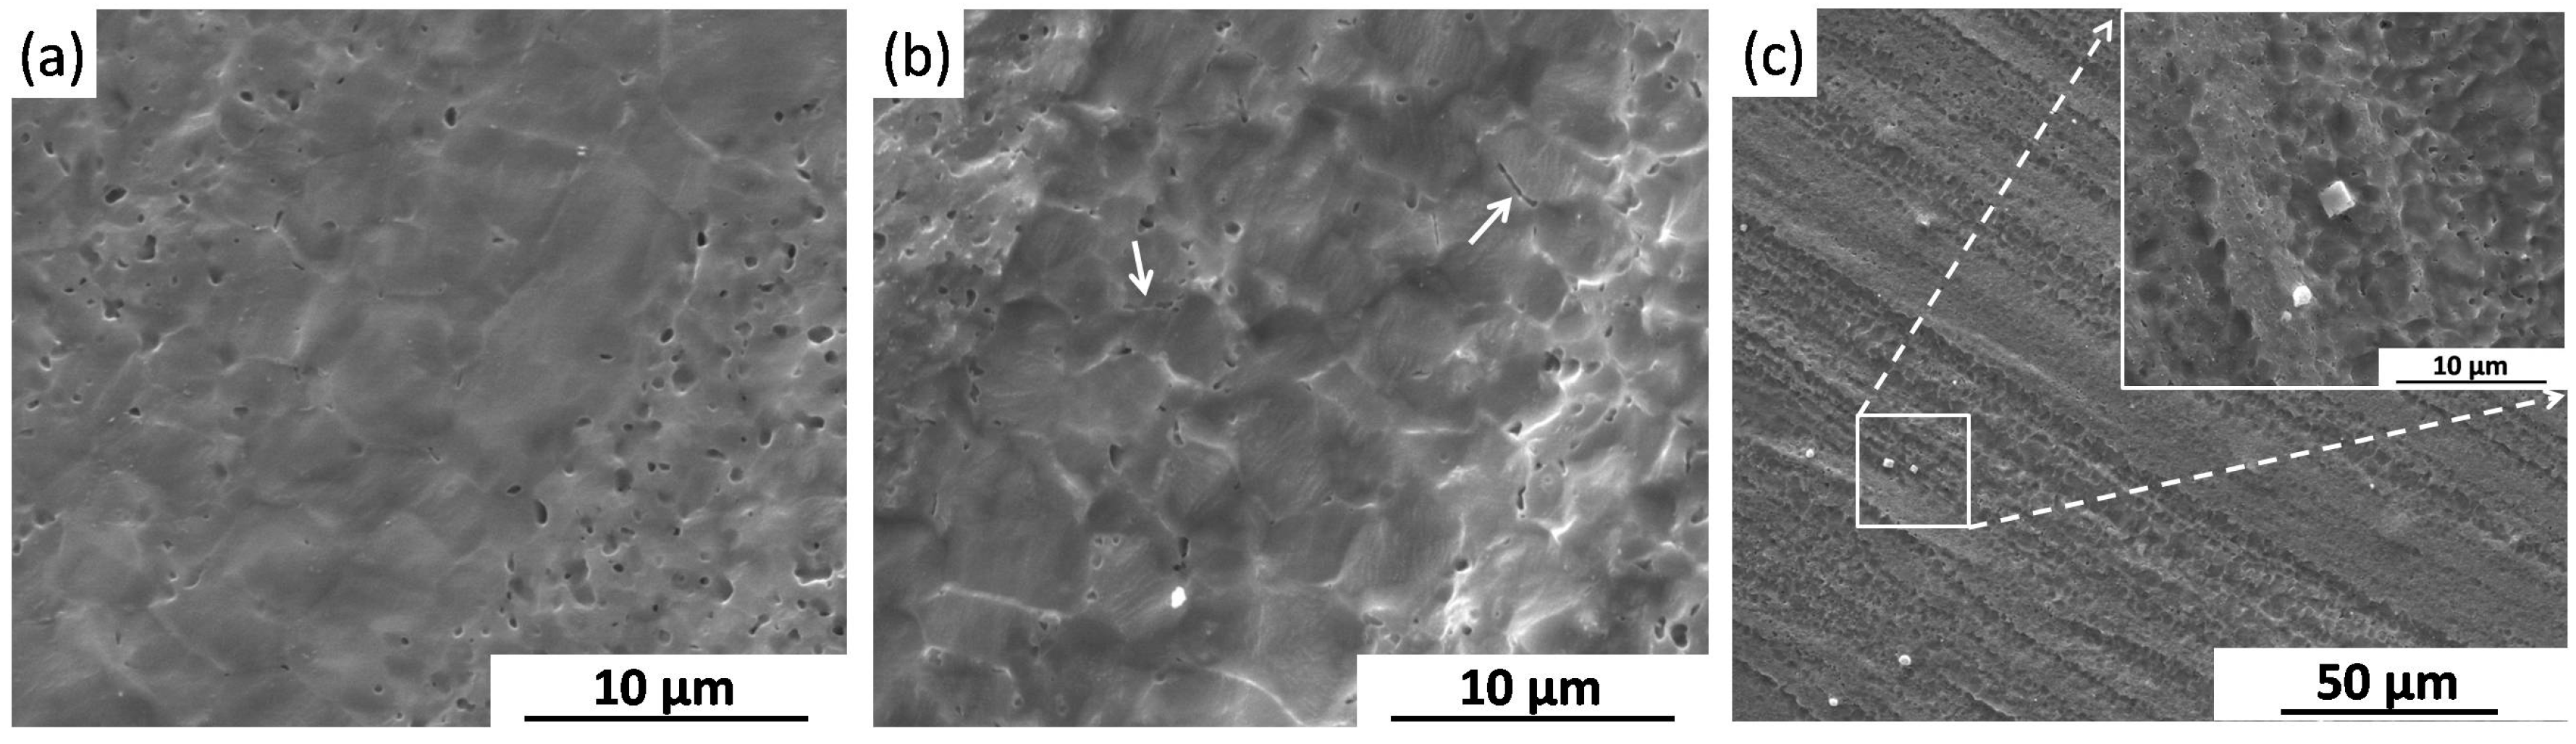
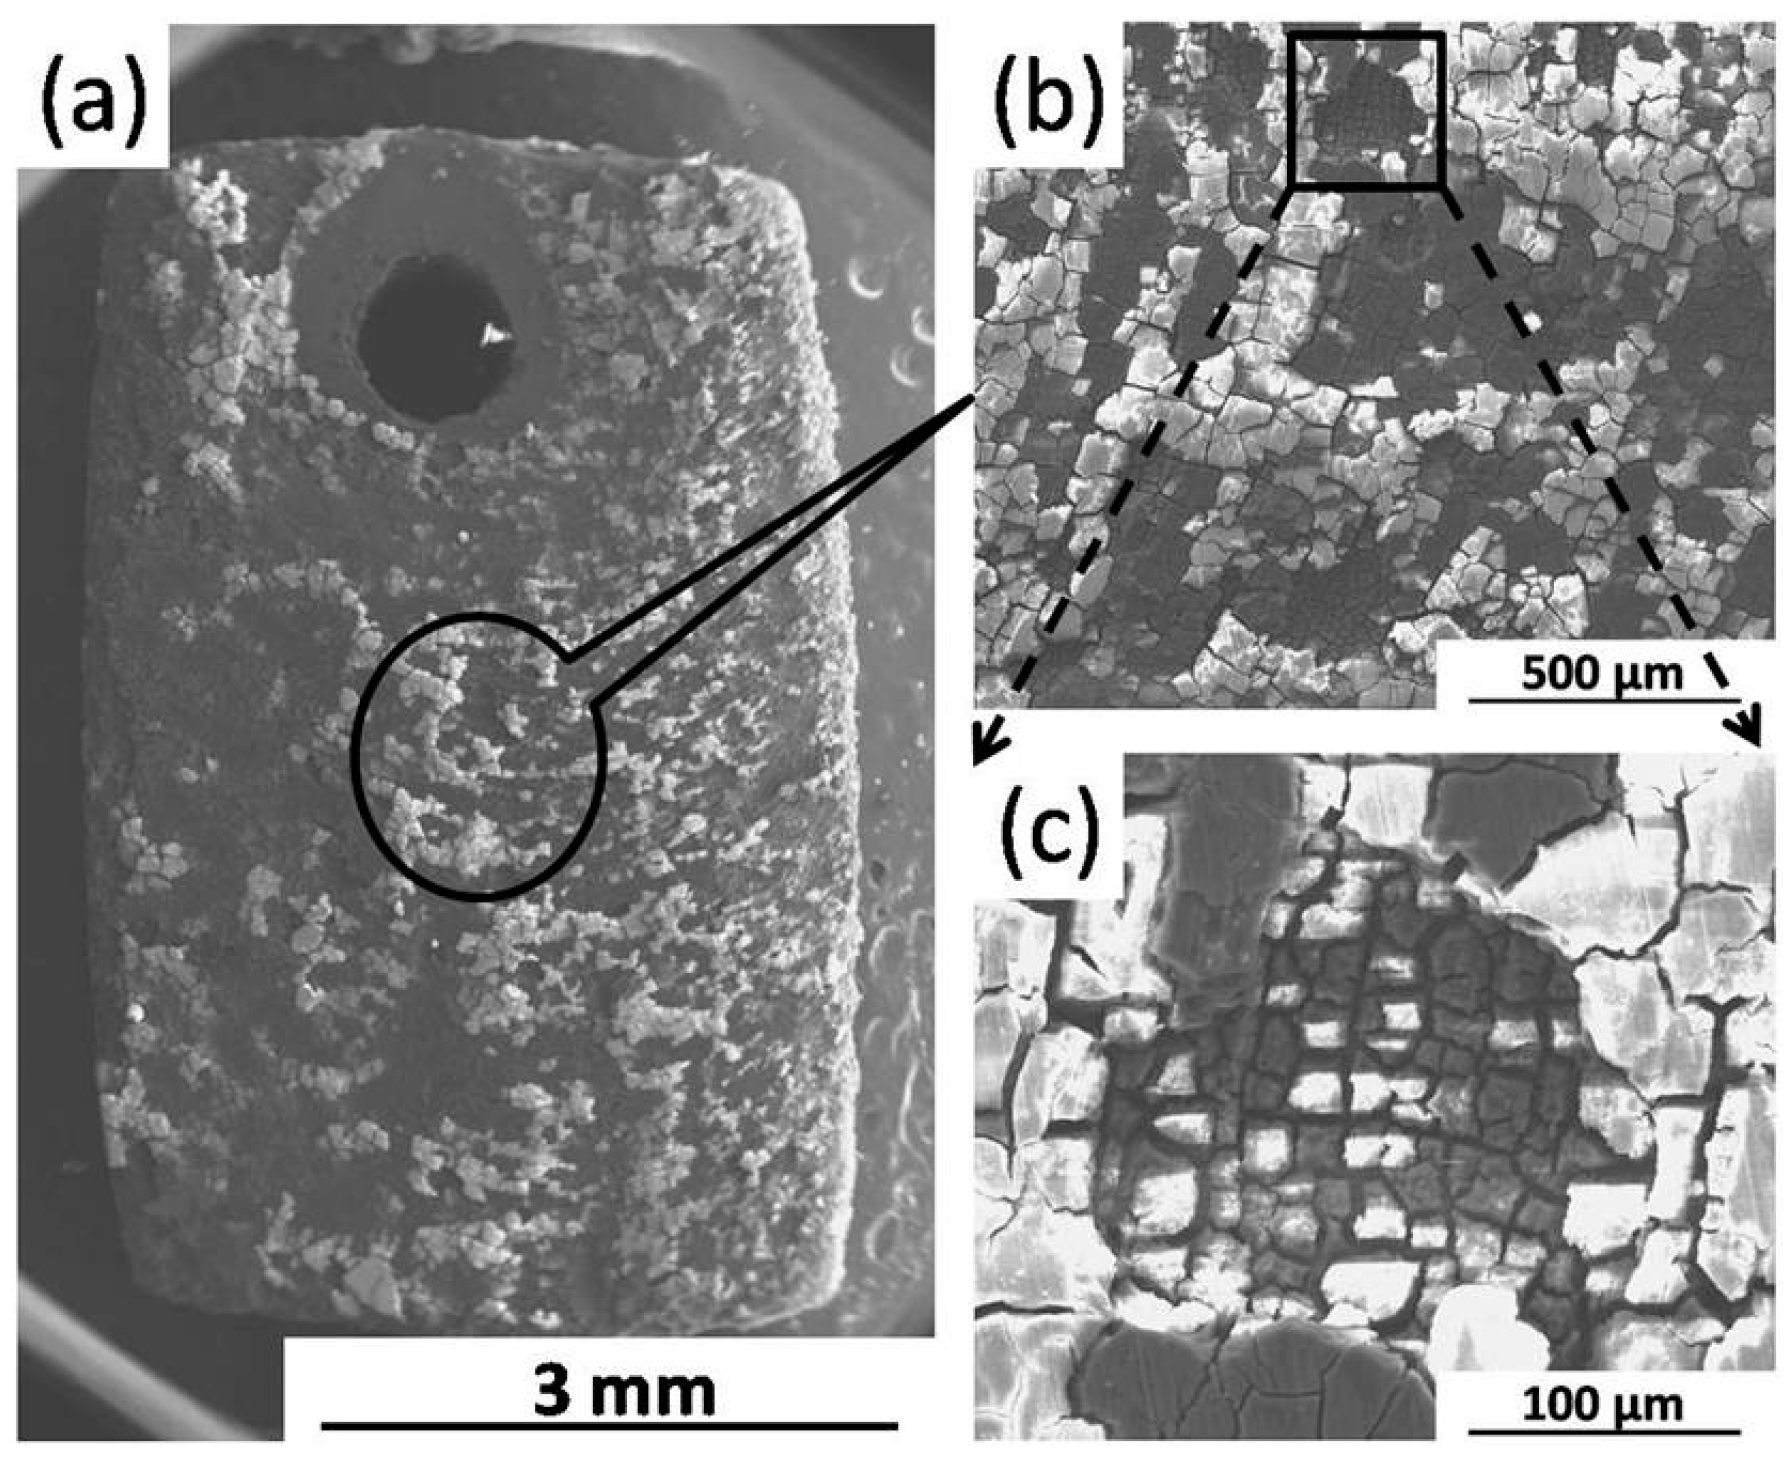
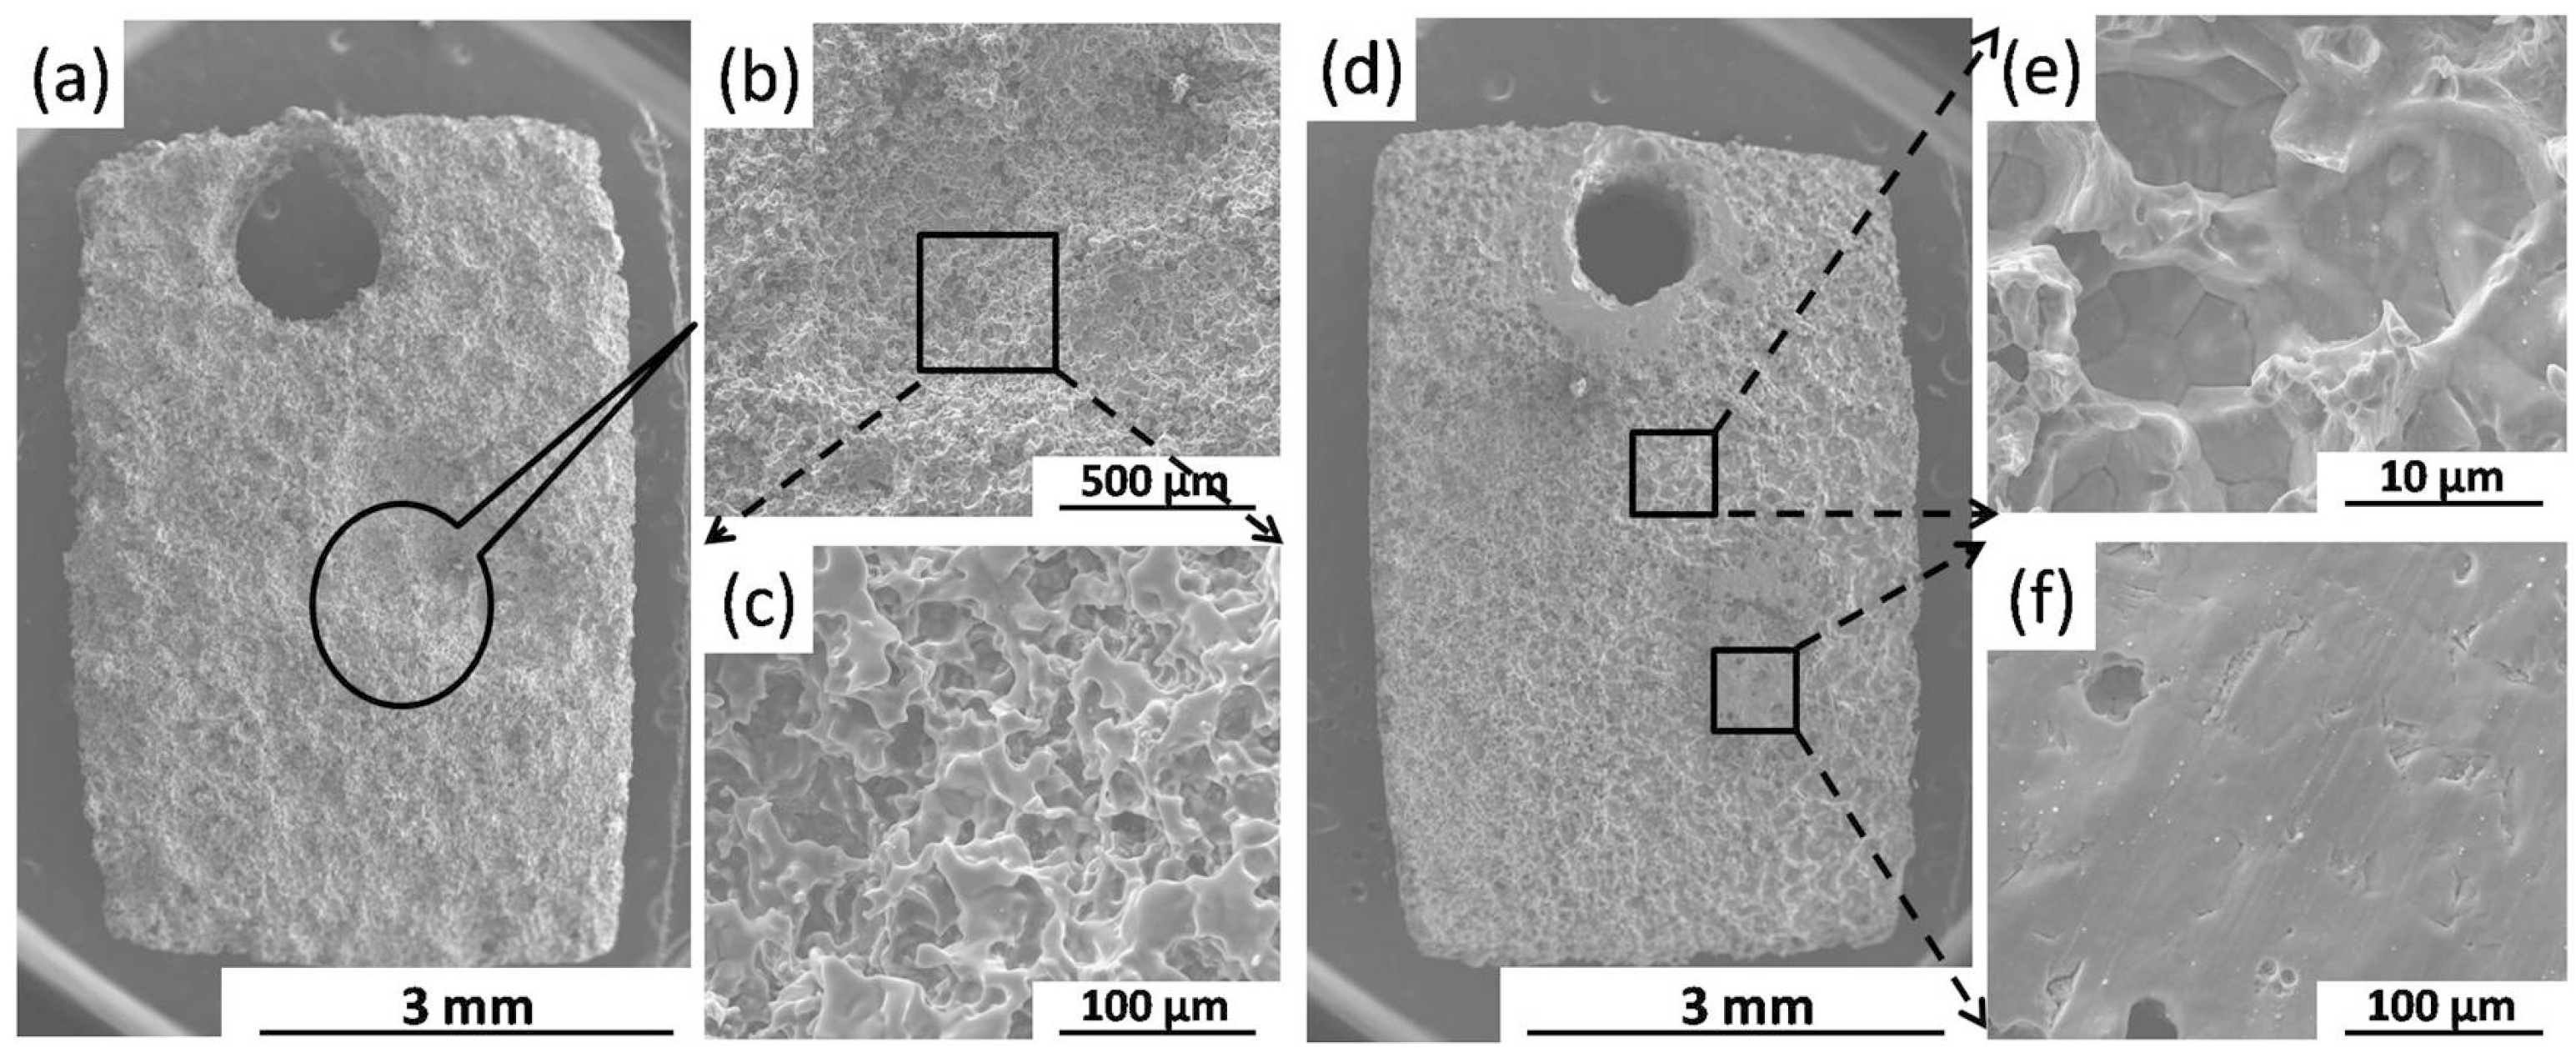
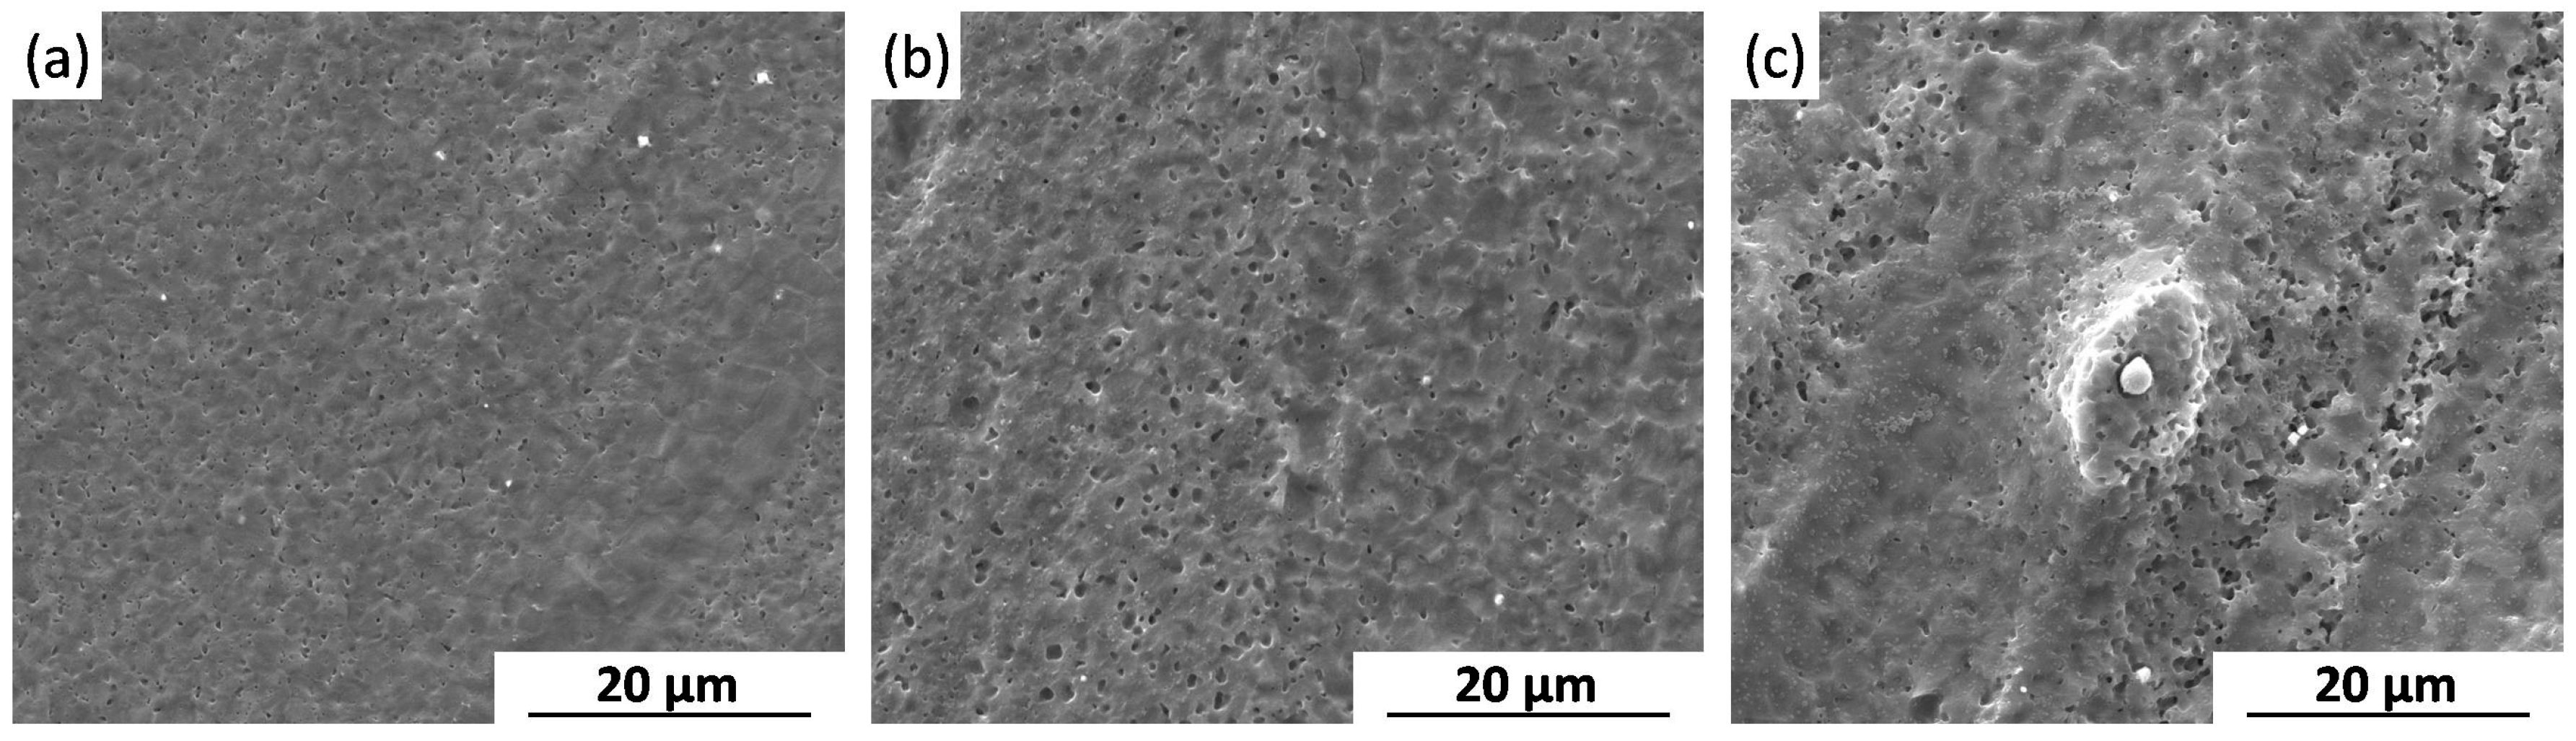
2.2.3. Corrosion Morphology
2.3. Tensile Test
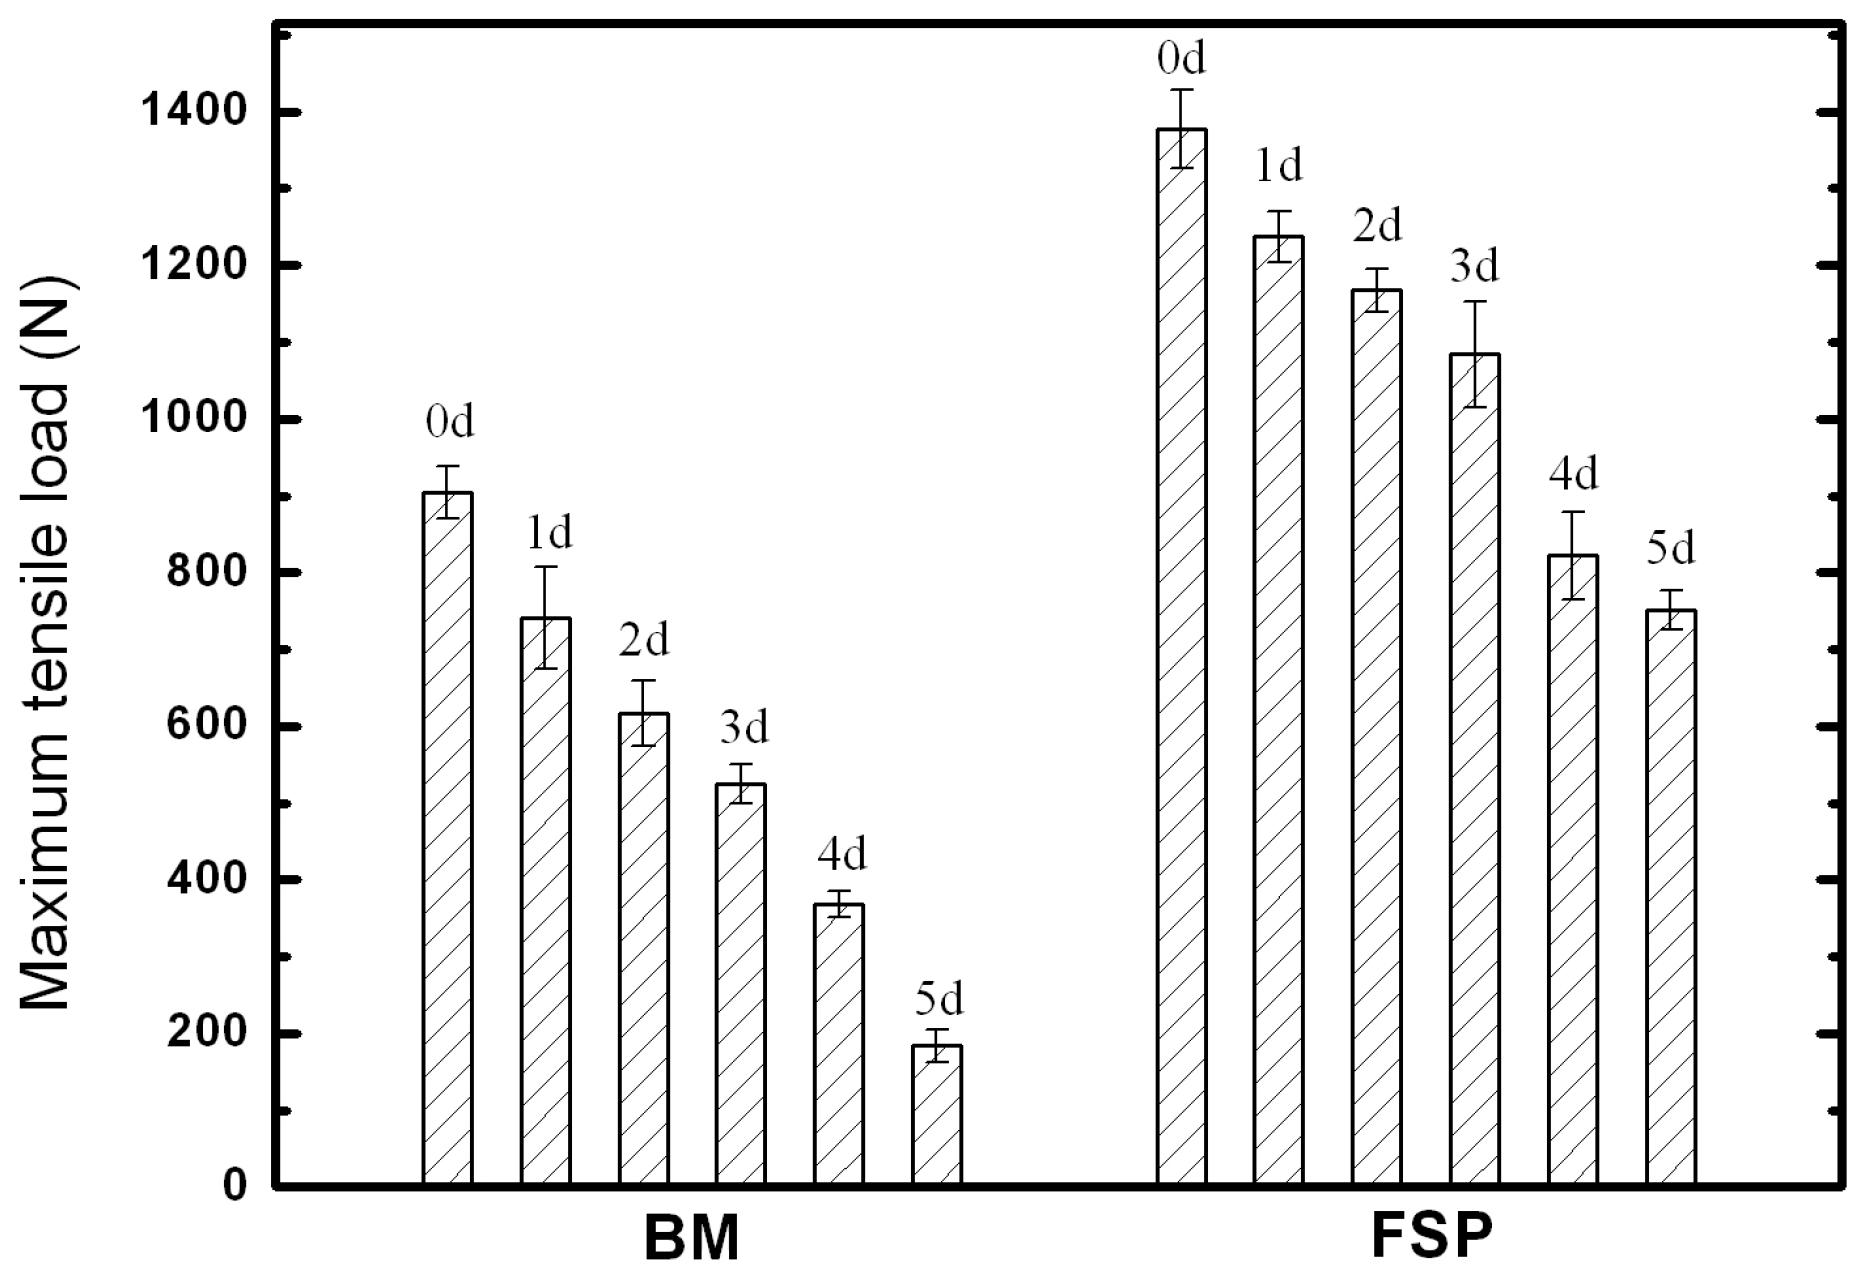
2.3.1. Tensile Properties
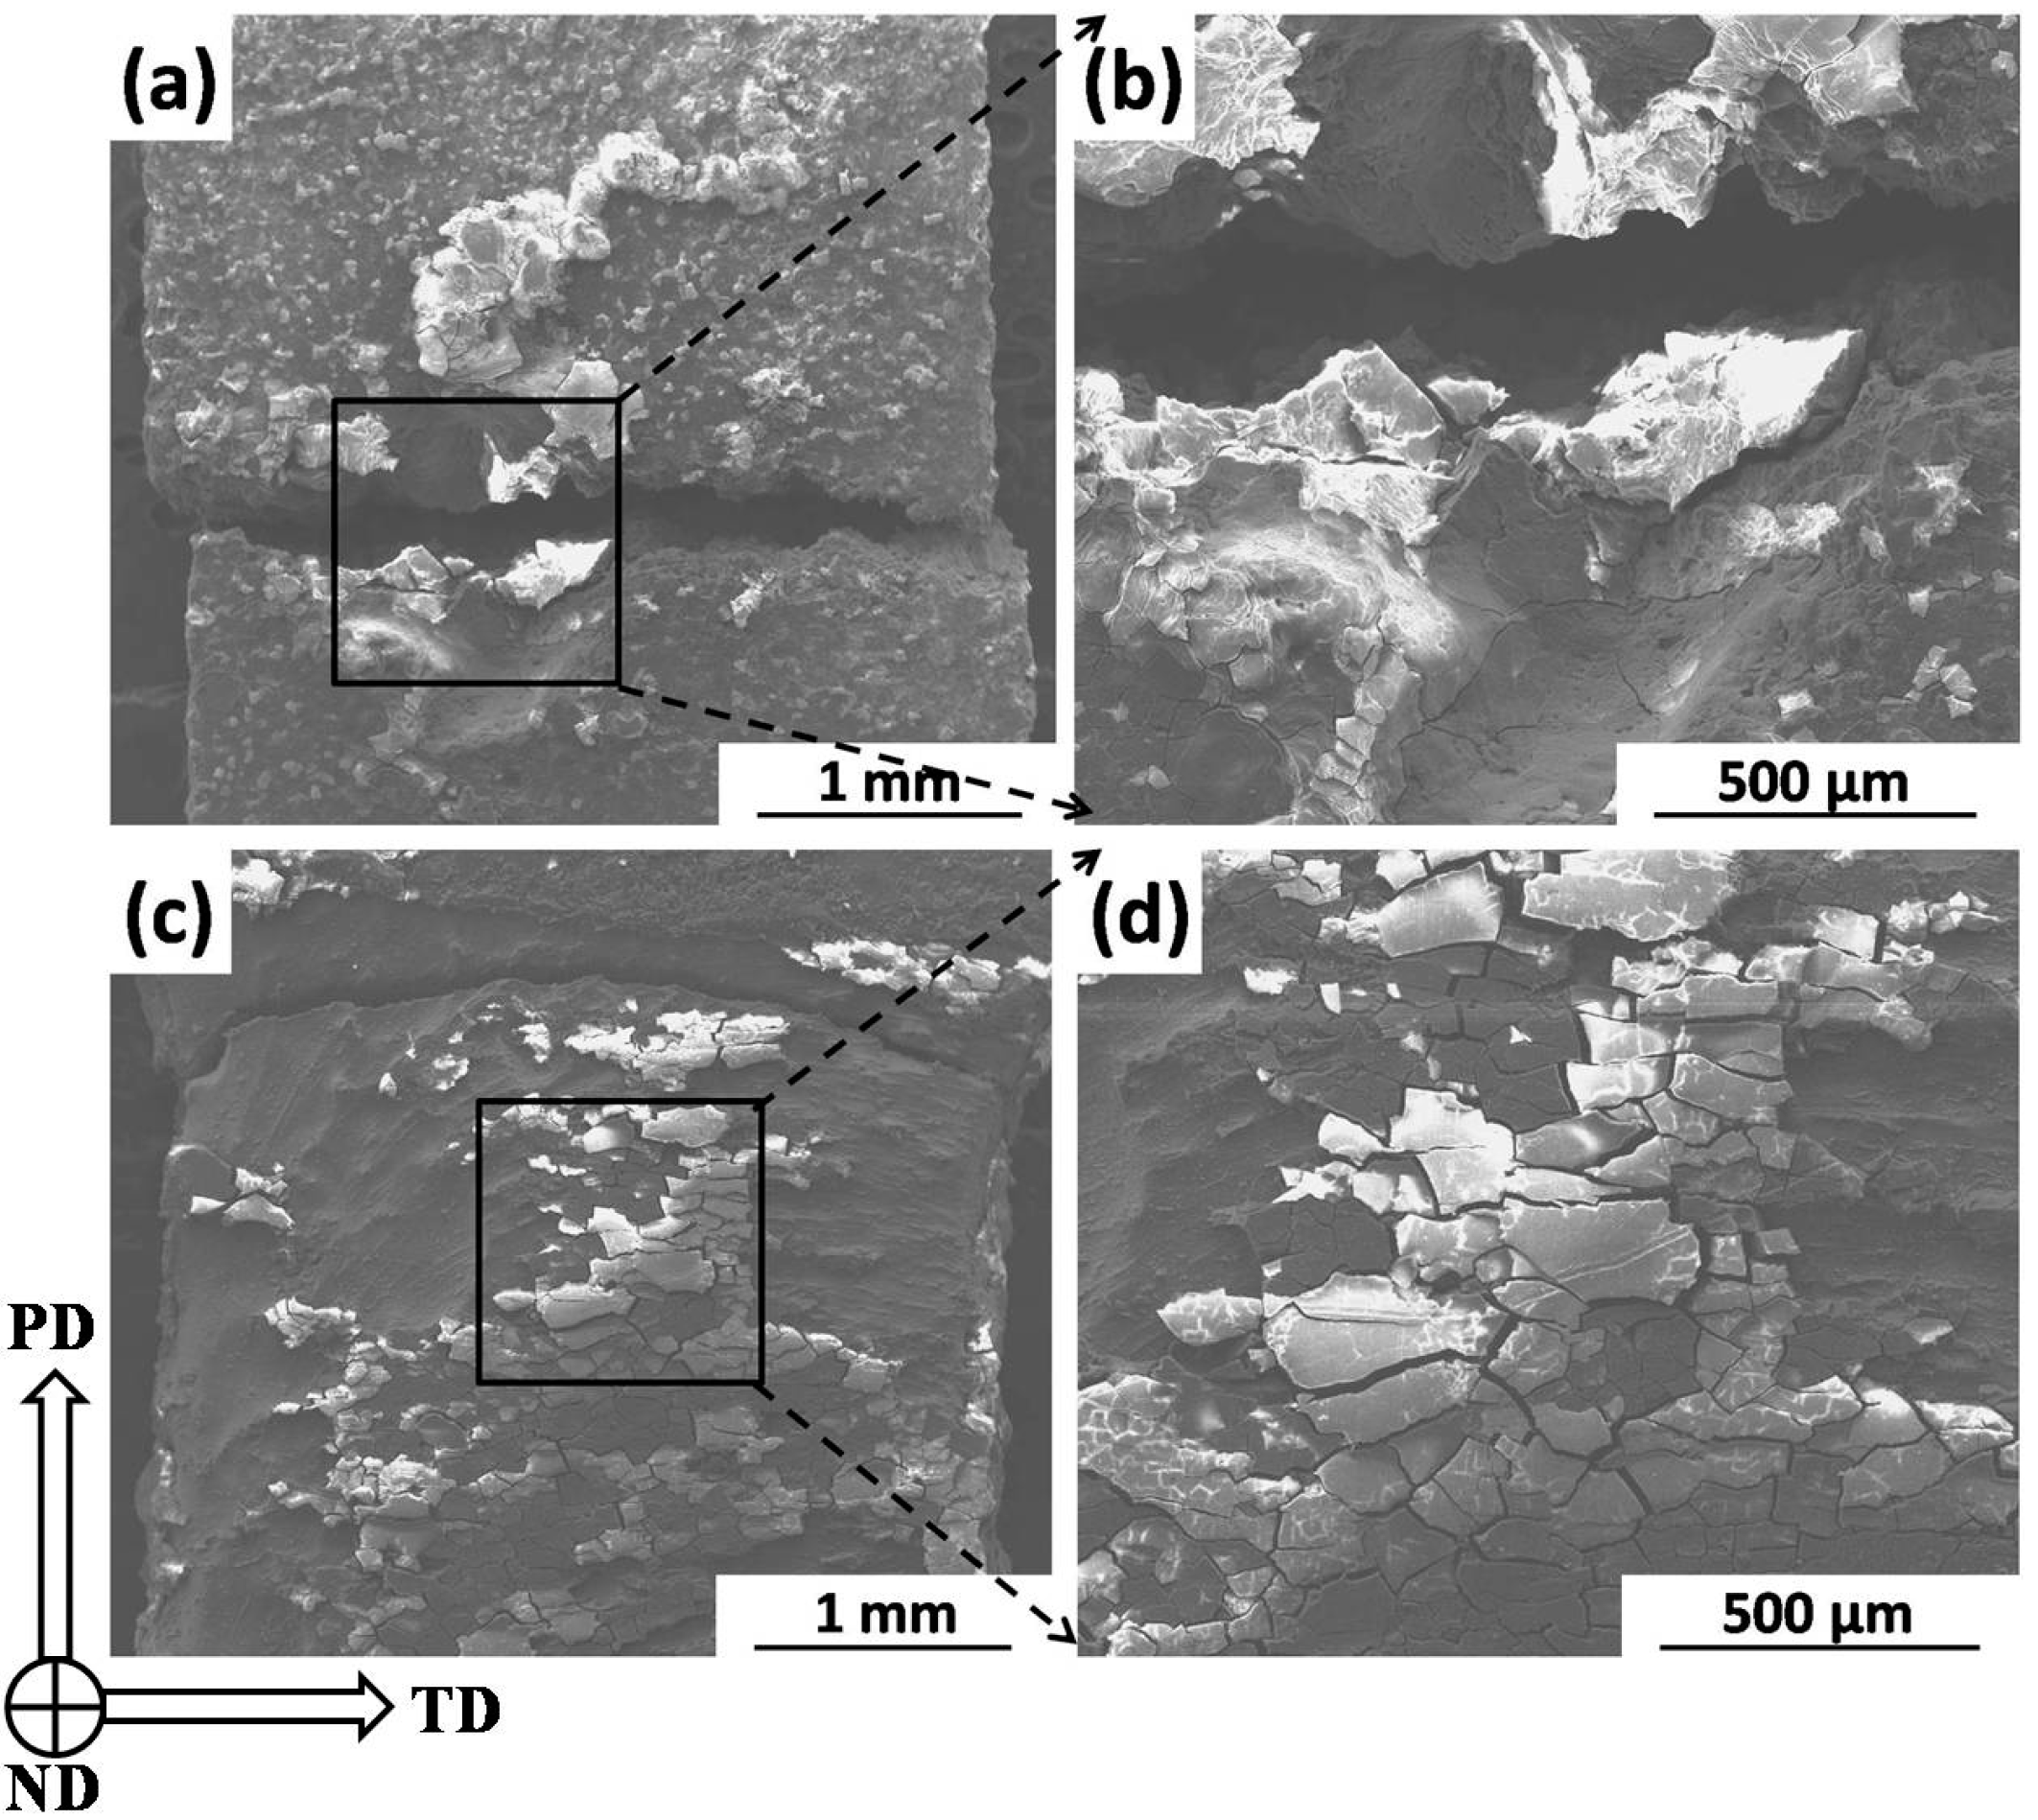
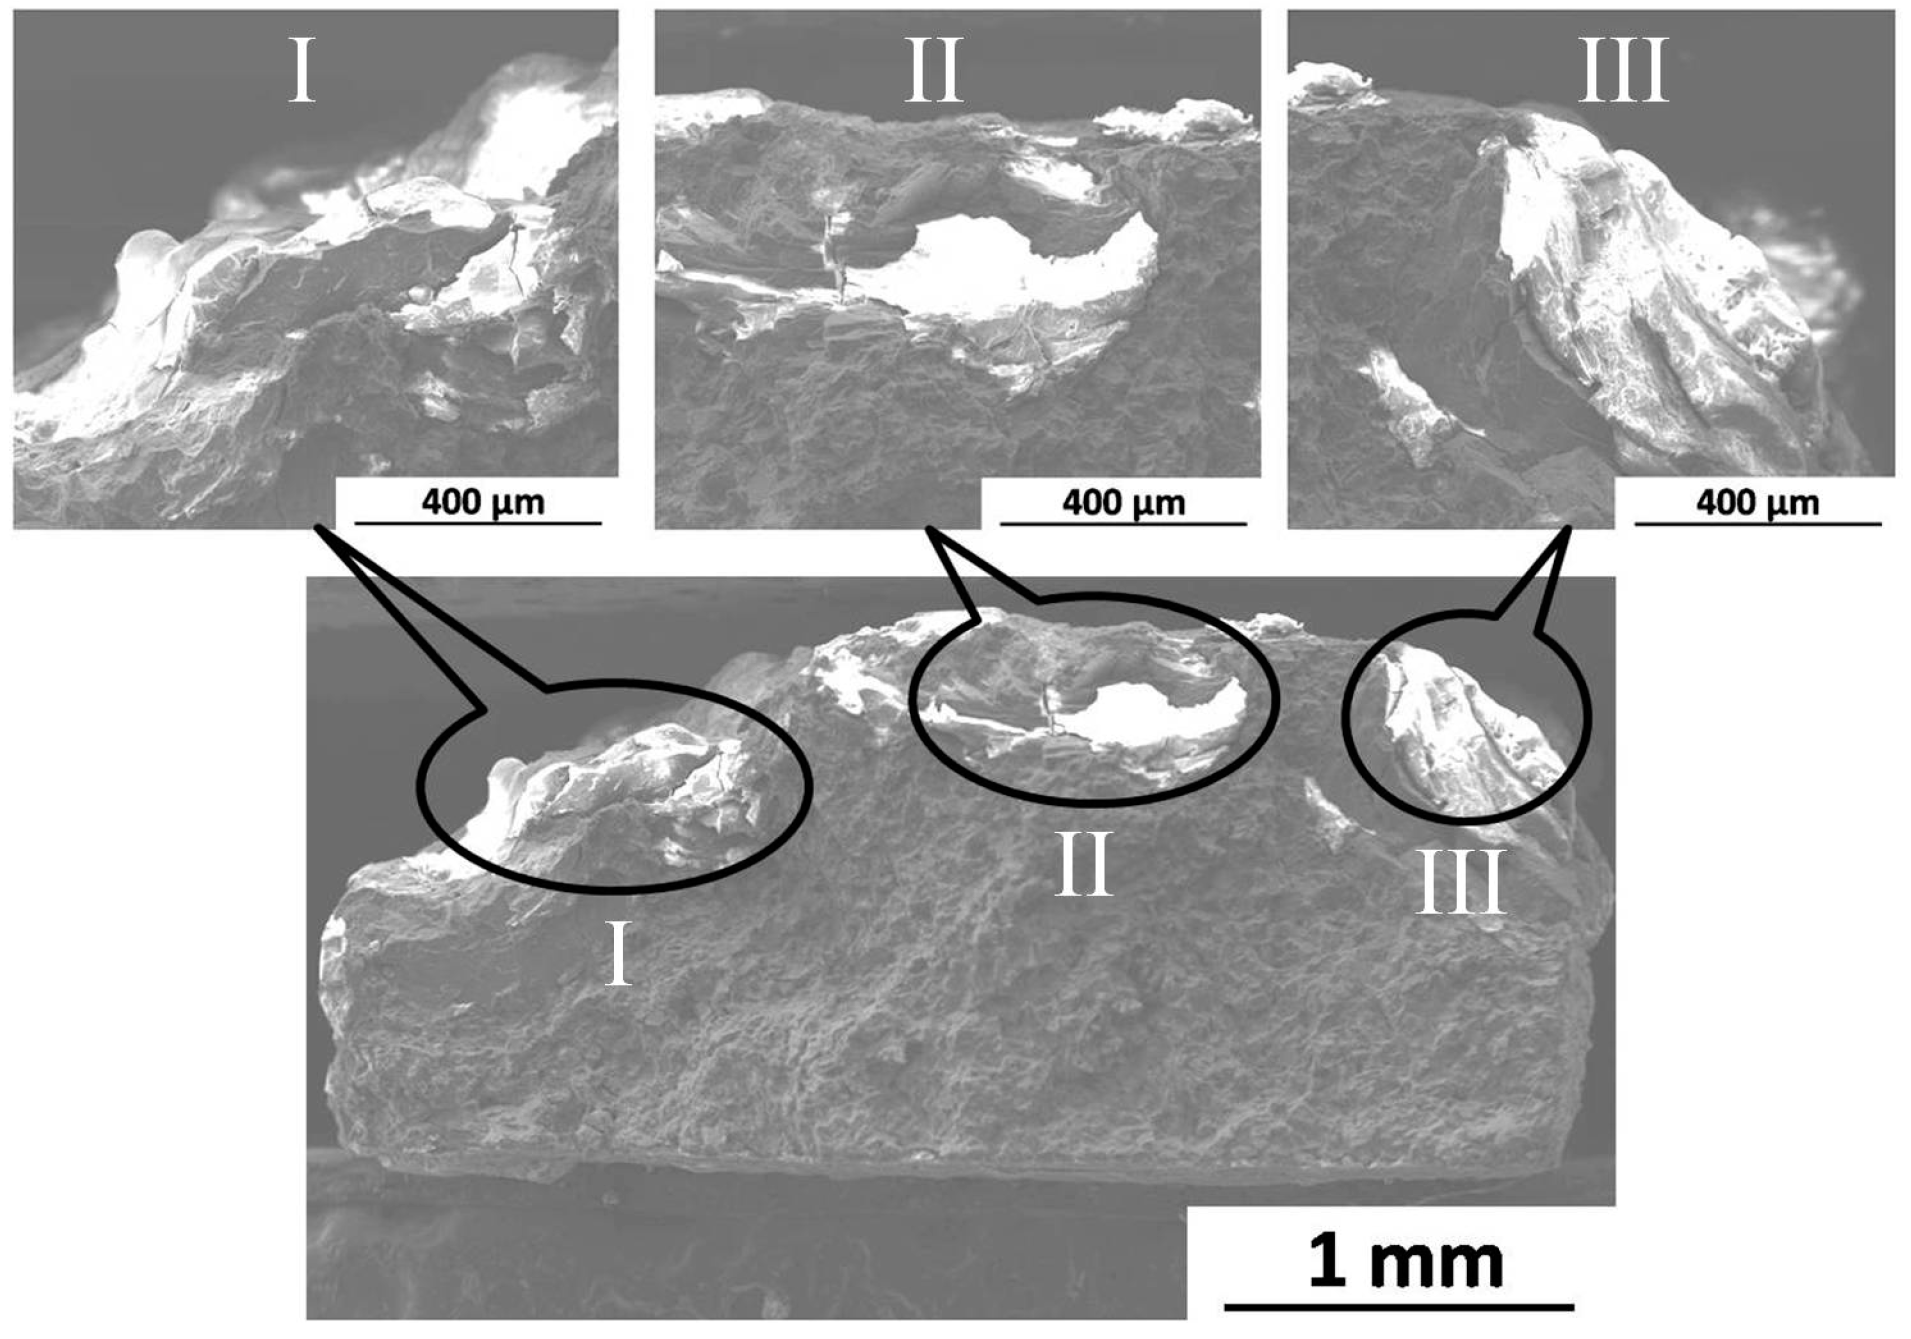
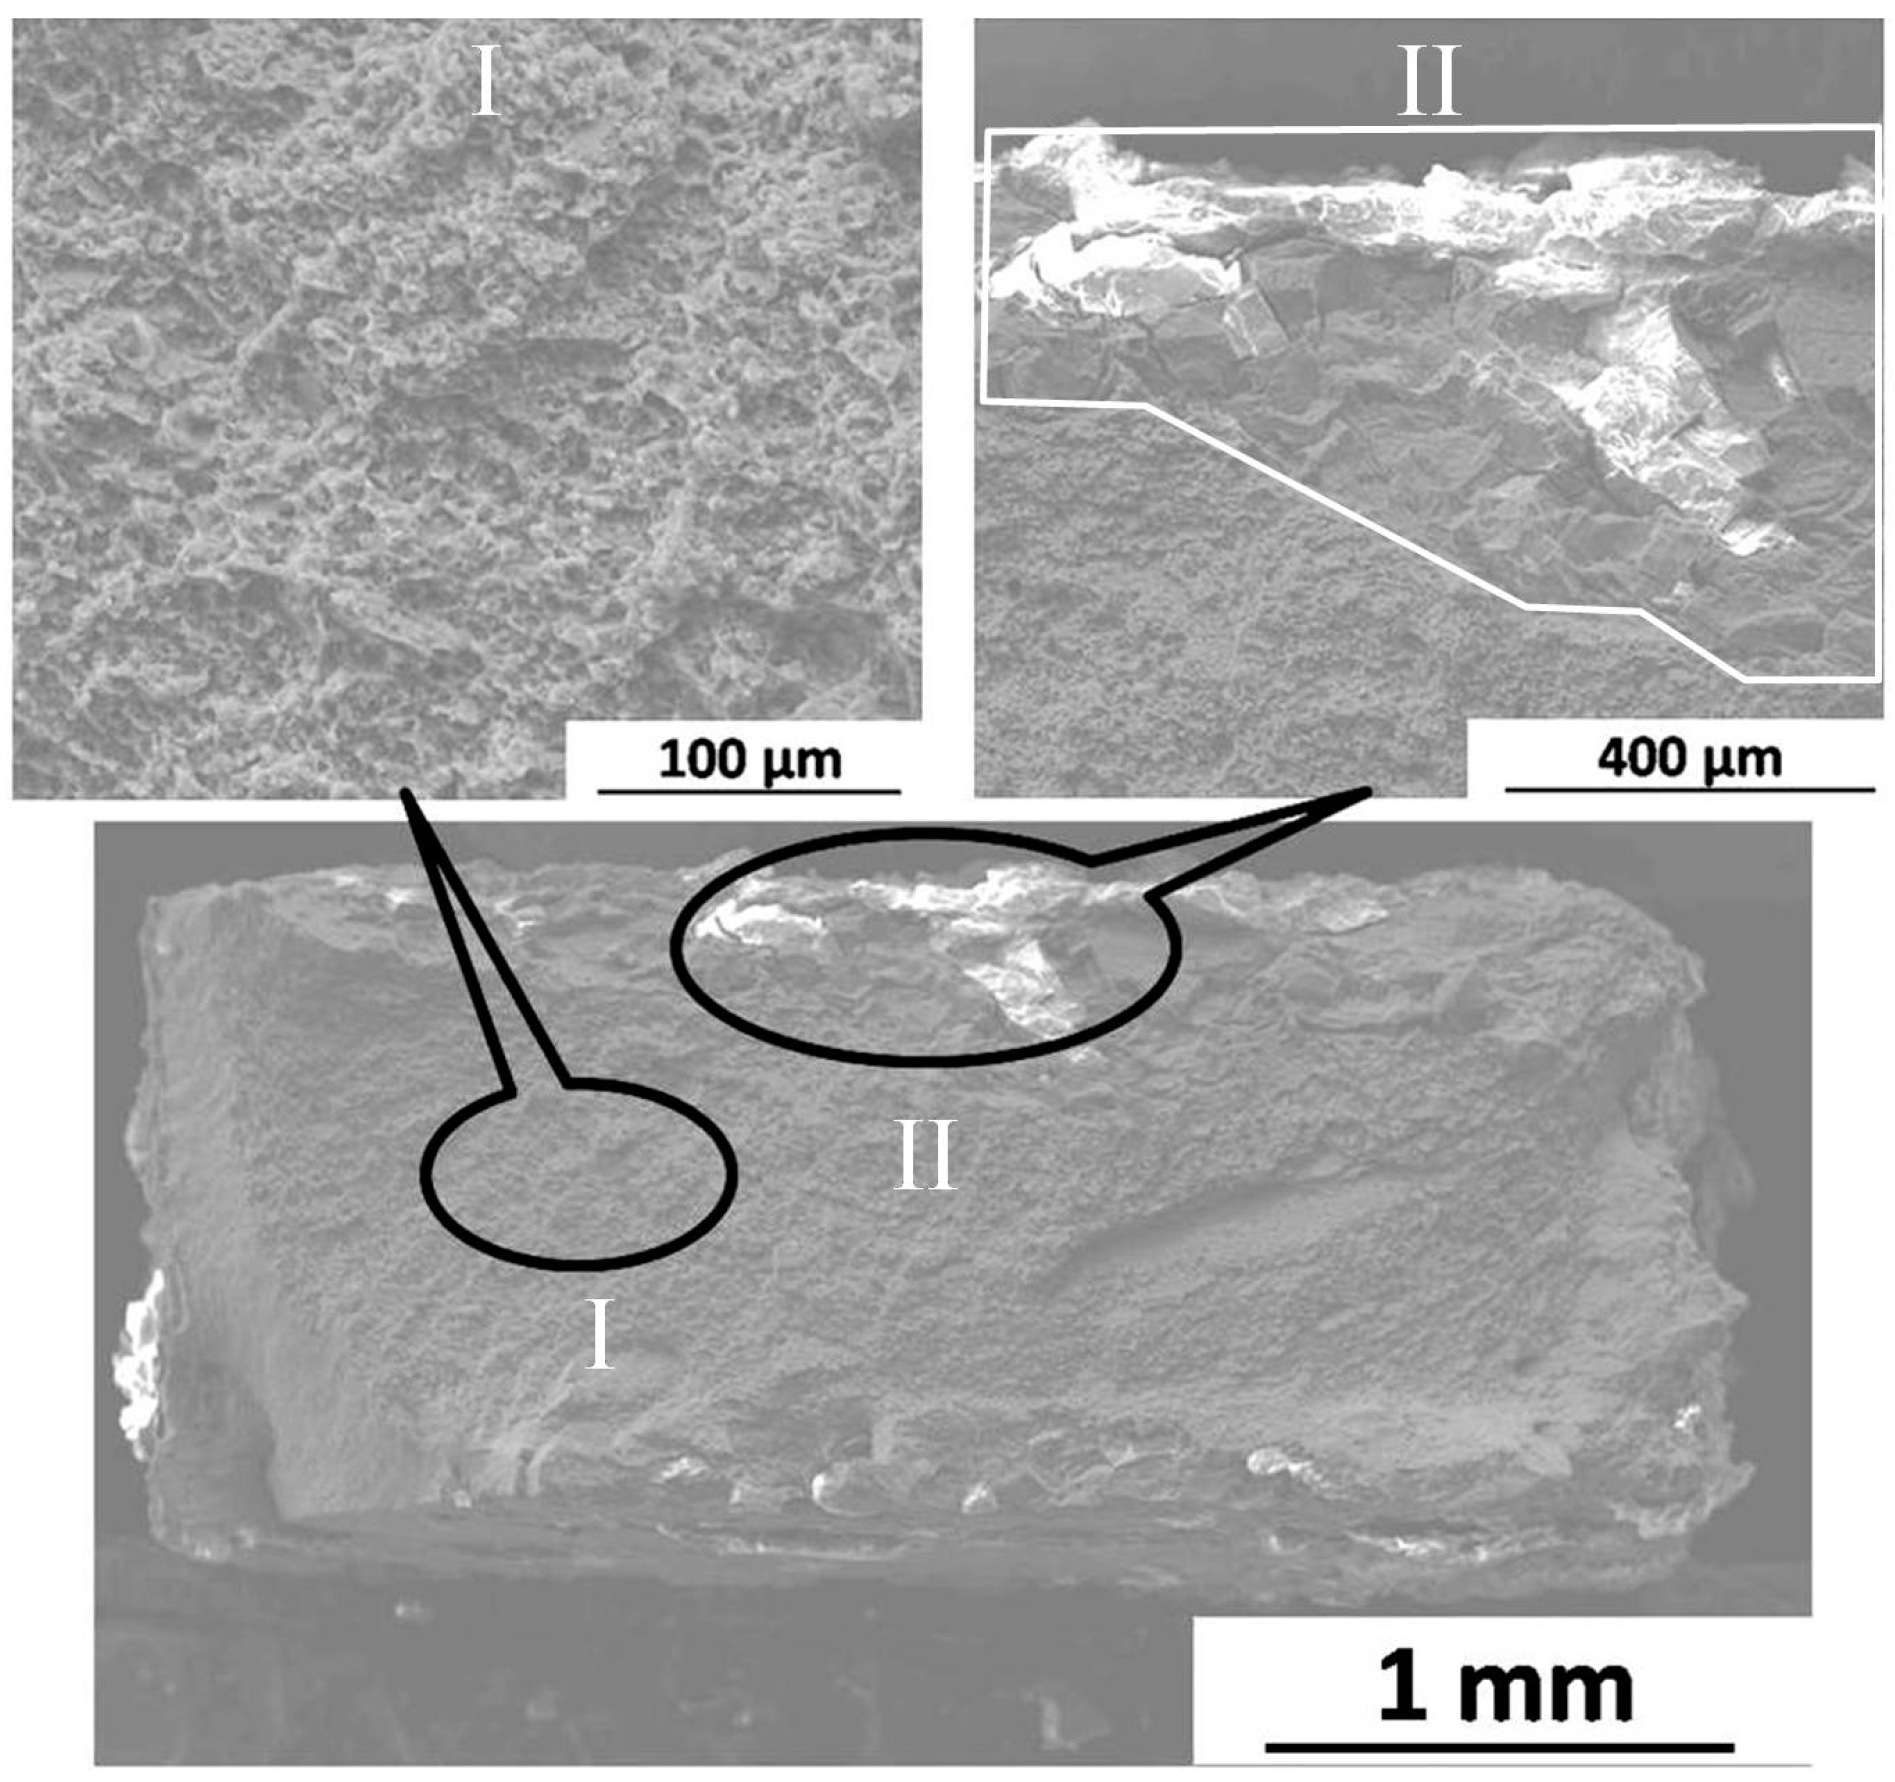
2.3.2. Fracture Morphology
3. Discussion
3.1. Influence of Grain Refinement on Uniform Corrosion Behavior
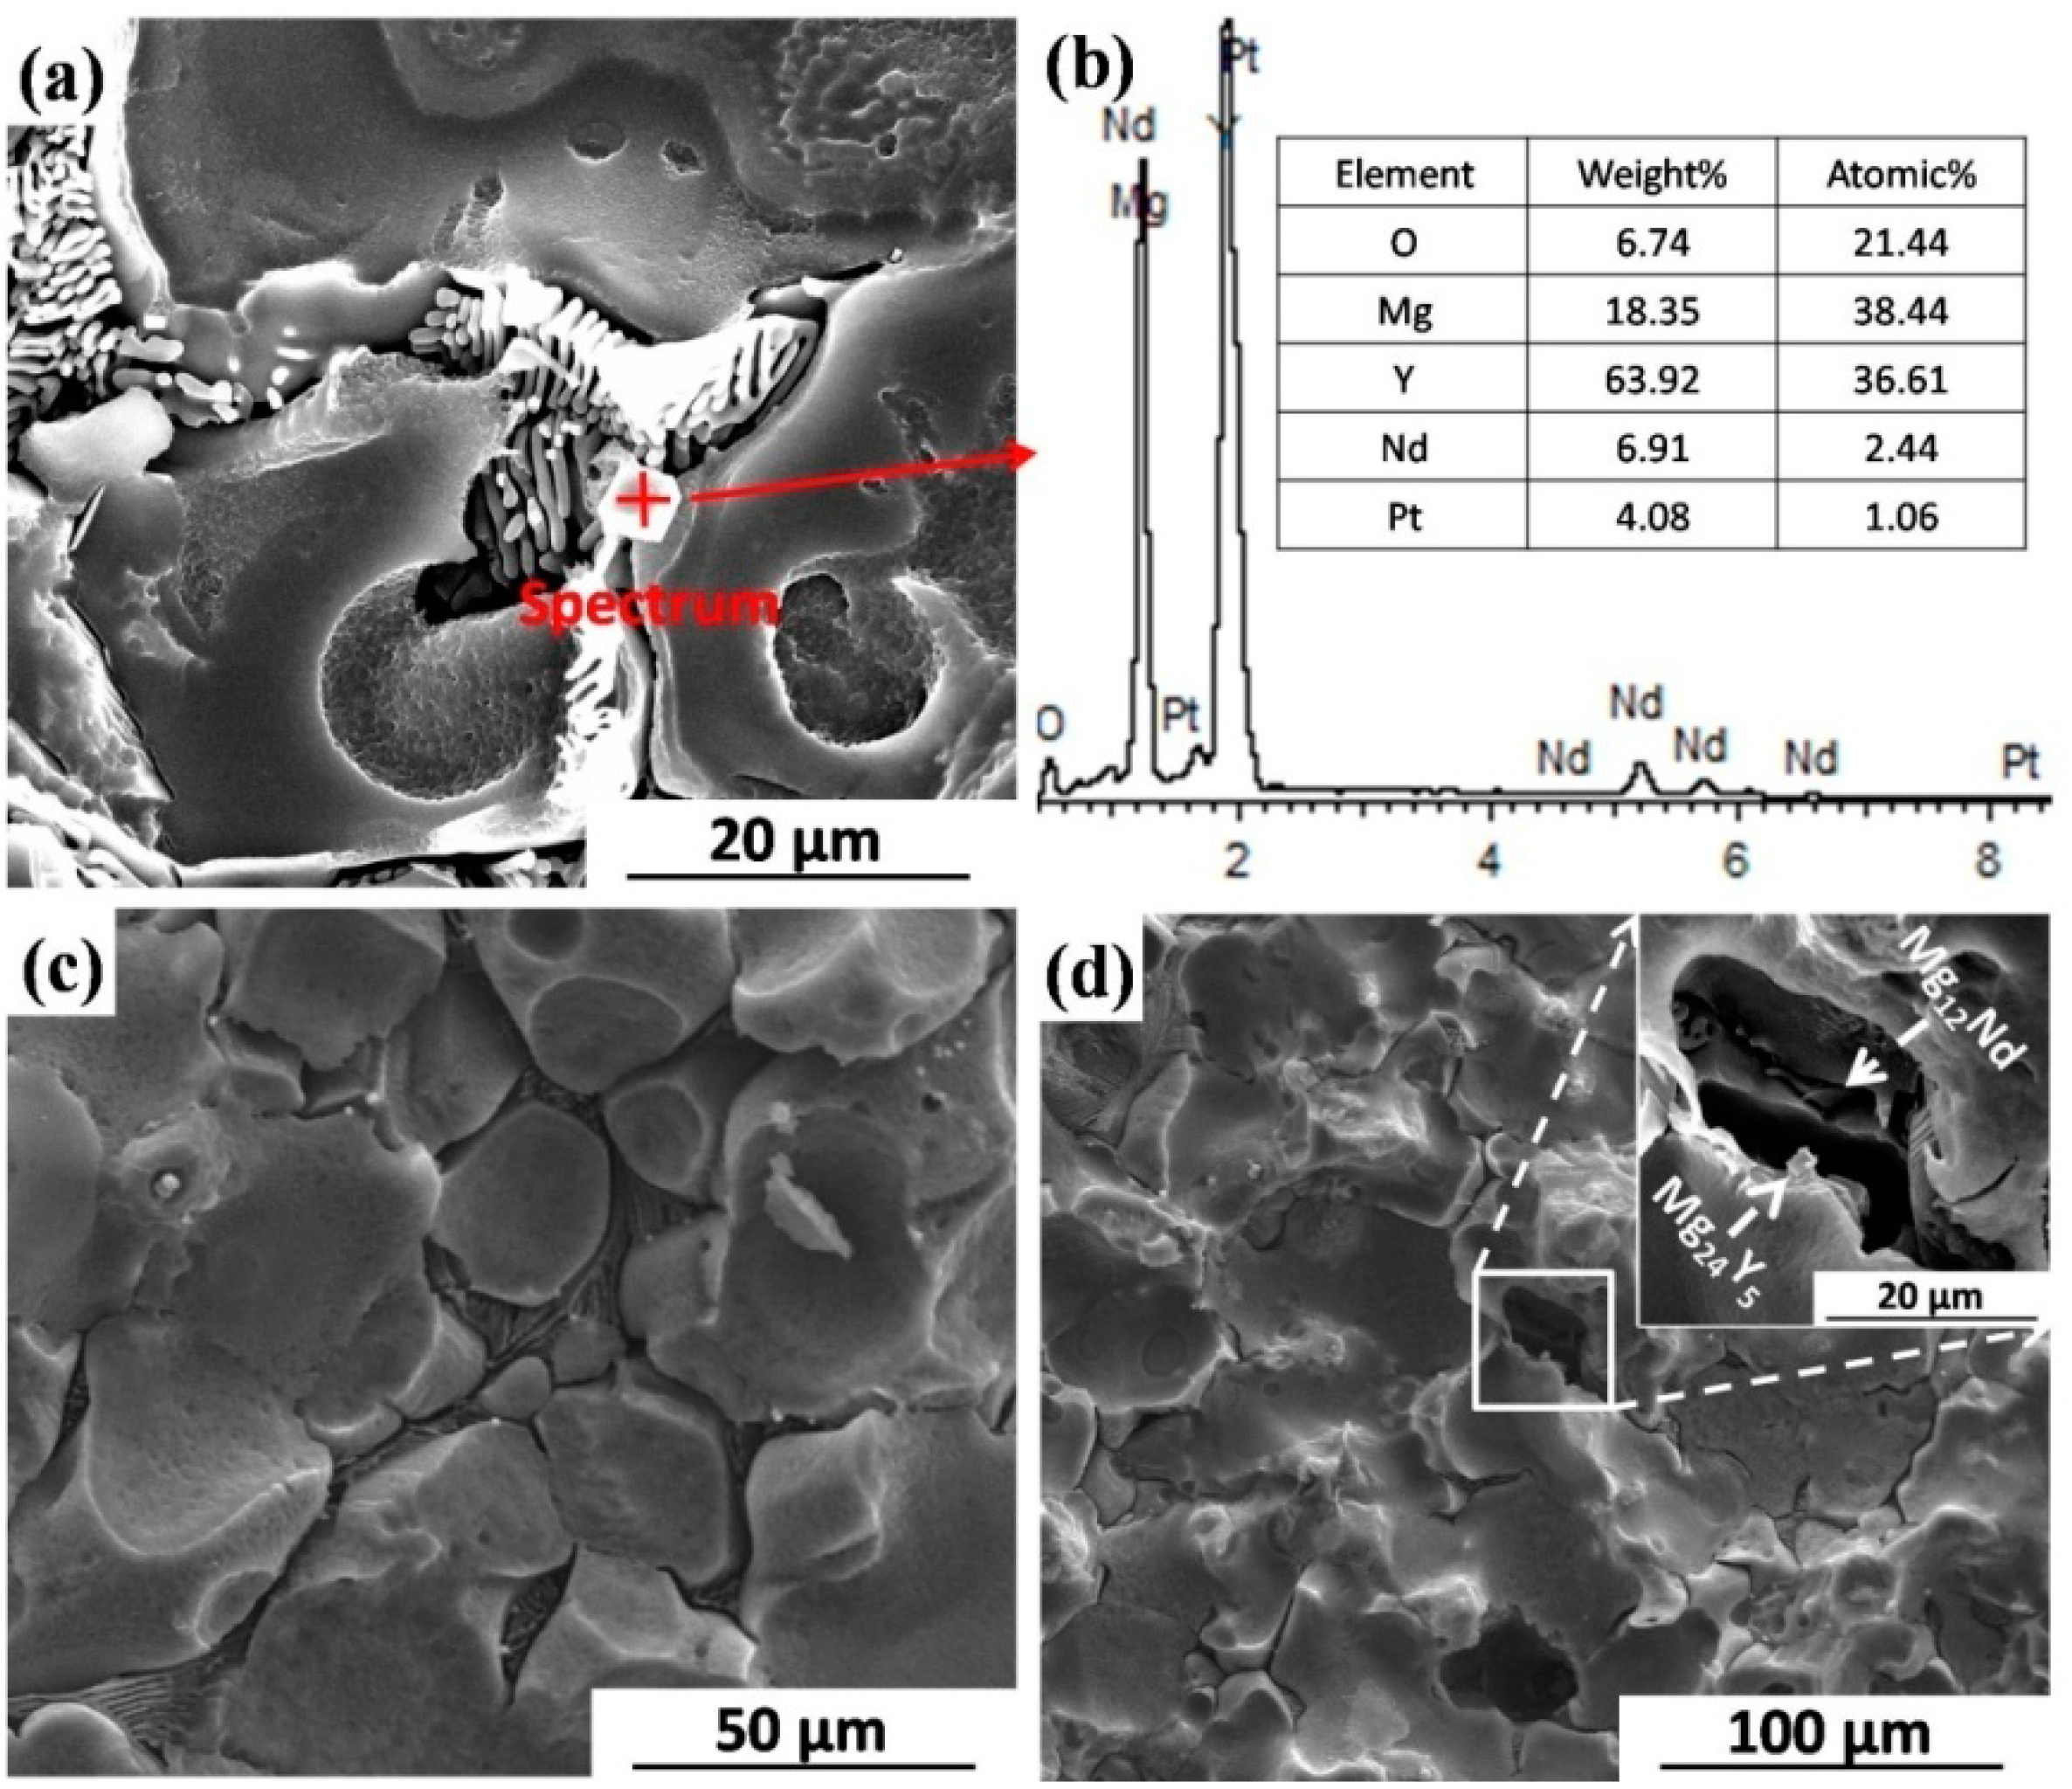
3.2. Influence of Second Phases on Uniform Corrosion Behavior
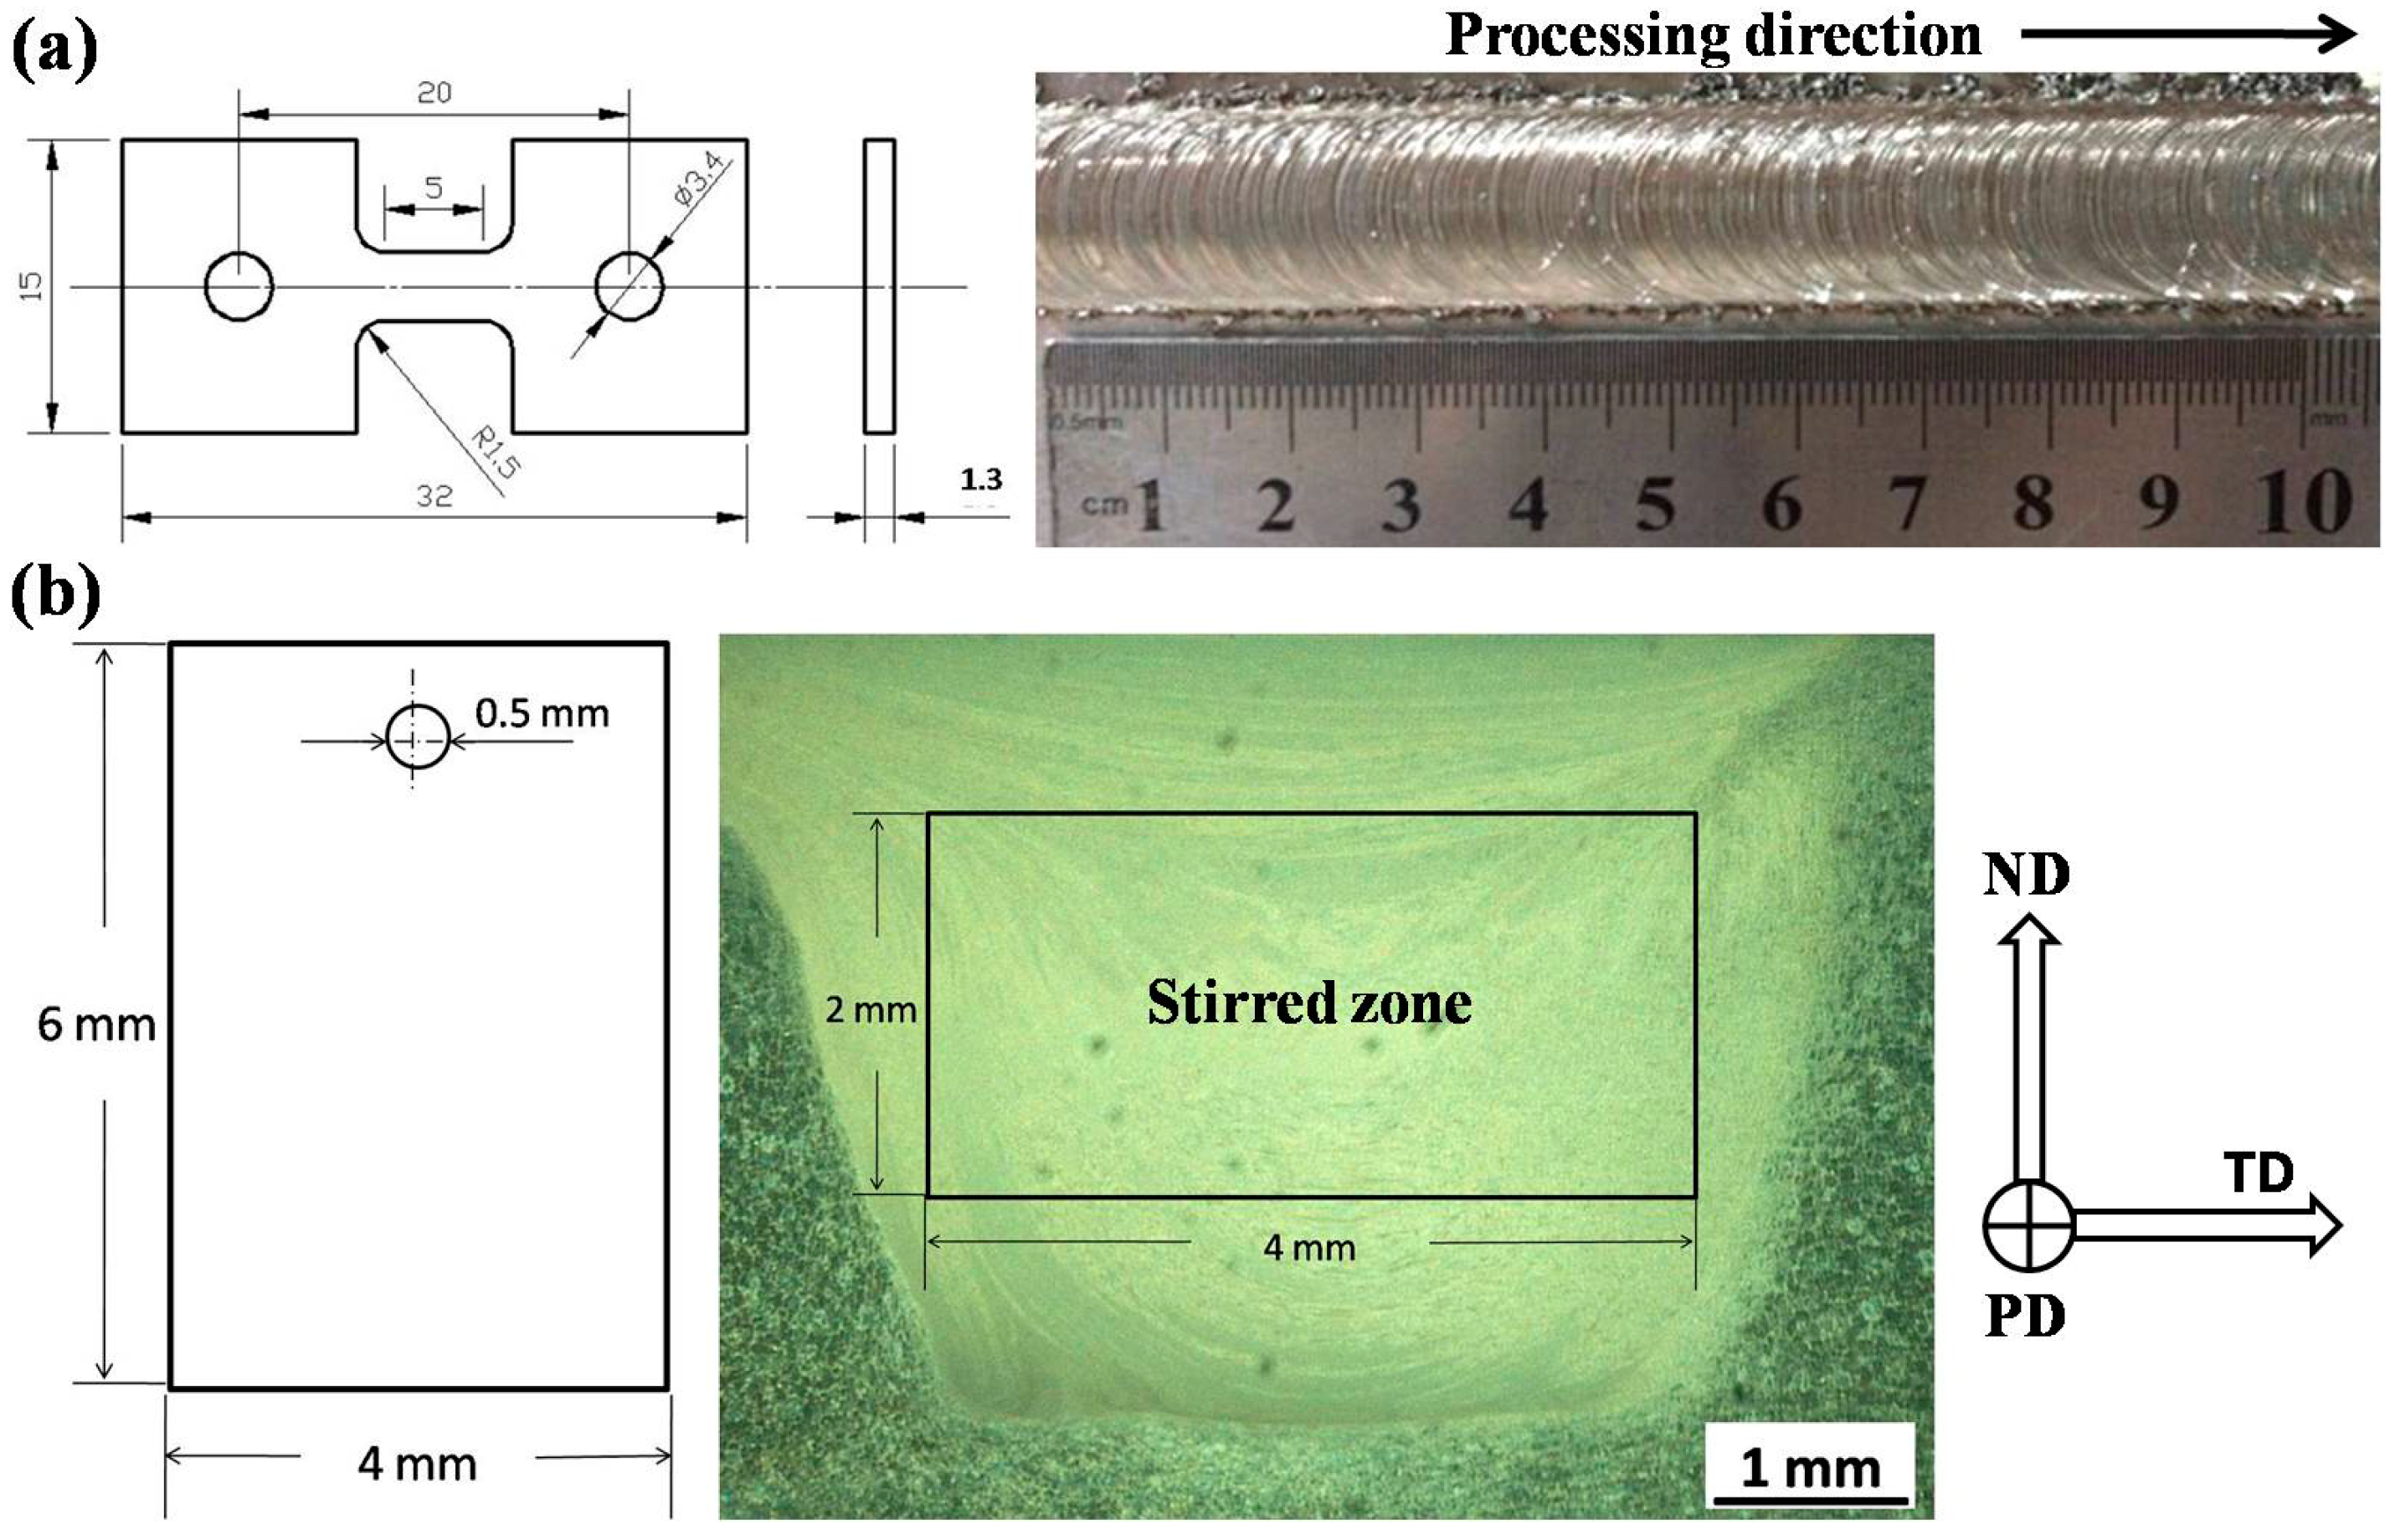
4. Materials and Methods
5. Conclusions
- The Ecorr and icorr values obtained by electrochemical measurements indicate that the corrosion resistance of as-cast WE43 alloy is improved after FSP. In addition, according to immersion tests, the corrosion rate of as-cast WE43 alloy is decreased from 38.41 mm/yr to 15.12 mm/yr after FSP.
- Micro-galvanic corrosion is the dominant corrosion behavior for BM and FSP specimens. Due to the fine-grained and homogeneous microstructure, the uniform corrosion morphology was observed on FSP WE43 alloy.
- After immersion in SBF for five days, the maximum tensile load for as-cast WE43 alloy is significantly decreased to 20% of the original value, while the maximum tensile load of the FSP specimen is still 54% of the original value, which is attributed to the improved corrosion resistance and uniform corrosion behavior after FSP.
Acknowledgments
Author Contributions
Conflicts of Interest
References
- Staiger, M.P.; Pietak, A.M.; Huadmai, J.; Dias, G. Magnesium and its alloys as orthopedic biomaterials: A review. Biomaterials 2006, 27, 1728–1734. [Google Scholar] [CrossRef] [PubMed]
- Ding, Y.F.; Wen, C.; Hodgson, P.; Li, Y.C. Effects of alloying elements on the corrosion behavior and biocompatibility of biodegradable magnesium alloys: A review. J. Mater. Chem. B 2014, 2, 1912–1933. [Google Scholar] [CrossRef]
- Saris, N.E.L.; Mervaala, E.; Karppanen, H.; Khawaja, J.A.; Lewenstam, A. Magnesium: An update on physiological, clinical and analytical aspects. Clin. Chim. Acta 2000, 294, 1–26. [Google Scholar] [CrossRef]
- Okuma, T. Magnesium and bone strength. Nutrition 2001, 17, 679–680. [Google Scholar] [CrossRef]
- Hartwig, A. Role of magnesium in genomic stability. Mutat. Res. Fund. Mol. Mech. Mutagen. 2001, 475, 113–121. [Google Scholar] [CrossRef]
- Yamasaki, Y.; Yoshida, Y.; Okazaki, M.; Shimazu, A.; Uchida, T.; Kubo, T.; Akagawa, Y.; Hamada, Y.; Takahashi, J.; Matsuura, N. Synthesis of functionally graded MgCO3 apatite accelerating osteoblast adhesion. J. Biomed. Mater. Res. 2002, 62, 99–105. [Google Scholar] [CrossRef] [PubMed]
- Yamasaki, Y.; Yoshida, Y.; Okazaki, M.; Shimazu, A.; Kubo, T.; Akagawa, Y.; Uchida, T. Action of FGMgCO3Ap-collagen composite in promoting bone formation. Biomaterials 2003, 24, 4913–4920. [Google Scholar] [CrossRef]
- Gu, X.N.; Zheng, Y.F. A review on magnesium alloys as biodegradable materials. Front. Mater. Sci. China 2010, 4, 111–115. [Google Scholar] [CrossRef]
- Friedrich, H.E.; Mordike, B.L. Magnesium Technology. Metallurgy, Design Date, Applications; Springer-Verlag: Berlin, Germany, 2006. [Google Scholar]
- Zheng, Y.F.; Gu, X.N.; Witte, F. Biodegradable metals. Mat. Sci. Eng. R 2014, 77, 1–34. [Google Scholar] [CrossRef]
- Yamasaki, M.; Hayashi, N.; Izumi, S.; Kawamura, Y. Corrosion behavior of rapidly solidified Mg-Zn-rare earth element alloys in NaCl solution. Corros. Sci. 2007, 49, 255–262. [Google Scholar] [CrossRef]
- Xu, D.K.; Tang, W.N.; Liu, L.; Xu, Y.B.; Han, E.H. Effect of Y concentration on the microstructure and mechanical properties of as-cast Mg-Zn-Y-Zr alloys. J. Alloys Compd. 2007, 432, 129–134. [Google Scholar] [CrossRef]
- Zhang, J.; Wang, J.; Qiu, X.; Zhang, D.; Tian, Z.; Niu, X.; Tang, D.; Meng, J. Effect of Nd on the microstructure, mechanical properties and corrosion behavior of die-cast Mg-4Al-based alloy. J. Alloys Compd. 2008, 464, 556–564. [Google Scholar] [CrossRef]
- Liu, M.; Schmutz, P.; Uggowitzer, P.J.; Song, G.; Atrens, A. The influence of yttrium (Y) on the corrosion of Mg–Y binary alloys. Corros. Sci. 2010, 52, 3687–3701. [Google Scholar] [CrossRef]
- Liu, N.; Wang, J.; Wang, L.; Wu, Y.; Wang, L. Electrochemical corrosion behavior of Mg-5Al-0.4Mn-xNd in NaCl solution. Corros. Sci. 2009, 51, 1328–1333. [Google Scholar] [CrossRef]
- Waksman, R.; Pakala, R.; Kuchulakanti, P.K.; Baffour, R.; Hellinga, D.; Seabron, R.; Tio, F.O.; Wittchow, E.; Hartwig, S.; Harder, C.; et al. Safety and efficacy of bioabsorbable magnesium alloy stents in porcine coronary arteries. Catheter. Cardiovasc. Interv. 2006, 68, 607–617. [Google Scholar] [CrossRef] [PubMed]
- Song, G.L.; Atrens, A. Corrosion Mechanisms of Magnesium Alloys. Adv. Eng. Mater. 1999, 1, 11–33. [Google Scholar] [CrossRef]
- Ralston, K.D.; Birbilis, N.; Davies, C.H.J. Revealing the relationship between grain size and corrosion rate of metals. Scr. Mater. 2010, 63, 1201–1204. [Google Scholar] [CrossRef]
- Kalb, H.; Rzany, A.; Hensel, B. Impact of microgalvanic corrosion on the degradation morphology of WE43 and pure magnesium under exposure to simulated body fluid. Corros. Sci. 2012, 57, 122–130. [Google Scholar] [CrossRef]
- Zeng, R.; Dietzel, W.; Witte, F.; Hort, N.; Blawert, C. Progress and challenge for magnesium alloys as biomaterials. Adv. Eng. Mater. 2008, 10, B1–B3. [Google Scholar] [CrossRef]
- Arrabal, R.; Matykina, E.; Viejo, F.; Skeldon, P.; Thompson, G.E. Corrosion resistance of WE43 and AZ91D magnesium alloys with phosphate PEO coatings. Corros. Sci. 2008, 50, 1744–1752. [Google Scholar] [CrossRef]
- Gu, X.N.; Li, X.L.; Zhou, W.R.; Cheng, Y.; Zheng, Y.F. Microstructure, biocorrosion and cytotoxicity evaluations of rapid solidified Mg-3Ca alloy ribbons as a biodegradable material. Biomed. Mater. 2010, 5. [Google Scholar] [CrossRef] [PubMed]
- Gao, J.H.; Guan, S.K.; Ren, Z.W.; Sun, Y.F.; Zhu, S.J.; Wang, B. Homogeneous corrosion of high pressure torsion treated Mg-Zn-Ca alloy in simulated body fluid. Mater. Lett. 2011, 65, 691–693. [Google Scholar] [CrossRef]
- Gu, X.N.; Li, N.; Zheng, Y.F.; Kang, F.; Wang, J.T.; Ruan, L. In vitro study on equal channel angular pressing AZ31 magnesium alloy with and without back pressure. Mat. Sci. Eng. B 2011, 176, 1802–1806. [Google Scholar] [CrossRef]
- Song, D.; Ma, A.B.; Jiang, J.H.; Lin, P.H.; Yang, D.H.; Fan, J.F. Corrosion behavior of equal-channel-angular-pressed pure magnesium in NaCl aqueous solution. Corros. Sci. 2010, 52, 481–490. [Google Scholar] [CrossRef]
- Song, D.; Ma, A.B.; Jiang, J.H.; Lin, P.H.; Yang, D.H.; Fan, J.F. Corrosion behavior of bulk ultra-fine grained AZ91D magnesium alloy fabricated by equal-channel angular pressing. Corros. Sci. 2011, 53, 362–373. [Google Scholar] [CrossRef]
- Mishra, R.S.; Mahoney, M.W.; McFadden, S.X.; Mara, N.A.; Mukherjee, A.K. High strain rate superplasticity in a friction stir processed 7075 Al alloy. Scr. Mater. 1999, 42, 163–168. [Google Scholar] [CrossRef]
- Mishra, R.S.; Ma, Z.Y. Friction stir welding and processing. Mater. Sci. Eng. R 2005, 50, 1–78. [Google Scholar] [CrossRef]
- Ni, D.R.; Xiao, B.L.; Ma, Z.Y.; Qiao, Y.X.; Zheng, Y.G. Corrosion properties of friction-stir processed cast NiAl bronze. Corros. Sci. 2010, 52, 1610–1617. [Google Scholar] [CrossRef]
- Argade, G.R.; Panigrahi, S.K.; Mishra, R.S. Effects of grain size on the corrosion resistance of wrought magnesium alloys containing neodymium. Corros. Sci. 2012, 58, 145–151. [Google Scholar] [CrossRef]
- Argade, G.R.; Kandasamy, K.; Panigrahi, S.K.; Mishra, R.S. Corrosion behavior of a friction stir processed rare-earth added magnesium alloy. Corros. Sci. 2012, 58, 321–326. [Google Scholar] [CrossRef]
- Rettig, R.; Virtanen, S. Time-dependent electrochemical characterization of the corrosion of a magnesium rare-earth alloy in simulated body fluids. J. Biomed. Mater. Res. 2007, 85, 167–175. [Google Scholar] [CrossRef] [PubMed]
- Kokubo, T.; Takadama, H. How useful is SBF in predicting in vivo bone bioactivity? Biomaterials 2006, 27, 2907–2915. [Google Scholar] [CrossRef] [PubMed]
- Cao, G.H.; Zhang, D.T.; Chai, F.; Zhang, W.W.; Qiu, C. Superplastic behavior and microstructure evolution of a fine-grained Mg-Y-Nd alloy processed by submerged friction stir processing. Mater. Sci. Eng. A 2015, 642, 157–166. [Google Scholar] [CrossRef]
- Witte, F.; Fischer, J.; Nellesen, J.; Crostack, H.A.; Kaese, V.; Pisch, A.; Beckmann, F.; Windhagen, H. In vitro and in vivo corrosion measurements of magnesium alloys. Biomaterials 2006, 27, 1013–1018. [Google Scholar] [CrossRef] [PubMed]
- Jamesh, M.I.; Wu, G.S.; Zhao, Y.; McKenzie, D.R.; Bilek, M.M.M.; Chu, P.K. Electrochemical corrosion behavior of biodegradable Mg-Y-RE and Mg-Zn-Zr alloys in Ringer’s solution and simulated body fluid. Corros. Sci. 2015, 91, 160–184. [Google Scholar] [CrossRef]
- Jamesh, M.I.; Wu, G.S.; Zhao, Y.; Jing, W.H.; McKenzie, D.R.; Bilek, M.M.M.; Chu, P.K. Effects of zirconium and nitrogen plasma immersion ion implantation on the electrochemical corrosion behavior of Mg-Y-RE alloy in simulated body fluid and cell culture medium. Corros. Sci. 2014, 86, 239–251. [Google Scholar] [CrossRef]
- Chu, P.W.; Marquis, E.A. Linking the microstructure of a heat-treated WE43 Mg alloy with its corrosion behavior. Corros. Sci. 2015, 101, 94–104. [Google Scholar] [CrossRef]
- Chen, Y.J.; Xu, Z.G.; Smith, C.; Sankar, J. Recent advances on the development of magnesium alloys for biodegradable implants. Acta Biomater. 2014, 10, 4561–4573. [Google Scholar] [CrossRef] [PubMed]
- Cao, H.; Wessén, M. Corrosion Mechanisms of Magnesium Alloys. Metall. Mater. Trans. A 2004, 35, 309–319. [Google Scholar] [CrossRef]
- Ralston, K.D.; Birbilis, N. Effect of grain size on corrosion: A review. Corrosion 2010, 66, 1–13. [Google Scholar] [CrossRef]
- Birbilis, N.; Ralston, K.D.; Virtanen, S.; Fraser, H.L.; Davies, C.H.J. Grain character influences on corrosion of ECAPed pure magnesium. Corros. Eng. Sci. Technol. 2010, 45, 224–230. [Google Scholar] [CrossRef]
- Cao, G.H.; Zhang, D.T.; Zhang, W.; Qiu, C. Microstructure evolution and mechanical properties of Mg-Nd-Y alloy in different friction stir processing conditions. J. Alloys Compd. 2015, 636, 12–19. [Google Scholar] [CrossRef]
- Coy, A.E.; Viejo, F.; Skeldon, P.; Thompson, G.E. Susceptibility of rare-earth-magnesium alloys to micro-galvanic corrosion. Corros. Sci. 2010, 52, 3896–3906. [Google Scholar] [CrossRef]
- Song, G.; Atrens, A.; Dargusch, M. Influence of microstructure on the corrosion of diecast AZ91D. Corros. Sci. 1999, 41, 249–273. [Google Scholar] [CrossRef]
- Lunder, O.; Aune, T.K.; Nisancioglu, K. Effect of Mn Additions on the Corrosion Behavior of Mould-Cast Magnesium ASTM AZ91. Corrosion 1987, 43, 291–295. [Google Scholar] [CrossRef]


| Mg | Y | Nd | Zr | Al | Ni | Si | Ca | Zn |
|---|---|---|---|---|---|---|---|---|
| Bal. | 4.27 | 2.94 | 0.51 | 0.07 | 0.05 | 0.05 | 0.04 | 0.01 |
© 2016 by the authors; licensee MDPI, Basel, Switzerland. This article is an open access article distributed under the terms and conditions of the Creative Commons Attribution (CC-BY) license (http://creativecommons.org/licenses/by/4.0/).
Share and Cite
Cao, G.; Zhang, D.; Zhang, W.; Zhang, W. In Vitro Corrosion Study of Friction Stir Processed WE43 Magnesium Alloy in a Simulated Body Fluid. Materials 2016, 9, 542. https://doi.org/10.3390/ma9070542
Cao G, Zhang D, Zhang W, Zhang W. In Vitro Corrosion Study of Friction Stir Processed WE43 Magnesium Alloy in a Simulated Body Fluid. Materials. 2016; 9(7):542. https://doi.org/10.3390/ma9070542
Chicago/Turabian StyleCao, Genghua, Datong Zhang, Weiwen Zhang, and Wen Zhang. 2016. "In Vitro Corrosion Study of Friction Stir Processed WE43 Magnesium Alloy in a Simulated Body Fluid" Materials 9, no. 7: 542. https://doi.org/10.3390/ma9070542