4.1. Tension–Tension Fatigue Hysteresis Loops at 1000 °C in Steam
Michael [
26] investigated the tension–tension cyclic fatigue behavior of 2D woven SiC/SiC composite at 1000 °C in steam. The fatigue tests were conducted at the loading frequency of
f = 1.0 Hz with a stress ratio of 0.1. The material properties of 2D SiC/SiC composite are given by [
26]:
Vf = 21.5%,
Ef = 150 GPa,
Em = 60 GPa,
rf = v7.5 μm,
ζd = 0.1 J/m
2,
αf = 4.6 × 10
−6/°C,
αm = 4.38 × 10
−6/°C, and ΔT = −400 °C.
When
σmax = 60 MPa, the experimental and theoretical hysteresis loops, and the interface slip of matrix cracking modes 3 and 5 corresponding to cycle number
N = 2, 10,000, 100,000, 150,000, and 190,000 are illustrated in
Figure 2,
Figure 3,
Figure 4,
Figure 5 and
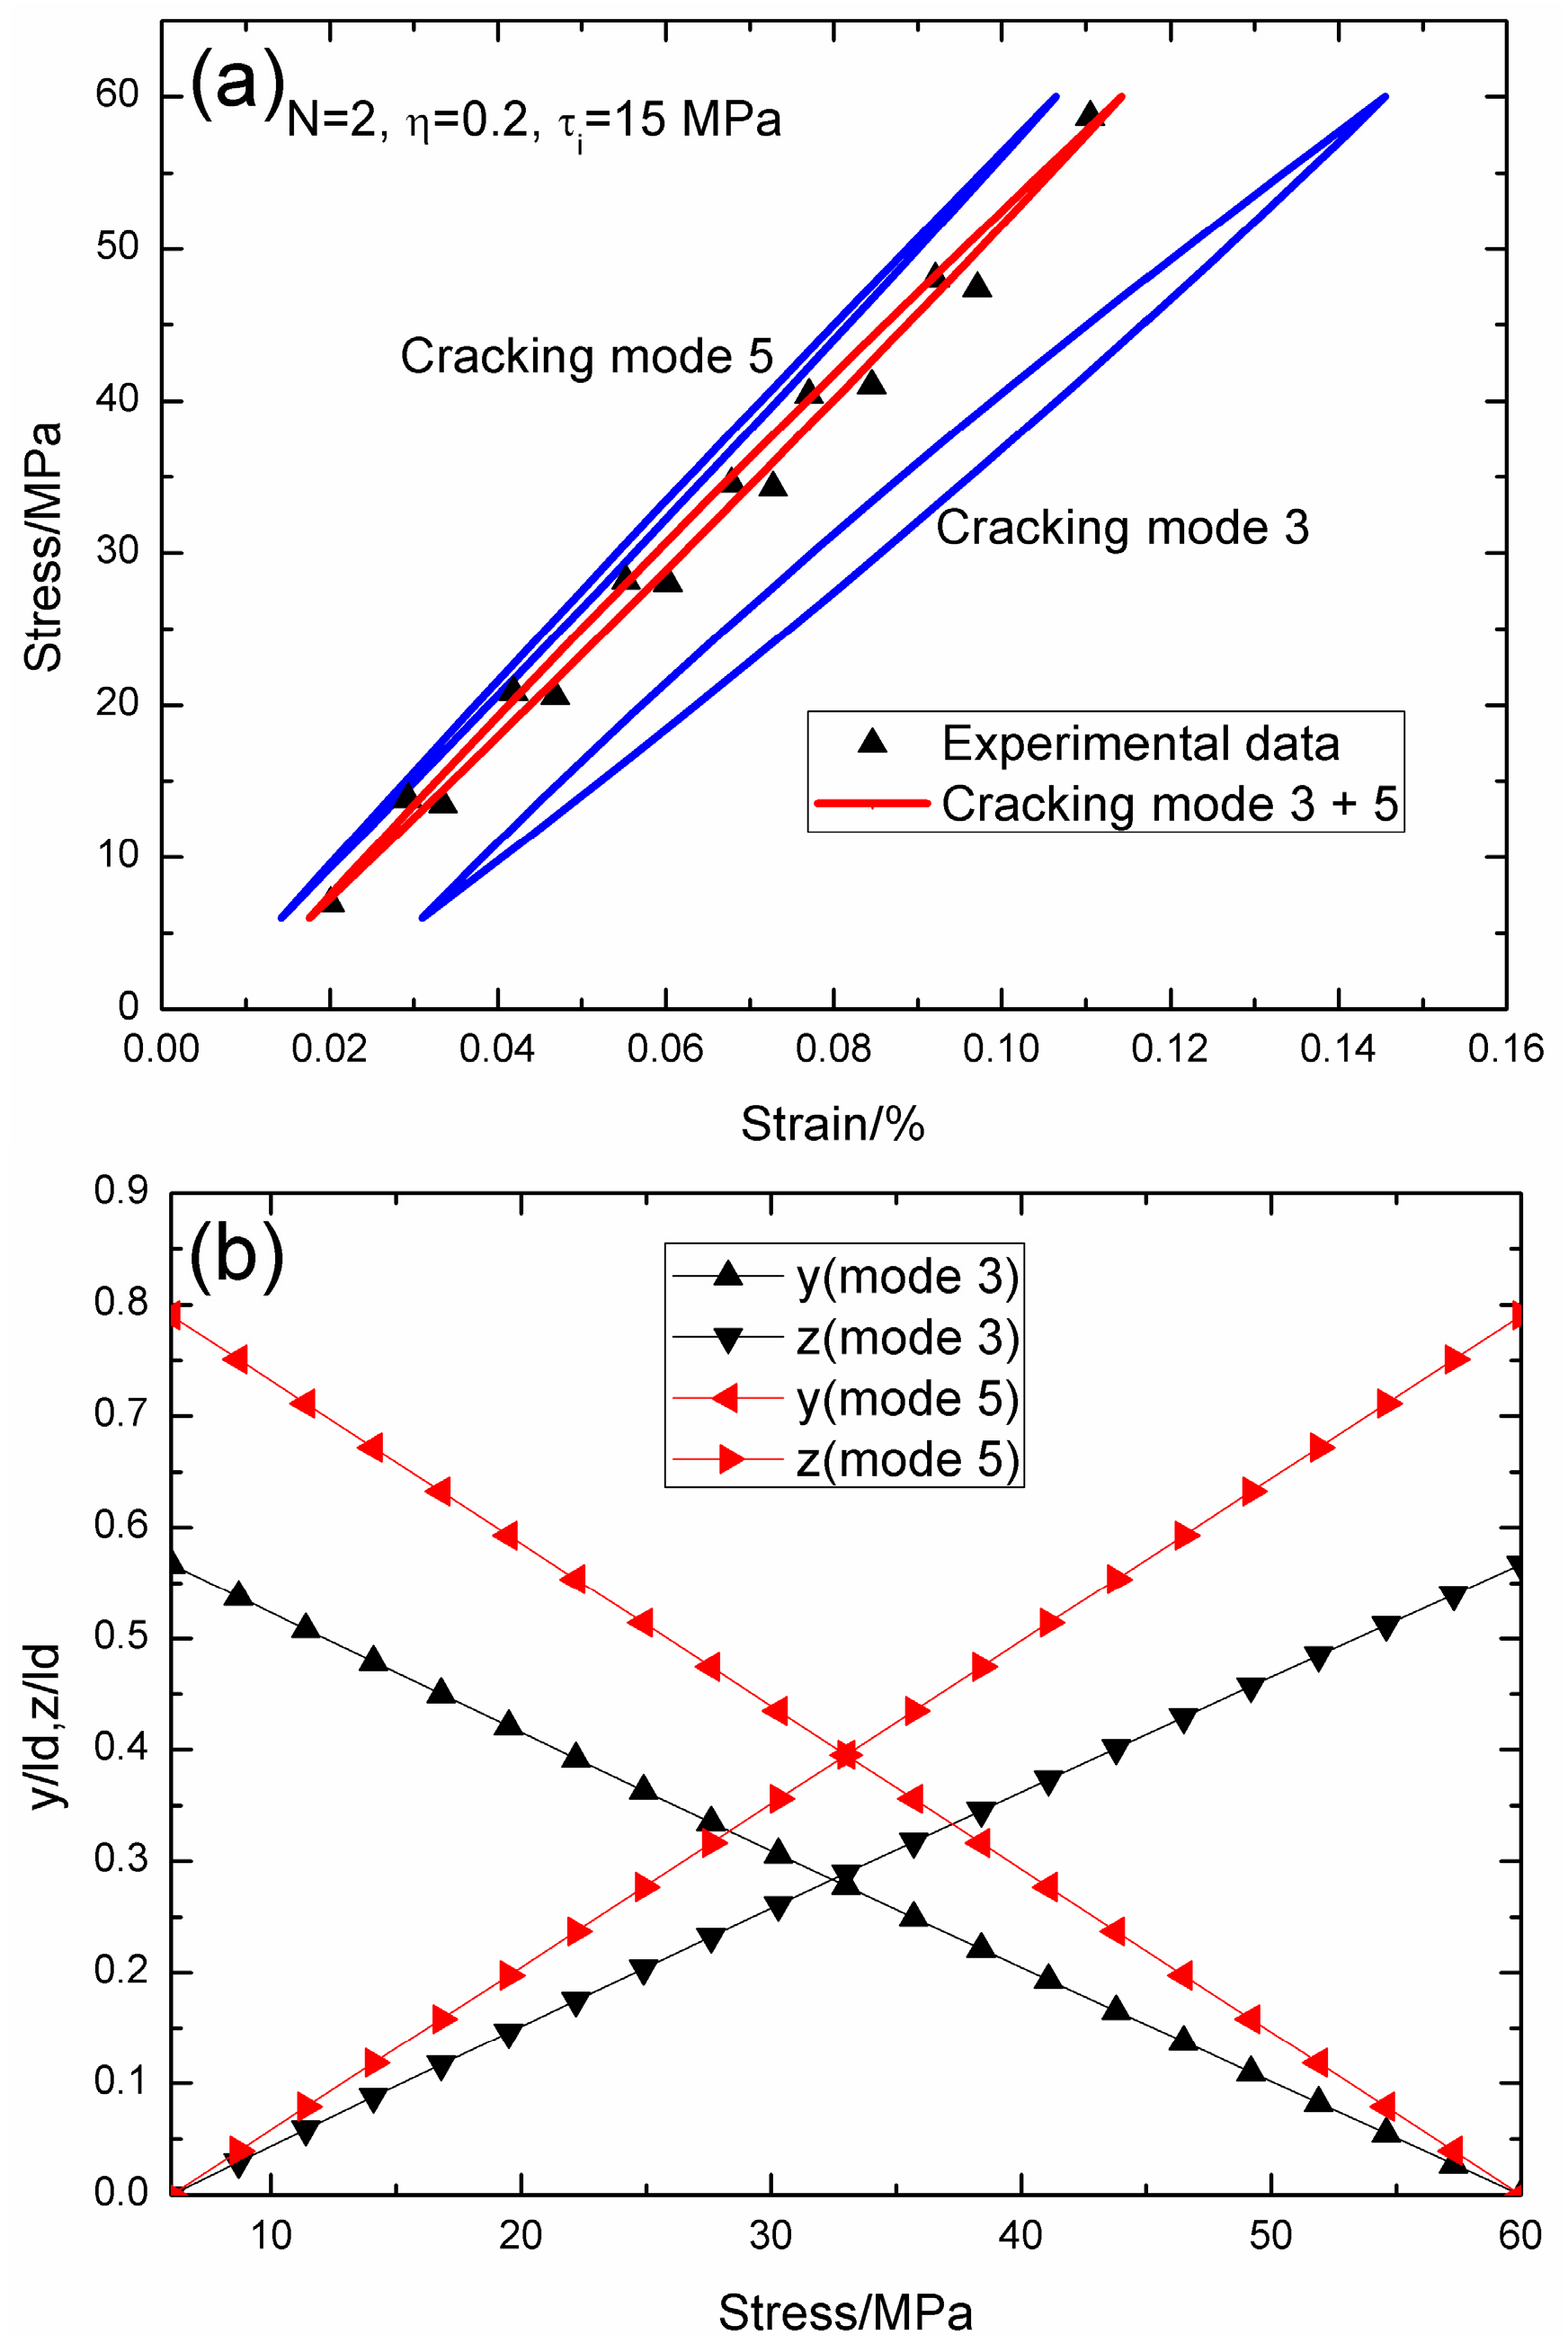
Figure 6. When
N = 2, the hysteresis loops of matrix cracking modes 3 mode 5, the composite and experimental data are given in
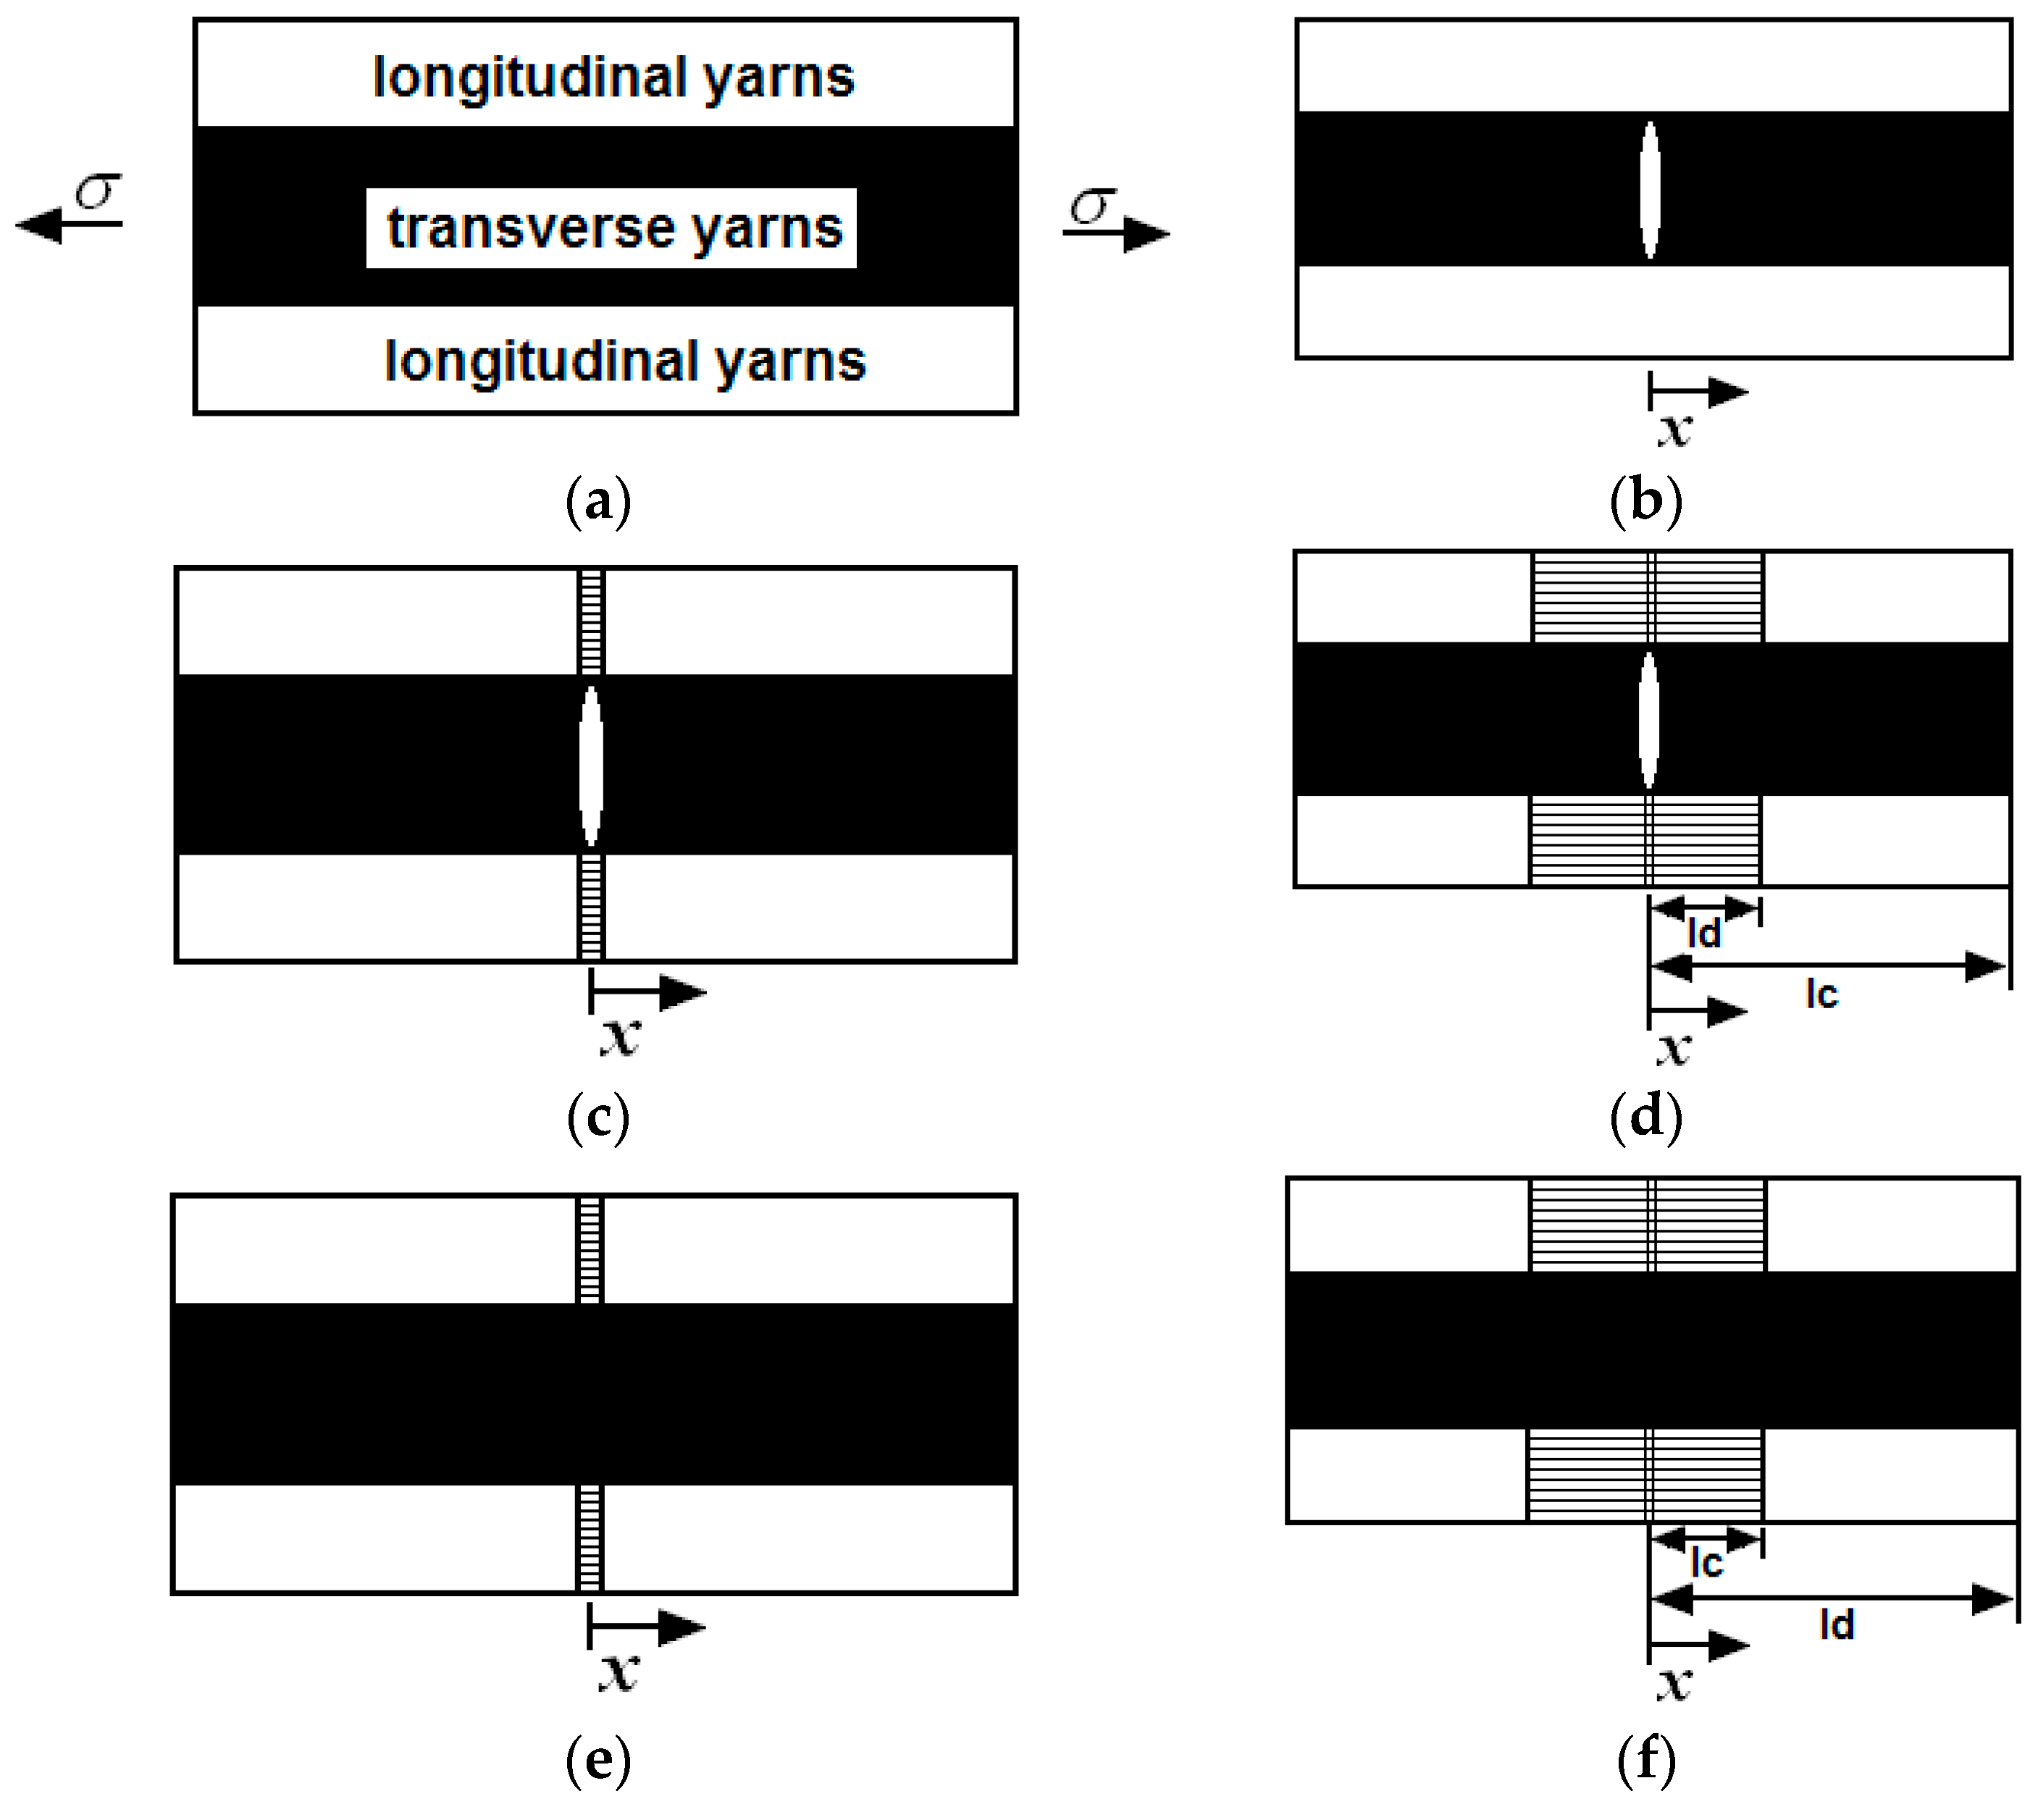
Figure 2a, in which the proportion of matrix cracking mode 3 is
η = 0.2. For matrix cracking mode 3, the hysteresis loops correspond to interface slip Case 2, as shown in
Figure 2b. Upon unloading to the valley stress, the interface counter-slip length approaches 56.6% of the interface debonded length,
i.e.,
y(
σmin)/
ld = 56.6%; and upon reloading to the peak stress, the interface new slip length approaches 56.6% of the interface debonded length,
i.e.,
z(
σmax)/
ld = 56.6%. For matrix cracking mode 5, the hysteresis loops correspond to interface slip Case 2, as shown in
Figure 2b. Upon unloading to the valley stress, the interface counter-slip length approaches 79% of the interface debonded length,
i.e.,
y(
σmin)/
ld = 79%; and upon reloading to the peak stress, the interface new slip length approaches 79% of the interface debonded length,
i.e.,
z(
σmax)/
ld = 79%.
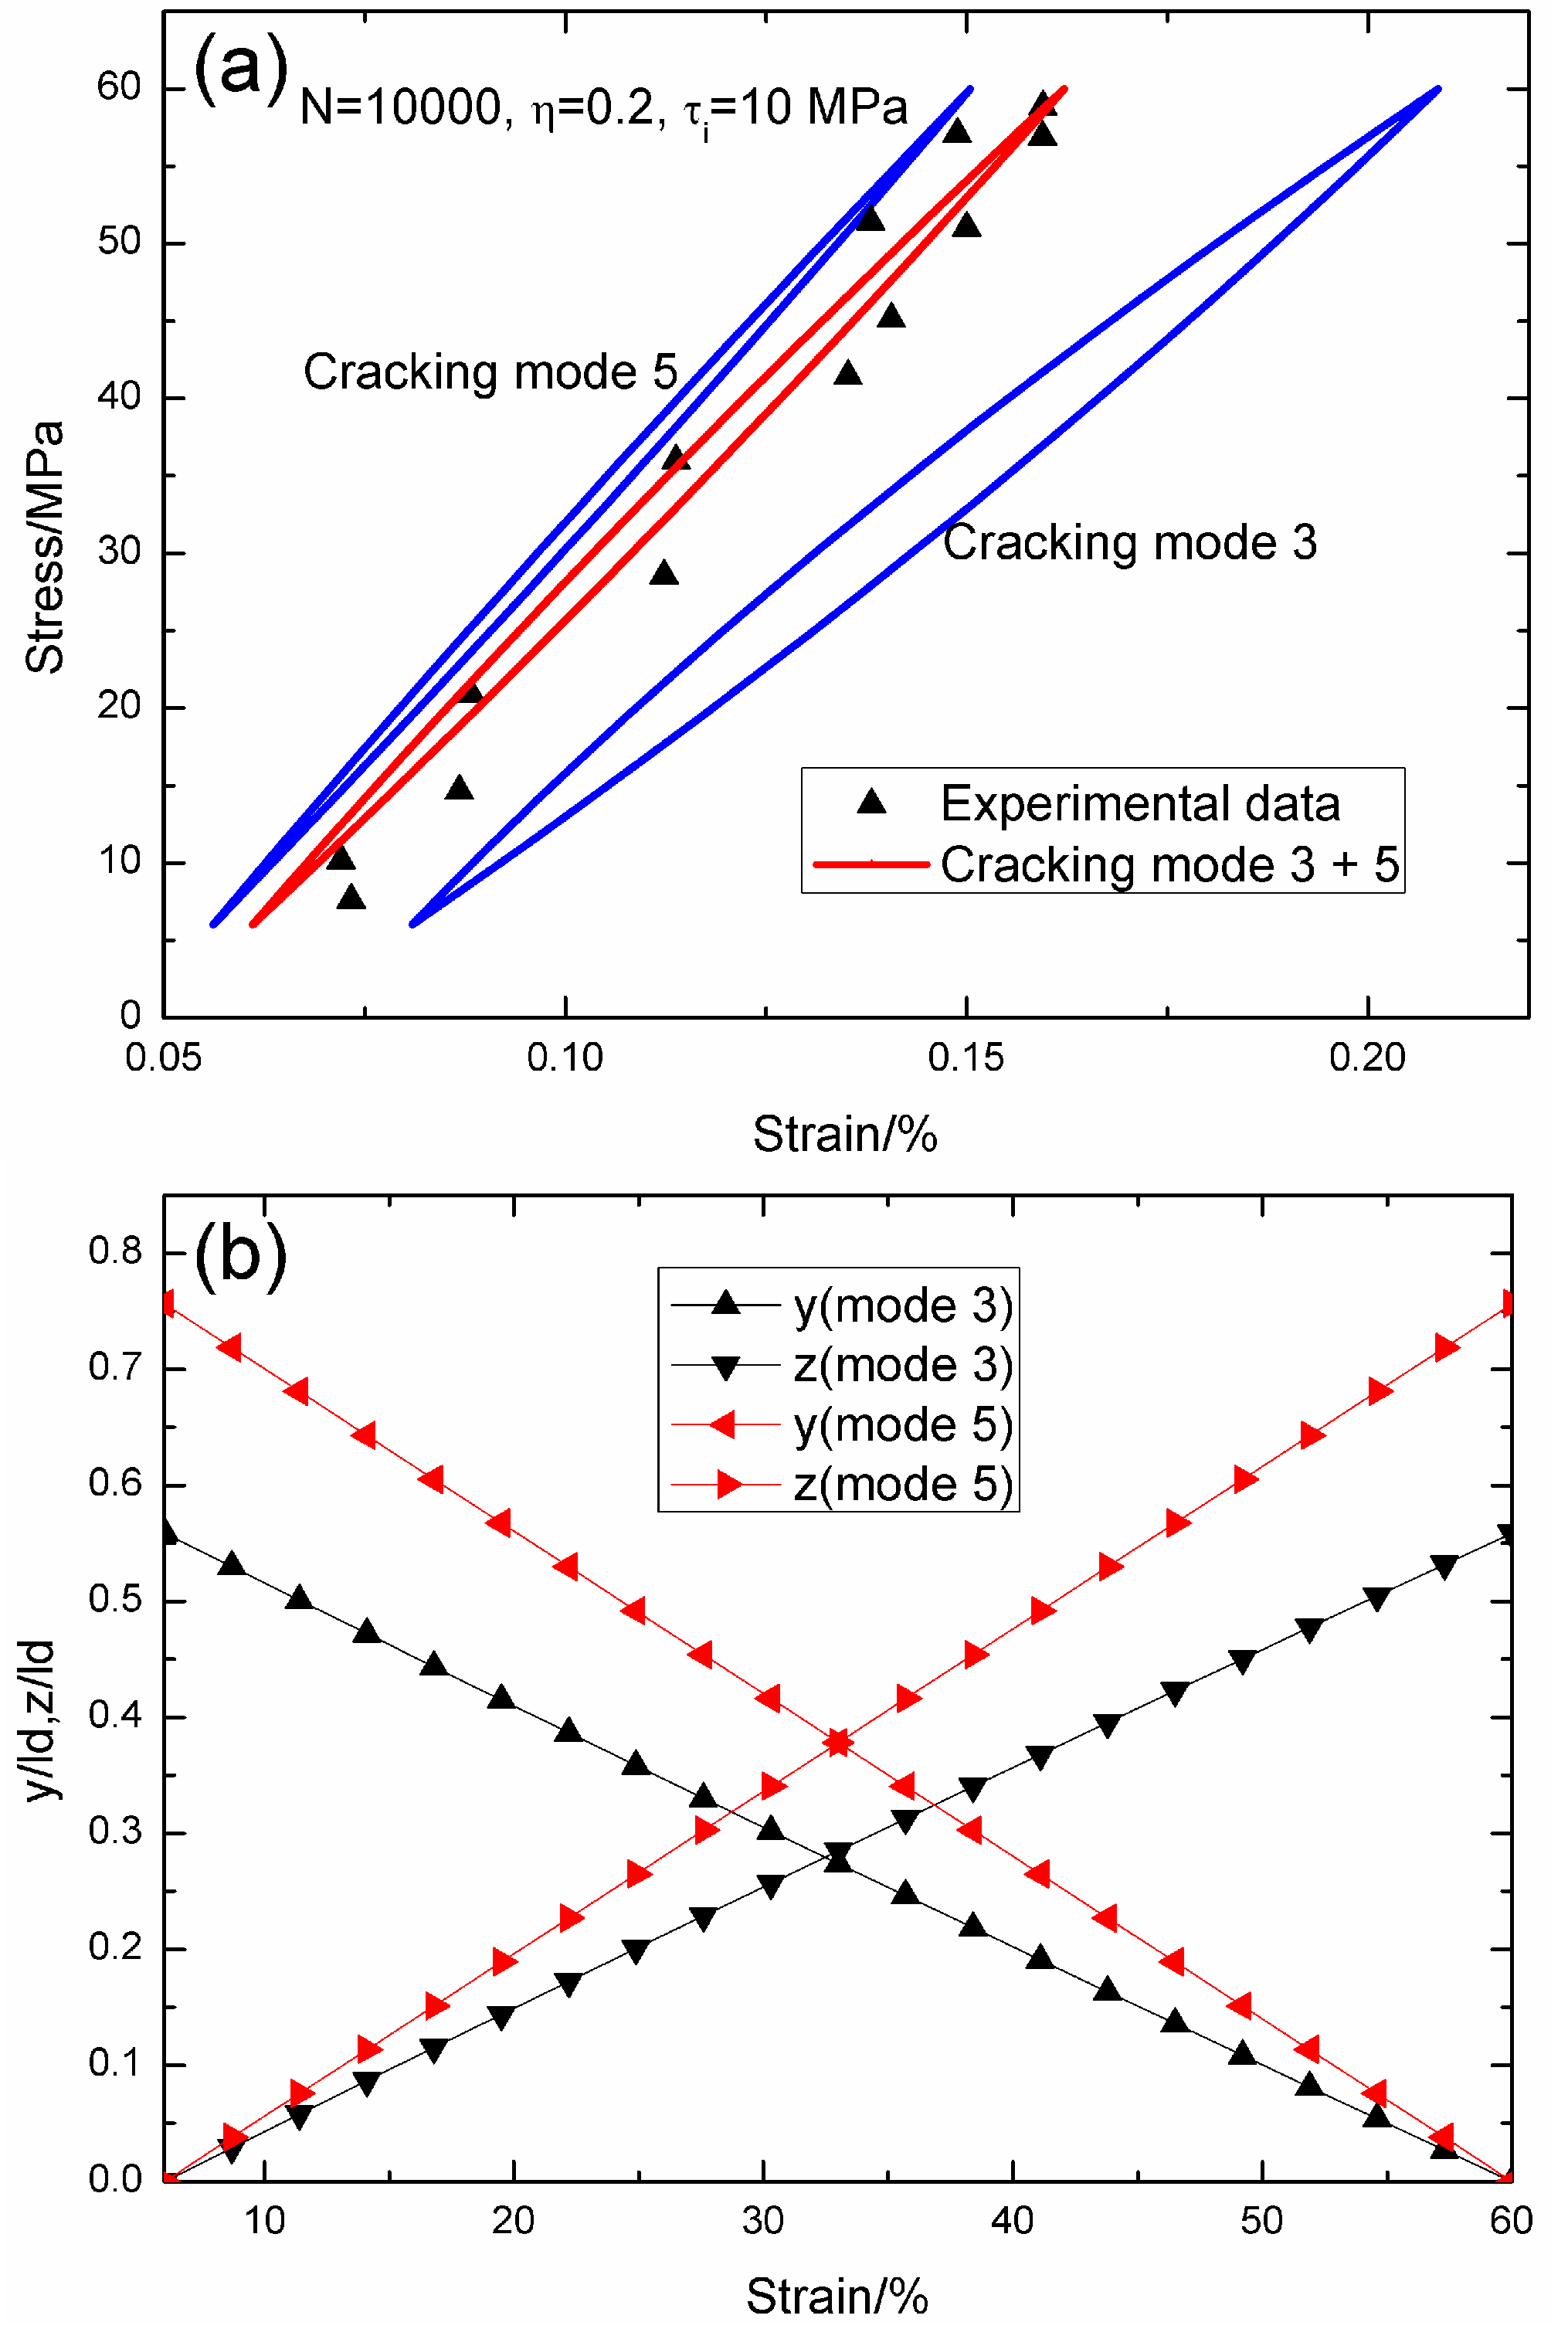
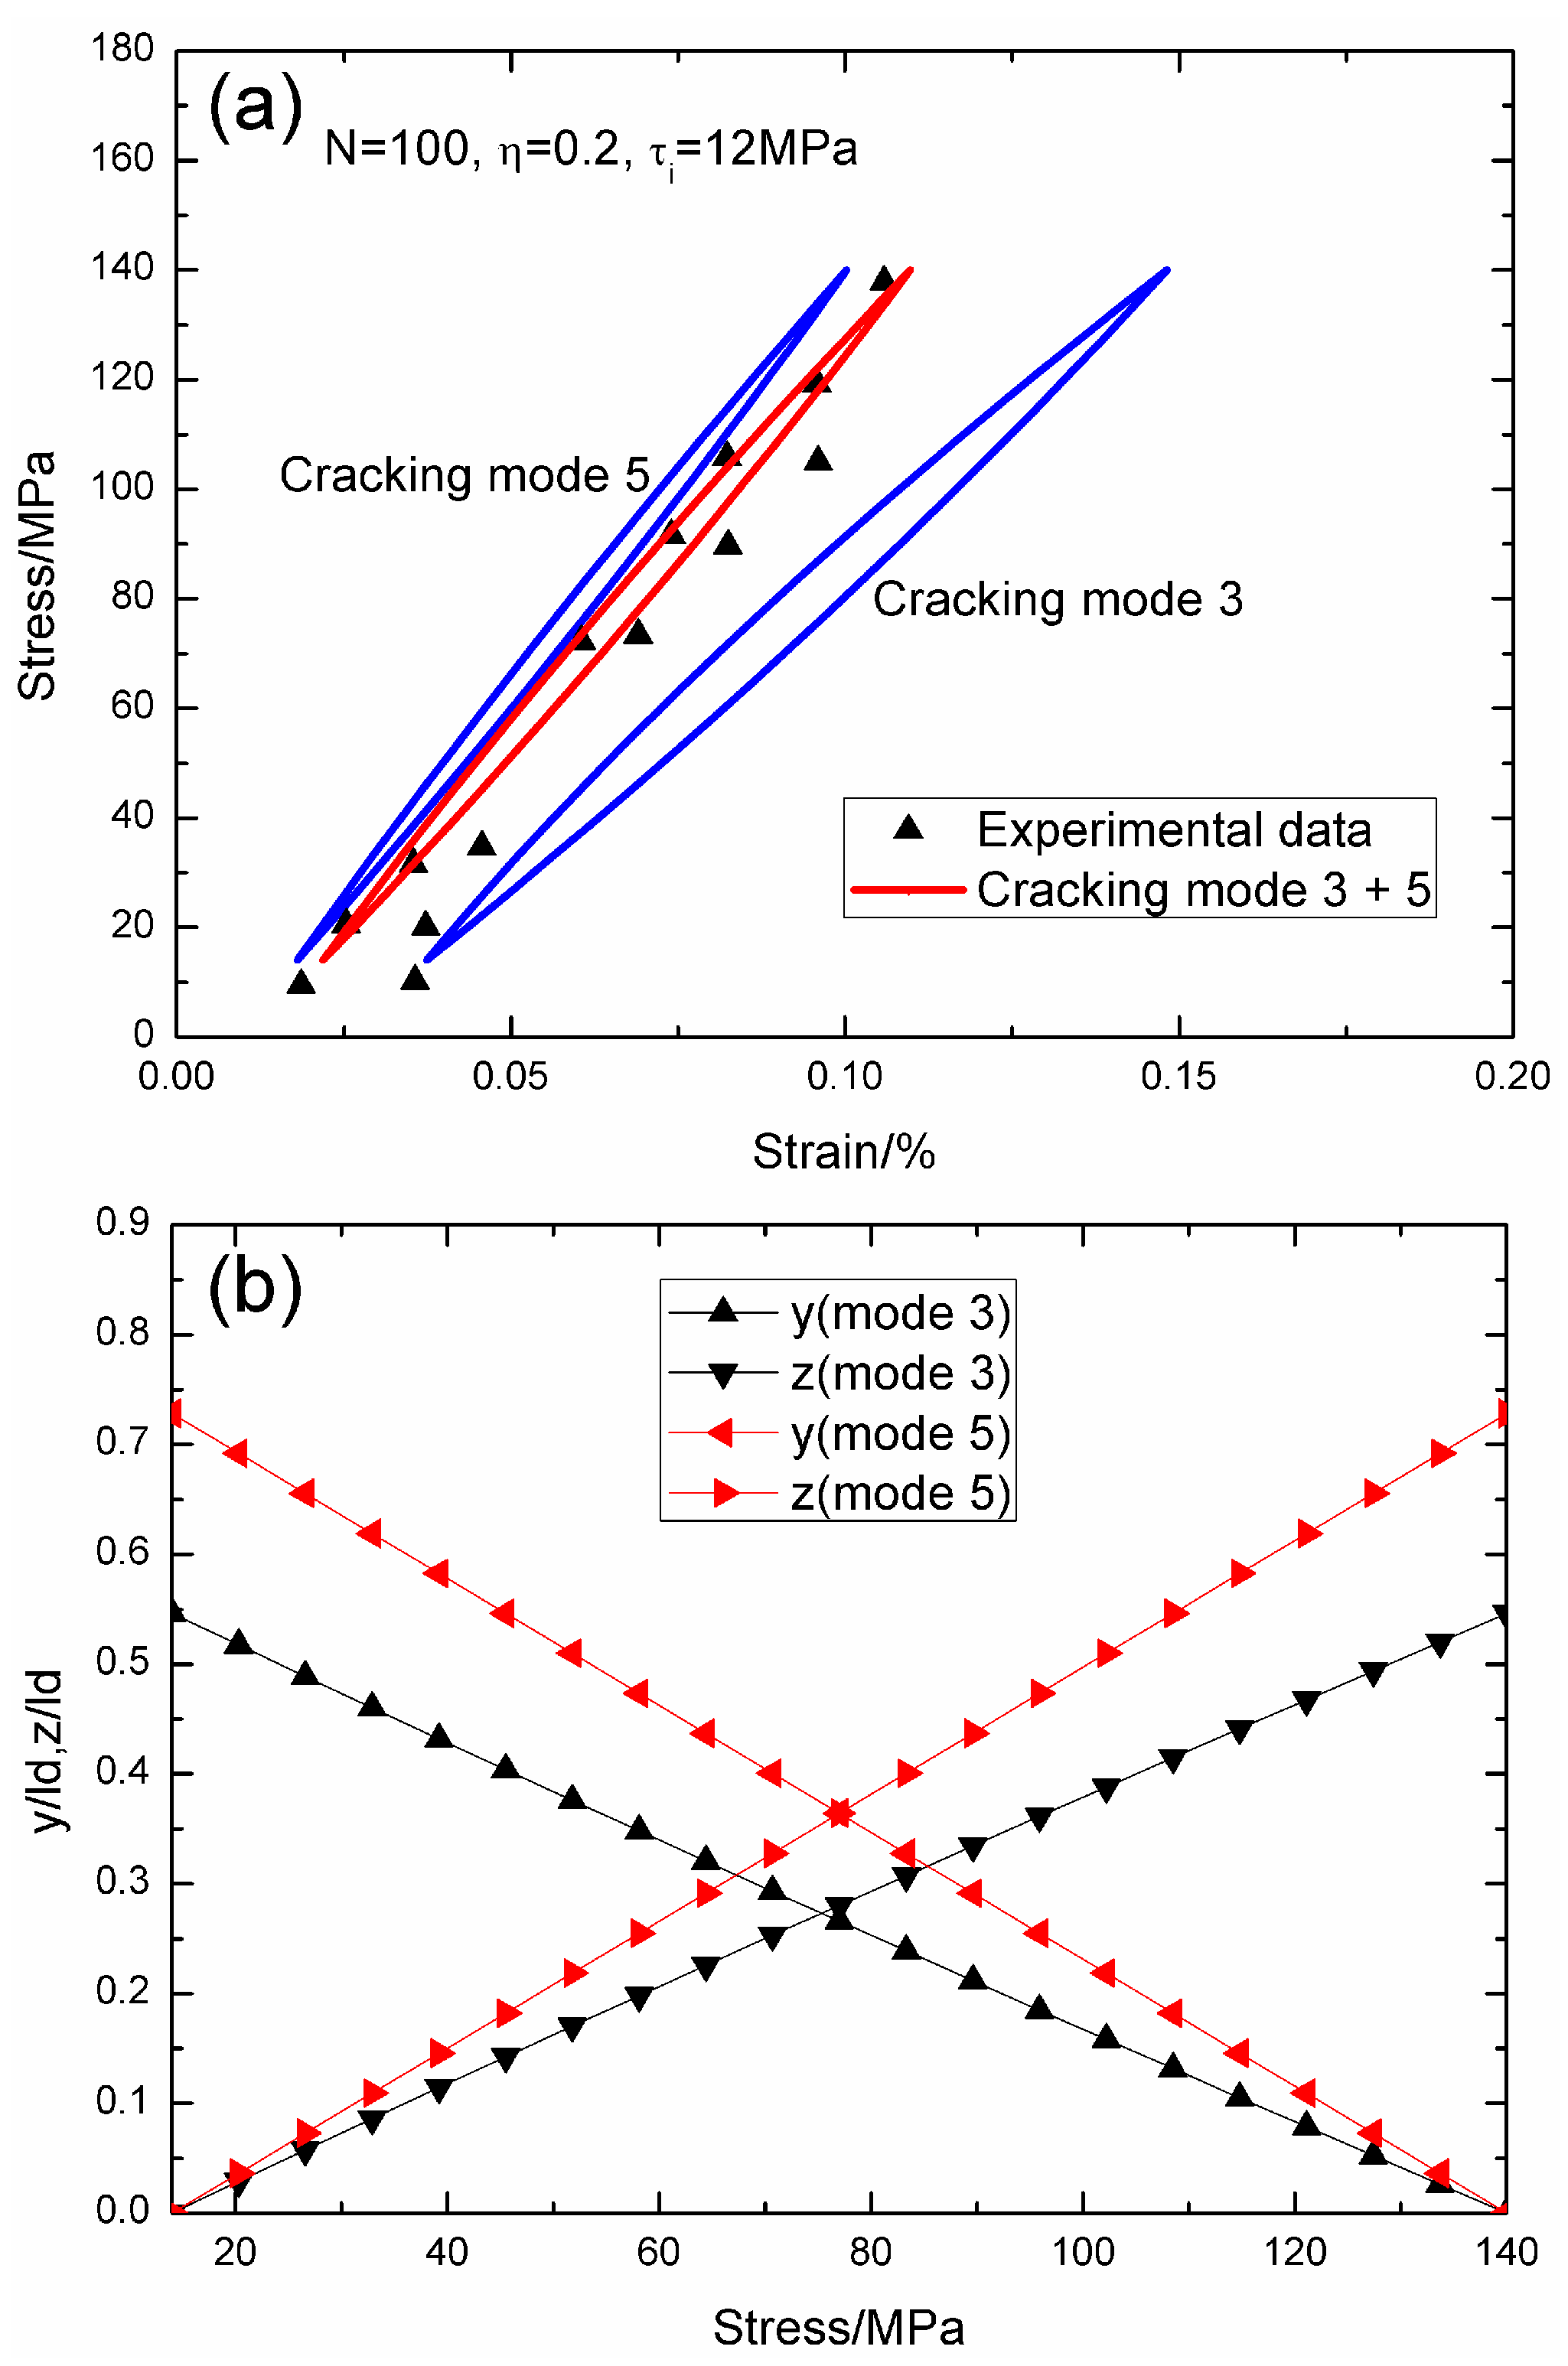
When
N = 10,000, the hysteresis loops of matrix cracking modes 3 and 5, and the composite and experimental data are given in
Figure 3a, in which the proportion of matrix cracking mode 3 is
η = 0.2. For matrix cracking mode 3, the hysteresis loops correspond to interface slip Case 2, as shown in
Figure 3b. Upon unloading to the valley stress, the interface counter-slip length approaches 55.8% of the interface debonded length,
i.e.,
y(
σmin)/
ld = 55.8%; and upon reloading to the peak stress, the interface new slip length approaches 55.8% of the interface debonded length,
i.e.,
z(
σmax)/
ld = 55.8%. For matrix cracking mode 5, the hysteresis loops correspond to interface slip Case 2, as shown in
Figure 3b. Upon unloading to the valley stress, the interface counter-slip length approaches 75.6% of the interface debonded length,
i.e.,
y(
σmin)/
ld = 75.6%; and upon reloading to the peak stress, the interface new slip length approaches 75.6% of the interface debonded length,
i.e.,
z(
σmax)/
ld = 75.6%.
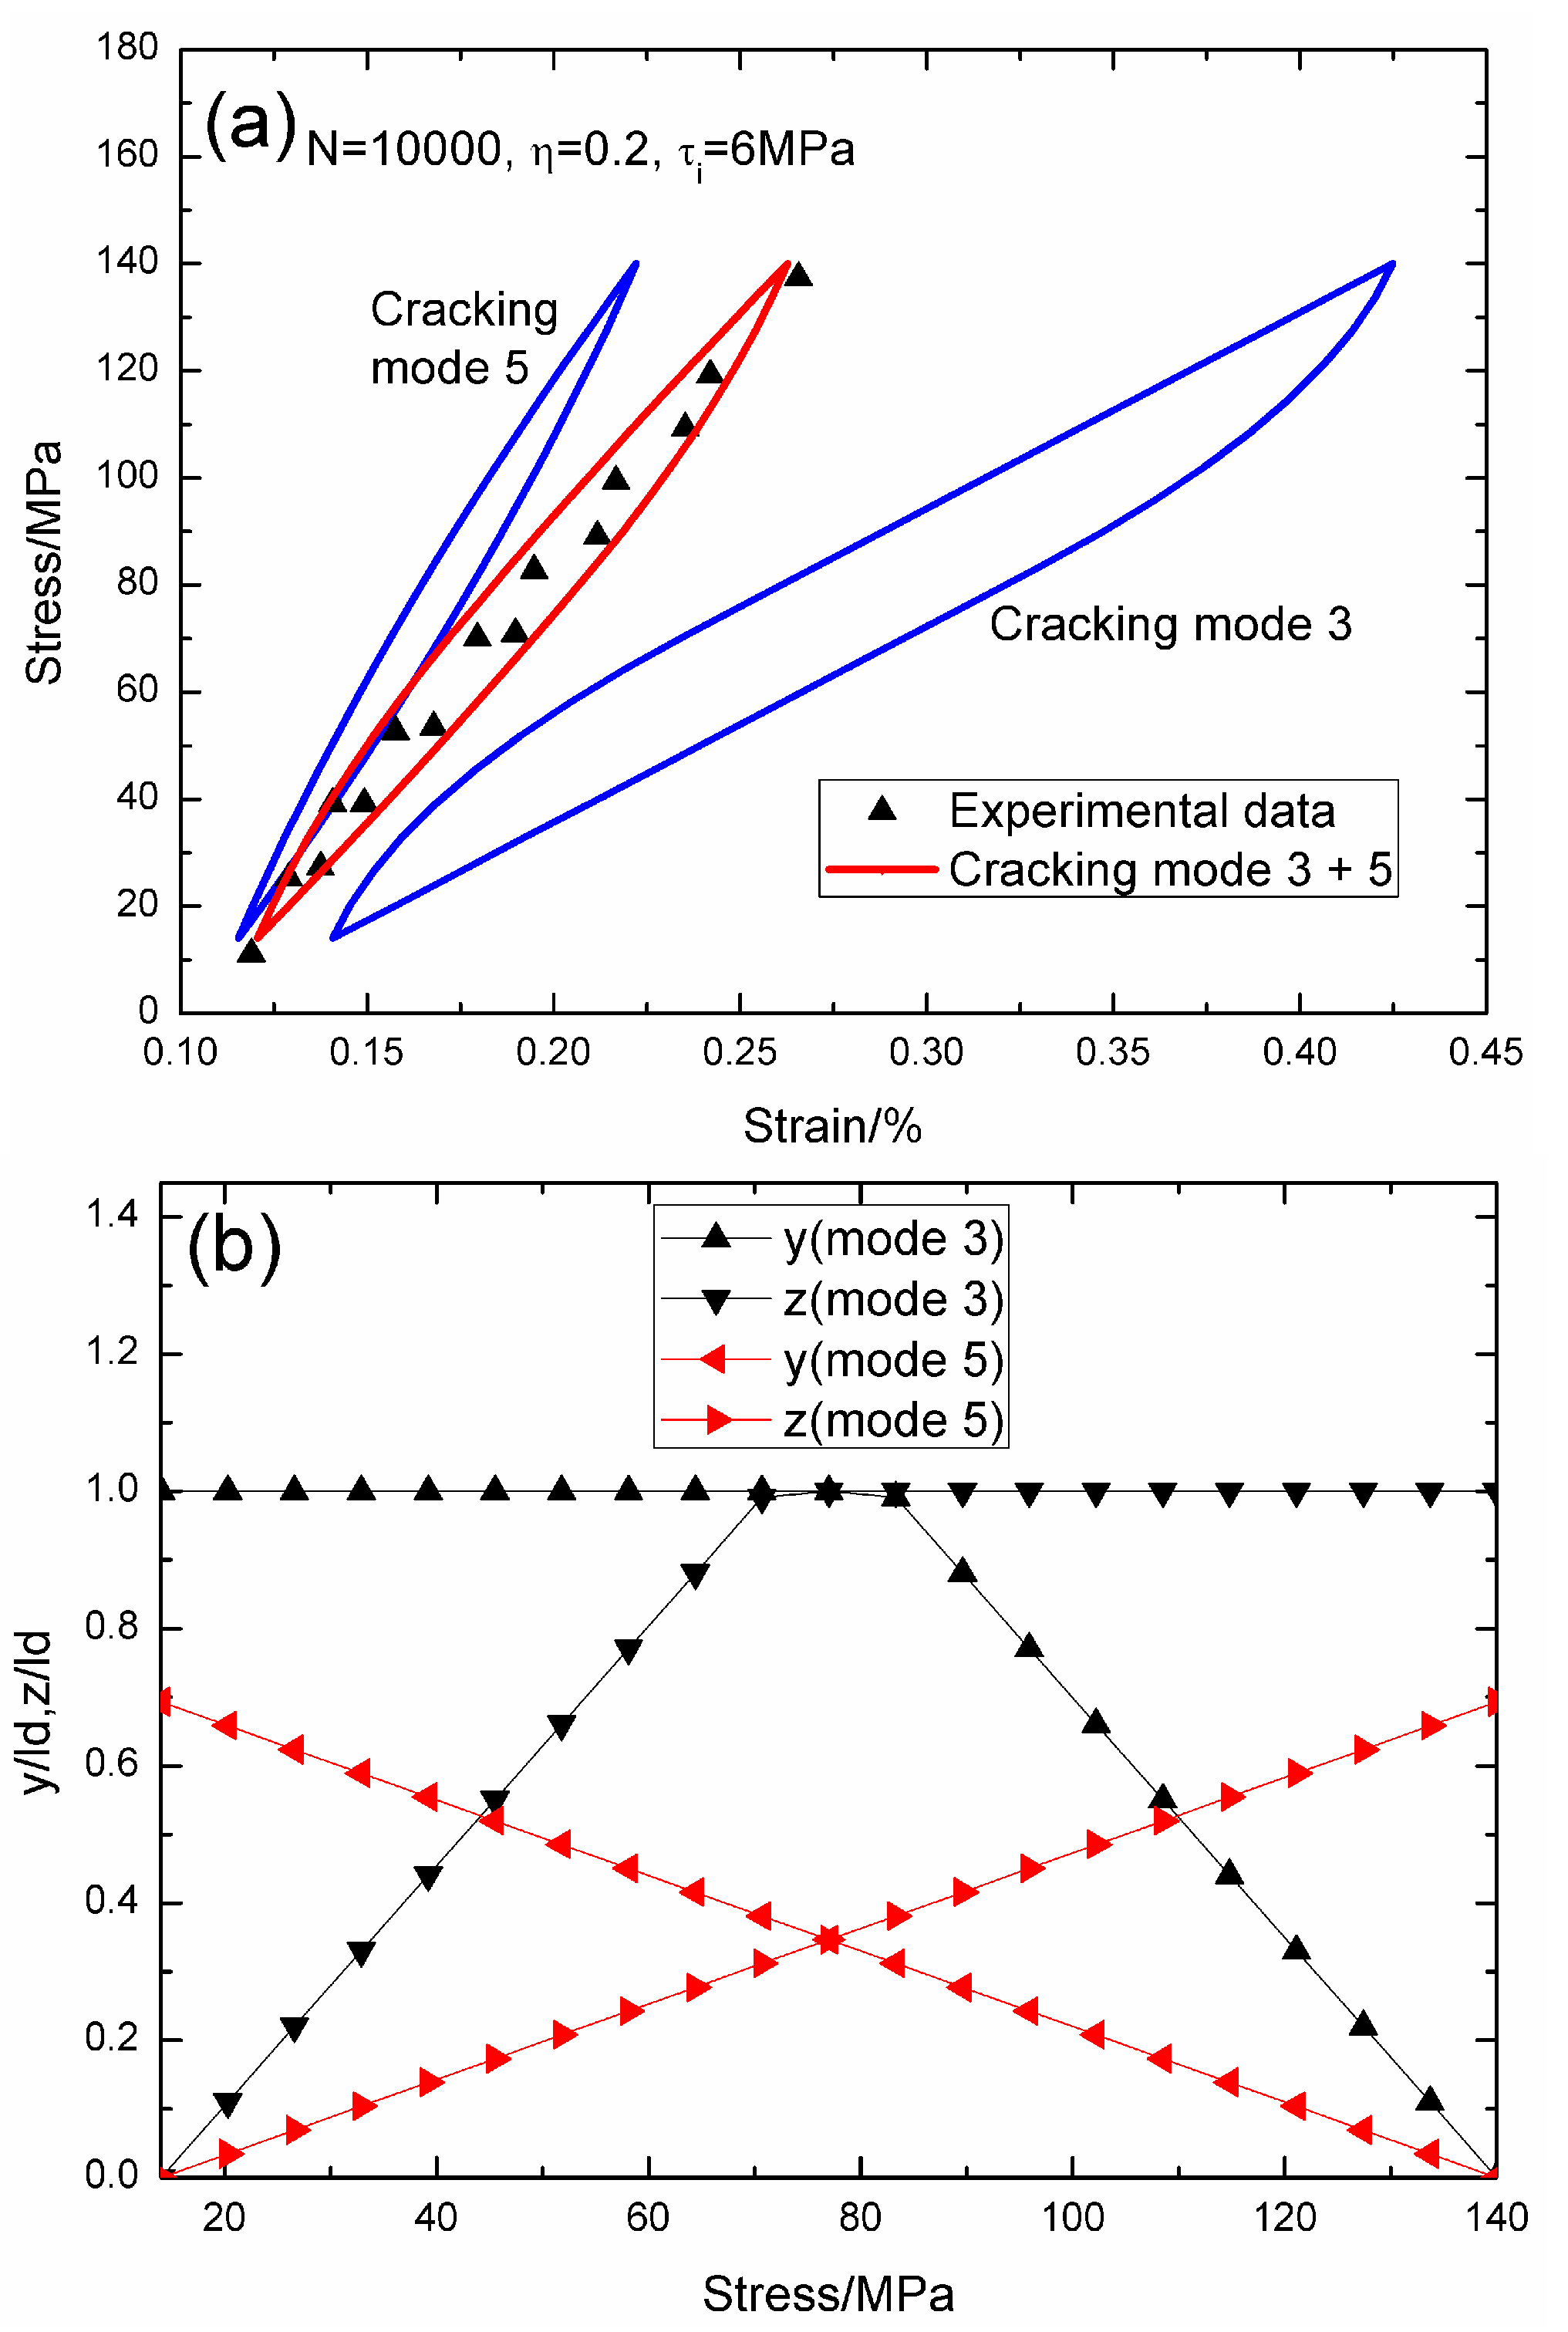
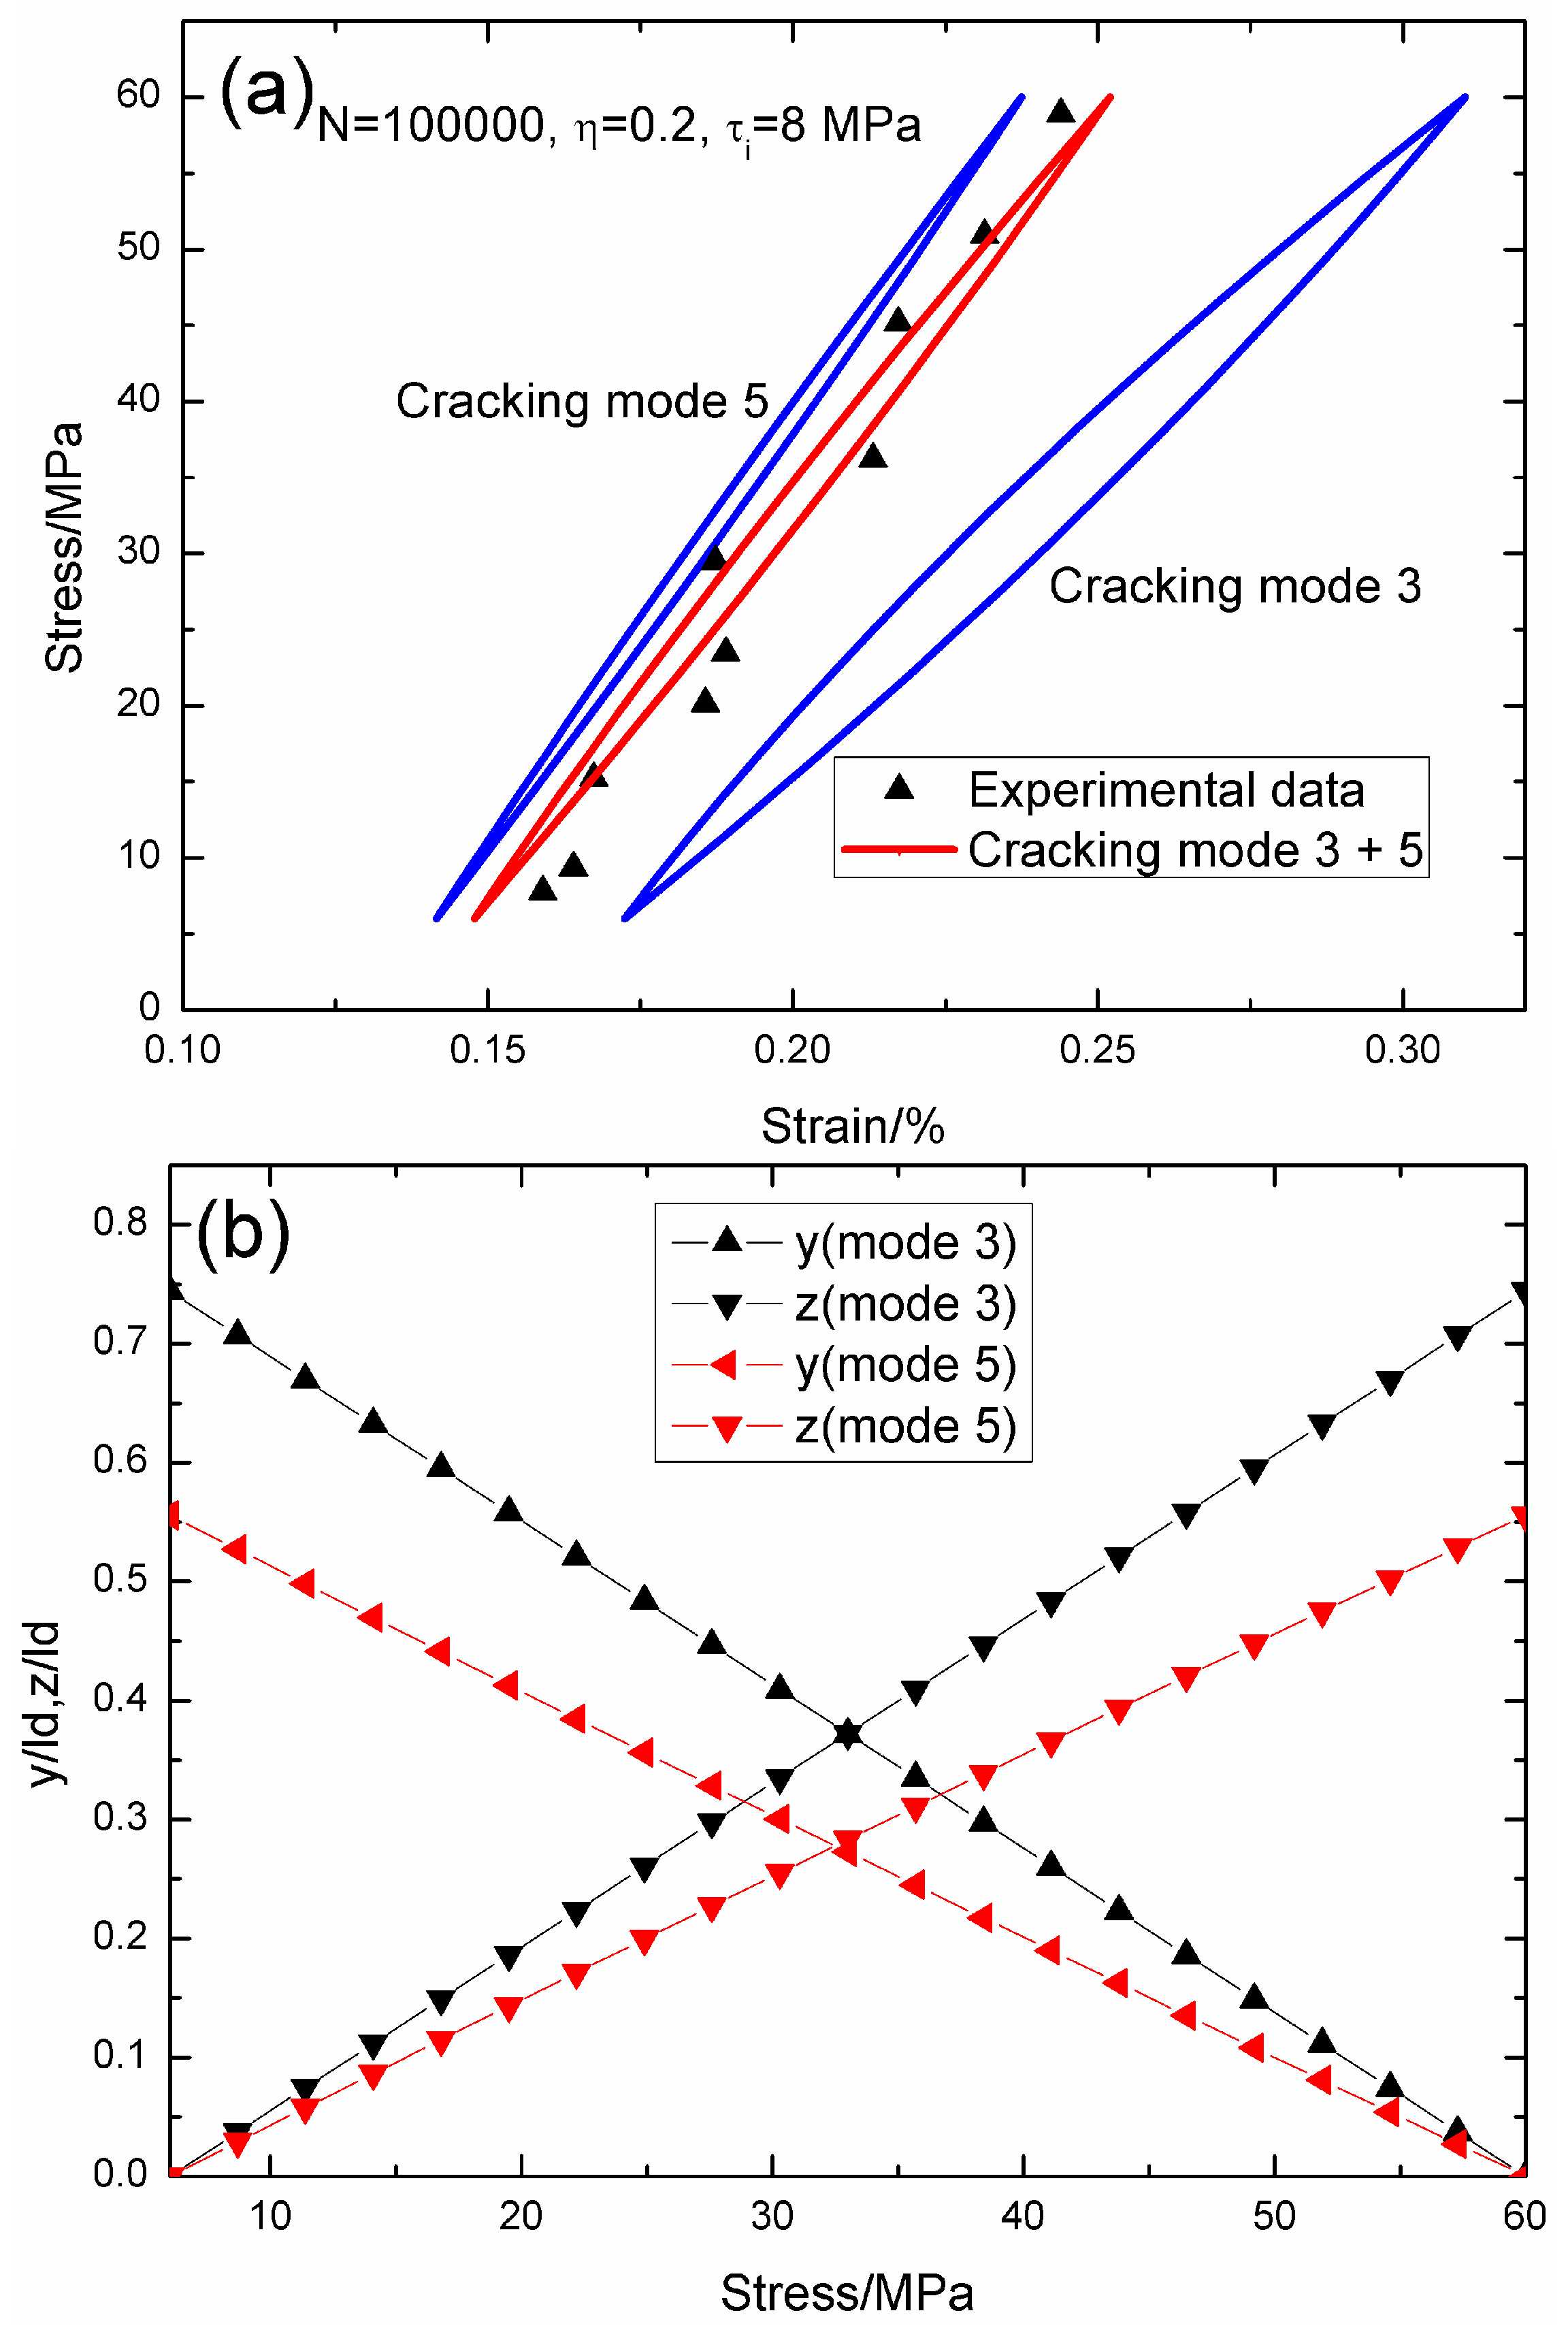
When
N = 100,000, the hysteresis loops of matrix cracking modes 3 and 5, and the composite and experimental data are given in
Figure 4a, in which the proportion of matrix cracking mode 3 is
η = 0.2. For matrix cracking mode 3, the hysteresis loops correspond to interface slip Case 2, as shown in
Figure 4b. Upon unloading to the valley stress, the interface counter-slip length approaches 55.5% of the interface debonded length,
i.e.,
y(
σmin)/
ld = 55.5%; and upon reloading to the peak stress, the interface new slip length approaches 55.5% of the interface debonded length,
i.e.,
z(
σmax)/
ld = 55.5%. For matrix cracking mode 5, the hysteresis loops correspond to interface slip Case 2, as shown in
Figure 4b. Upon unloading to the valley stress, the interface counter-slip length approaches 74.4% of the interface debonded length,
i.e.,
y(
σmin)/
ld = 74.4%; and upon reloading to the peak stress, the interface new slip length approaches 74.4% of the interface debonded length,
i.e.,
z(
σmax)/
ld = 74.4%.
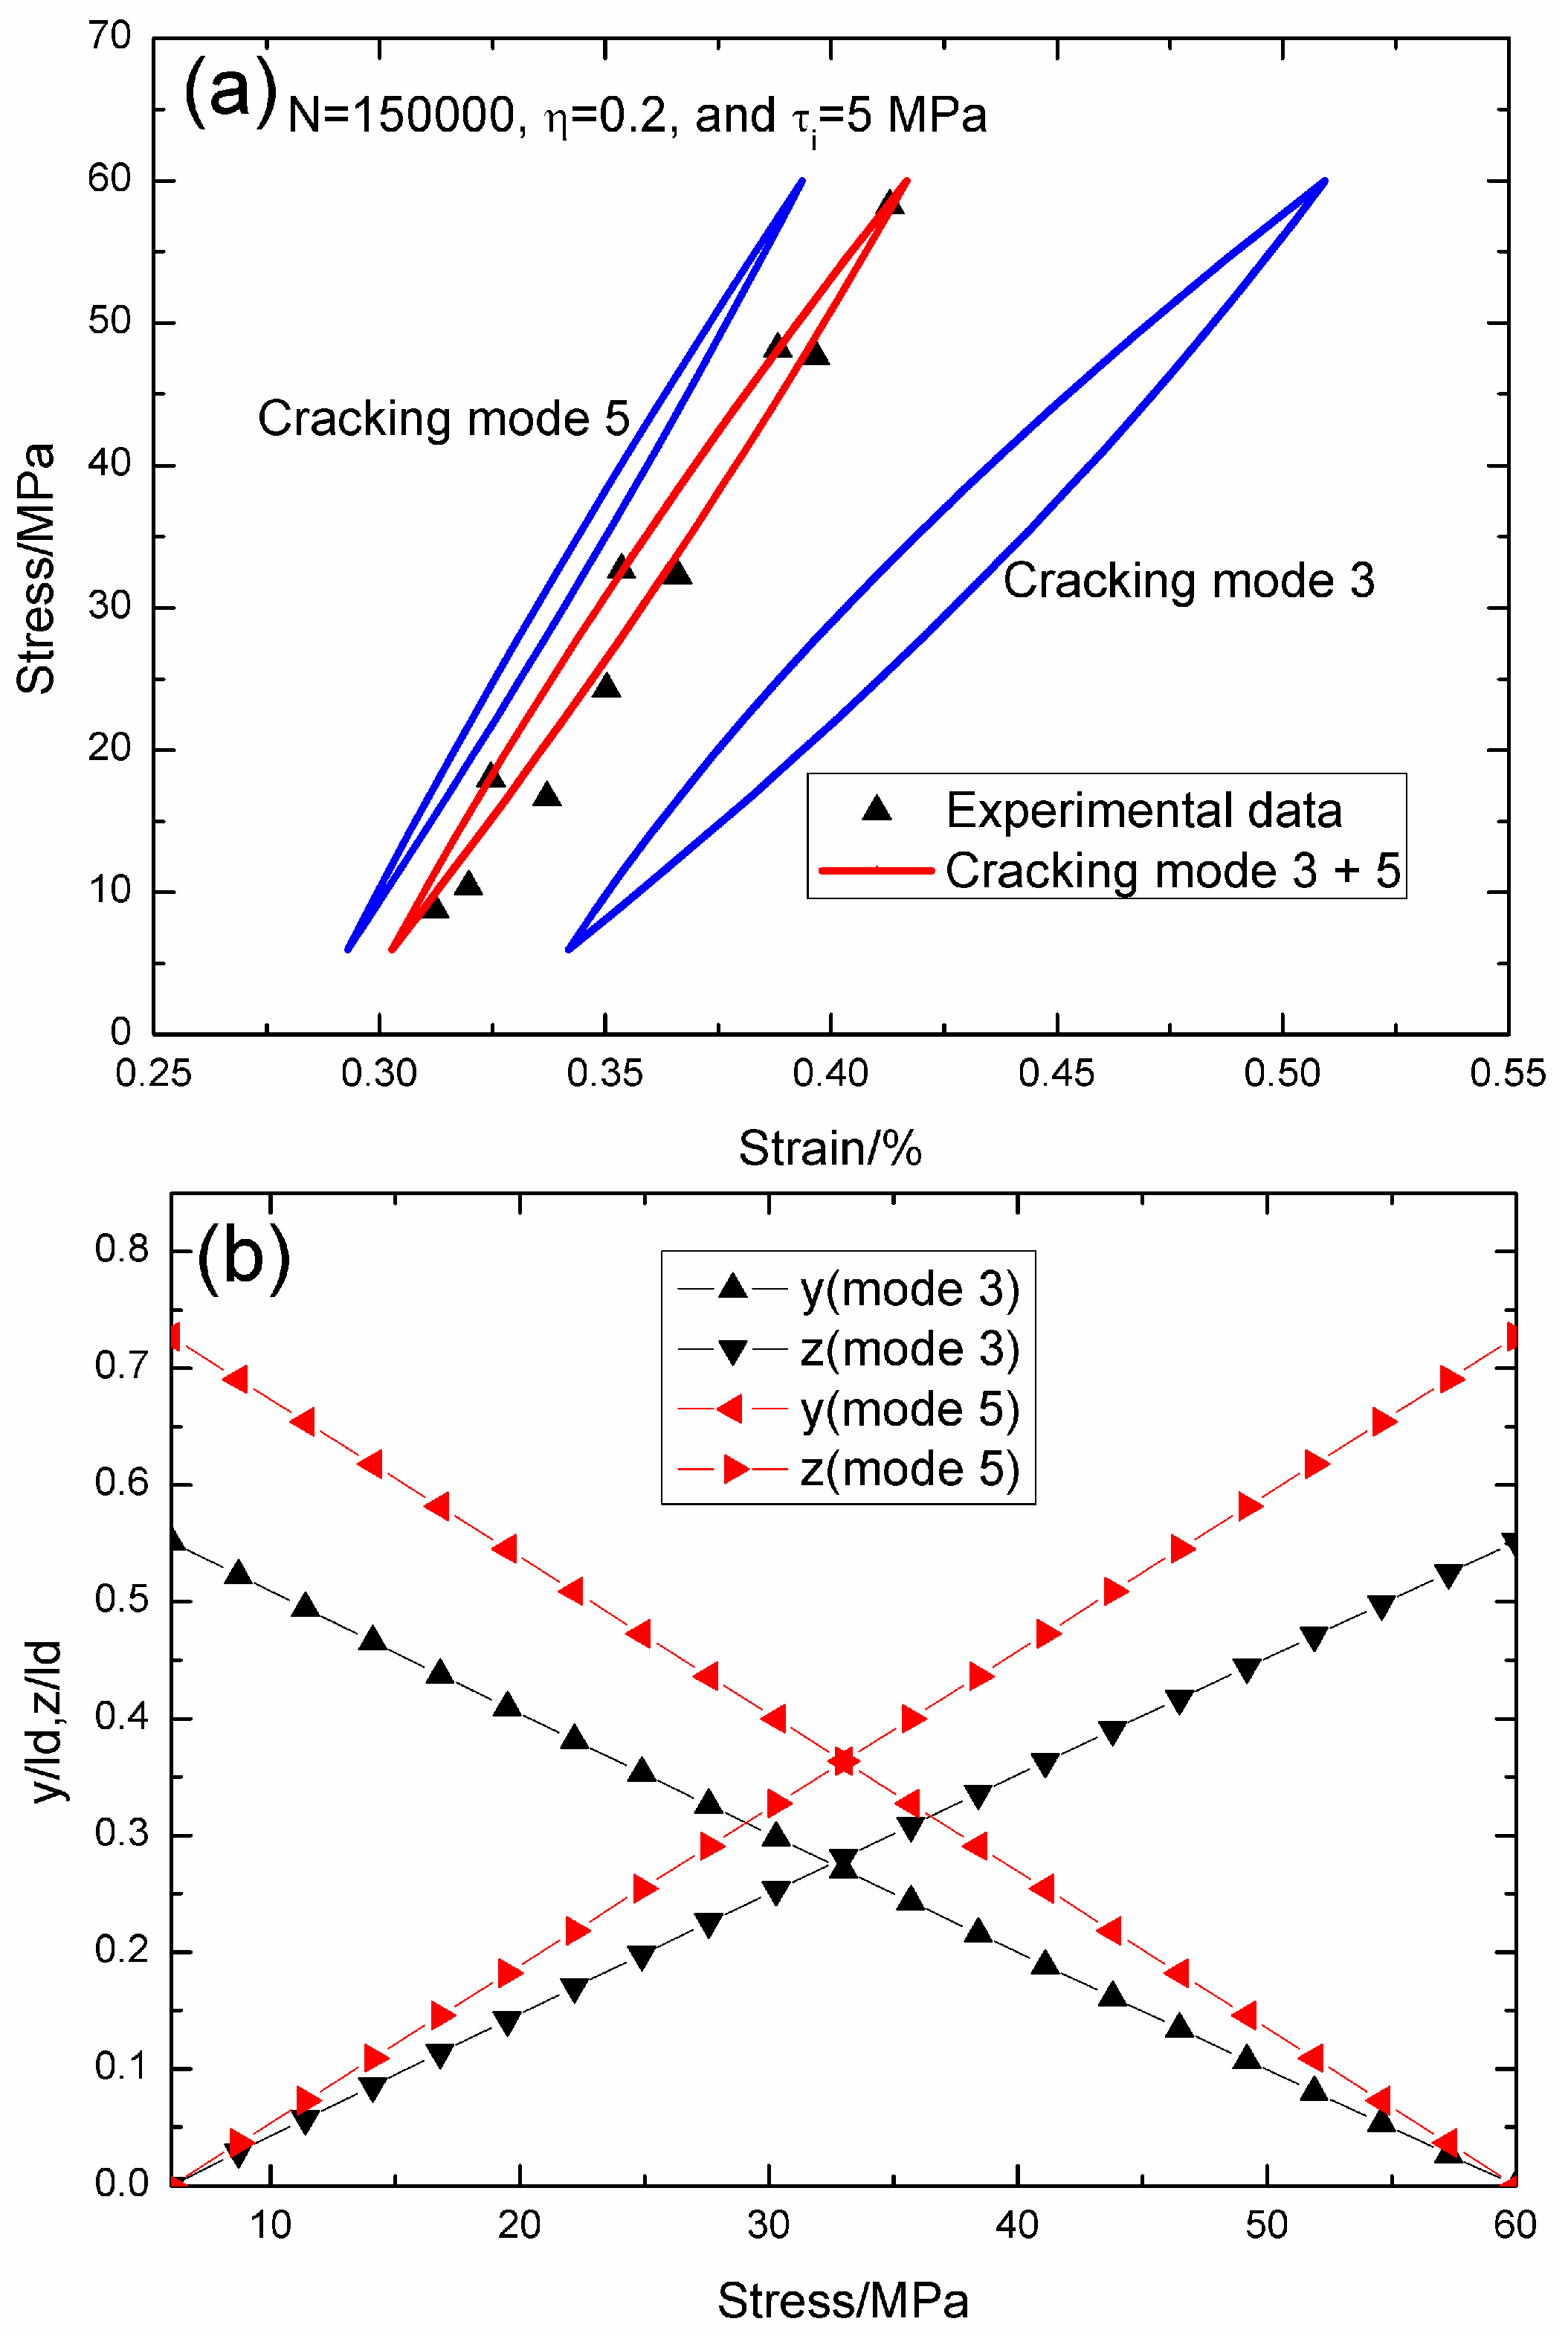
When
N = 150,000, the hysteresis loops of matrix cracking modes 3 and 5, and the composite and experimental data are given in
Figure 5a, in which the proportion of matrix cracking mode 3 is
η = 0.2. For matrix cracking mode 3, the hysteresis loops correspond to interface slip Case 2, as shown in
Figure 5b. Upon unloading to the valley stress, the interface counter-slip length approaches 55.1% of the interface debonded length,
i.e.,
y(
σmin)/
ld = 55.1%; and upon reloading to the peak stress, the interface new slip length approaches 55.1% of the interface debonded length,
i.e.,
z(
σmax)/
ld = 55.1%. For matrix cracking mode 5, the hysteresis loops correspond to interface slip Case 2, as shown in
Figure 5b. Upon unloading to the valley stress, the interface counter-slip length approaches 72.7% of the interface debonded length,
i.e.,
y(
σmin)/
ld = 72.7%; and upon reloading to the peak stress, the interface new slip length approaches 72.7% of the interface debonded length,
i.e.,
z(
σmax)/
ld = 72.7%.
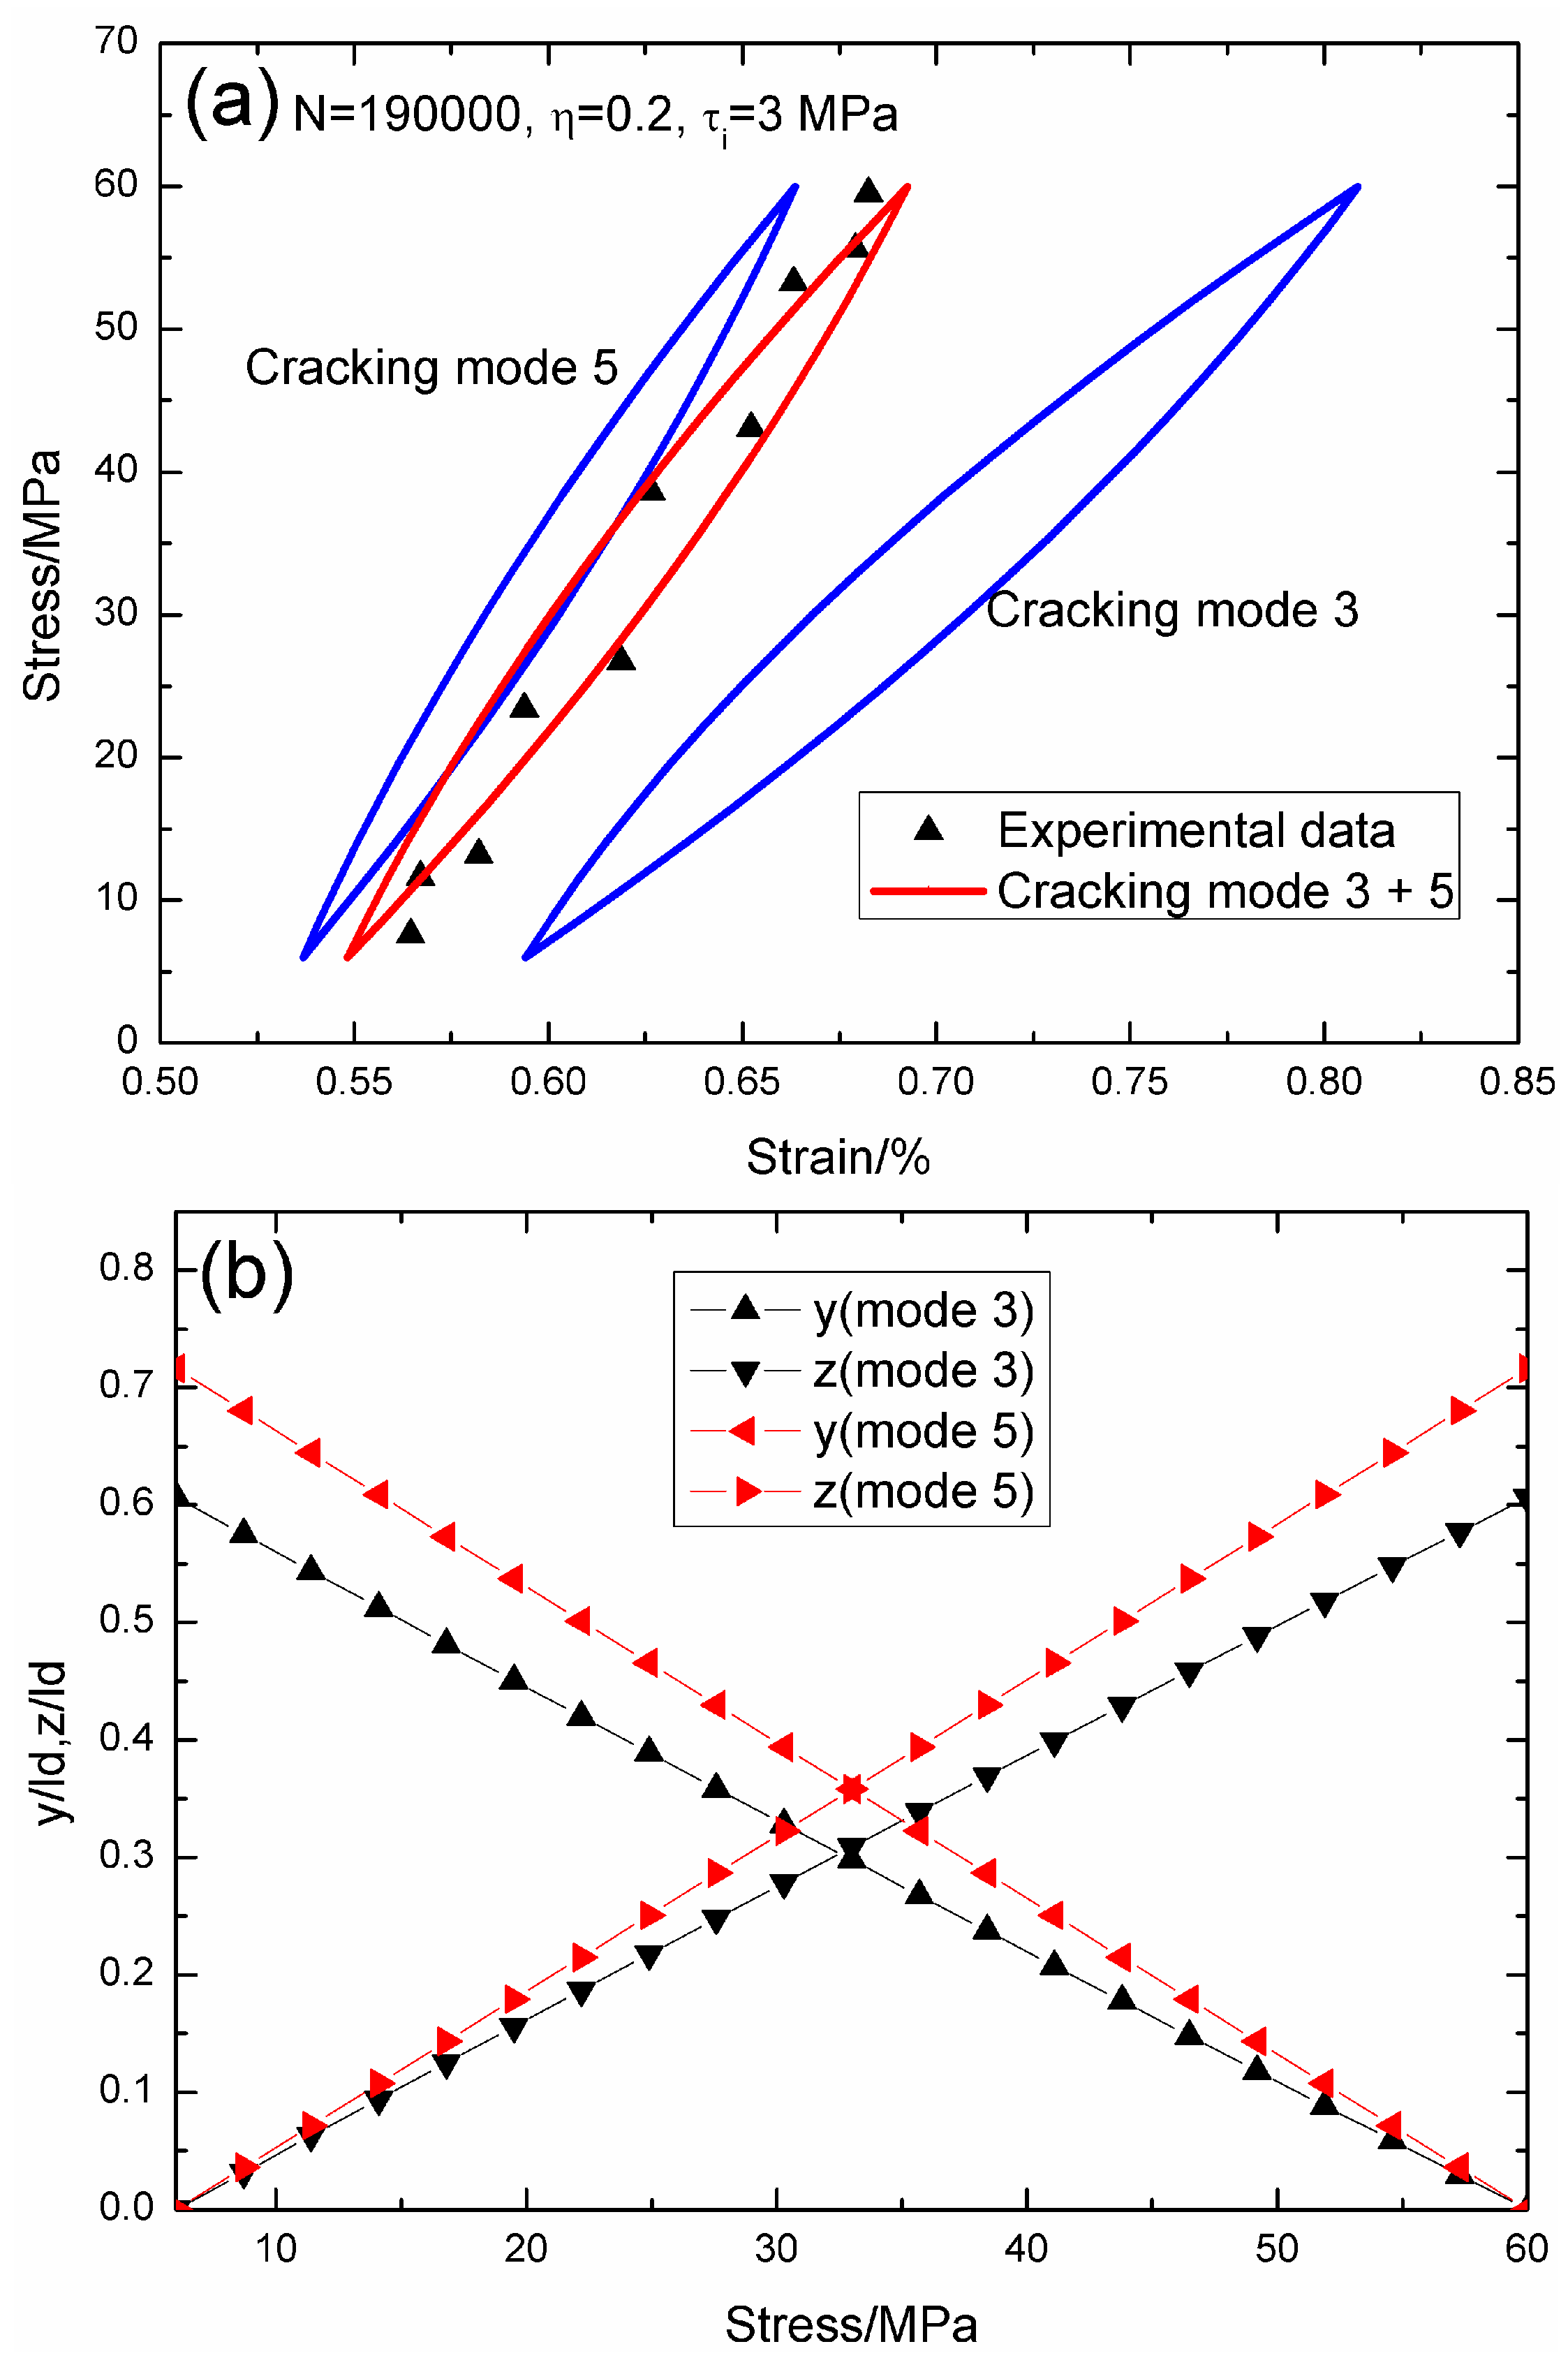
When
N = 190,000, the hysteresis loops of matrix cracking modes 3 and 5, and the composite and experimental data are given in
Figure 6a, in which the proportion of matrix cracking mode 3 is
η = 0.2. For matrix cracking mode 3, the hysteresis loops correspond to interface slip Case 3, as shown in
Figure 6b. Upon unloading to the valley stress, the interface counter-slip length approaches 60.6% of the interface debonded length,
i.e.,
y(
σmin)/
ld = 60.6%; and upon reloading to the peak stress, the interface new slip length approaches 60.6% of the interface debonded length,
i.e.,
z(
σmax)/
ld = 60.6%. For matrix cracking mode 5, the hysteresis loops correspond to interface slip Case 2, as shown in
Figure 6b. Upon unloading to the valley stress, the interface counter-slip length approaches 71.6% of the interface debonded length,
i.e.,
y(
σmin)/
ld = 71.6%; and upon reloading to the peak stress, the interface new slip length approaches 71.6% of the interface debonded length,
i.e.,
z(
σmax)/
ld = 71.6%.
When
σmax = 100 MPa, the experimental and theoretical hysteresis loops, and the interface slip of matrix cracking modes 3 and 5 corresponding to cycle number
N = 2, 500, 3000 and 10,000 are illustrated in
Figure 7,
Figure 8,
Figure 9 and
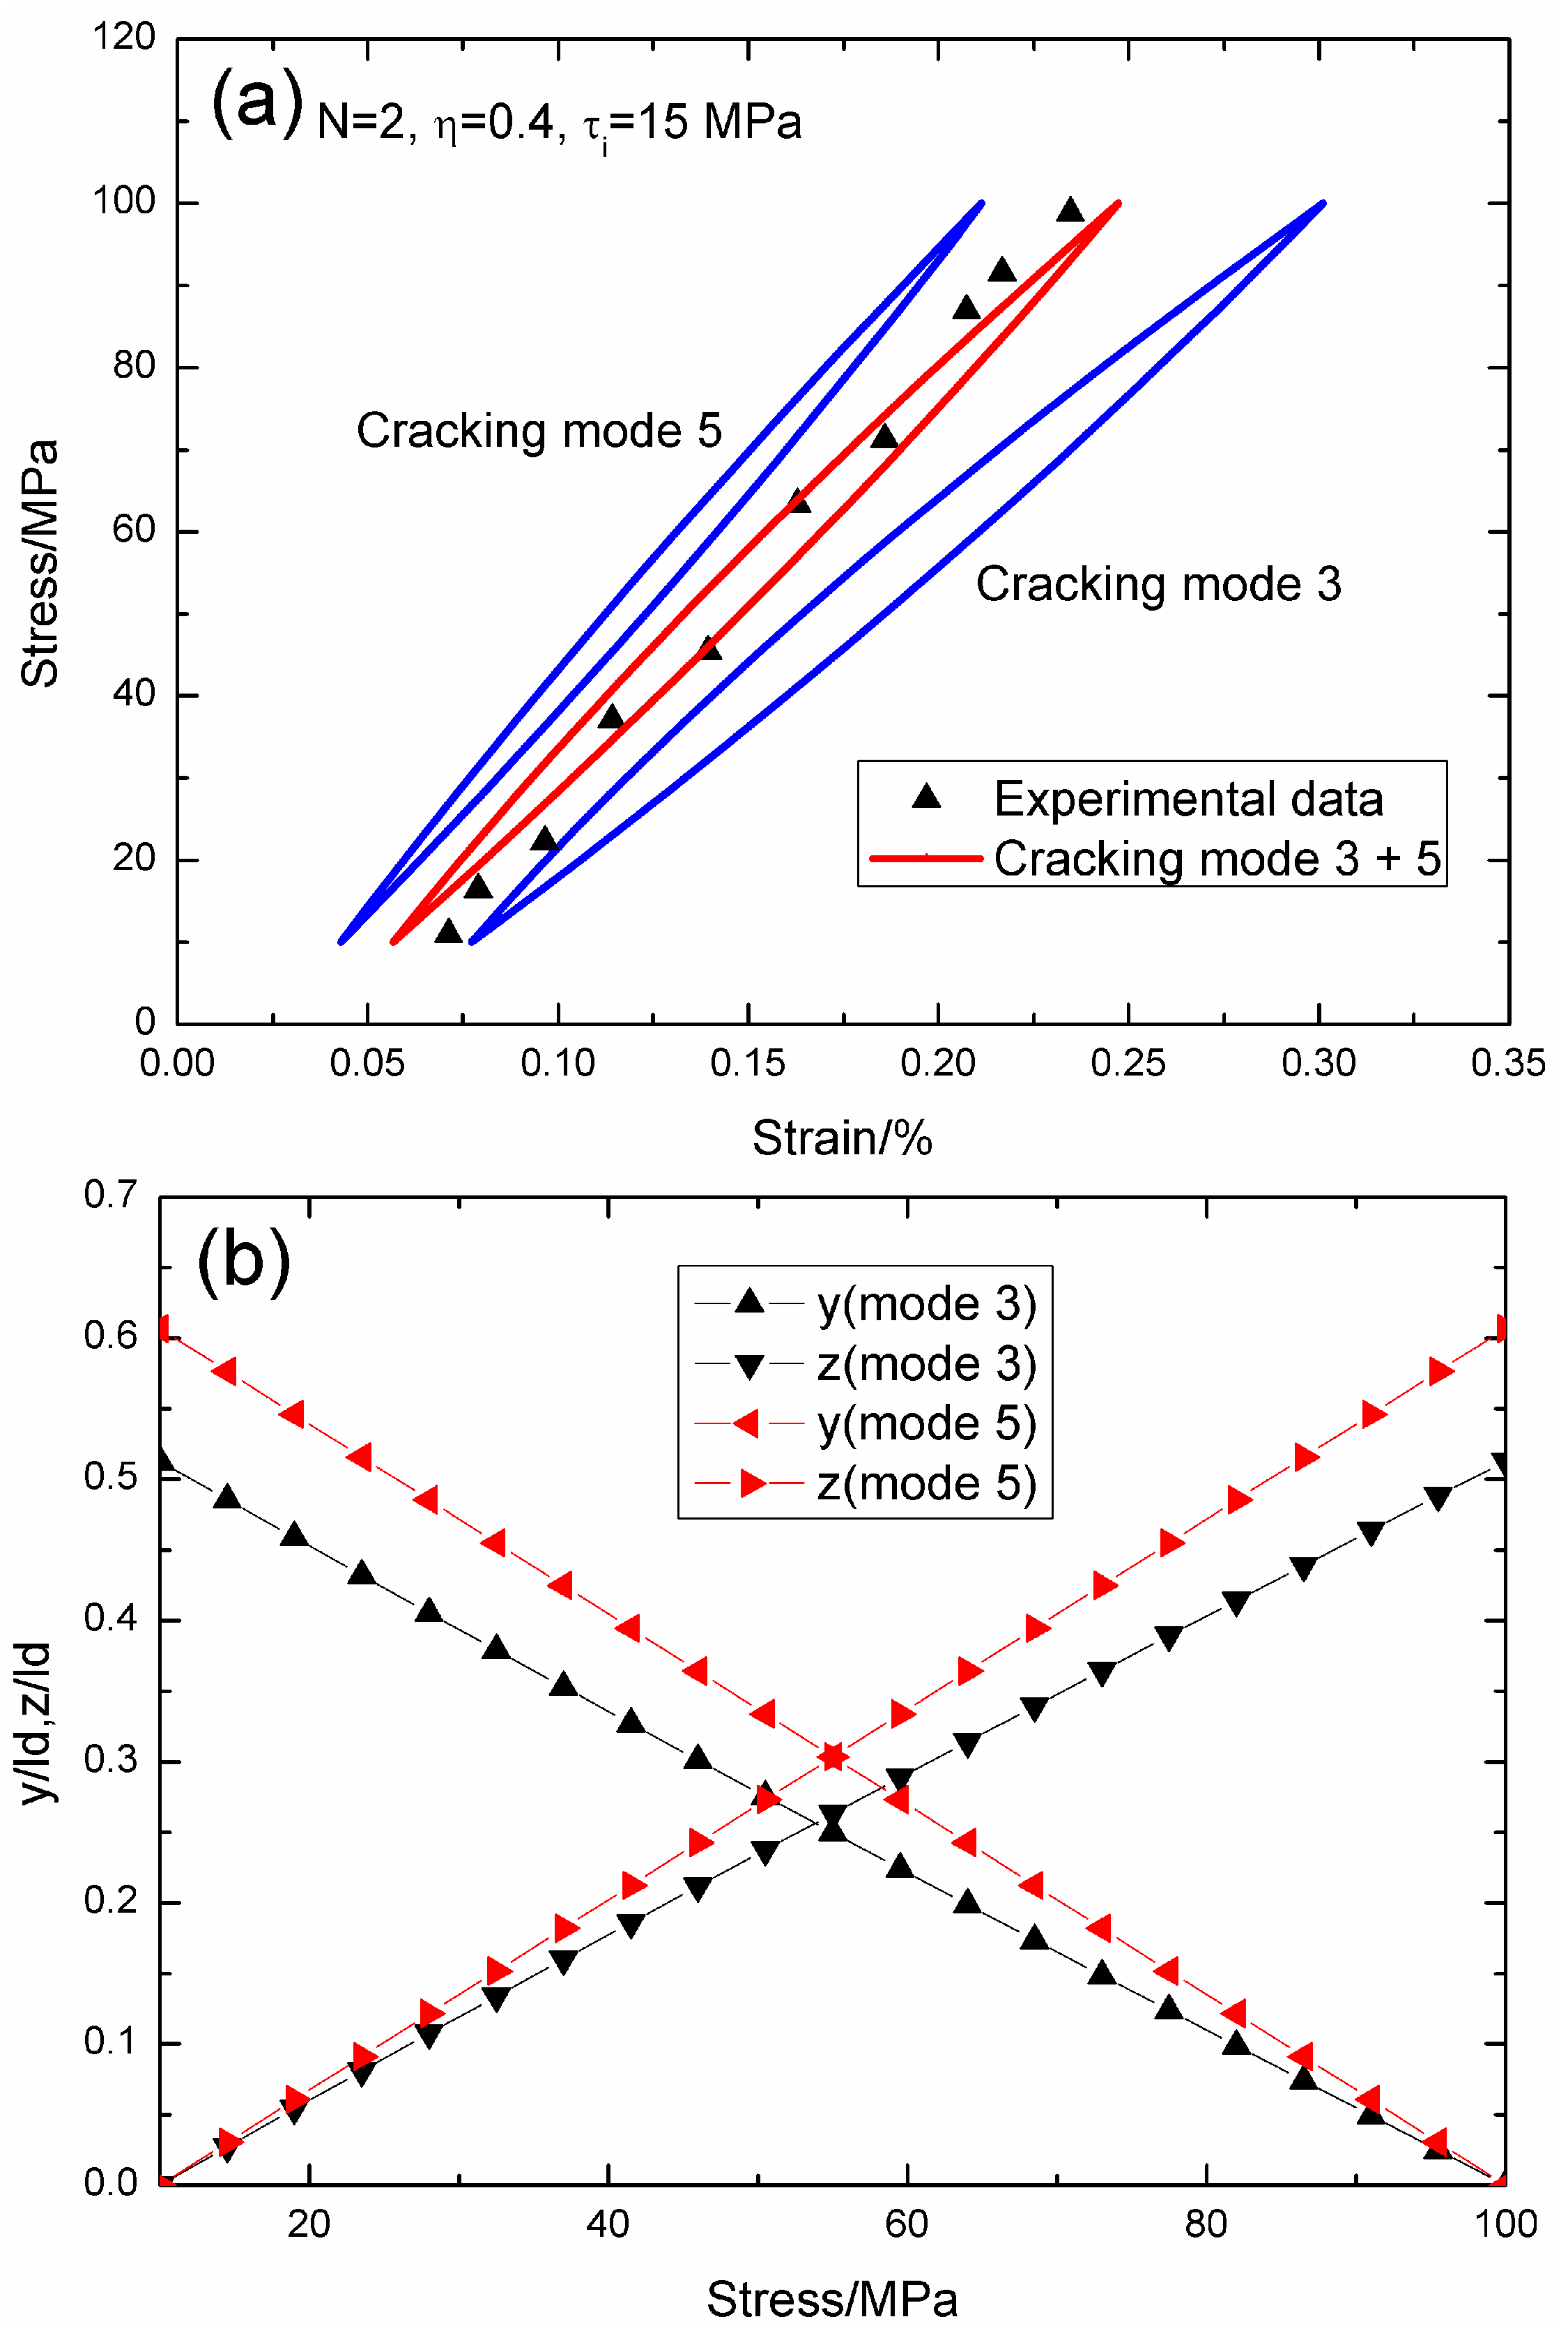
Figure 10. When
N = 2, the hysteresis loops of matrix cracking modes 3 and 5, and the composite and experimental data are given in
Figure 7a, in which the proportion of matrix cracking mode 3 is
η = 0.4. For matrix cracking mode 3, the hysteresis loops correspond to interface slip Case 2, as shown in
Figure 7b. Upon unloading to the valley stress, the interface counter-slip length approaches 51.2% of the interface debonded length,
i.e.,
y(
σmin)/
ld = 51.2%; and upon reloading to the peak stress, the interface new slip length approaches 51.2% of the interface debonded length,
i.e.,
z(
σmax)/
ld = 51.2%. For matrix cracking mode 5, the hysteresis loops correspond to interface slip Case 2, as shown in
Figure 7b. Upon unloading to the valley stress, the interface counter-slip length approaches 60.6% of the interface debonded length,
i.e.,
y(
σmin)/
ld = 60.6%; and upon reloading to the peak stress, the interface new slip length approaches 60.6% of the interface debonded length,
i.e.,
z(
σmax)/
ld = 60.6%.
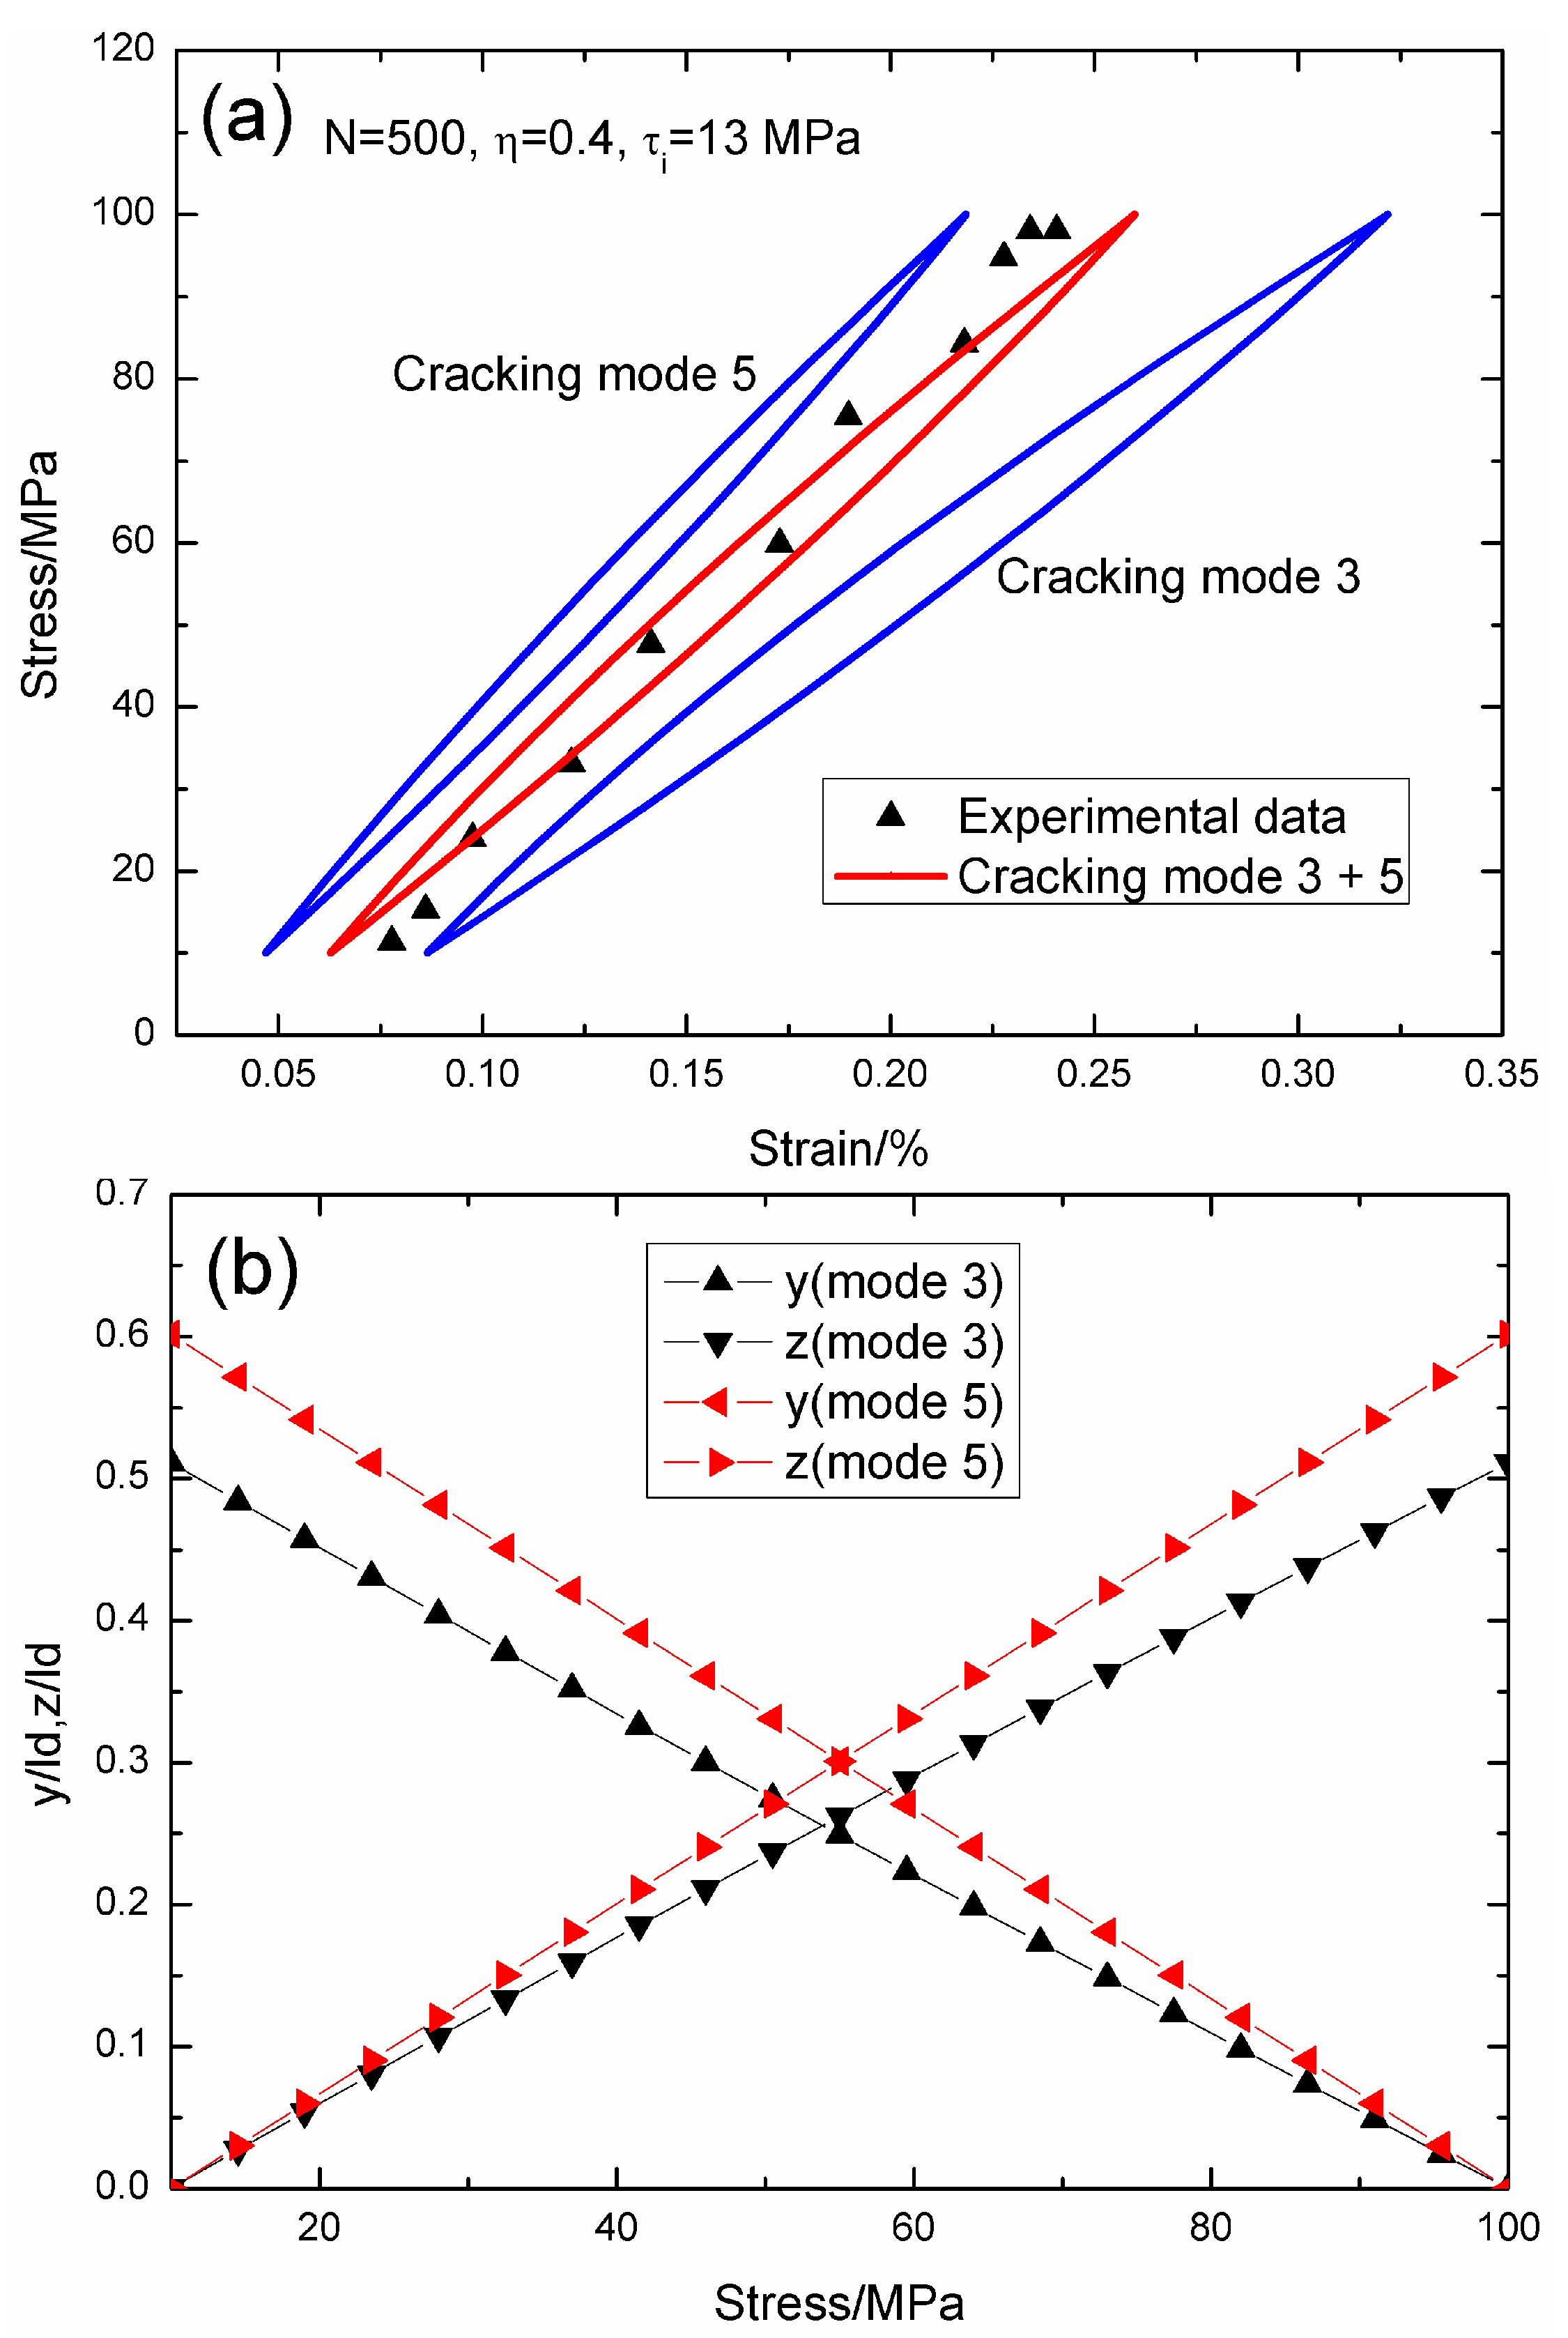
When
N = 500, the hysteresis loops of matrix cracking modes 3 and 5, and the composite and experimental data are given in
Figure 8a, in which the proportion of matrix cracking mode 3 is
η = 0.4. For matrix cracking mode 3, the hysteresis loops correspond to interface slip Case 2, as shown in
Figure 8b. Upon unloading to the valley stress, the interface counter-slip length approaches 51.1% of the interface debonded length,
i.e.,
y(
σmin)/
ld = 51.1%; and upon reloading to the peak stress, the interface new slip length approaches 51.1% of the interface debonded length,
i.e.,
z(
σmax)/
ld = 51.1%. For matrix cracking mode 5, the hysteresis loops correspond to interface slip Case 2, as shown in
Figure 8b. Upon unloading to the valley stress, the interface counter-slip length approaches 60.1% of the interface debonded length,
i.e.,
y(
σmin)/
ld = 60.1%; and upon reloading to the peak stress, the interface new slip length approaches 60.1% of the interface debonded length,
i.e.,
z(
σmax)/
ld = 60.1%.
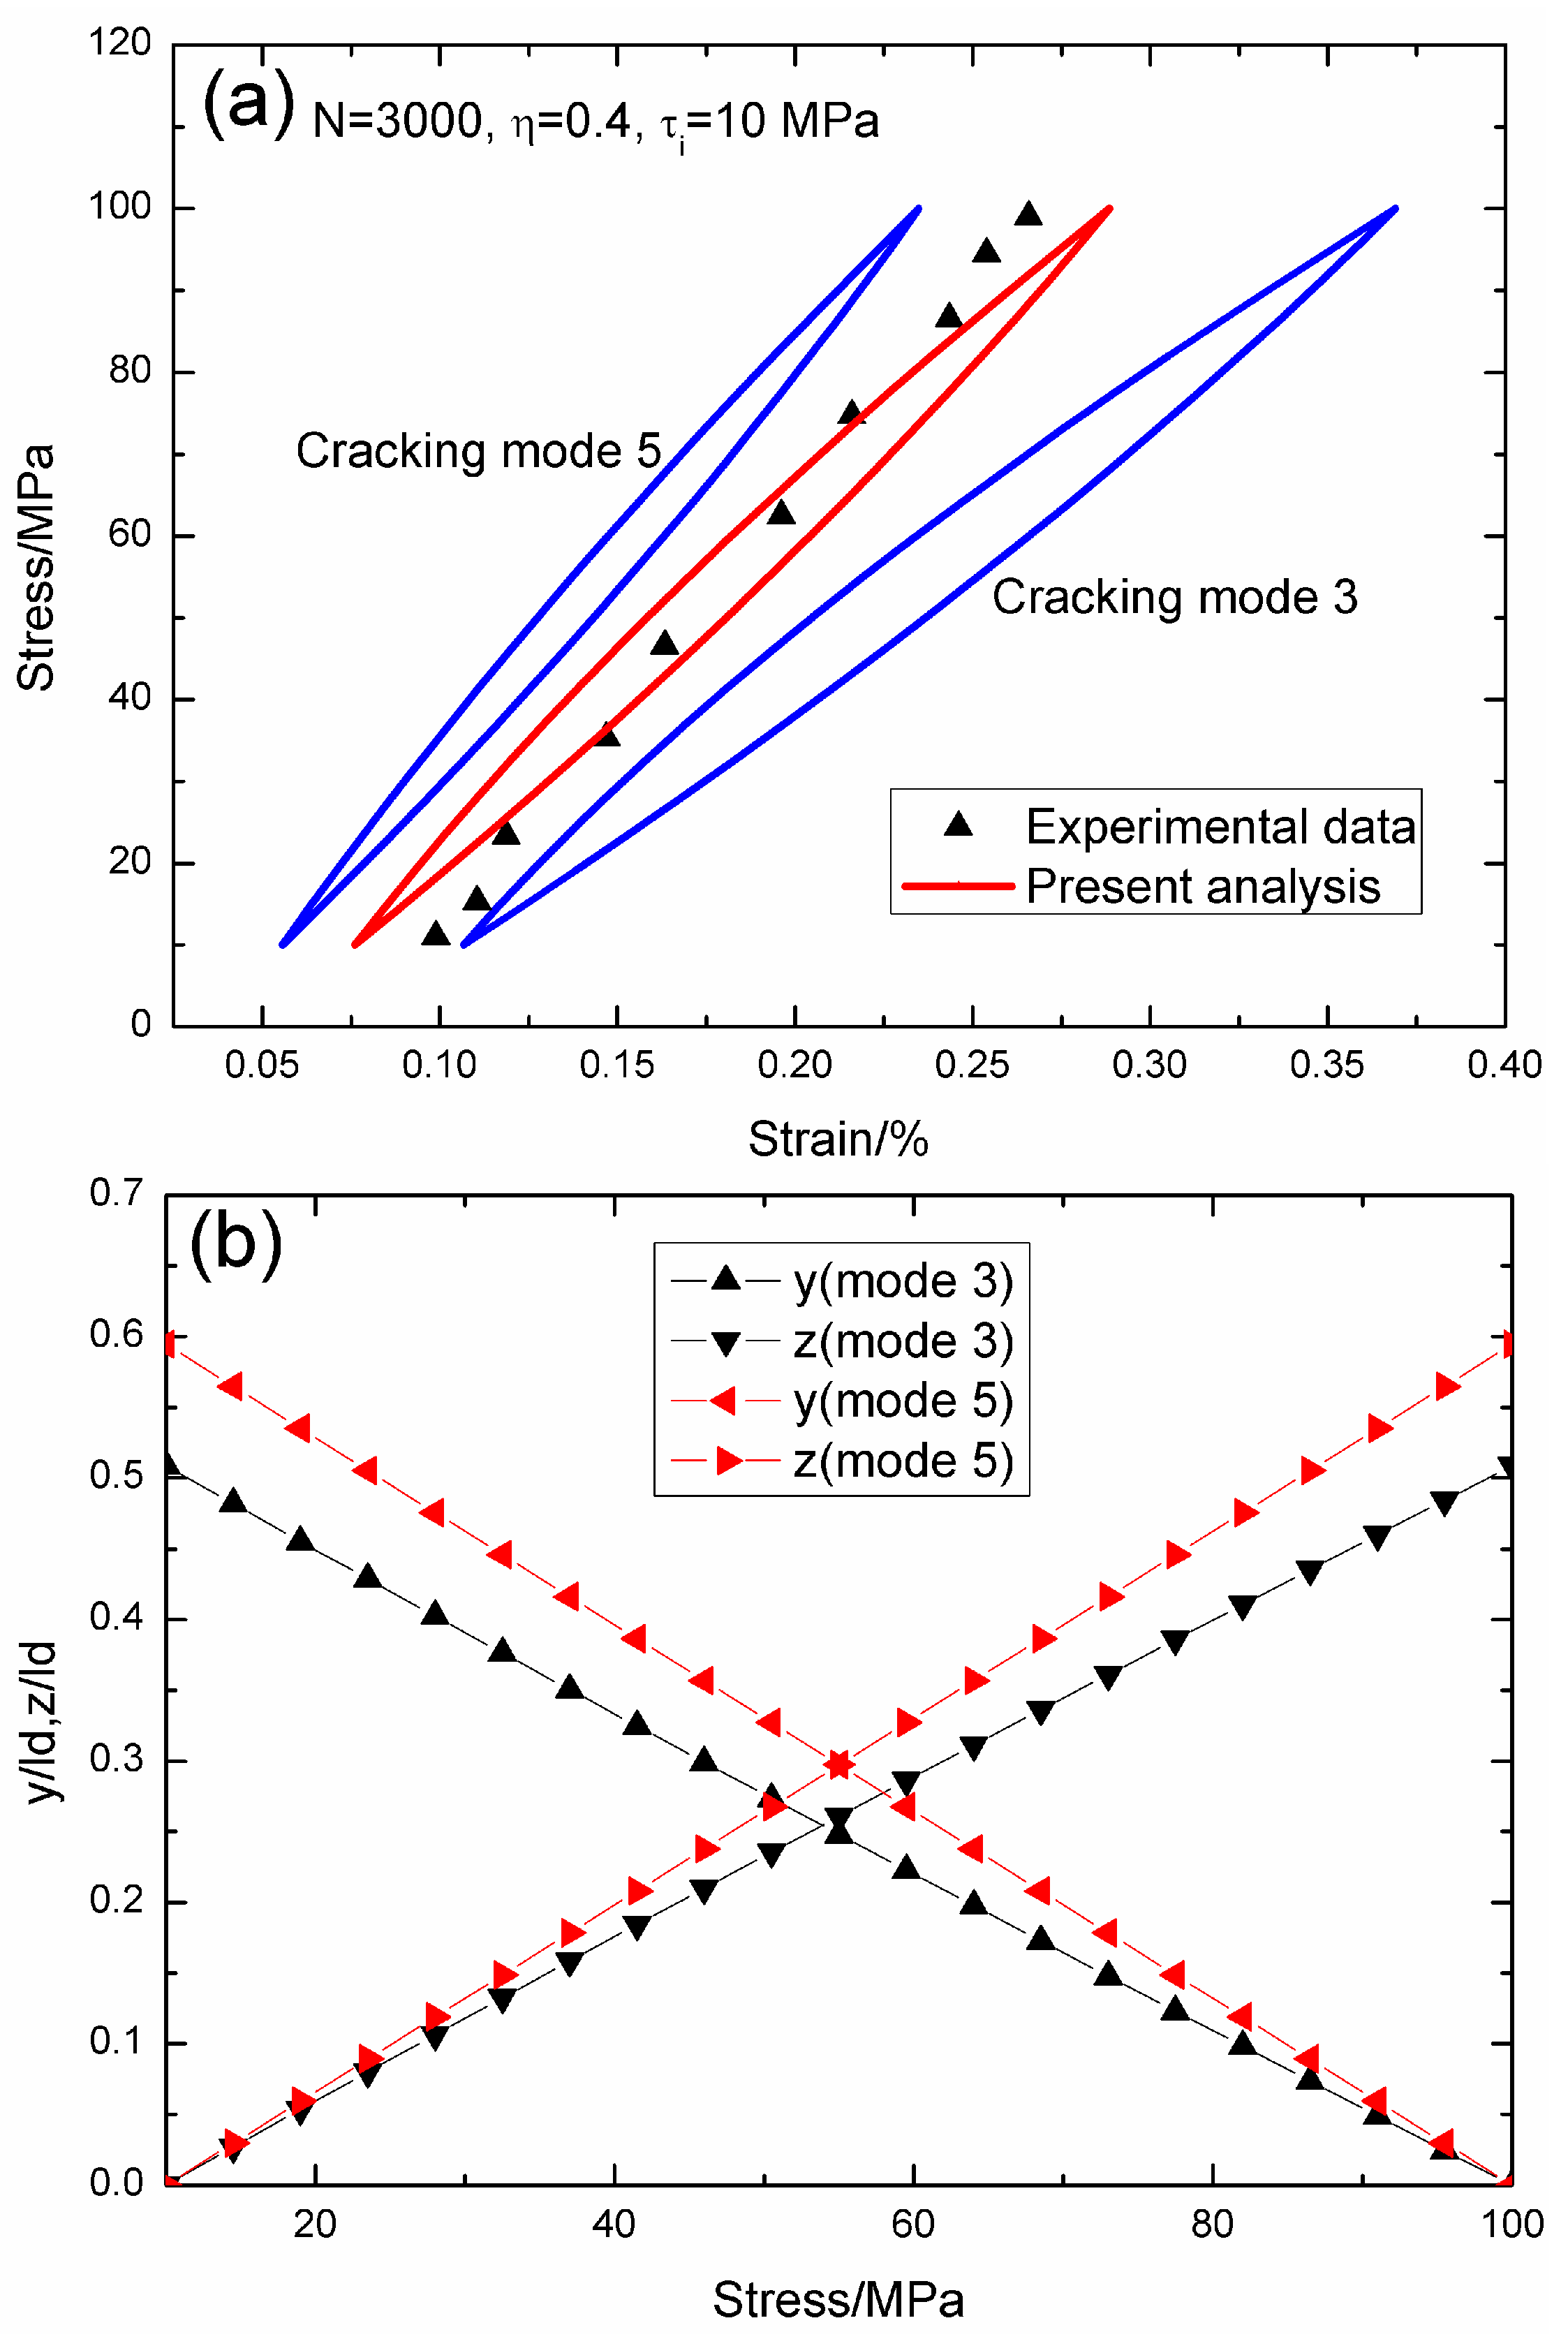
When
N = 3000, the hysteresis loops of matrix cracking mode 3 and mode 5, the composite and experimental data are given in
Figure 9a, in which the proportion of matrix cracking mode 3 is
η = 0.4. For matrix cracking mode 3, the hysteresis loops correspond to interface slip Case 2, as shown in
Figure 9b. Upon unloading to the valley stress, the interface counter-slip length approaches 50.8% of the interface debonded length,
i.e.,
y(
σmin)/
ld = 50.8%; and upon reloading to the peak stress, the interface new slip length approaches 50.8% of the interface debonded length,
i.e.,
z(
σmax)/
ld = 50.8%. For matrix cracking mode 5, the hysteresis loops correspond to interface slip Case 2, as shown in
Figure 9b. Upon unloading to the valley stress, the interface counter-slip length approaches 59.4% of the interface debonded length,
i.e.,
y(
σmin)/
ld = 59.4%; and upon reloading to the peak stress, the interface new slip length approaches 59.4% of the interface debonded length,
i.e.,
z(
σmax)/
ld = 59.4%.
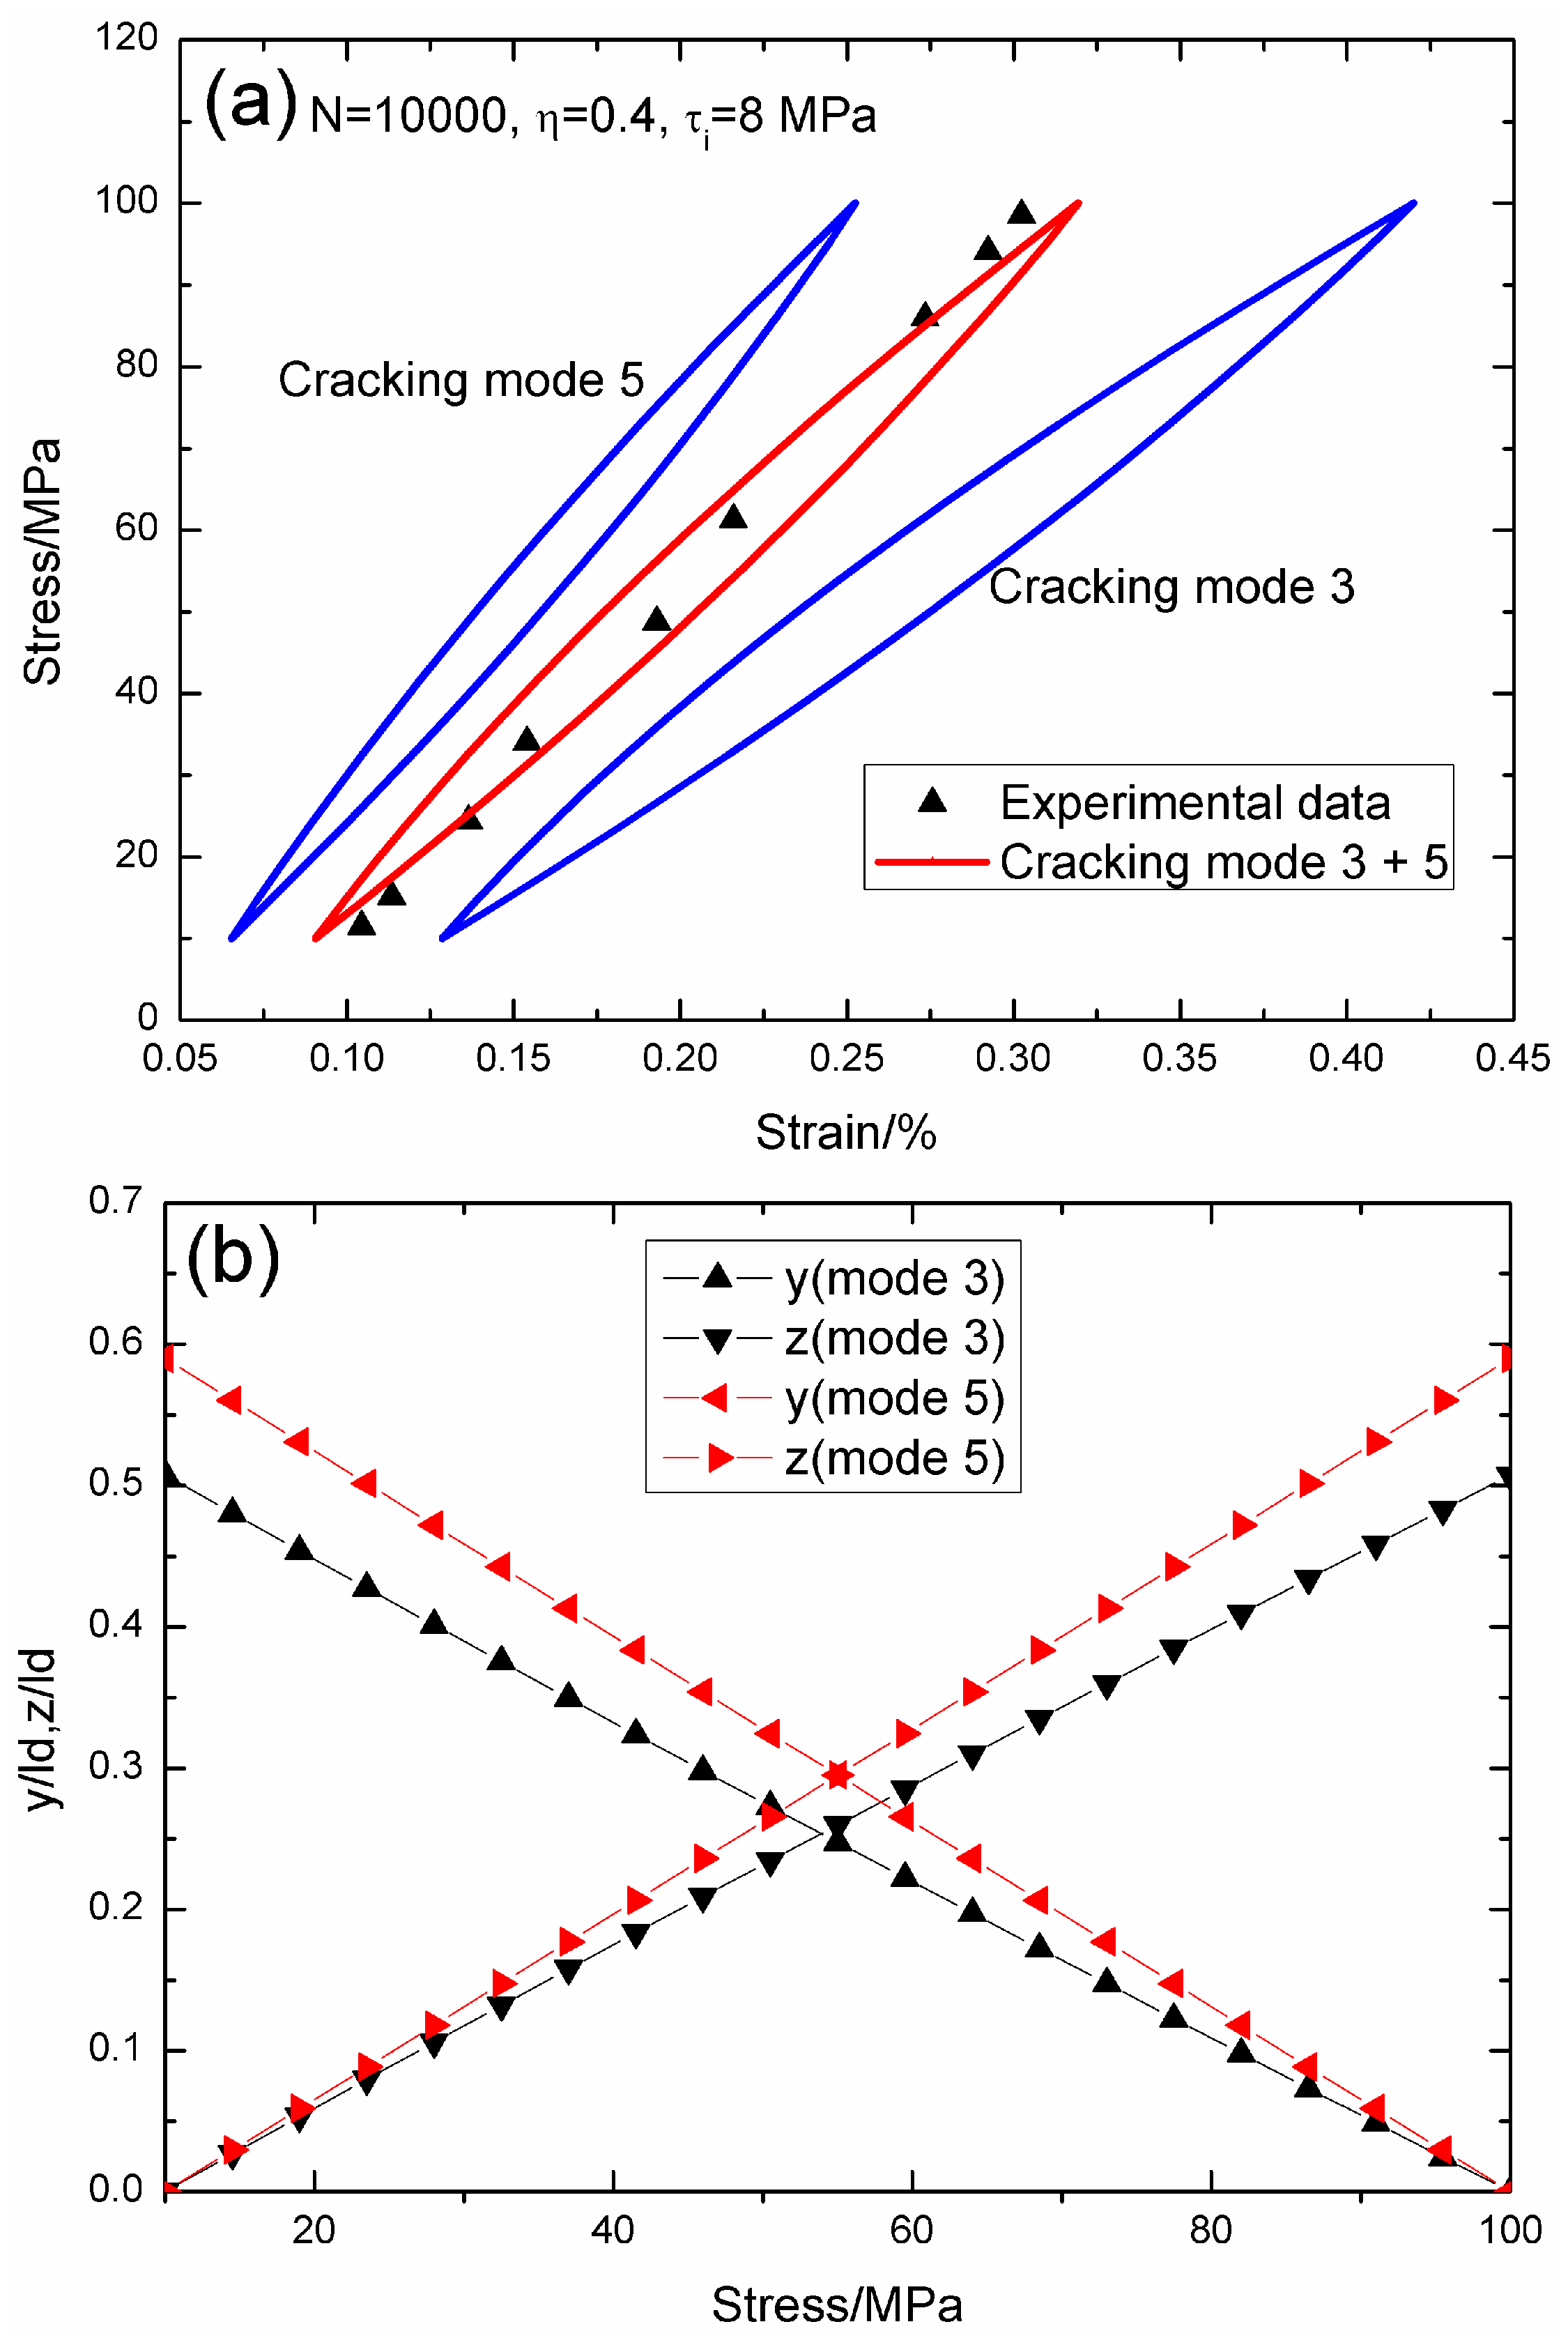
When
N = 10,000, the hysteresis loops of matrix cracking modes 3 and 5, and the composite and experimental data are given in
Figure 10a, in which the proportion of matrix cracking mode 3 is
η = 0.4. For matrix cracking mode 3, the hysteresis loops correspond to interface slip Case 2, as shown in
Figure 10b. Upon unloading to the valley stress, the interface counter-slip length approaches 50.7% of the interface debonded length,
i.e.,
y(
σmin)/
ld = 50.7%; and upon reloading to the peak stress, the interface new slip length approaches 50.7% of the interface debonded length,
i.e.,
z(
σmax)/
ld = 50.7%. For matrix cracking mode 5, the hysteresis loops correspond to interface slip Case 2, as shown in
Figure 10b. Upon unloading to the valley stress, the interface counter-slip length approaches 58.9% of the interface debonded length,
i.e.,
y(
σmin)/
ld = 58.9%; and upon reloading to the peak stress, the interface new slip length approaches 58.9% of the interface debonded length,
i.e.,
z(
σmax)/
ld = 58.9%.
4.2. Tension–Tension Fatigue Hysteresis Loops at 1200 °C in Steam
Jacob [
27] investigated the tension–tension cyclic fatigue behavior of 2D woven SiC/SiC composite at 1200 °C in steam. The fatigue tests were conducted at the loading frequency of
f = 0.1 and 1 Hz with a stress ratio of 0.05. The material properties of 2D SiC/SiC composite are given by [
27]:
Vf = 34.8%,
Ef = 150 GPa,
Em = 100 GPa,
rf = 7.5 μm,
ζd = 0.1 J/m
2,
αf = 4.6 × 10
−6/°C,
αm = 4.38 × 10
−6/°C, and ΔT = −200 °C.
When
σmax = 140 MPa and
f = 0.1 Hz, the experimental and theoretical hysteresis loops, and the interface slip of matrix cracking modes 3 and 5 corresponding to cycle number
N = 100, 1000 and 10,000 are illustrated in
Figure 11,
Figure 12 and
Figure 13. When
N = 100, the hysteresis loops of matrix cracking mode 3 and mode 5, and the composite and experimental data are given in
Figure 11a, in which the proportion of matrix cracking mode 3 is
η = 0.2. For matrix cracking mode 3, the hysteresis loops correspond to interface slip Case 2, as shown in
Figure 11b. Upon unloading to the valley stress, the interface counter-slip length approaches 54.6% of the interface debonded length,
i.e.,
y(
σmin)/
ld = 54.6%; and upon reloading to the peak stress, the interface new slip length approaches 54.6% of the interface debonded length,
i.e.,
z(
σmax)/
ld = 54.6%. For matrix cracking mode 5, the hysteresis loops correspond to interface slip Case 2, as shown in
Figure 11b. Upon unloading to the valley stress, the interface counter-slip length approaches 72.8% of the interface debonded length,
i.e.,
y(
σmin)/
ld = 72.8%; and upon reloading to the peak stress, the interface new slip length approaches 72.8% of the interface debonded length,
i.e.,
z(
σmax)/
ld = 72.8%.
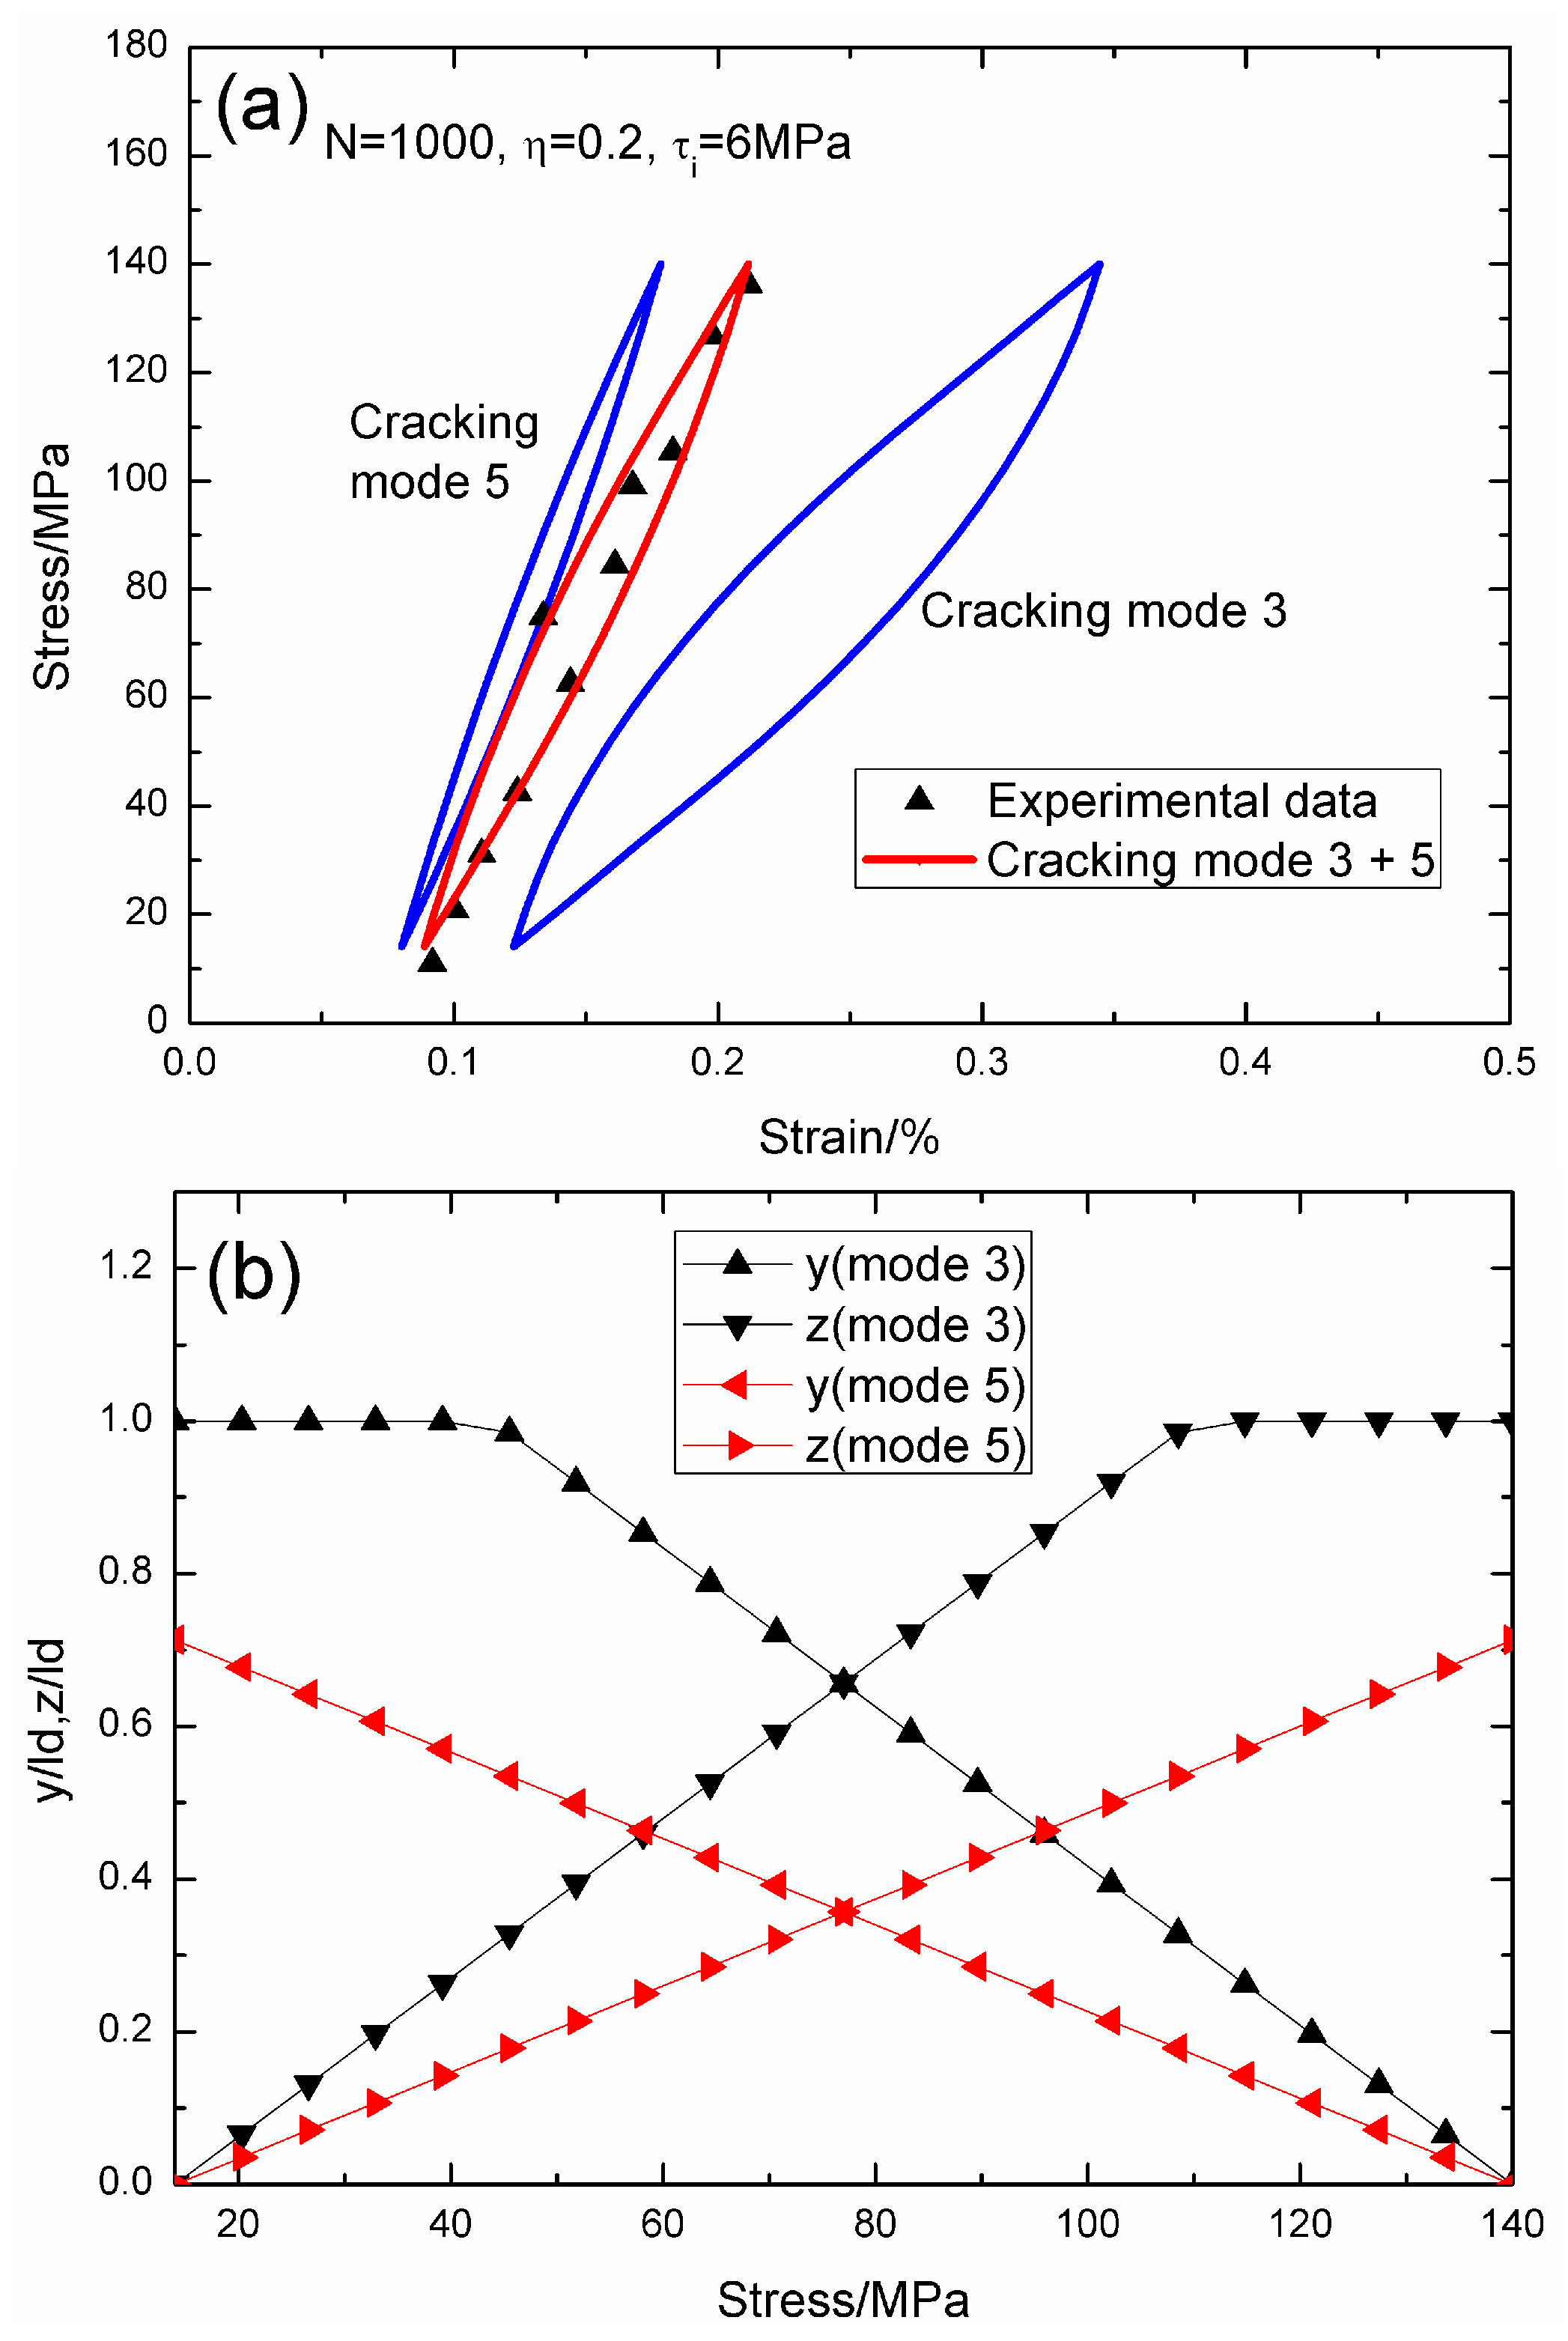
When
N = 1000, the hysteresis loops of matrix cracking mode 3 and mode 5, and the composite and experimental data are given in
Figure 12a, in which the proportion of matrix cracking mode 3 is
η = 0.2. For matrix cracking mode 3, the hysteresis loops correspond to interface slip Case 4, as shown in
Figure 12b. Upon unloading, the interface counter-slip length approaches ttheo interface debonded length at
σtr_fu = 39.2 MPa,
i.e.,
y(
σtr_fu)/
ld = 1; and upon reloading to
σtr_fr = 114.8 MPa, the interface new slip length approaches the interface debonded length,
i.e.,
z(
σtr_fr)/
ld = 1. For matrix cracking mode 5, the hysteresis loops correspond to interface slip Case 2, as shown in
Figure 12b. Upon unloading to the valley stress, the interface counter-slip length approaches 71.3% of the interface debonded length,
i.e.,
y(
σmin)/
ld = 71.3%; and upon reloading to the peak stress, the interface new slip length approaches 71.3% of the interface debonded length,
i.e.,
z(
σmax)/
ld = 71.3%.
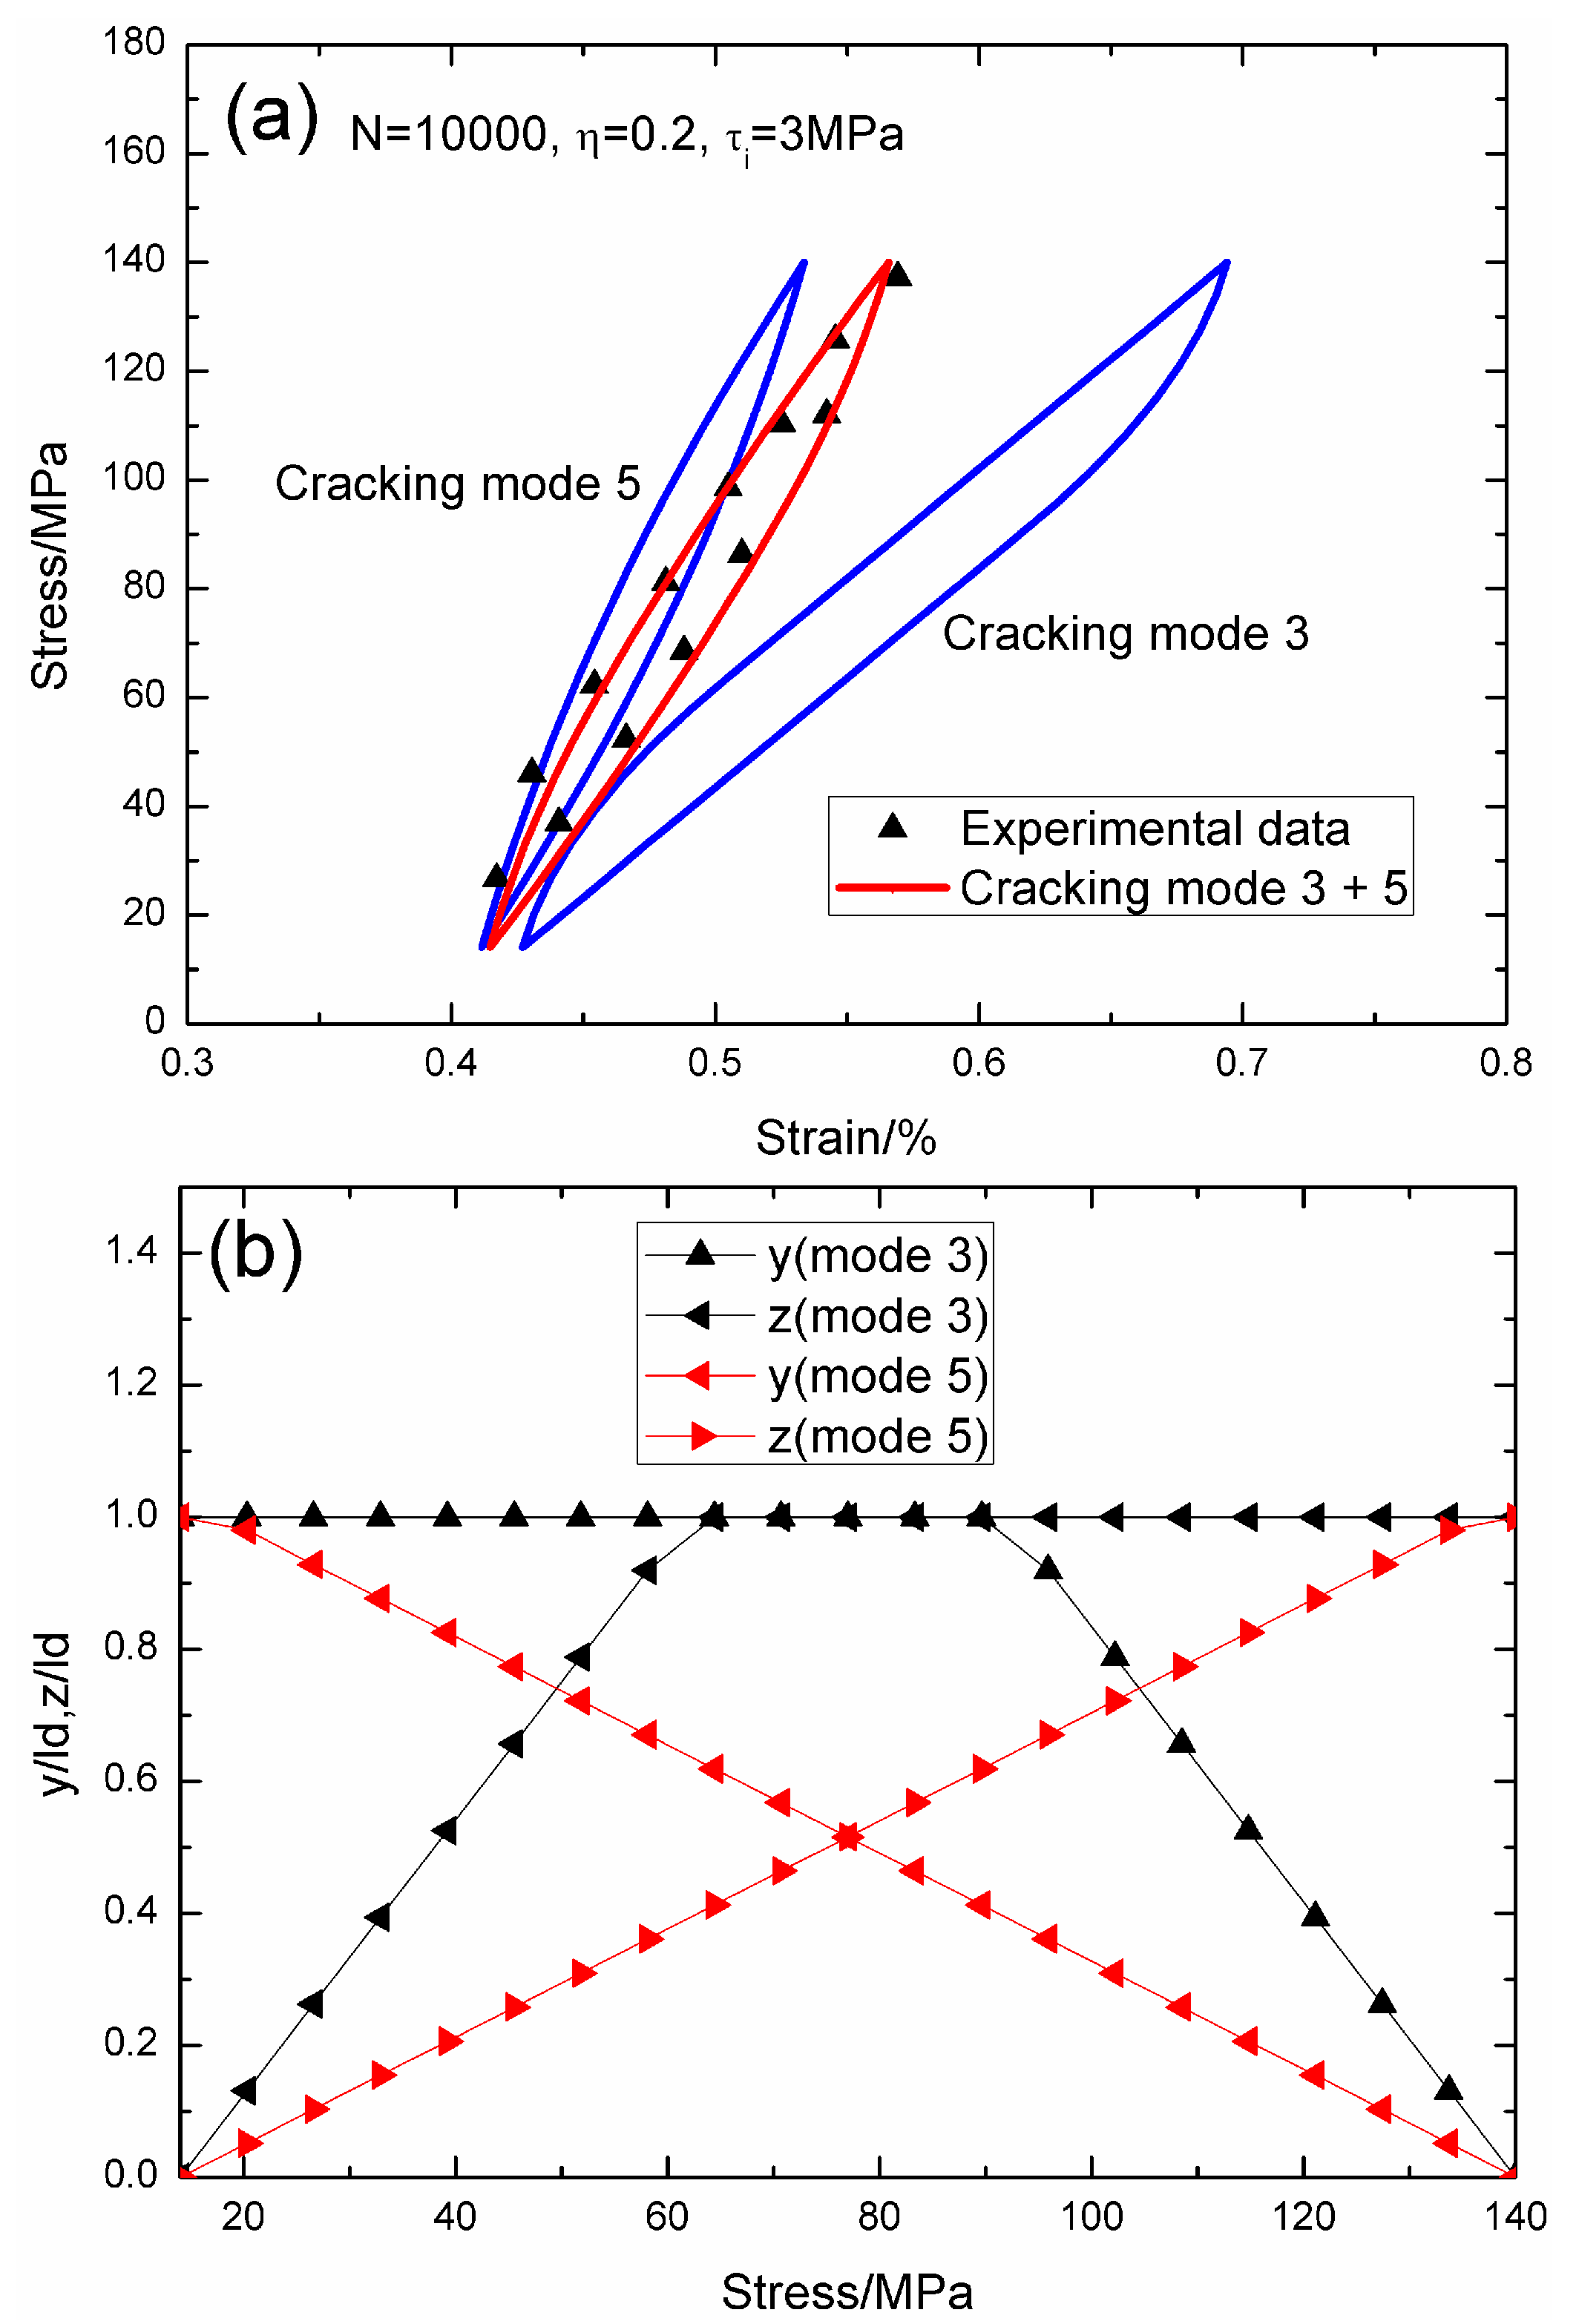
When
N = 10,000, the hysteresis loops of matrix cracking mode 3 and mode 5, and the composite and experimental data are given in
Figure 13a, in which the proportion of matrix cracking mode 3 is
η = 0.2. For matrix cracking mode 3, the hysteresis loops correspond to interface slip Case 4, as shown in
Figure 13b. Upon unloading, the interface counter-slip length approaches the interface debonded length at
σtr_fu = 89.6 MPa,
i.e.,
y(
σtr_fu)/
ld = 1; and upon reloading to
σtr_fr = 64.4 MPa, the interface new slip length approaches the interface debonded length,
i.e.,
z(
σtr_fr)/
ld = 1. For matrix cracking mode 5, the hysteresis loops correspond to interface slip Case 4, as shown in
Figure 13b. Upon unloading, the interface counter-slip length approaches the interface debonded length at
σtr_fu = 14 MPa,
i.e.,
y(
σtr_fu)/
ld = 1; and upon reloading to
σtr_fr = 140 MPa, the interface new slip length approaches the interface debonded length,
i.e.,
z(
σtr_fr)/
ld = 1.
When
σmax = 140 MPa and
f = 1 Hz, the experimental and theoretical hysteresis loops, and the interface slip of matrix cracking modes 3 and 5 corresponding to cycle number
N = 1000, 10,000, and 30,000 are illustrated in
Figure 14,
Figure 15 and
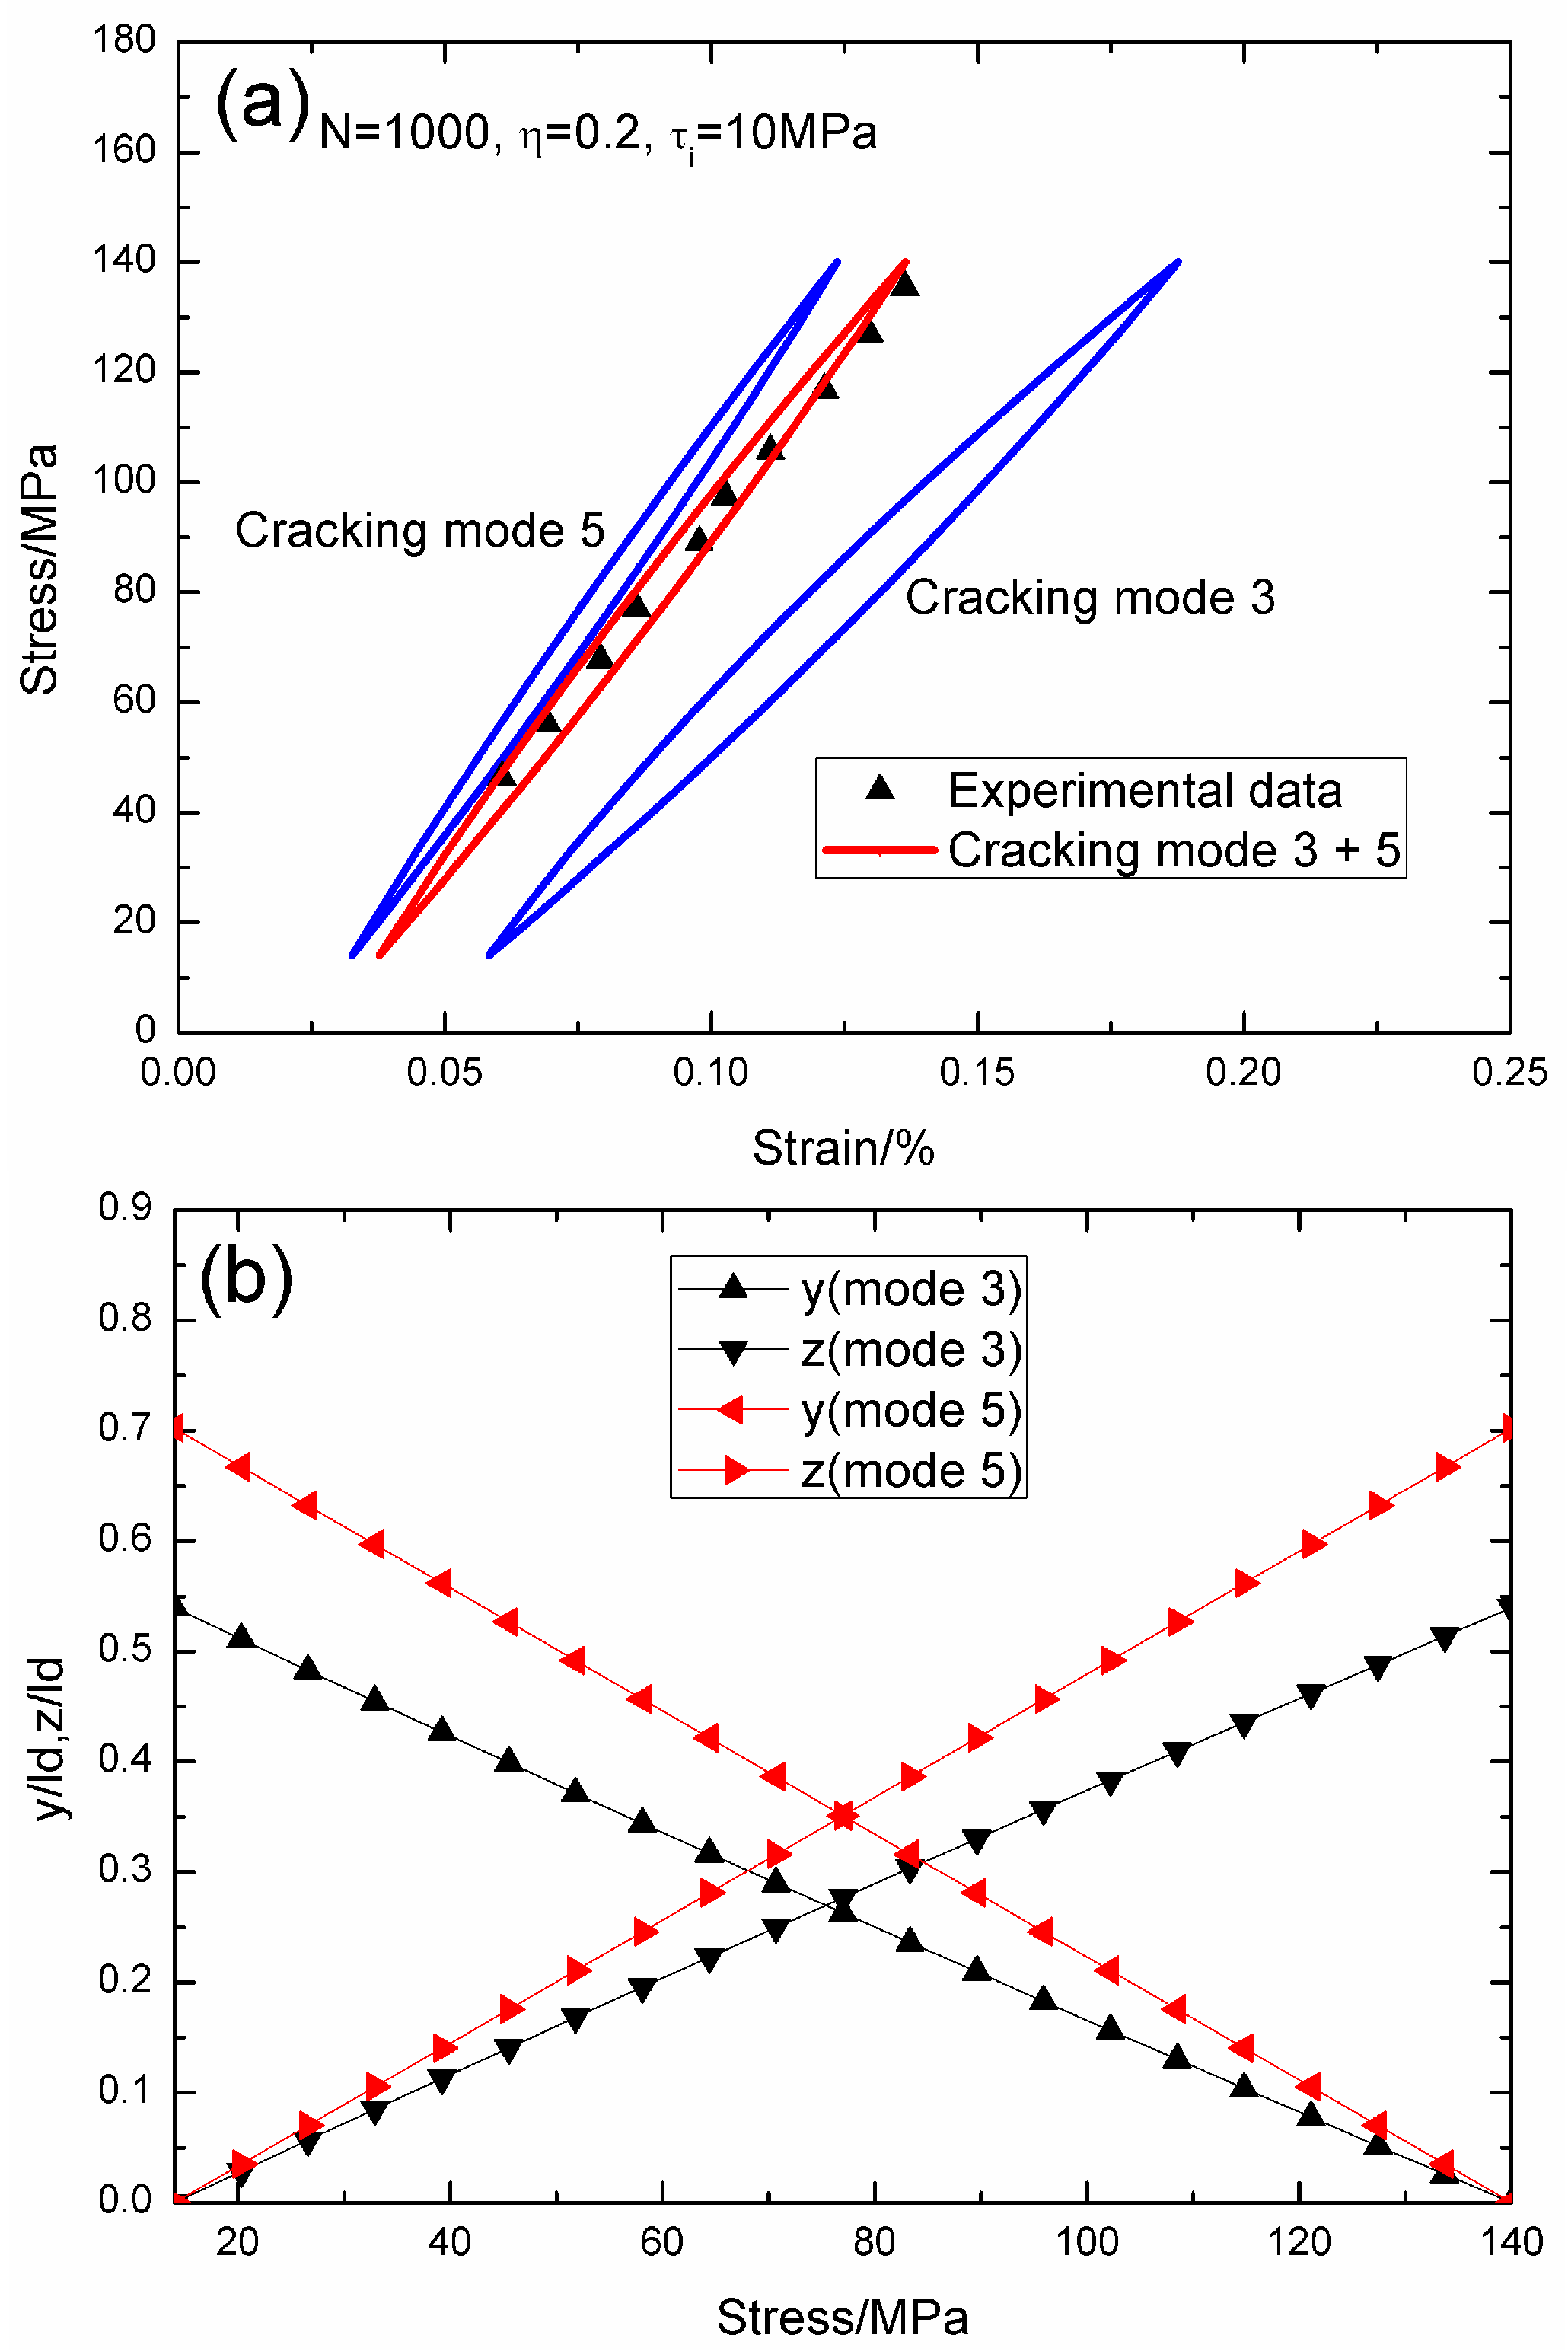
Figure 16. When
N = 1000, the hysteresis loops of matrix cracking modes 3 and 5, and the composite and experimental data are given in
Figure 14a, in which the proportion of matrix cracking mode 3 is
η = 0.2. For matrix cracking mode 3, the hysteresis loops correspond to interface slip Case 2, as shown in
Figure 14b. Upon unloading to the valley stress, the interface counter-slip length approaches 53.9% of the interface debonded length,
i.e.,
y(
σmin)/
ld = 53.9%; and upon reloading to the peak stress, the interface new-slip length approaches 53.9% of the interface debonded length,
i.e.,
z(
σmax)/
ld = 53.9%. For matrix cracking mode 5, the hysteresis loops correspond to interface slip Case 2, as shown in
Figure 14b. Upon unloading to the valley stress, the interface counter-slip length approaches 70.2% of the interface debonded length,
i.e.,
y(
σmin)/
ld = 70.2%; and upon reloading to the peak stress, the interface new slip length approaches 70.2% of the interface debonded length,
i.e.,
z(
σmax)/
ld = 70.2%.
When
N = 10,000, the hysteresis loops of matrix cracking mode 3 and mode 5, the composite and experimental data are given in
Figure 15a, in which the proportion of matrix cracking mode 3 is
η = 0.2. For matrix cracking mode 3, the hysteresis loops correspond to interface slip Case 4, as shown in
Figure 15b. Upon unloading, the interface counter-slip length approaches the interface debonded length at
σtr_fu = 77 MPa,
i.e.,
y(
σtr_fu)/
ld = 1; and upon reloading to
σtr_fr = 77 MPa, the interface new slip length approaches the interface debonded length,
i.e.,
z(
σtr_fr)/
ld = 1. For matrix cracking mode 5, the hysteresis loops correspond to interface slip Case 2, as shown in
Figure 15b. Upon unloading to the valley stress, the interface counter-slip length approaches 69.3% of the interface debonded length,
i.e.,
y(
σmin)/
ld = 69.3%; and upon reloading to the peak stress, the interface new slip length approaches 69.3% of the interface debonded length,
i.e.,
z(
σmax)/
ld = 69.3%.
When
N = 30,000, the hysteresis loops of matrix cracking modes 3 and 5, and the composite and experimental data are given in
Figure 16a, in which the proportion of matrix cracking mode 3 is
η = 0.2. For matrix cracking mode 3, the hysteresis loops correspond to interface slip Case 4, as shown in
Figure 16b. Upon unloading, the interface counter-slip length approaches the interface debonded length at
σtr_fu = 108.5 MPa,
i.e.,
y(
σtr_fu)/
ld = 1; and upon reloading to
σtr_fr = 45.5 MPa, the interface new slip length approaches the interface debonded length,
i.e.,
z(
σtr_fr)/
ld = 1. For matrix cracking mode 5, the hysteresis loops correspond to interface slip Case 4, as shown in
Figure 16b. Upon unloading, the interface counter-slip length approaches the interface debonded length at
σtr_fu = 14 MPa,
i.e.,
y(
σtr_fu)/
ld = 1; and upon reloading to
σtr_fr = 140 MPa, the interface new slip length approaches the interface debonded length,
i.e.,
z(
σtr_fr)/
ld = 1.
4.3. Discussion
Under cyclic fatigue loading, matrix multicracking occurs upon first loading to the maximum stress, and approaches saturation upon initial cycles. During and after saturation has occurred, the matrix cracks become excellent channels for crack propagation and, hence, environmental attack. Once open to the effects of oxygen, the SiC matrix and fibers tend to either volatize or oxidize through the formation of SiO
2. The presence of steam within the environment significantly increases the degradation of CMCs,
i.e., the increase of interphase oxidation, and interface shear stress degradation, which would affect the shape, location, and area of hysteresis loops. The interface shear stress degradation rate
ψ is defined by Equation (16):
where
τinitial and
τfinal denote the interface shear stress at cycle numbers
Ninitial and
Nfinal; and
Ninitial and
Nfinal denote the initial and final cycle number.
Under fatigue peak stress of
σmax = 60 MPa at 1000 °C in steam, the proportion of matrix cracking mode 3 occupies 20% of all matrix cracking modes in the 2D SiC/SiC composite; and the interface shear stress decreases from 15 MPa at the 2nd cycle to 3 MPa at the 190,000th cycle, due to interphase oxidation in steam conditions; and the hysteresis loops of matrix cracking mode 3 and mode 5 correspond to interface slip Case 2 and Case 2 at the 2nd cycle to Case 3 and Case 2 at the 190,000th cycle. The interface shear stress degradation rate is 6.3 × 10
−4 MPa/cycle. Under fatigue peak stress of
σmax = 100 MPa at 1000 °C in steam, the proportion of matrix cracking mode 3 occupies 40% of all matrix cracking modes in the 2D SiC/SiC composite; and the interface shear stress decreases from 15 MPa at the 2nd cycle to 8 MPa at the 10,000th cycle, due to interphase oxidation in steam condition; and the hysteresis loops of matrix cracking mode 3 and mode 5 both correspond to interface slip Case 2 from the 2nd cycle to 10,000th cycle. The interface shear stress degradation rate is 7 × 10
−4 MPa/cycle. Reynaud [
3] investigated the tension–tension fatigue behavior of 2D woven SiC/SiC composite at 1000 °C in inert. The fatigue peak stress was
σmax = 130 MPa, and the valley stress was
σmin = zero MPa. The loading frequency was 1 Hz. By comparing the experimental fatigue hysteresis dissipated energy with theoretical computational values, Li and Song [
28] estimated the interface shear stress of the 2D SiC/SiC composite at 1000 °C in inert conditions, corresponding to different cycle numbers. It was found that interface shear stress decreases from 19 MPa at the 22th cycle to 8.5 MPa at the 117,055th cycle. The interface shear stress degradation rate is 8.9 × 10
−5 MPa/cycle. The interface shear stress degradation rate increases with increasing fatigue peak stress,
i.e., from 6.3 × 10
−4 MPa/cycle under
σmax = 60 MPa to 7 × 10
−4 MPa/cycle under
σmax = 100 MPa, and is higher in steam conditions,
i.e., 6.3 × 10
−4 MPa/cycle at 1000 °C in steam under
σmax = 60 MPa, than that in the inert atmosphere,
i.e., 8.9 × 10
−5 MPa/cycle at 1000 °C in inert conditions under
σmax = 130 MPa.
Under fatigue peak stress of σmax = 140 MPa at 1200 °C in steam, the proportion of matrix cracking mode 3 occupies 20% of all matrix cracking modes in 2D woven SiC/SiC composite. When the loading frequency is 0.1 Hz, the interface shear stress decreases from 12 MPa at the 100th cycle to 3 MPa at the 10,000th cycle, due to interphase oxidation in steam conditions; and the hysteresis loops of matrix cracking modes 3 and 5 correspond to interface slip Case 2 and Case 2 when N = 100, Case 4 and Case 2 when N = 1000, and Case 4 and Case 4 when N = 10,000, respectively. The interface shear stress degradation rate is 9 × 10⁻⁴ MPa/cycle. When the loading frequency is 1 Hz, the interface shear stress decreases from 10 MPa at the 1000th cycle to 3 MPa at the 30,000th cycle, due to interphase oxidation in steam conditions; and the hysteresis loops of matrix cracking mode 3 and mode 5 correspond to interface slip Case 2 and Case 2 when N = 1000, Case 2 and Case 4 when N = 10,000, and Case 4 and Case 4 when N = 30,000, respectively. The interface shear stress degradation rate is 2 × 10⁻⁴ MPa/cycle. The interface shear stress degradation rate under low loading frequency is higher than that under high loading frequency, i.e., 9 × 10⁻⁴ MPa/cycle at loading frequency of 0.1 Hz, versus 2 × 10⁻⁴ MPa/cycle at loading frequency of 1 Hz.


