
Mechanics Model for Simulating RC Hinges under Reversed Cyclic Loading


Abstract
:1. Introduction
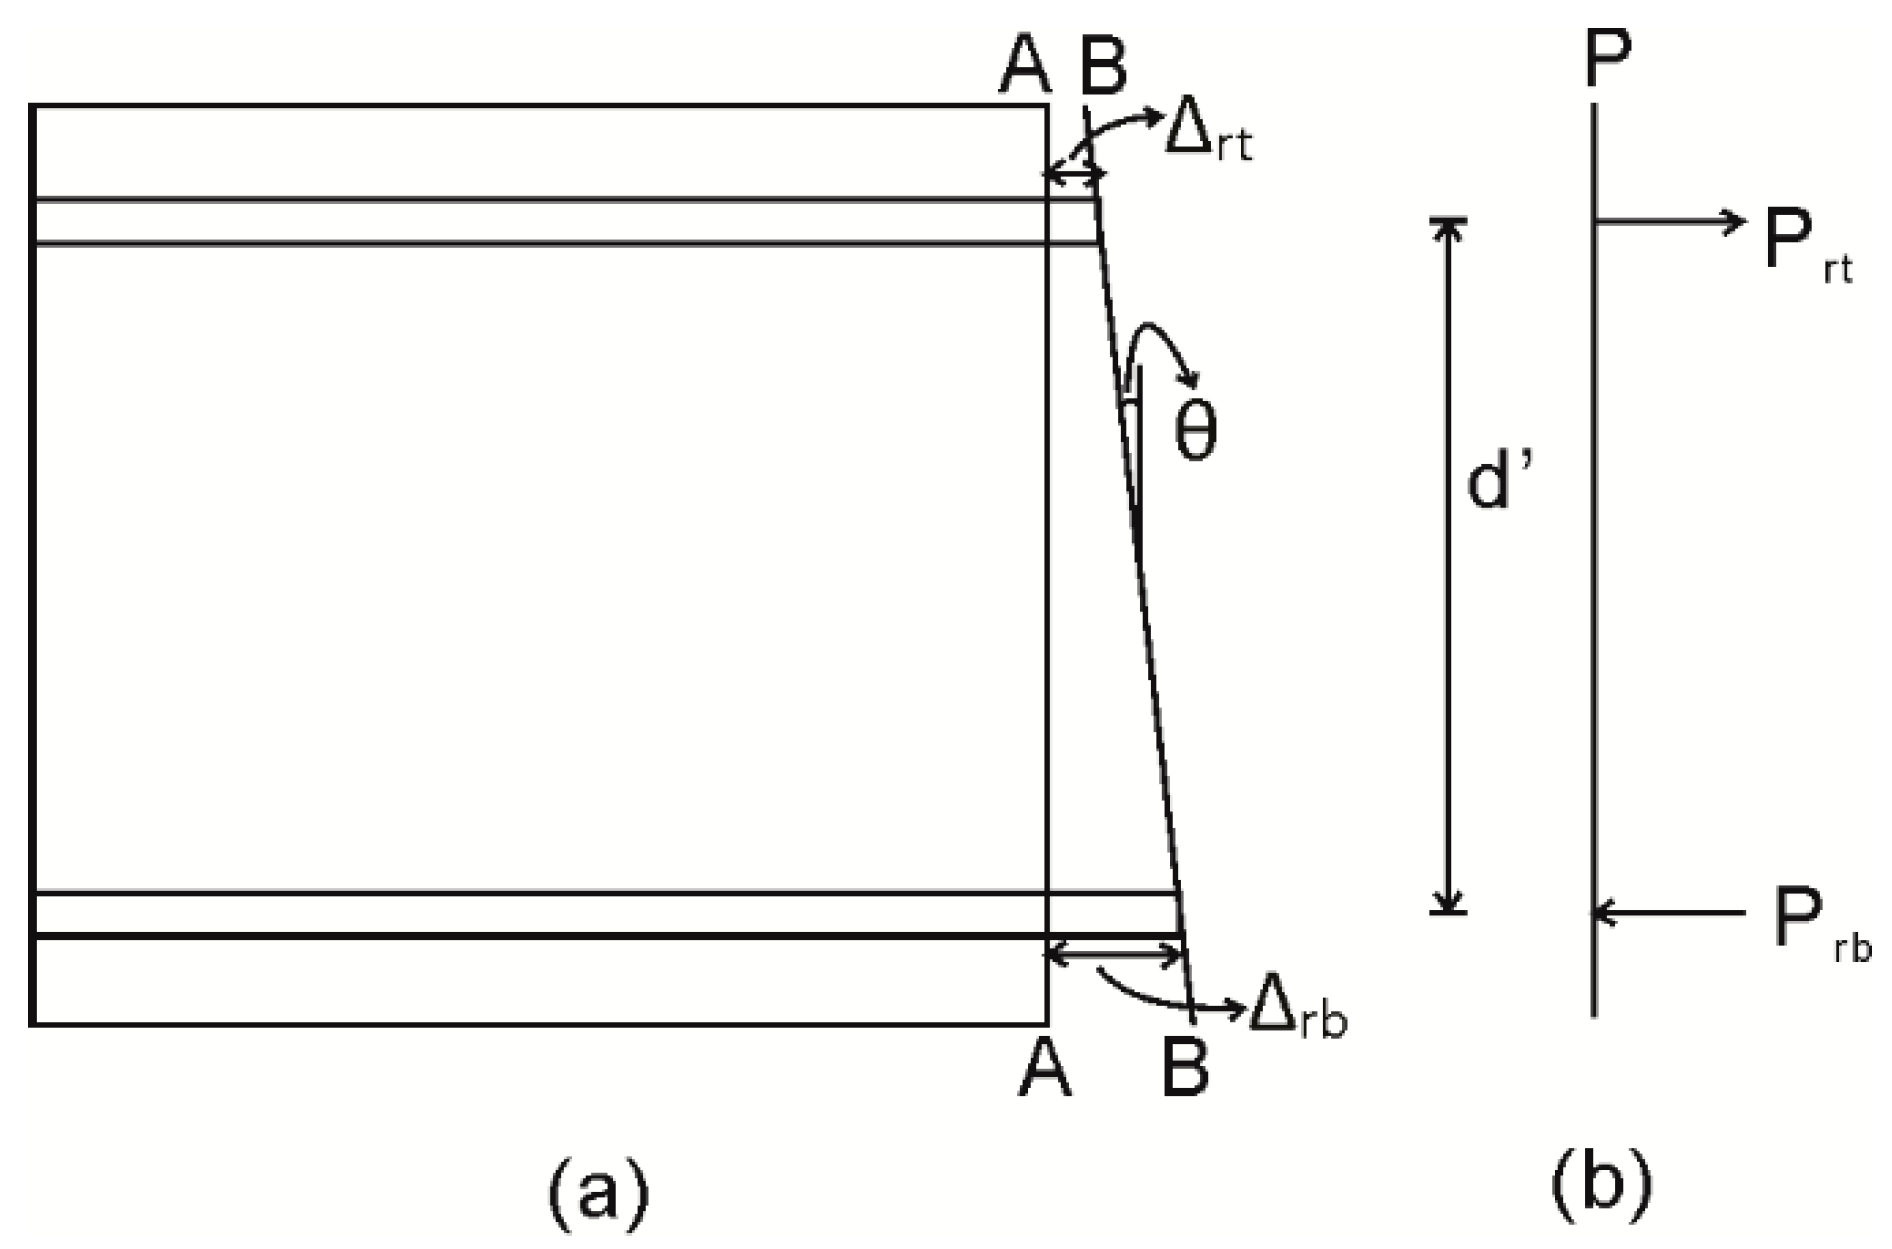
2. Segmental Moment Rotation Approach
- The required input data are inserted:
- Area of steel reinforcement, Ar.
- Area of adjacent concrete, Ac.
- Perimeter of steel reinforcement, Lper.
- Concrete compressive strength, fc.
- Concrete elastic modulus, Ec.
- Concrete tensile strength, ft.
- Concrete cracking strain, εcr = ft/Ec.
- Yield strength of steel reinforcement, σy.
- Ultimate strength of steel reinforcement, σf.
- Elastic modulus of steel reinforcement, Ey.
- Strain hardening modulus of steel reinforcement, Eh.
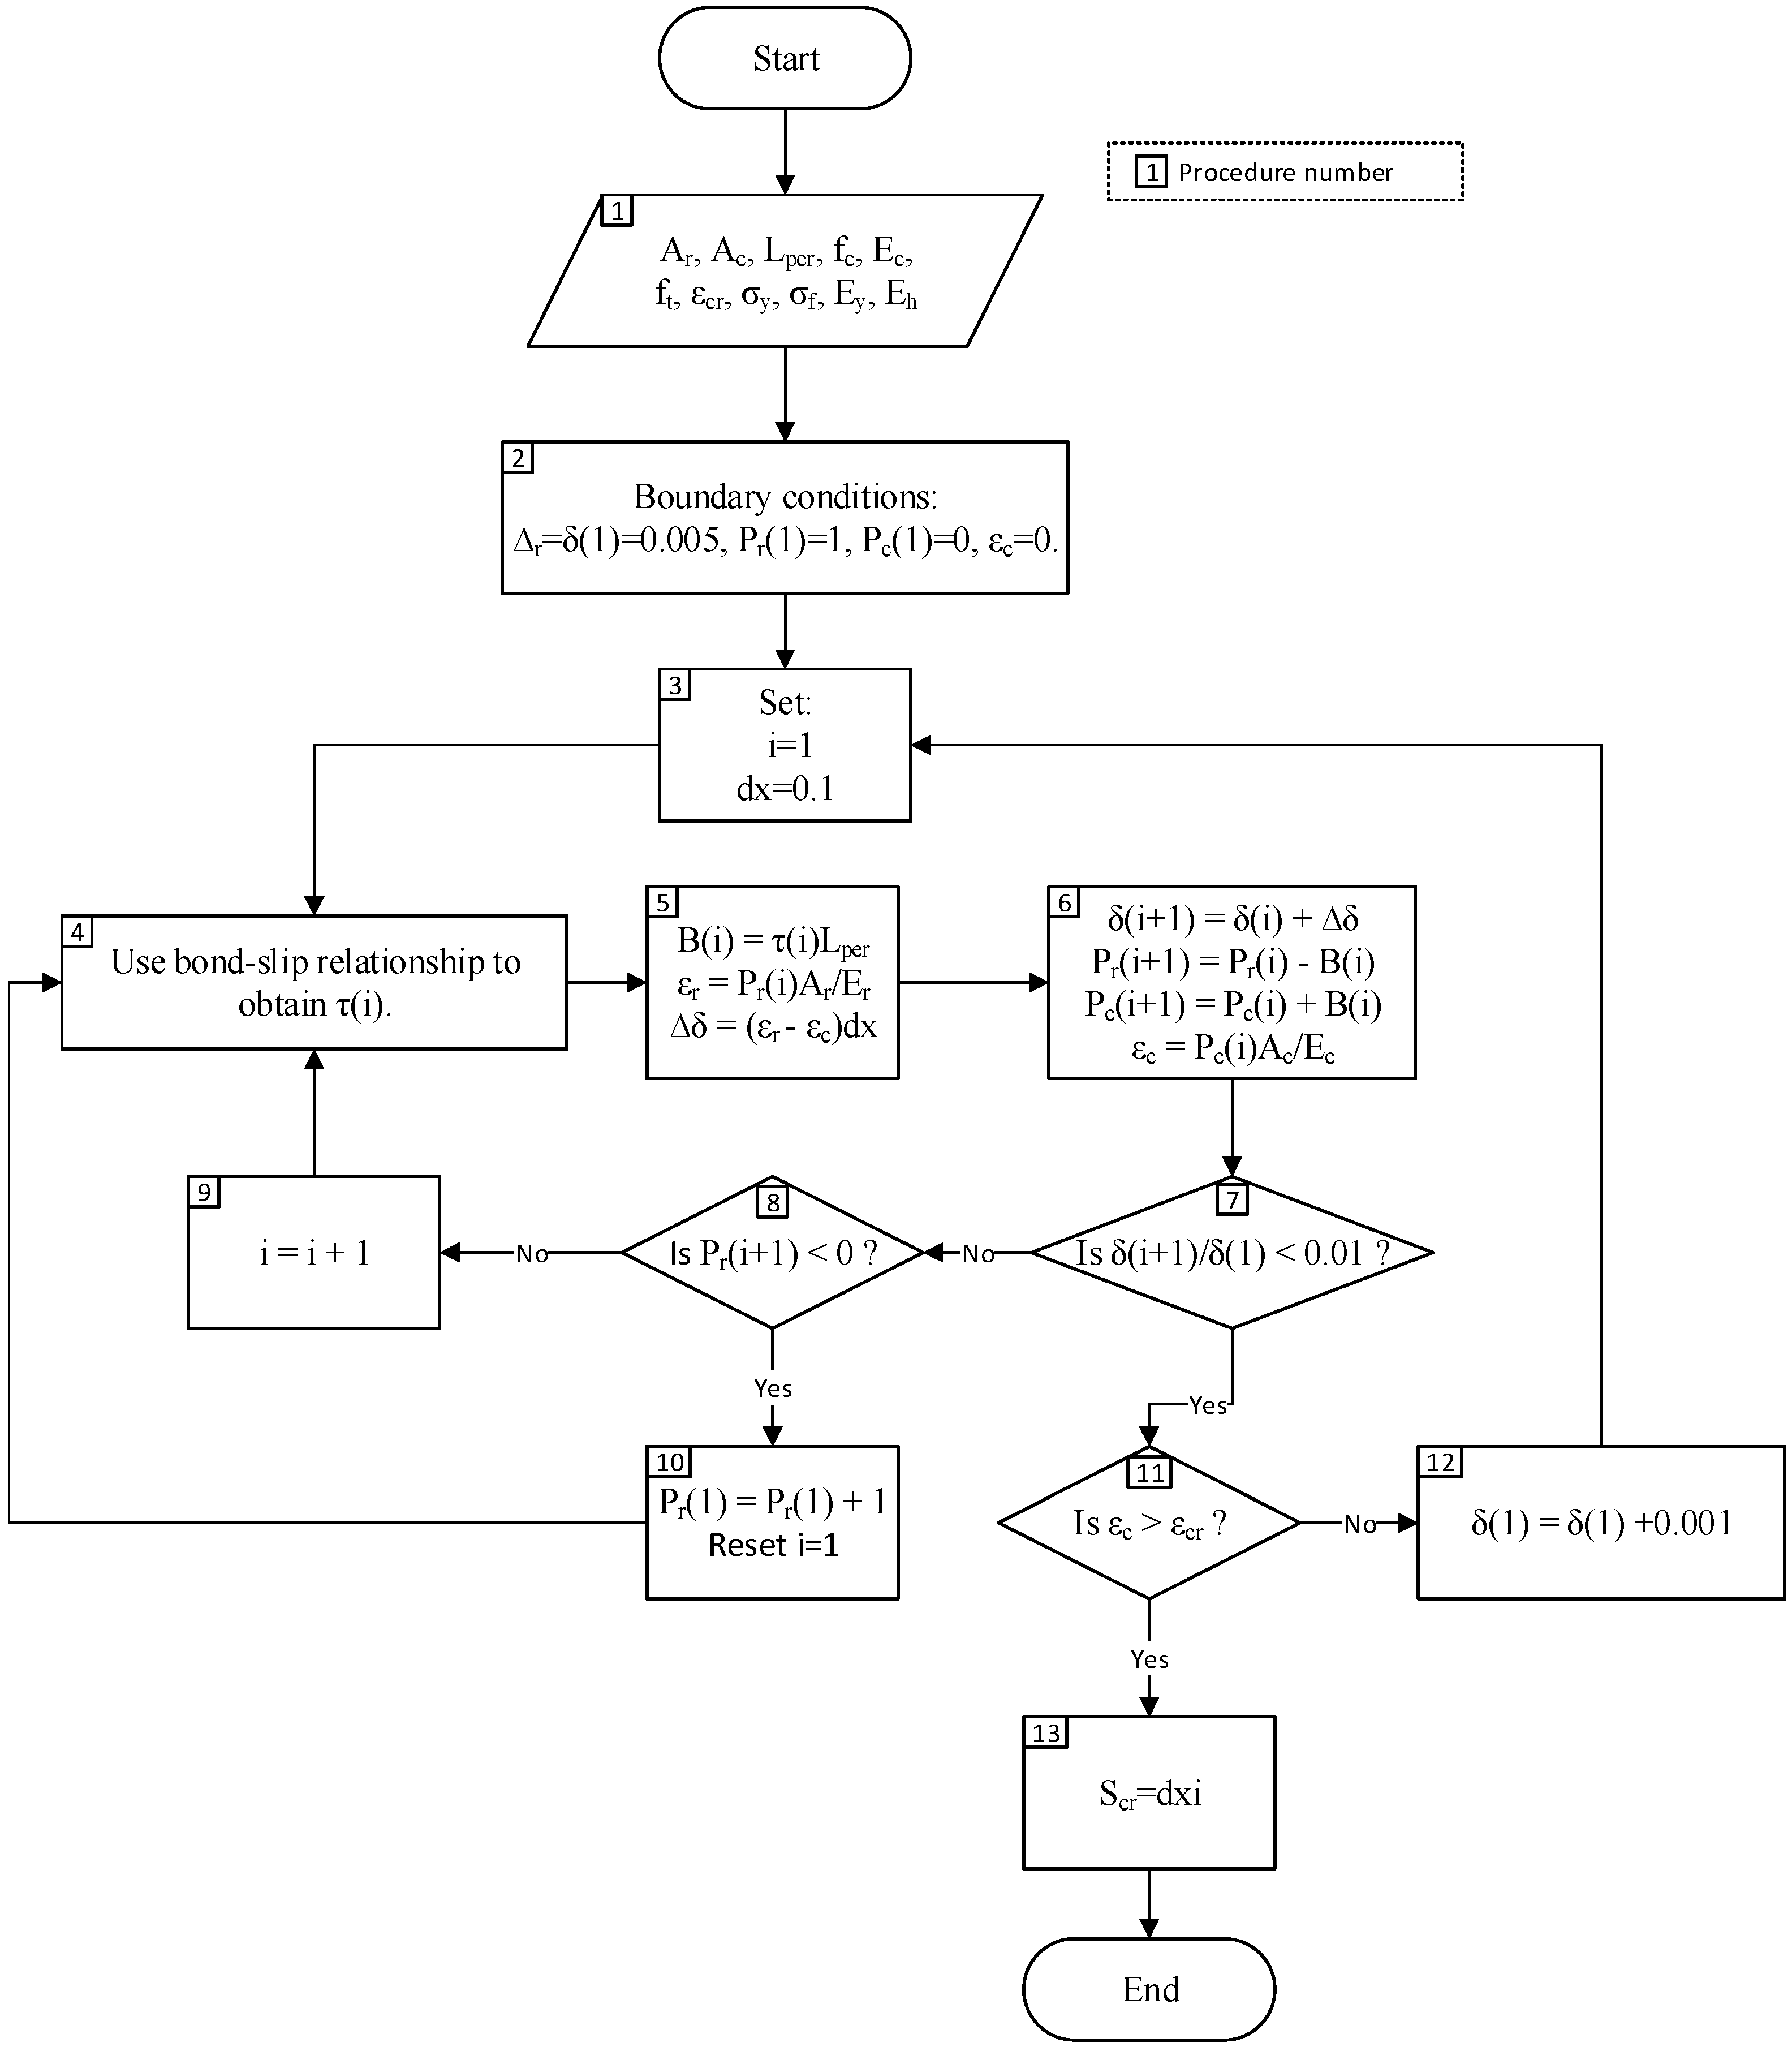
- The first element is located at the crack face. Several boundary conditions are used:
- The slip at the crack face, Δr = δ(1) = 0.005 mm.
- Load applied on the adjacent concrete, Pc(1) = 0 as the concrete-concrete interfaces are not touching at the crack face.
- Load applied on steel reinforcement, Pr(1) is assumed to be 1 N.
- The dummy variable “i” is used to determine the number of the segment being solved. The initial value where i = 1 is used to determine the location of crack face, and larger values of i is the distance from the crack face. The length of one segment, dx = 0.1 mm.
- Bond stress, τ(i) is determined using the bond-slip relationship from Comité euro-international du béton-Fédération Internationale de la Précontrainte (CEB-FIP) model code.
- The bond force, which must be known to know how much load is transferred from the steel reinforcement to the adjacent concrete, is determined as B(i) = τ(i)Lper. Strain of steel reinforcement is determined as εr = Pr(i)Ar/Er. The change in slip is then determined as ∆δ = (εr − εc)dx.
- With the value of B(i) and ∆δ determined, the values of boundary conditions for the next beam segment can be calculated. Note that the value of B(i) and ∆δ must be known for these to be calculated.
- δ(i + 1) = δ(i) + ∆δ
- Pr(i + 1) = Pr(i) − B(i)
- Pc(i + 1) = Pc(i) + B(i)
- εc = Pc(i + 1)Ac/Ec
- In practice it is not possible to reduce the slip completely to zero. As such the condition for full-interaction used is the reduction of slip such that δ(i + 1)/δ(1) < 0.01, which represents a 99% reduction from the original slip value at the crack face.
- If the previous condition is not met, the location of full-interaction is still not met and another condition is checked, which is Pr(i + 1) < 0.
- If the previous condition is also not met, the analysis will be repeated for the next beam segment; the dummy variable i increased by 1 and Procedures 2–7 are repeated.
- If the condition in Procedure 8 is met, the assumed value of applied load Pr(1) is too low as the Pr(i + 1) < 0 occurs prior to the full-interaction condition of δ(i + 1)/δ(1) < 0.01 is met. Procedures 2–7 are, thus, repeated with a higher value of assumed Pr(1).
- If Condition 7 is met, another condition is checked: εc > εcr.
- If Condition 11 is not met, the initial slip is too small to cause a primary crack and a larger value for the initial slip at the crack face, Δr, will be set. The procedure 2–10 will then be repeated.
- If Condition 11 is met, the primary crack has occurred. The required output from the analysis is the primary crack spacing which is determined as Scr = dxi.
3. Cyclic Tension Stiffening between Cracks
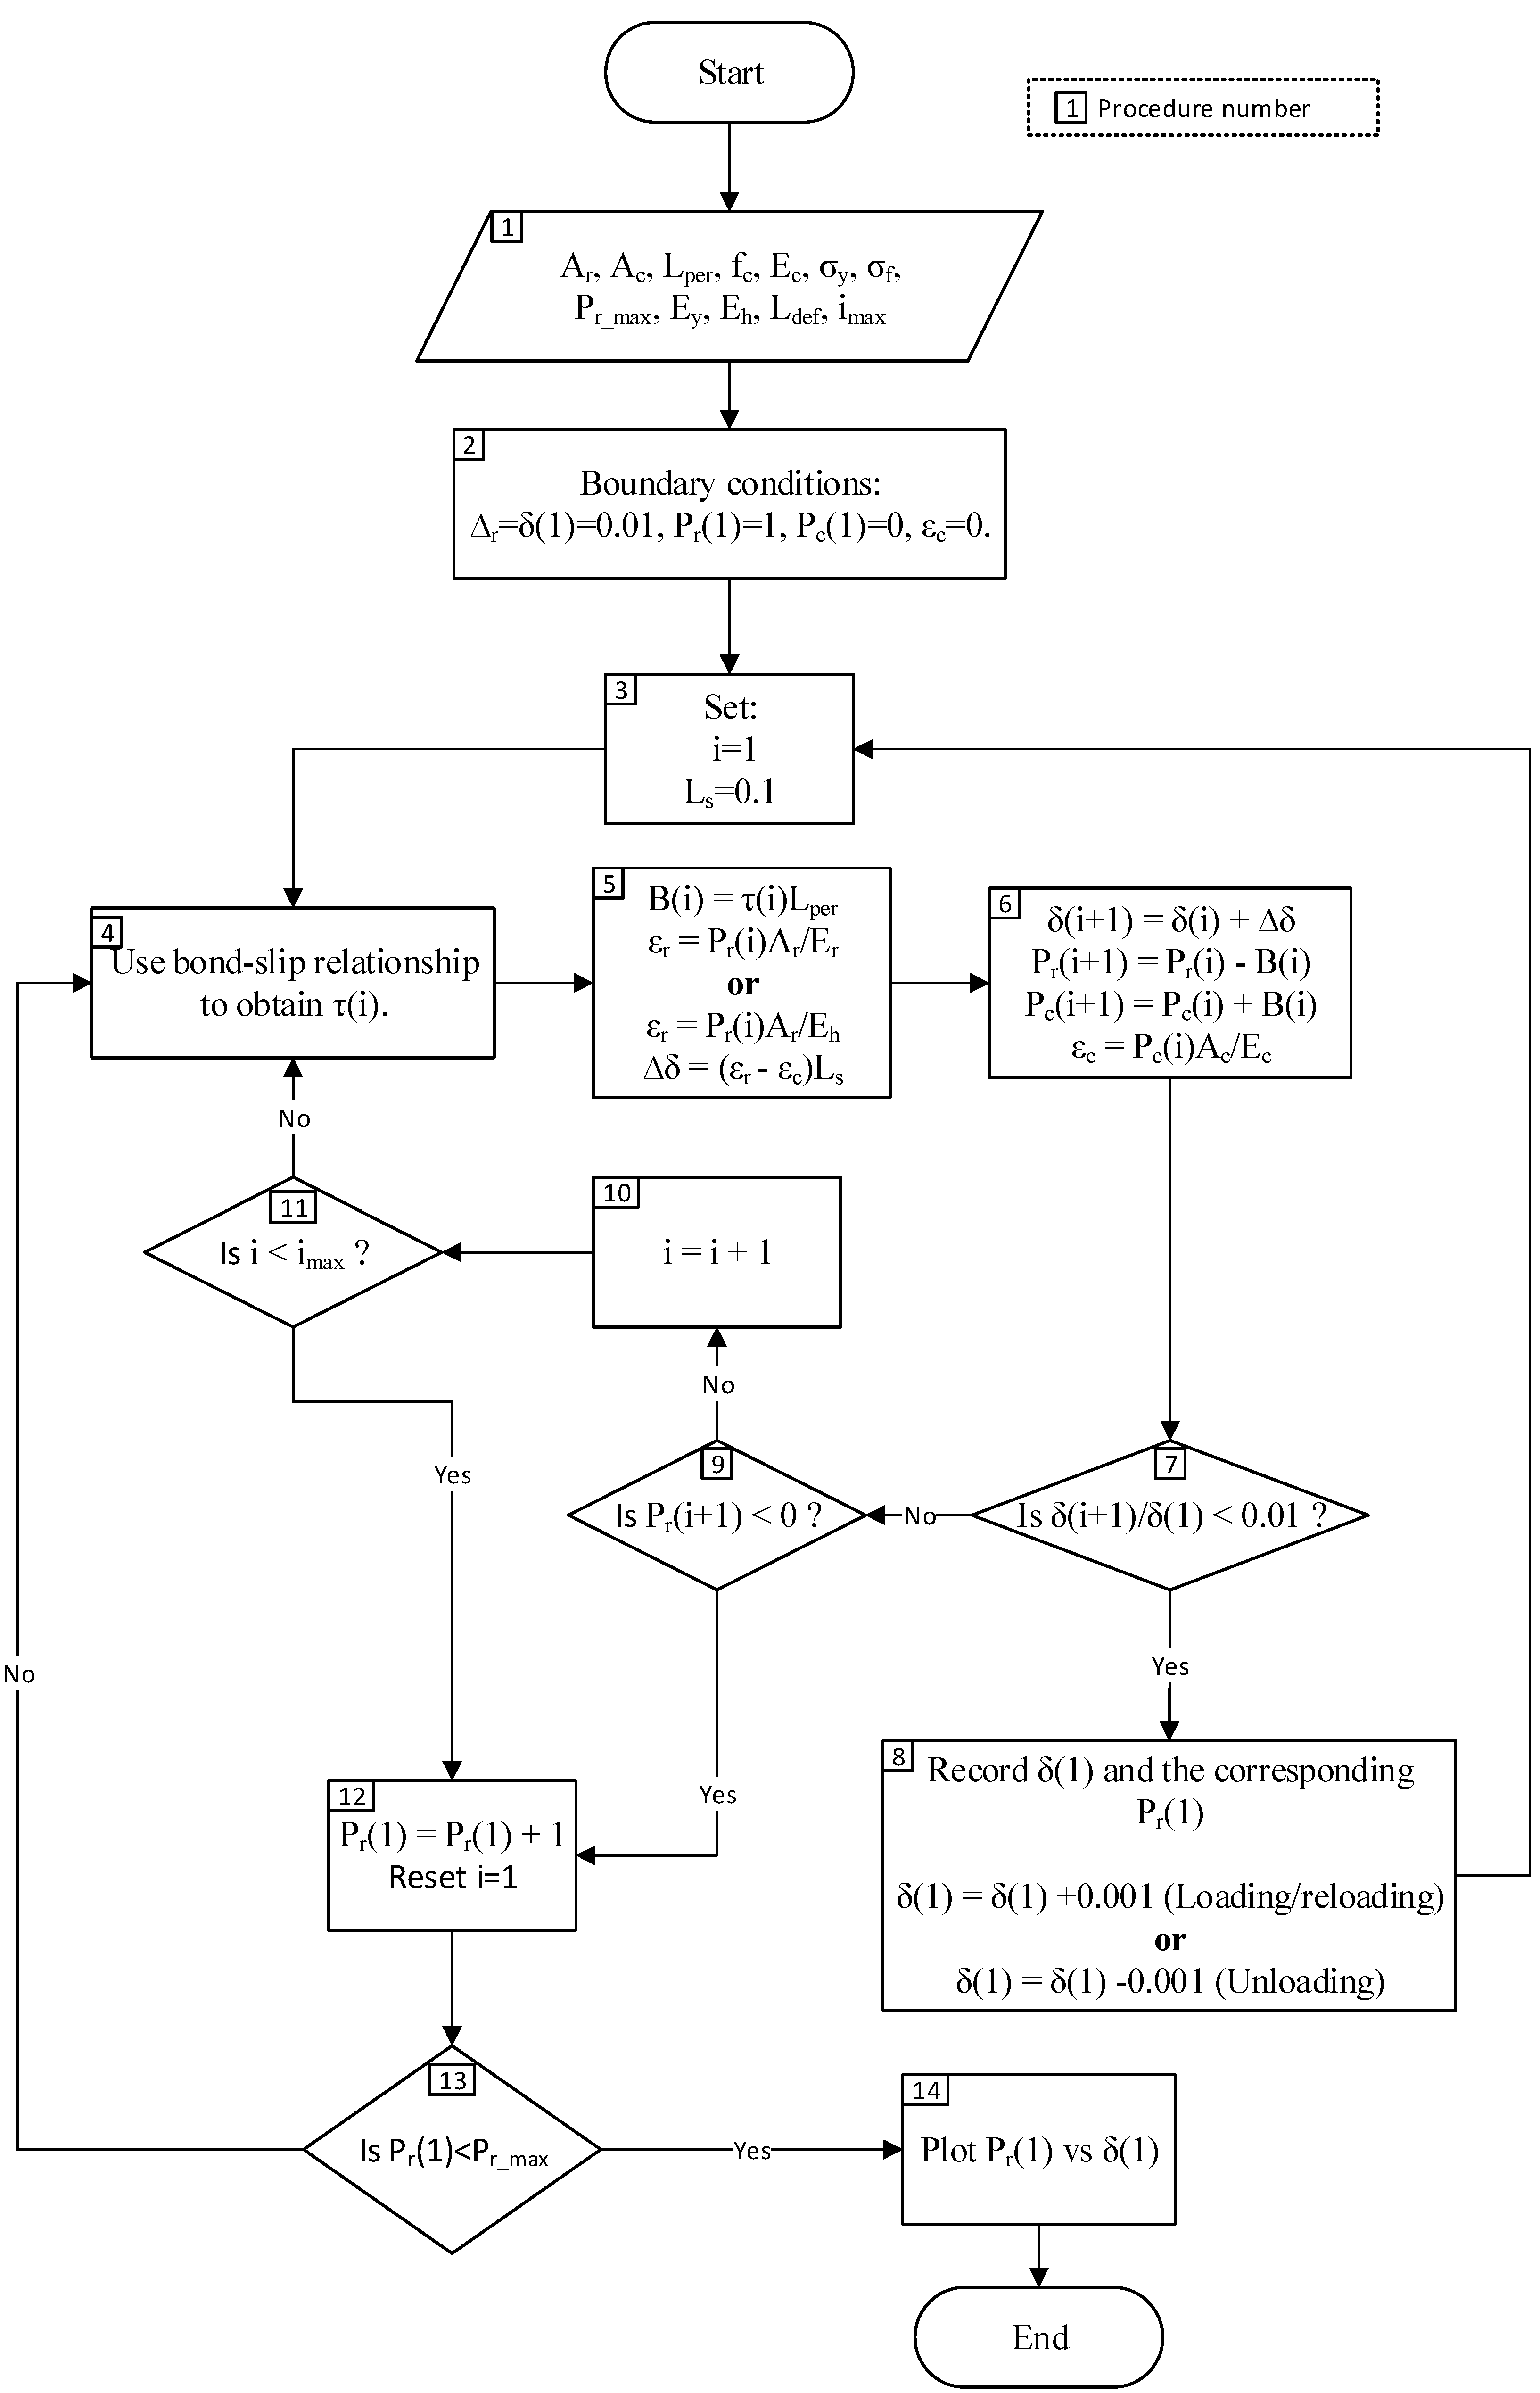
- The required input data are inserted:
- Area of steel reinforcement, Ar.
- Area of adjacent concrete, Ac.
- Perimeter of steel reinforcement, Lper.
- Concrete compressive strength, fc.
- Concrete elastic modulus, Ec.
- Yield strength of steel reinforcement (if applicable), σy.
- Ultimate strength of steel reinforcement, σf.
- Ultimate load of steel reinforcement, Pr_max = Arσf
- Elastic modulus of steel reinforcement, Ey.
- Strain hardening modulus of steel, Eh.
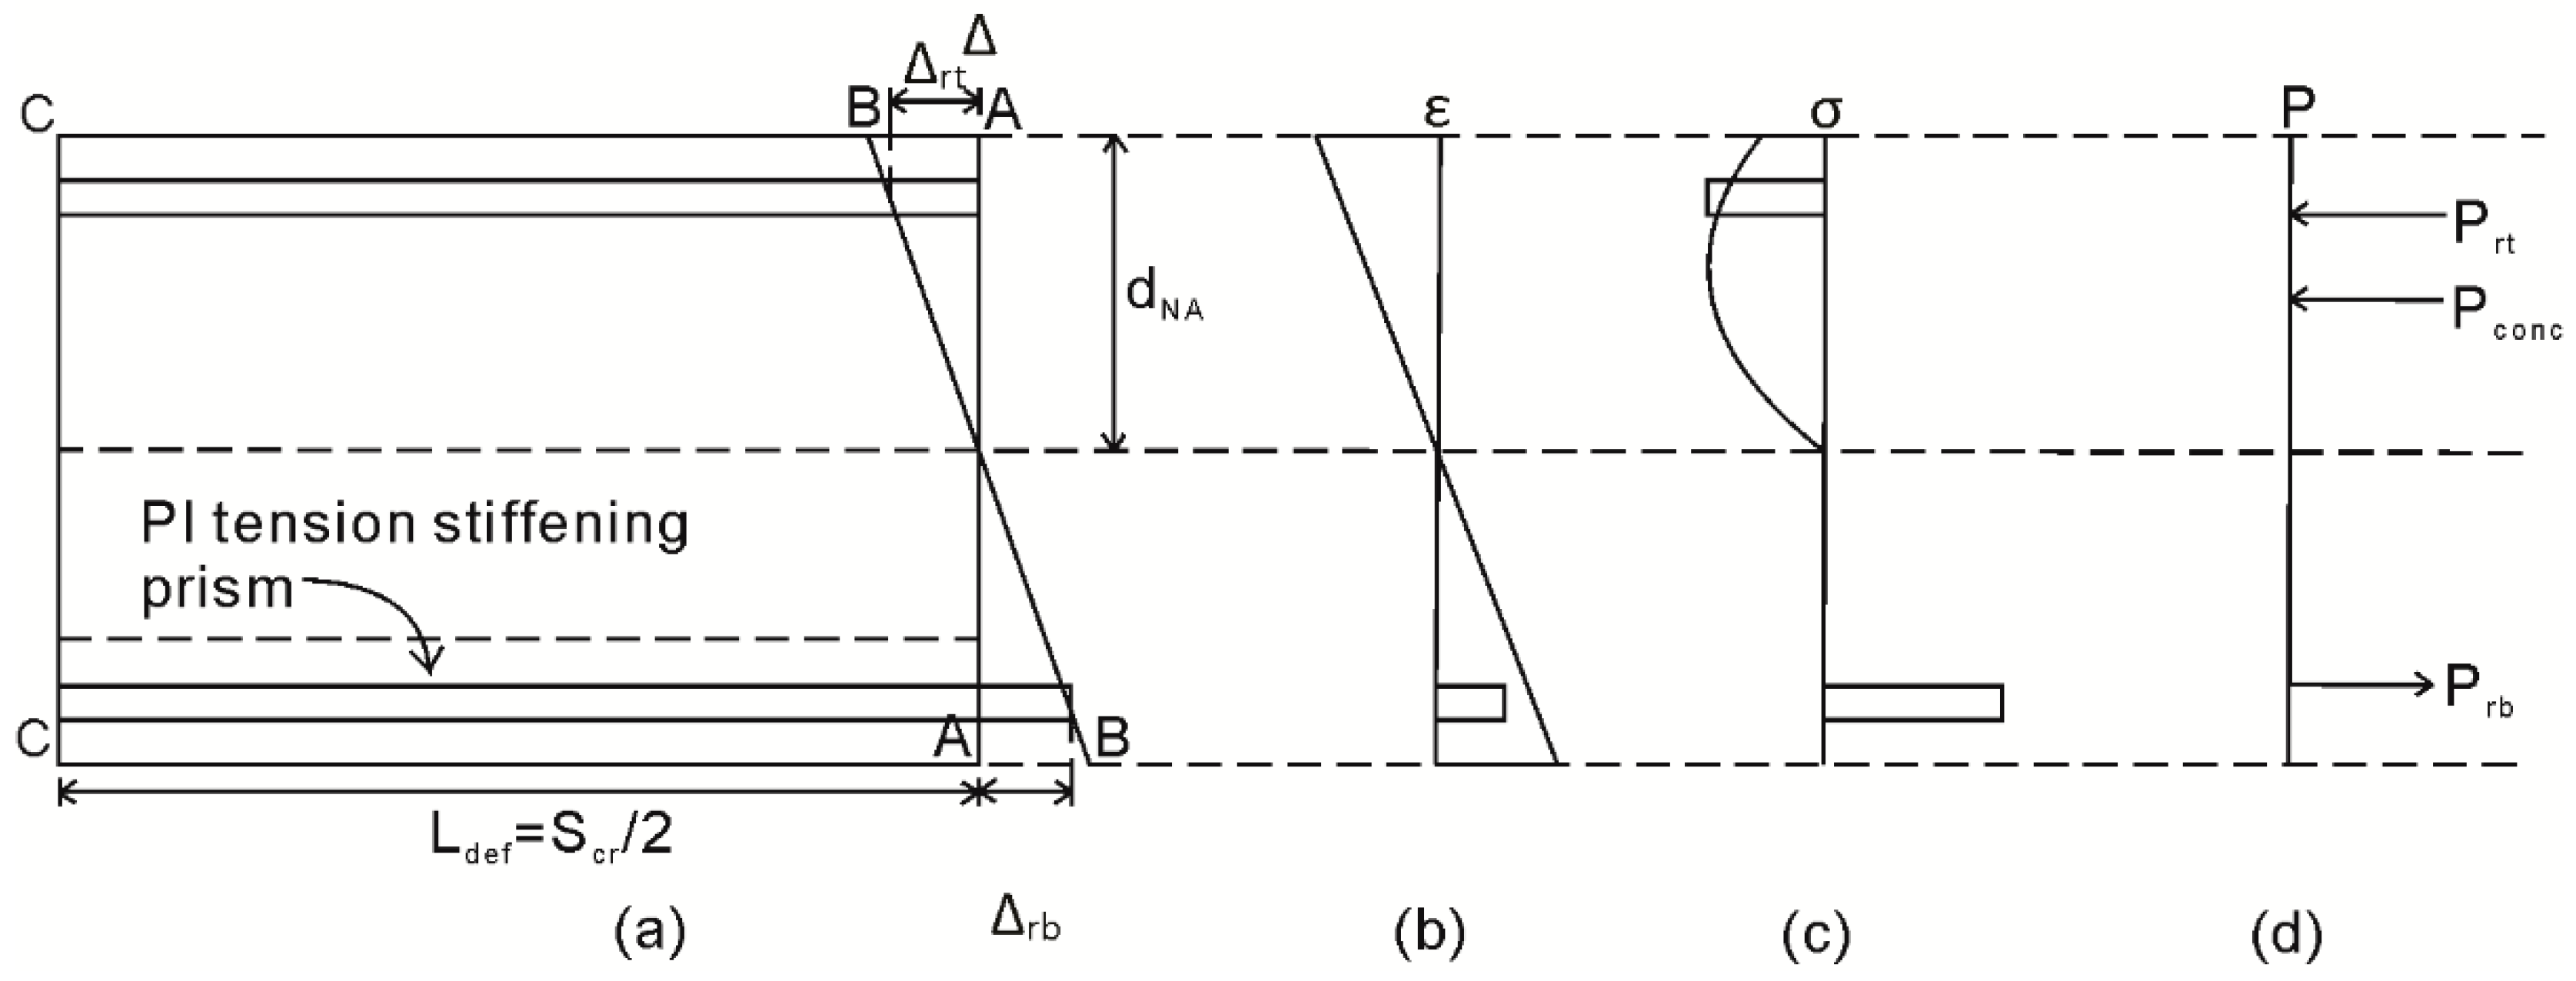
- Length of deformation, Ldef = Scr/2.
- Number of elements, imax = Ldef/dx.
- The boundary conditions are used are:
- The slip at the crack face, Δr = δ(1) = 0.01 mm.
- Load applied on the adjacent concrete, Pc(1) = 0 as the concrete-concrete interfaces are not touching at the crack face.
- Load applied on steel reinforcement, Pr(1) is assumed to be 1 N.
- The variable i = 1 is used to determine the location of crack face, and larger values of i is the distance from the crack face. The length of one segment, dx = 0.1 mm.
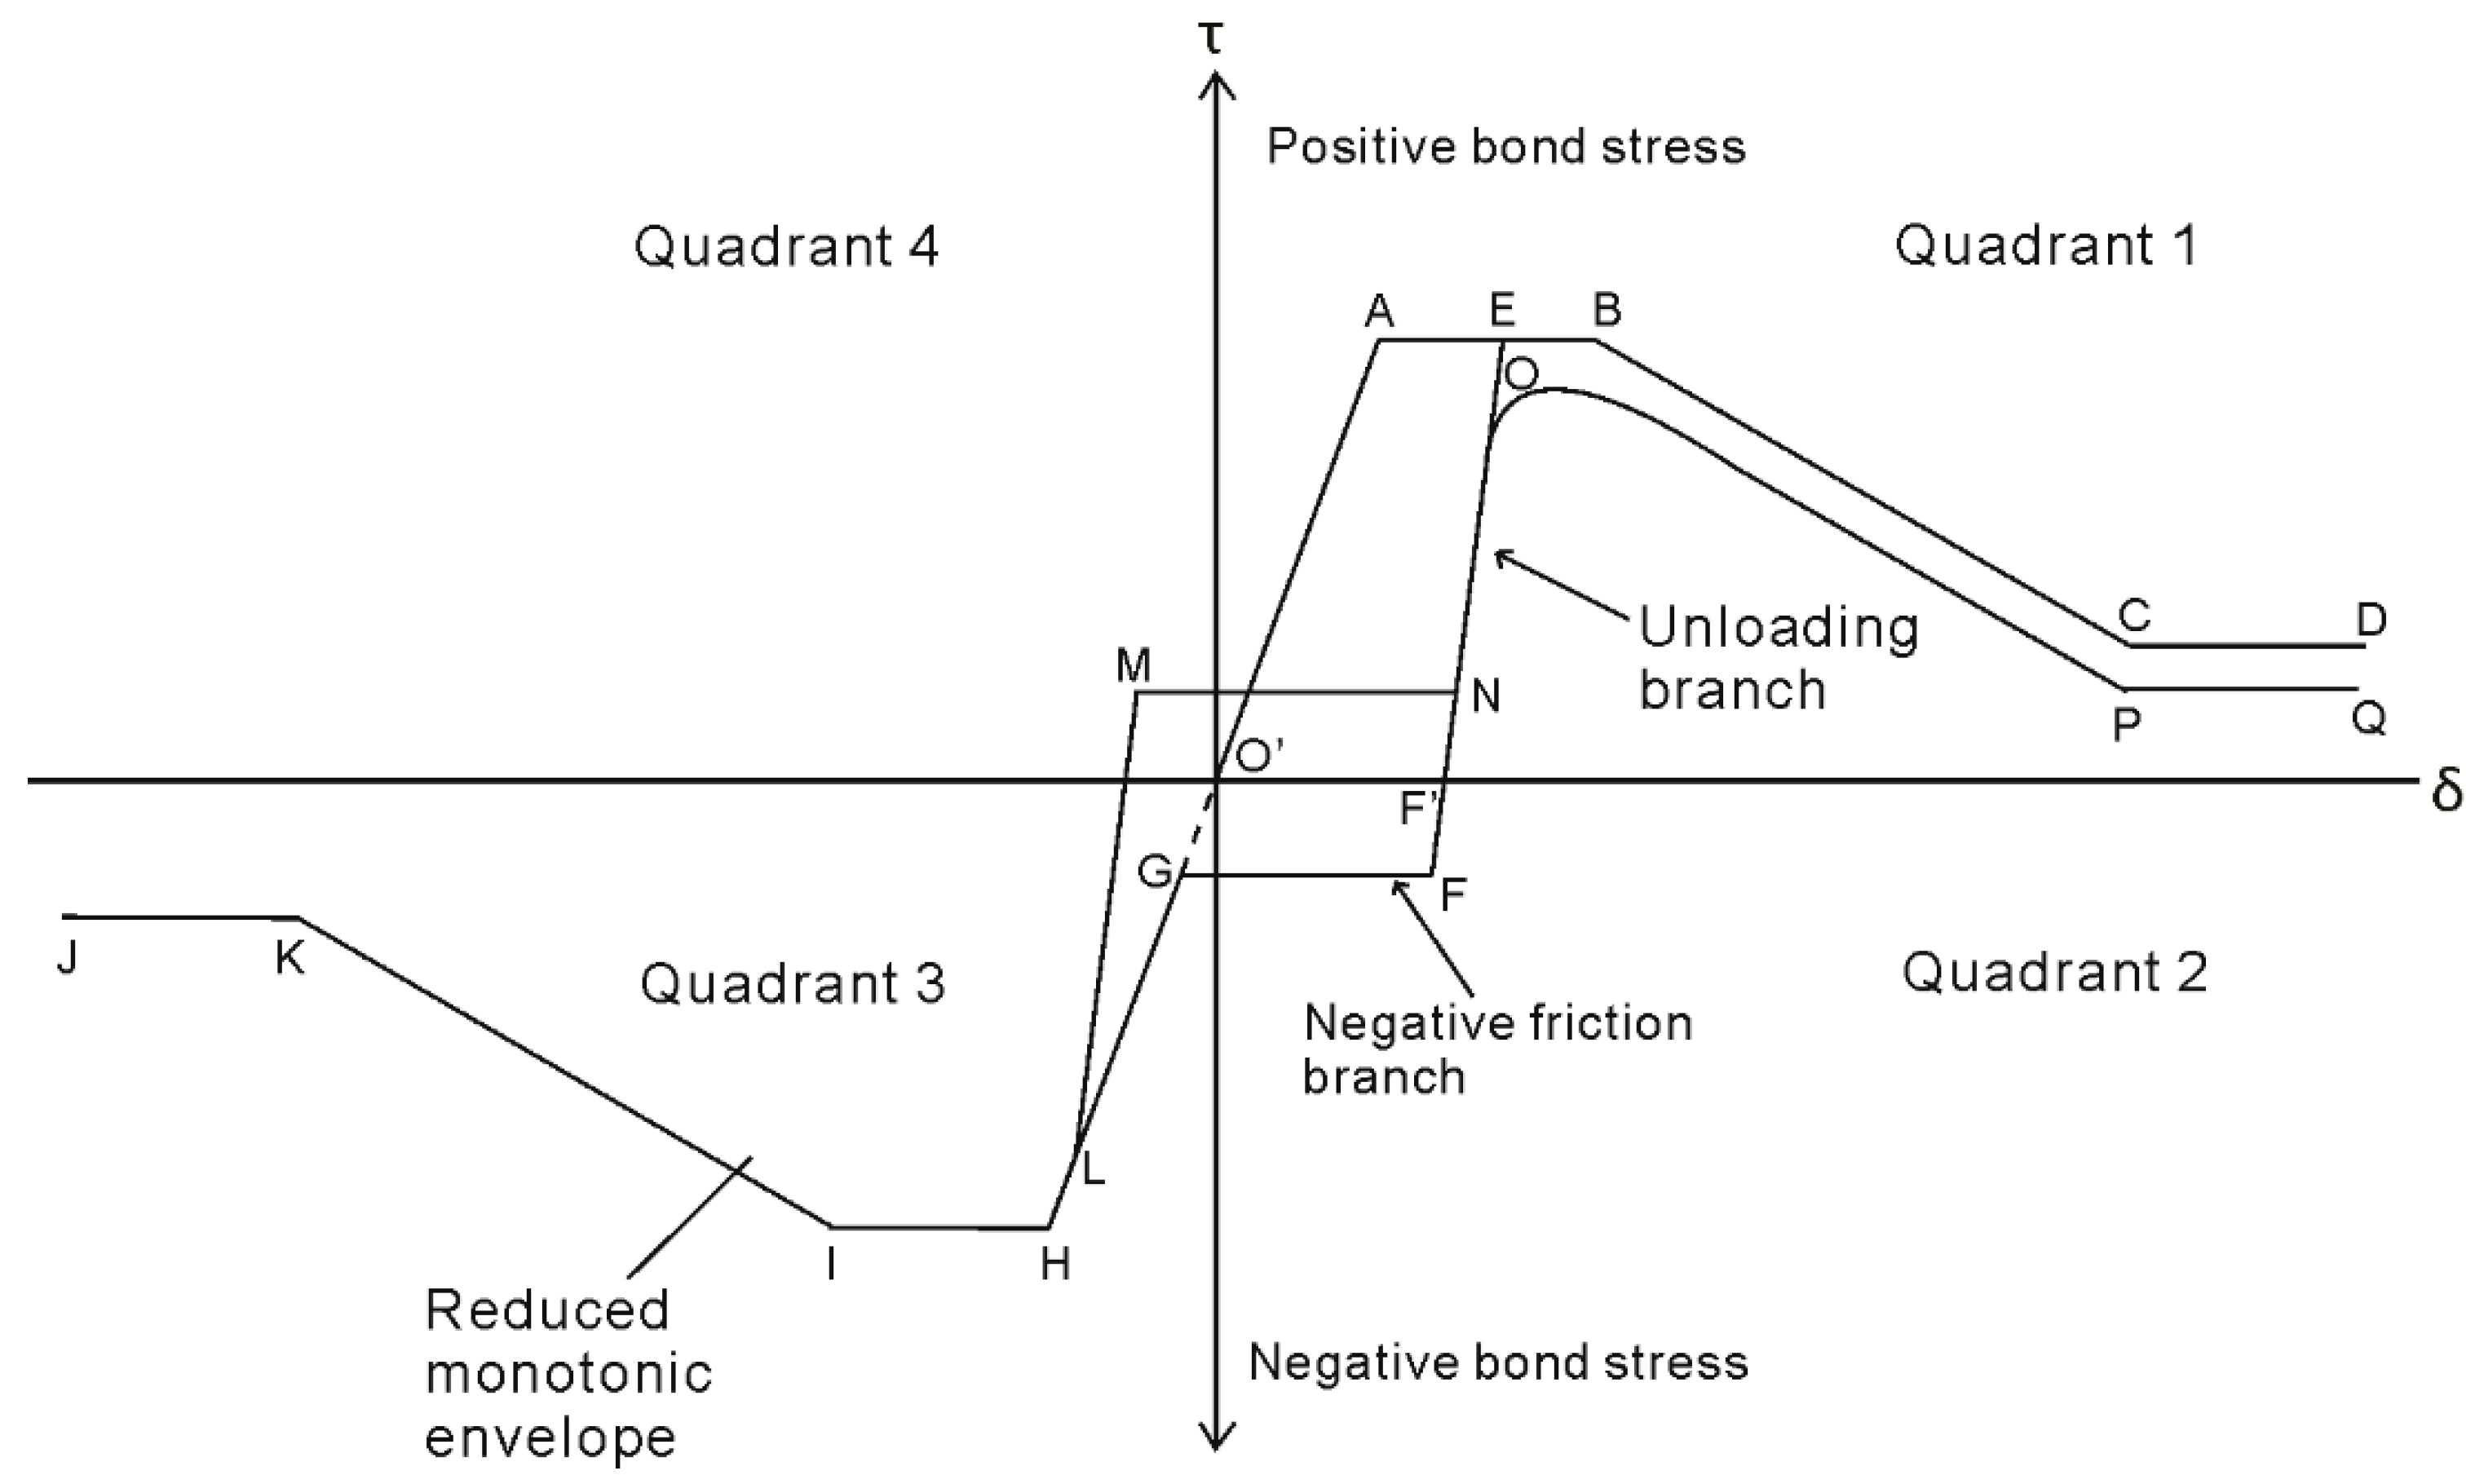
- Bond stress, τ(i) is determined using the cyclic bond-slip relationship from Eligehausen et al. [4].
- The bond force is determined as B(i) = τ(i)Lper. Strain of the reinforcement bar is determined as εr = Pr(i)Ar/Er. The change in slip is then determined as ∆δ = (εr − εc)dx.
- With the value of B(i) and ∆δ determined, the values of boundary conditions for the next beam segment can be calculated:
- δ(i + 1) = δ(i) + ∆δ
- Pr(i + 1) = Pr(i) − B(i)
- Pc(i + 1) = Pc(i) + B(i)
- εc = Pc(i + 1)Ac/Ec
- The condition for full-interaction used is the reduction of slip such that δ(i + 1)/δ(1) < 0.01, which represents a 99% reduction from the original slip value at the crack face.
- If condition in Procedure 7 is met, the assumed value of applied load Pr(1) is correct. The slip δ(1) and the corresponding Pr(1) is then recorded and a larger/smaller value of δ(1) is set, depending on whether the beam is being loaded or unloaded.
- If the condition in Procedure 7 is not met, the location of full-interaction is still not met and another condition is checked, which is Pr(i + 1) < 0.
- If the condition in Procedure 9 is also not met, the analysis will be repeated for the next beam segment; the dummy variable i increased by 1.
- Another condition is then checked, which is i < imax since the formation of primary cracks have limited the beam sections that are under partial interaction to half the crack spacing, also known as the length of deformation Ldef.
- If condition in procedure 9 is met, the assumed value of applied load Pr(1) is too low as the Pr(i + 1) < 0 occurs prior to the full-interaction condition of δ(i + 1)/δ(1) < 0.01 is met. A higher value of Pr(1) is thus assumed.
- The Pr(1) is checked whether it reaches or exceeds the ultimate load Pr_max. If the condition is not met, procedures 4–13 is repeated.
- If the condition in Procedure 13 is met, the steel reinforcement has fractured. The recoded values of Δr and Pr(1) are then plotted to obtain the Pr/Δr relationship.
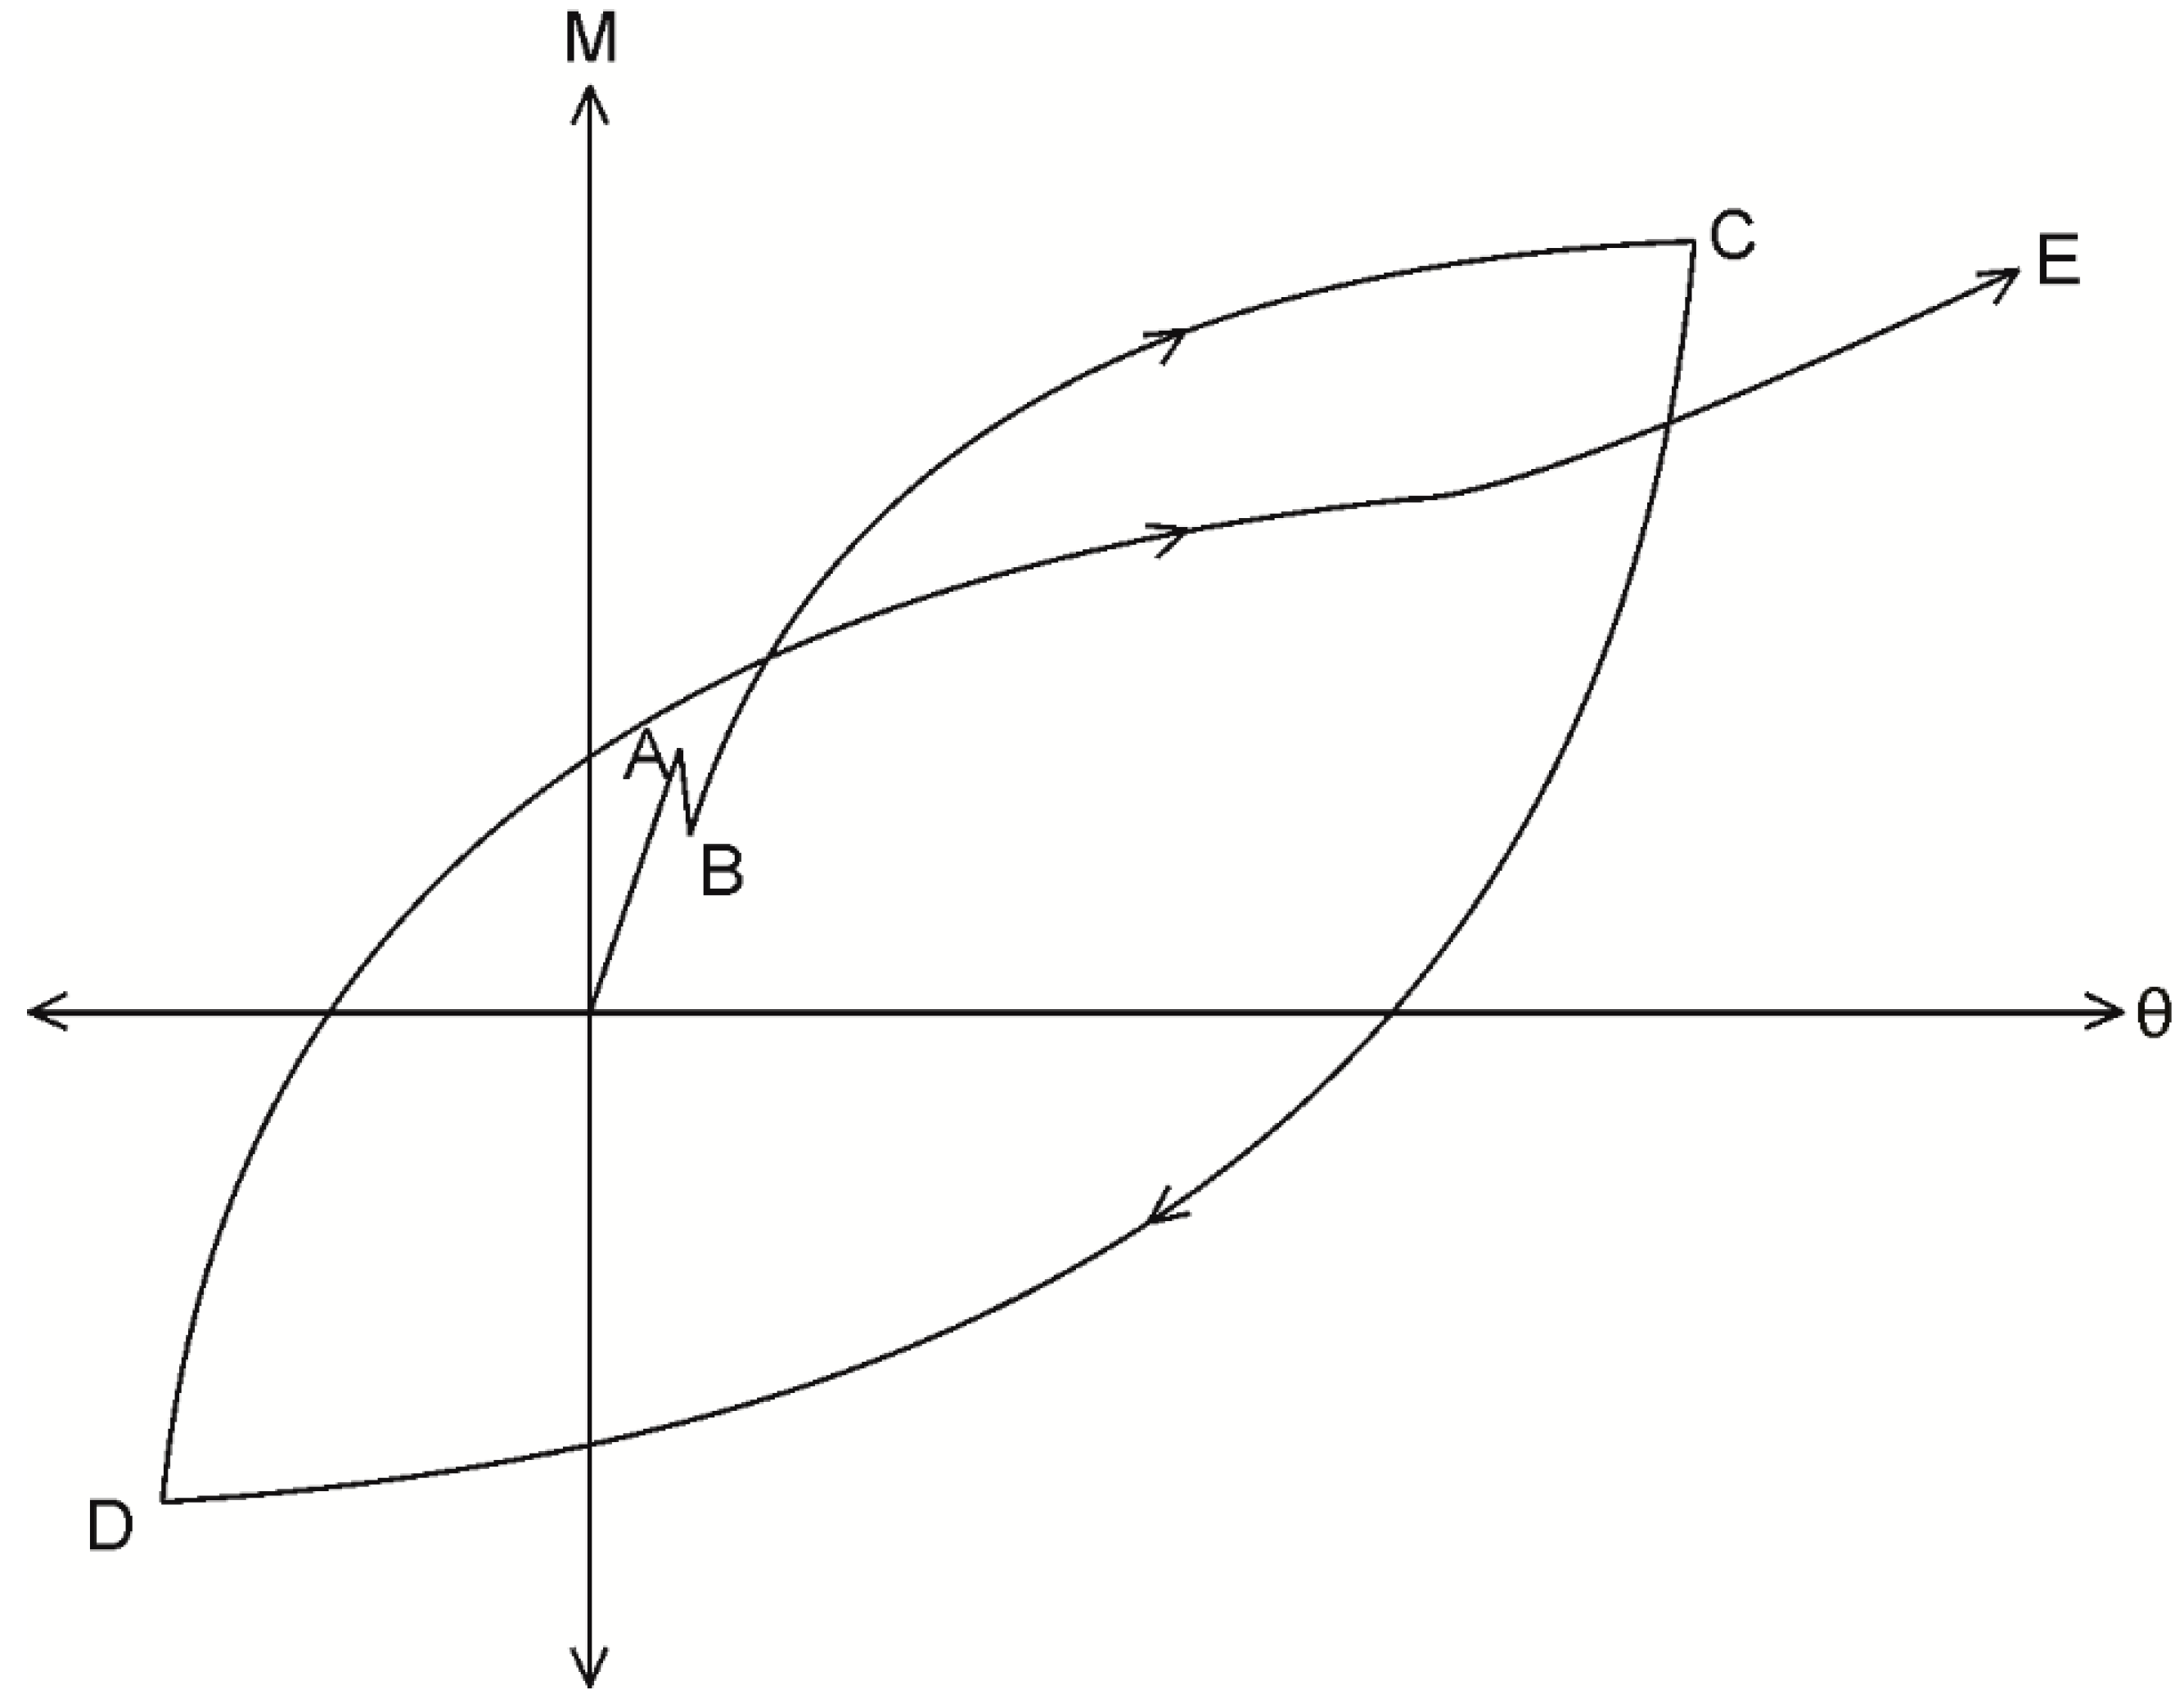
3.1. Initial Loading
3.2. Unloading Phase I (Reinforcement in Tension)
3.3. Unloading Phase II
3.4. Reloading
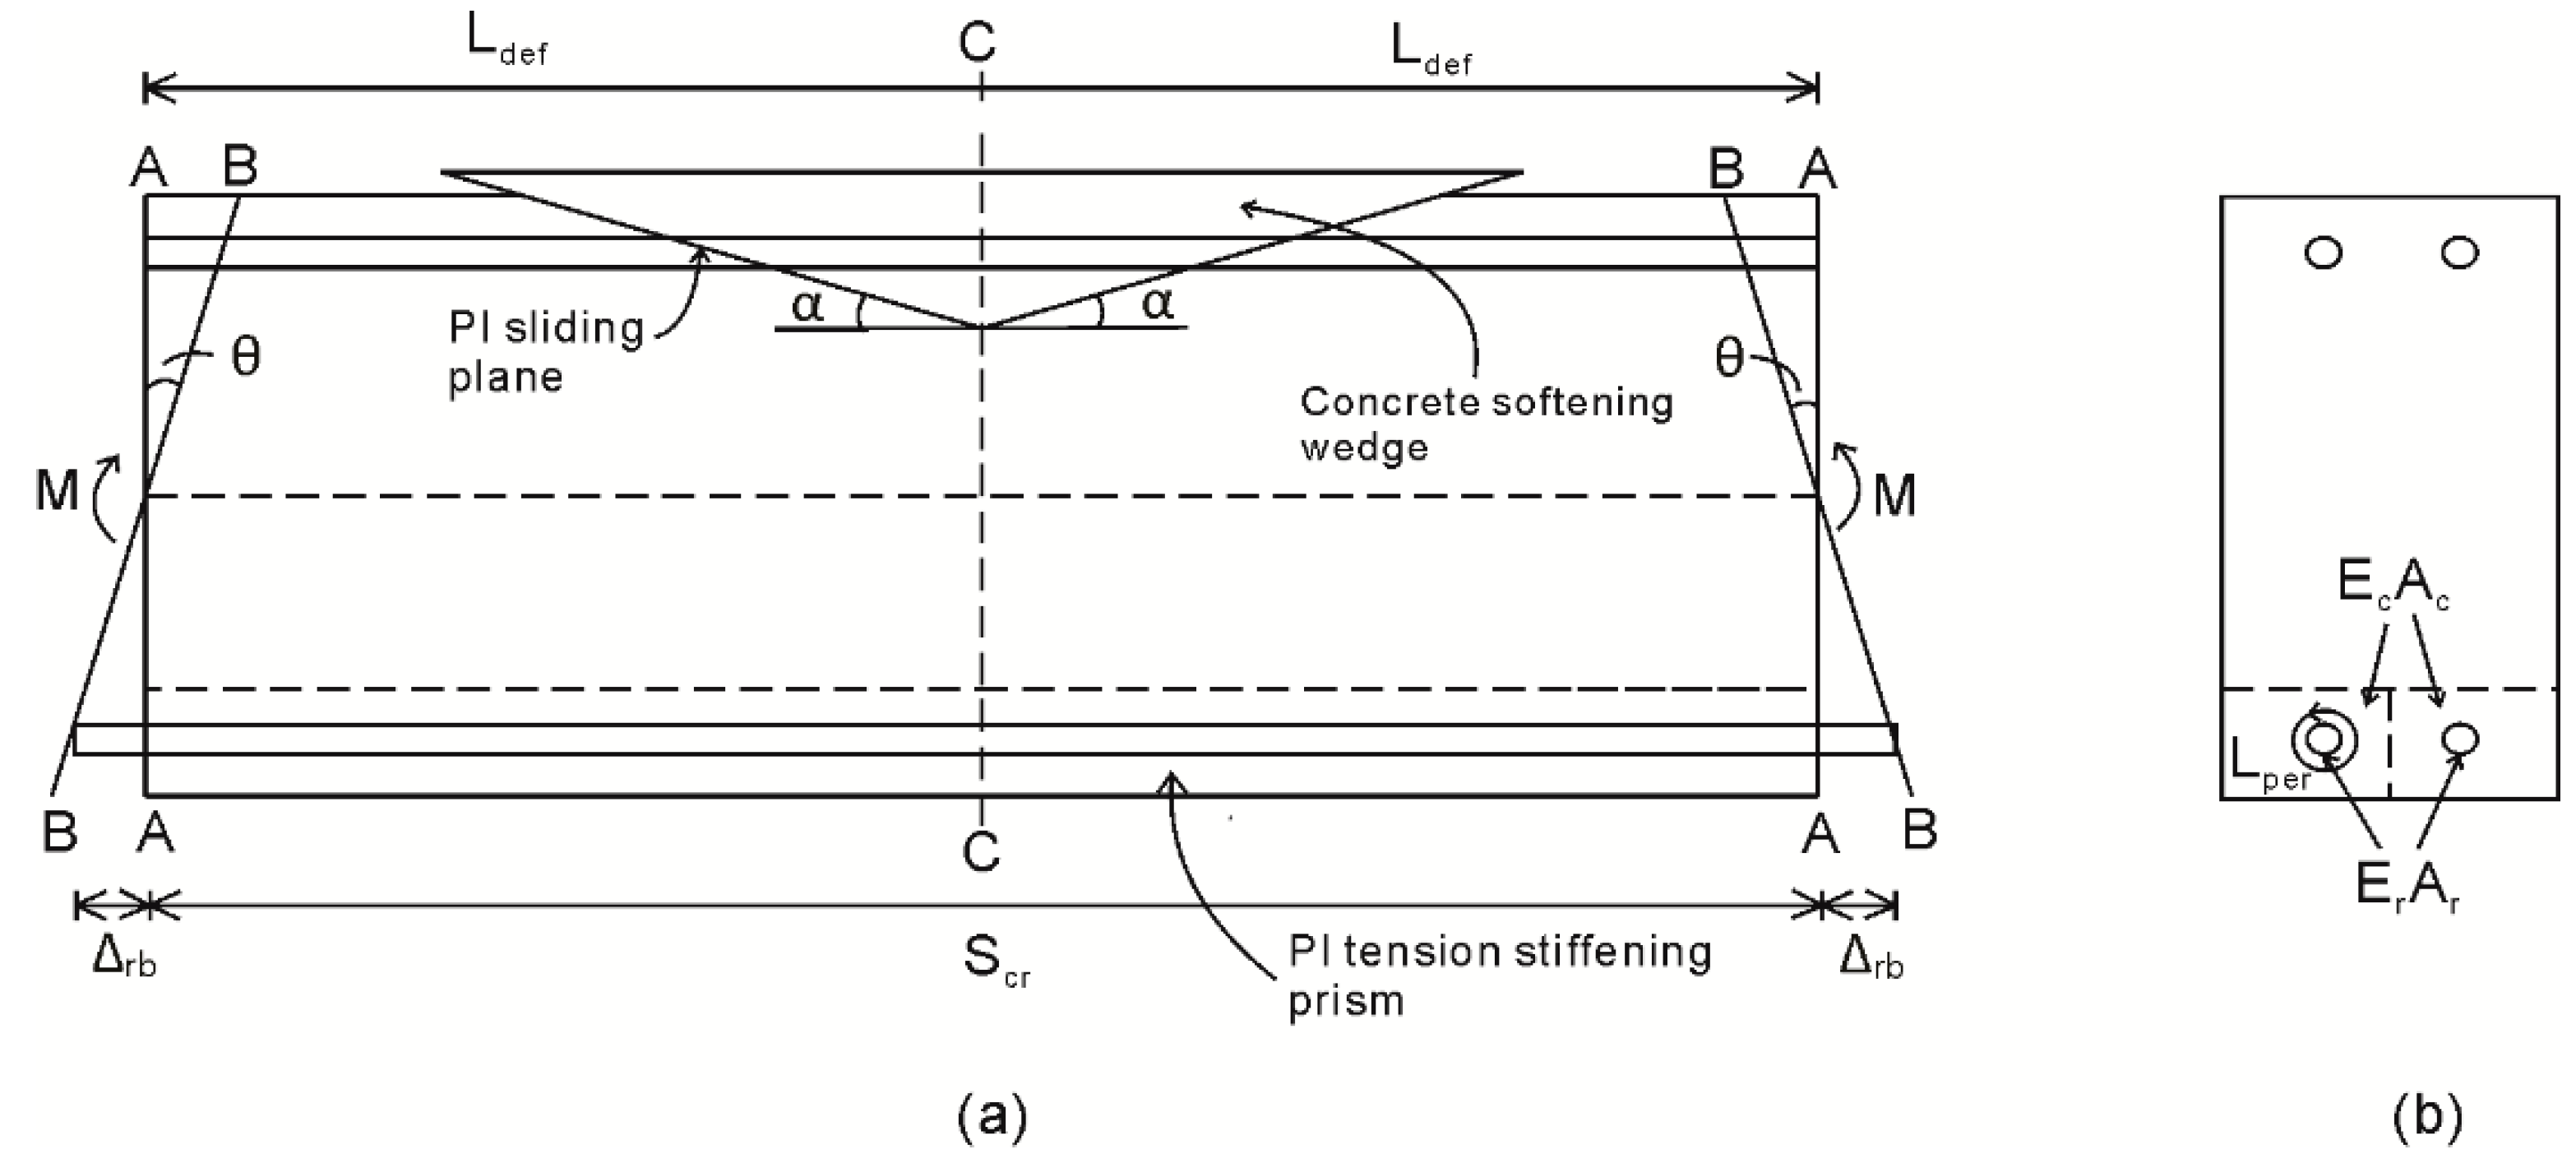
4. Cyclic Segmental Analysis between Adjacent Cracks
4.1. Unloading Partial Depth Cracking
4.2. Full Depth Cracking
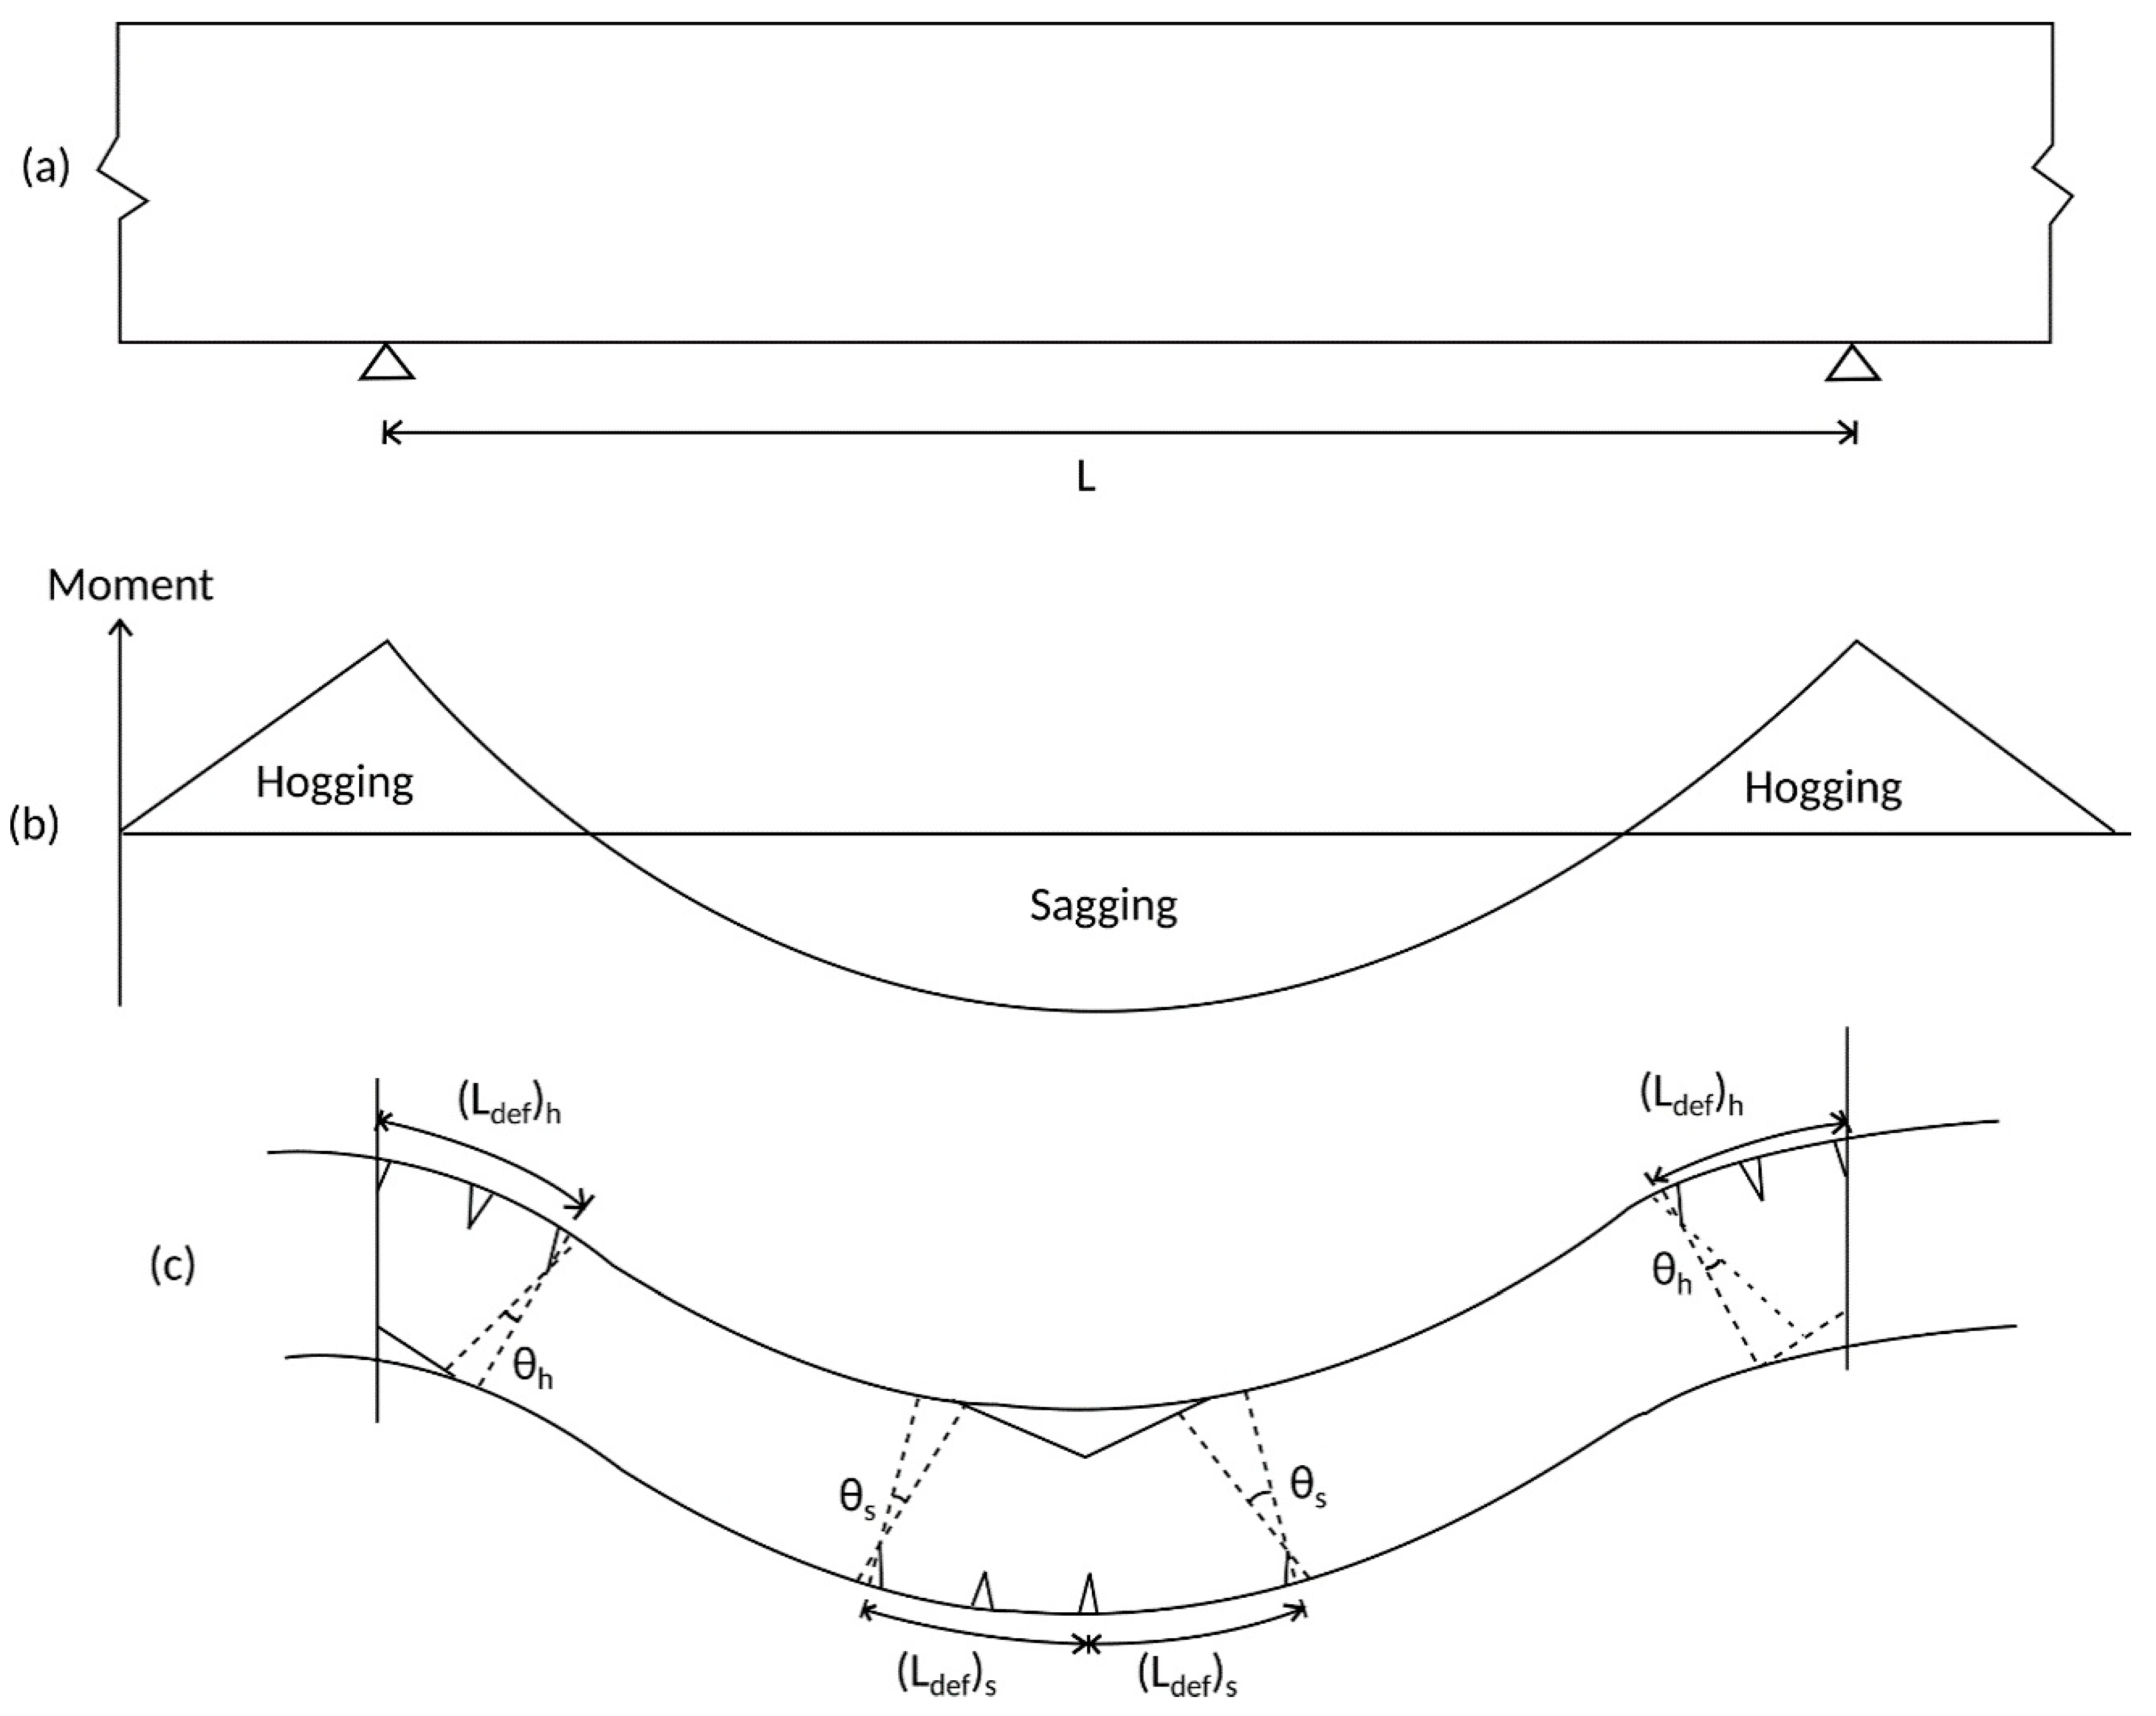
5. Cyclic Segmental Analysis in a Hinge
Multiple Cracking Analysis
6. Comparison with Test Results
Material Properties for Analysis
7. Conclusions
Acknowledgments
Author Contributions
Conflicts of Interest
Notations
| (Ldef)h | Length of deformation in the hogging section of the beam |
| (Ldef)s | Length of deformation in the sagging section of the beam |
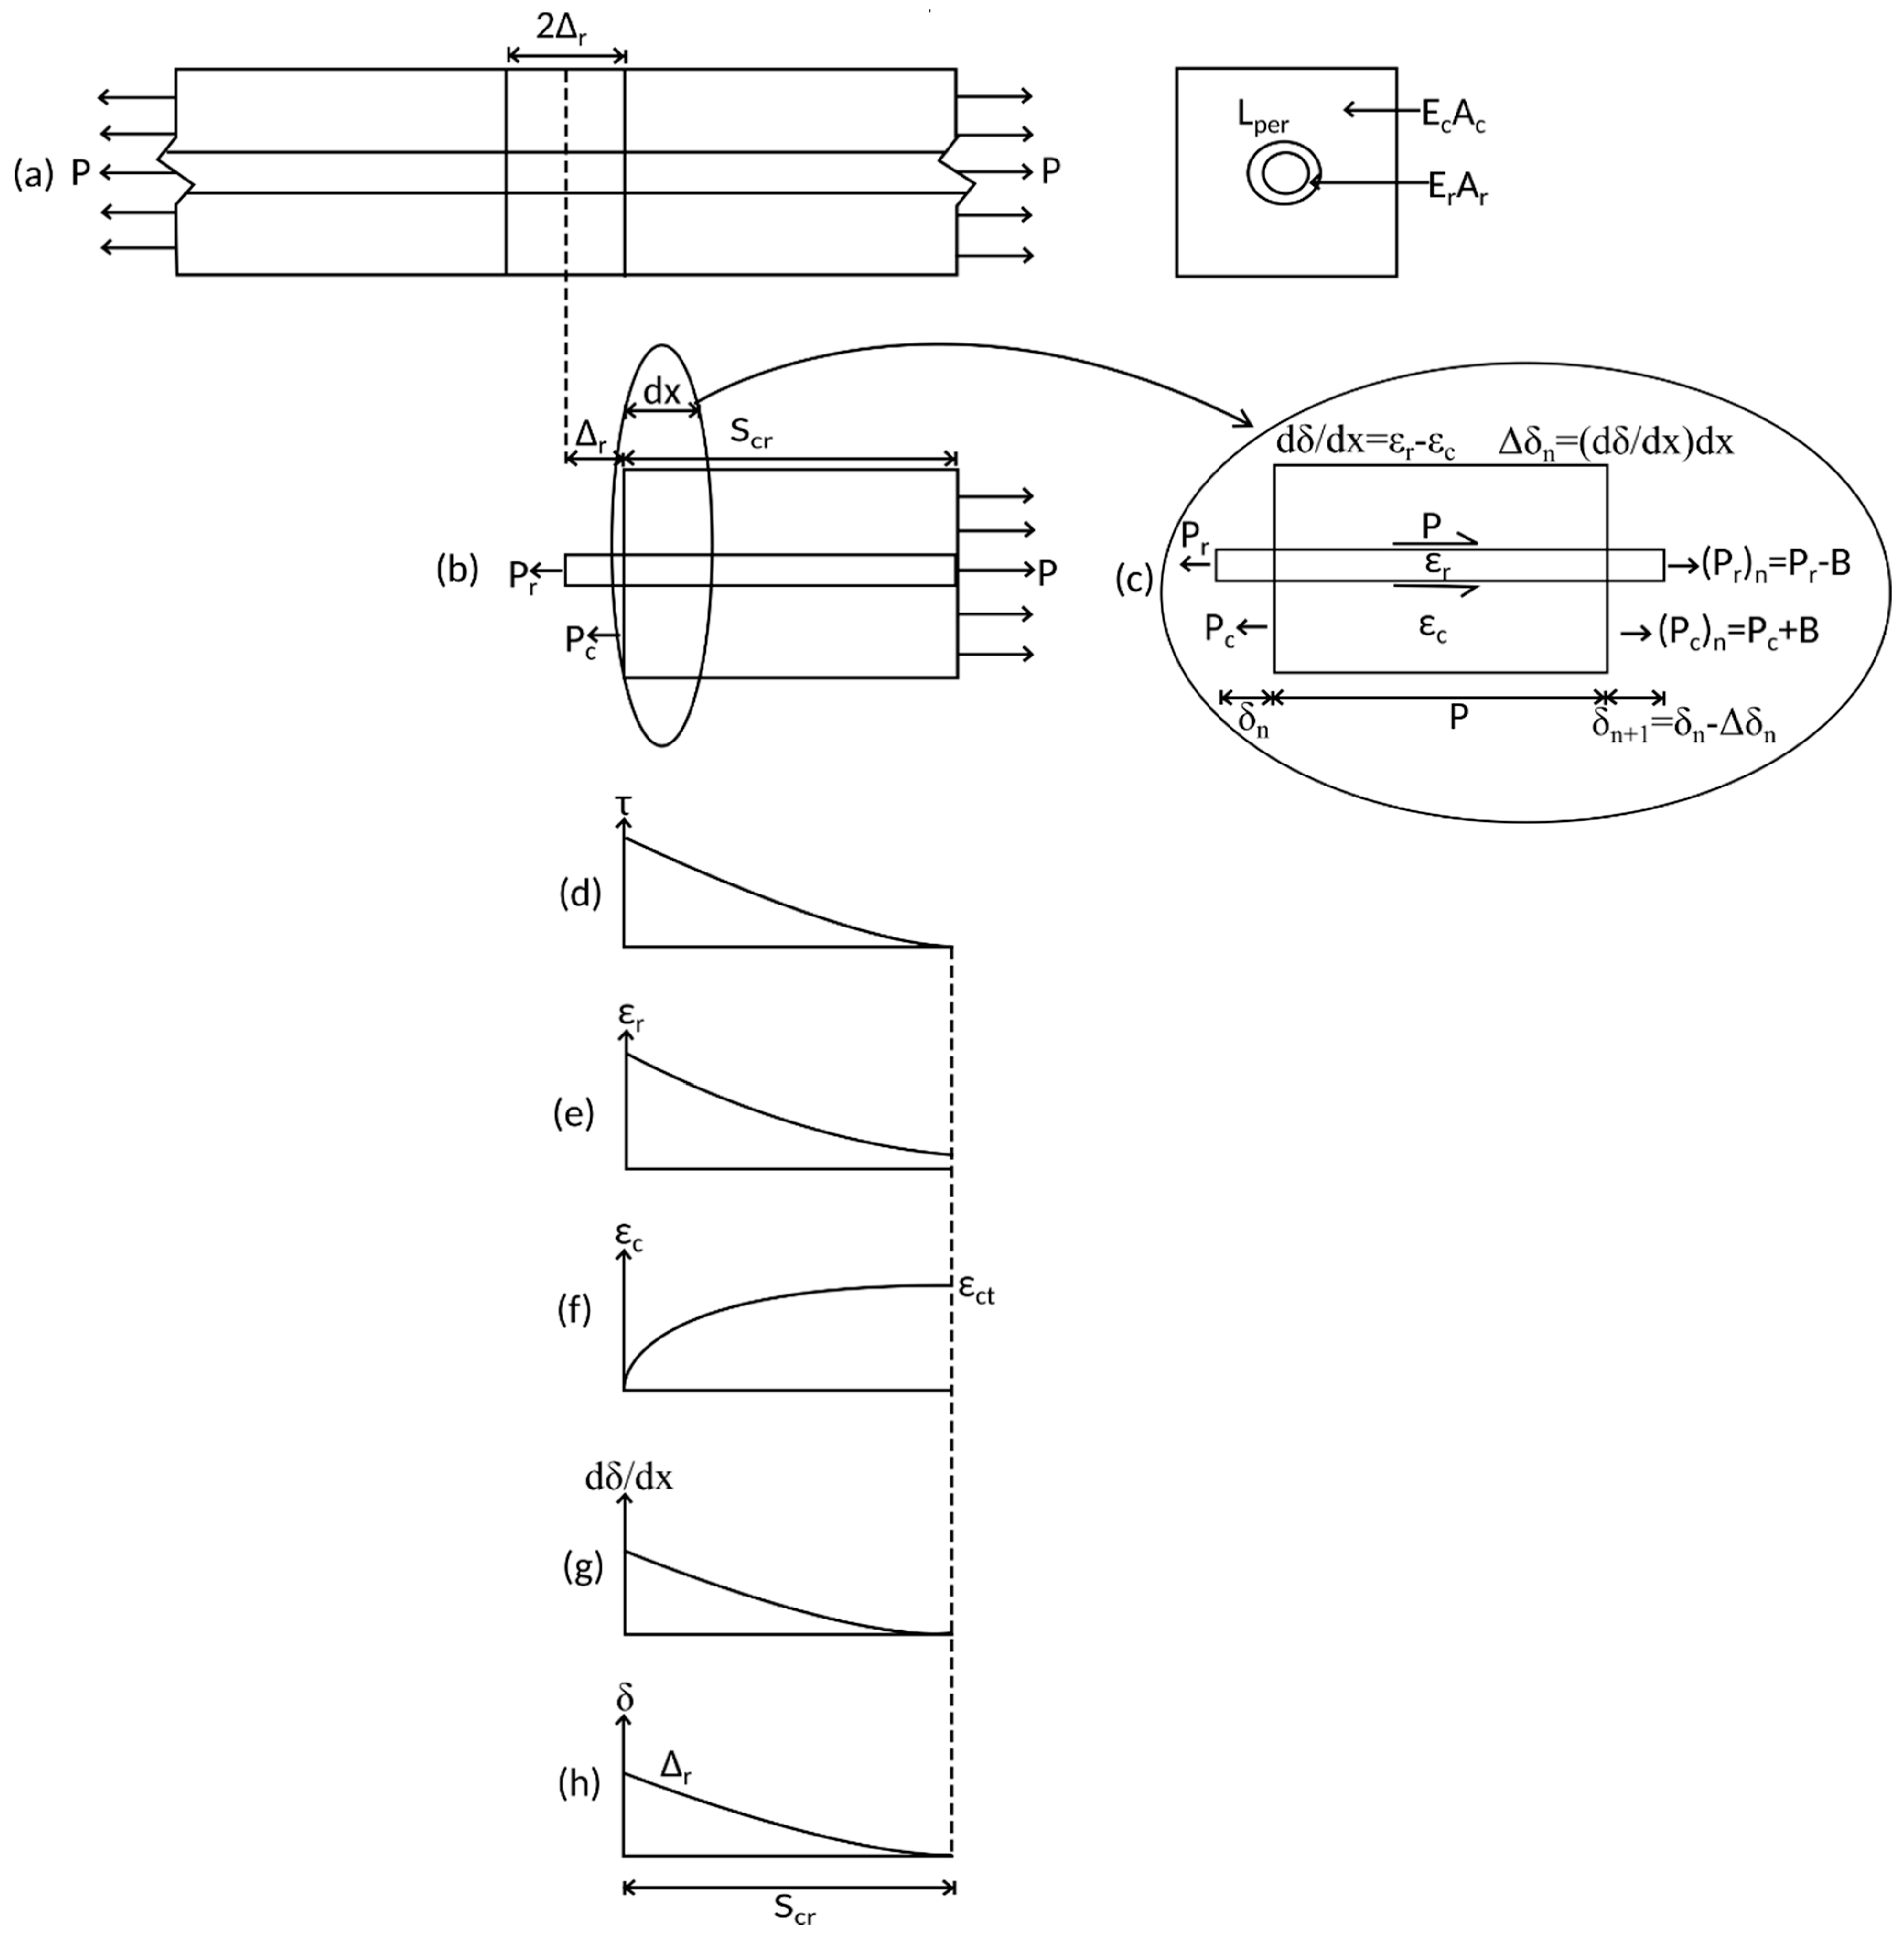
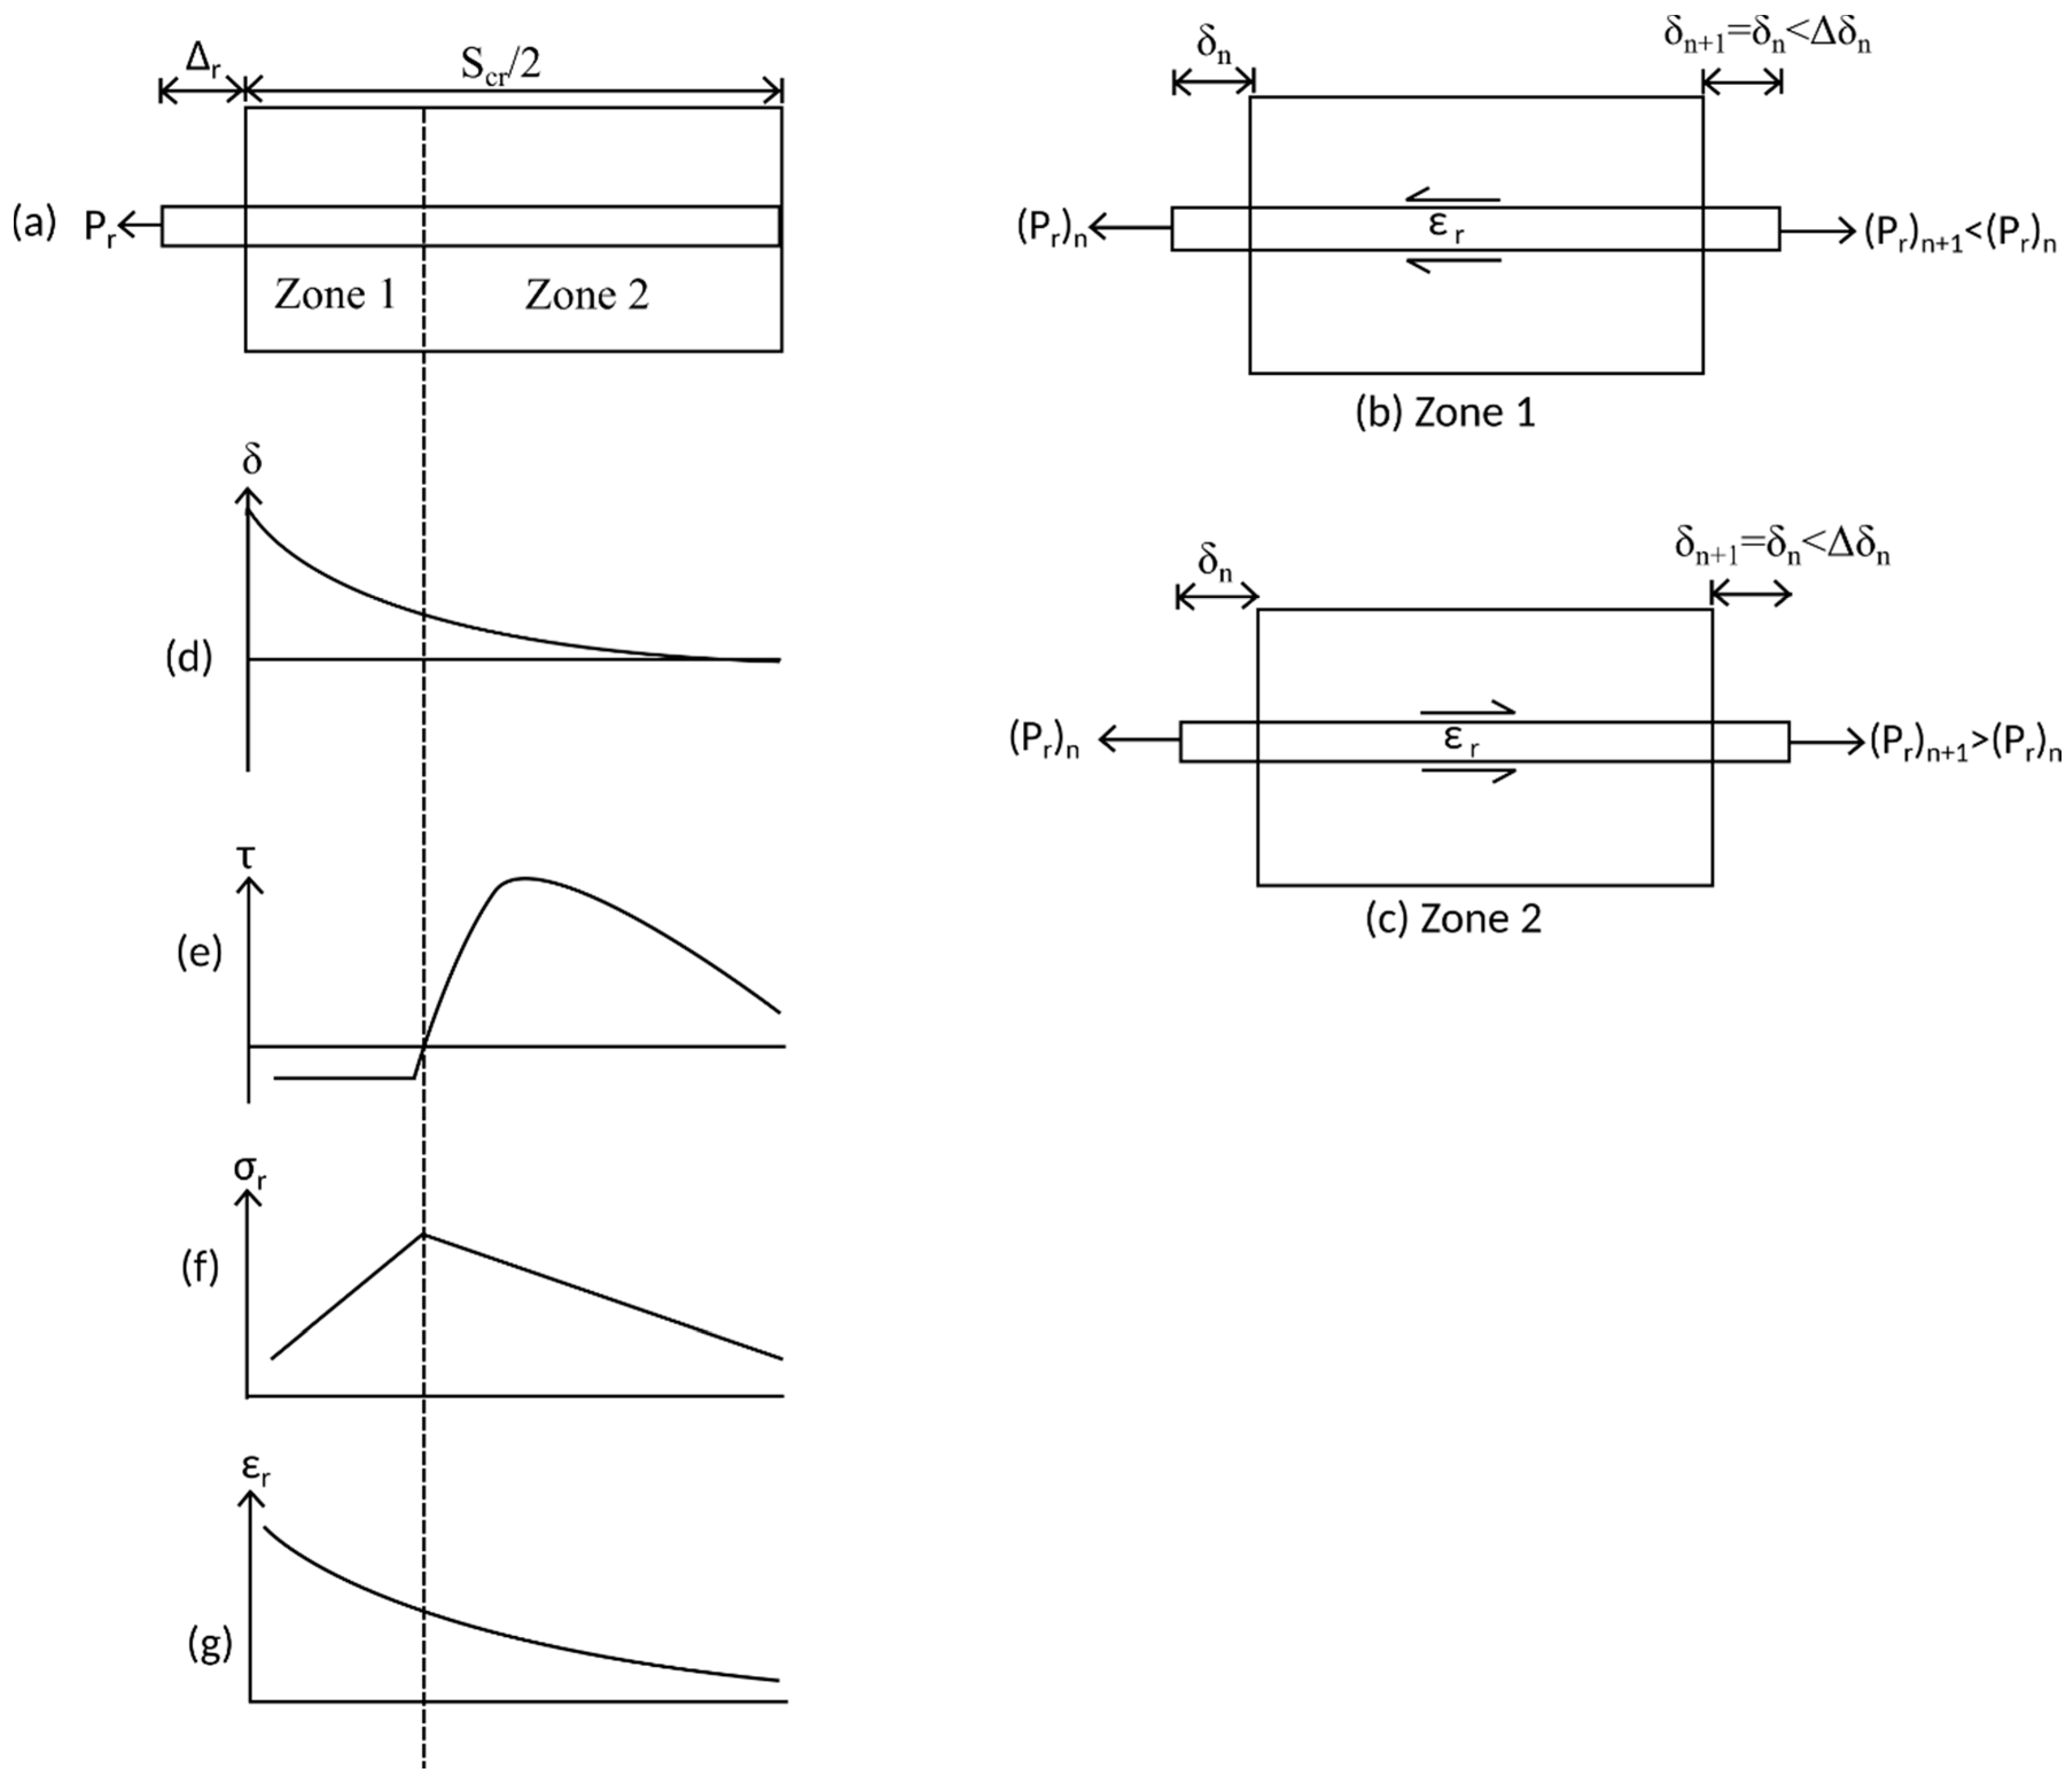
| (Pc)n | Load acting on concrete in element n |
| (Pr)n | Load acting on reinforcement bar in element n |
| (Pr)n+1 | Load acting on reinforcement bar in element n + 1 |
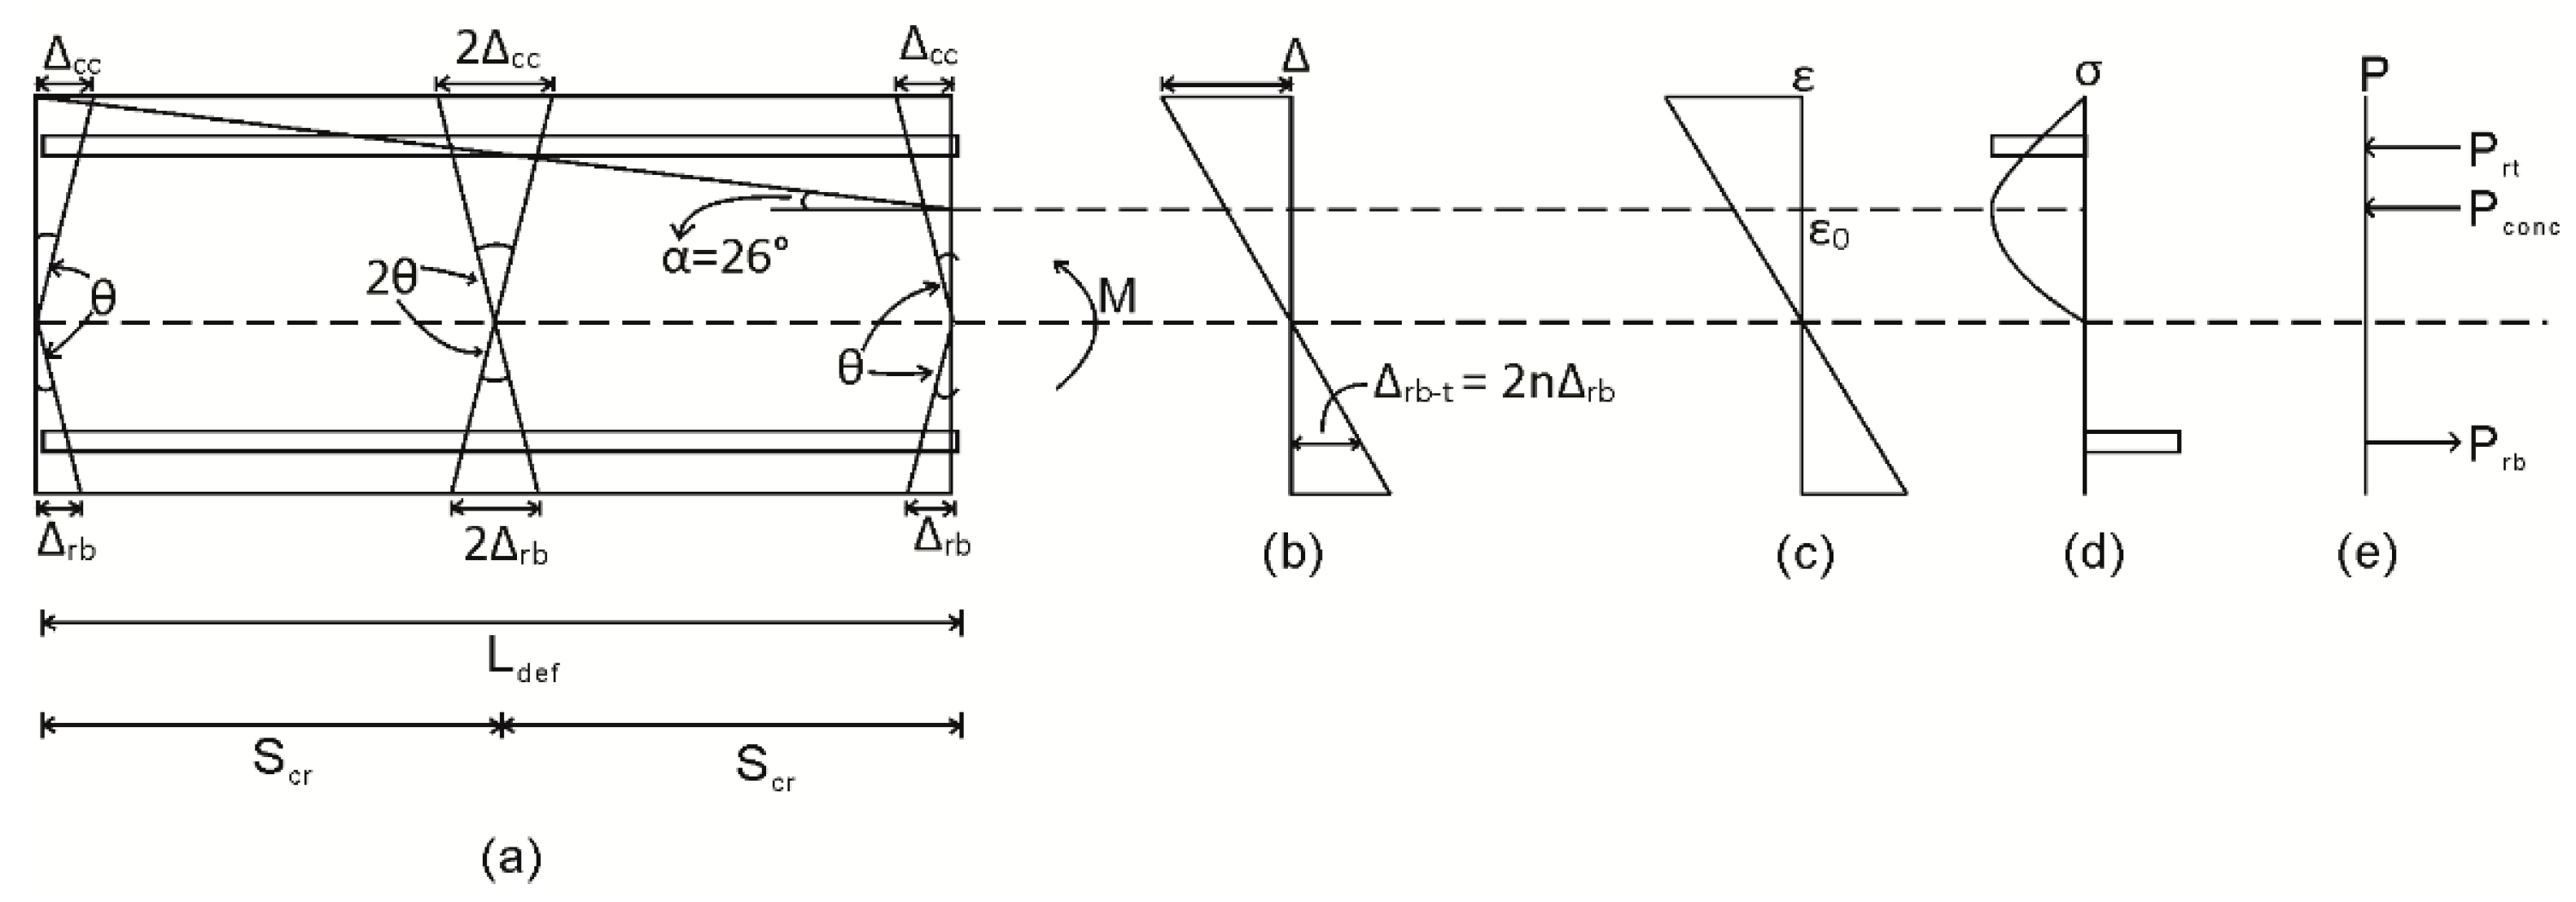
| ∆cc | Deformation due to concrete crushing |
| ∆δn | Change in slip for element n |
| Ac | Area of concrete |
| Ar | Area of reinforcement bar |
| B | Bond force |
| d’ | Distance between the top and bottom reinforcement bar |
| dNA | Depth of neutral axis |
| dδ/dx | Slip-strain |
| Ec | Modulus of concrete |
| Er | Modulus of reinforcement bar |
| Ldef | Length of deformation |
| Ldef-test | Length of deformation from the experimental compression test of concrete cylinder |
| Lper | Perimeter of reinforcement bar |
| M | moment |
| P | Load profile |
| Pc | Load acting on concrete |
| Pconc | Load acting on concrete |
| Pr | Load acting on reinforcement bar |
| Prb | Load acting on bottom reinforcement bar |
| Prt | Load acting on top reinforcement bar |
| Scr | Crack spacing |
| Δ | Deformation profile |
| δ | Slip of reinforcement bar |
| δn | Slip of reinforcement bar in element n |
| δn+1 | Slip of reinforcement bar in element n + 1 |
| Δr | Slip of reinforcement bar at the crack face |
| Δrb | Slip of bottom (tensile) reinforcement bar at the crack face |
| Δrb-t | Total slip of bottom (tensile) reinforcement bar in multiple crack situation |
| Ldef-analysis | Length of deformation determined from the tension stiffening analysis |
| Δrt | Slip of top (compression) reinforcement bar at the crack face |
| ε | Strain profile |
| εc | Strain of concrete |
| εct | Cracking strain of concrete |
| εLdef-analysis | Concrete strain from the experimental compression test of concrete cylinder |
| εr | Strain of reinforcement bar |
| θ | Rotation of beam segment |
| θh | Rotation of beam segment in the hogging section of the beam |
| θs | Rotation of beam segment in the sagging section of the beam |
| σ | Stress profile |
| σa | Stress applied on concrete |
| σr | Stress applied on reinforcement bar |
| τ | Bond stress |
References
- Bertero, V.V.; Bresler, B. Seismic behavior of reinforced concrete framed structures. In Proceedings of the Fourth World Conference on Earthquake Engineering, Santiago, Chile, 13–18 January 1969.
- Viwathanatepa, S.; Popov, E.P.; Bertero, V.V. Effects of Generalized Loadings on Bond of Reinforcing Bars Embedded in Confined Concrete; UCB/EERC-79/22; Earthquake Engineering Research Centre: Berkeley, CA, USA, 1979. [Google Scholar]
- Ciampi, V.; Eligehausen, R.; Bertero, V.V.; Popov, E.P. Analytical Model for Concrete Anchorages of Reinforcing Bars under Generalized Excitations; UCB/EERC82/23; Earthquake Engineering Research Centre: Berkeley, CA, USA, 1982. [Google Scholar]
- Eligehausen, R.; Popov, E.P.; Bertero, V.V. Local Bond Stress-Slip Relationship of Deformed Bars under Generalized Excitations; UCB/EERC83/23; Earthquake Engineering Research Centre: Berkeley, CA, USA, 1982. [Google Scholar]
- Gupta, A.K.; Maestrini, S.R. Tension stiffness model for reinforced concrete bars. J. Struct. Eng. 1990, 116, 769–790. [Google Scholar] [CrossRef]
- Choi, C.K.; Cheung, S.H. Tension stiffening model for planar reinforced concrete members. Comput. Struct. 1996, 59, 179–190. [Google Scholar] [CrossRef]
- Marti, P.; Alvarez, M.; Kaufmann, W.; Sigrist, V. Tension chord model for structural concrete. Struct. Eng. Int. J. Int. Assoc. Bridg. Struct. Eng. 1998, 8, 287–298. [Google Scholar] [CrossRef]
- Yuan, H.; Teng, J.G.; Seracino, R.; Wu, Z.S.; Yao, J. Full-range behavior of FRP-to-concrete bonded joints. Eng. Struct. 2004, 26, 553–565. [Google Scholar] [CrossRef]
- Haskett, M.; Oehlers, D.J.; Mohamed Ali, M.S. Local and global bond characteristics of steel reinforcing bars. Eng. Struct. 2008, 30, 376–383. [Google Scholar] [CrossRef]
- Yankelevsky, D.Z.; Jabareen, M.; Abutbul, A.D. One-dimensional analysis of tension stiffening in reinforced concrete with discrete cracks. Eng. Struct. 2008, 30, 206–217. [Google Scholar] [CrossRef]
- Muhamad, R.; Ali, M.; Oehlers, D.J.; Griffith, M. The tension stiffening mechanism in reinforced concrete prisms. Adv. Struct. Eng. 2012, 15, 2053–2069. [Google Scholar] [CrossRef]
- Visintin, P.; Oehlers, D.J.; Wu, C.; Haskett, M. A mechanics solution for hinges in RC beams with multiple cracks. Eng. Struct. 2012, 36, 61–69. [Google Scholar] [CrossRef]
- Knight, D.; Visintin, P.; Oehlers, D.J.; Jumaat, M.Z. Incorporating Residual Strains in the Flexural Rigidity of RC members with Varying Degrees of Prestress and Cracking. Adv. Struct. Eng. 2013, 16, 1701–1718. [Google Scholar] [CrossRef]
- Oehlers, D.J.; Chen, J.; Ibell, T.J. Simulating reinforced concrete members. Part 1: Partial interaction properties. Proc. Inst. Civ. Eng. 2014, 167, 646–653. [Google Scholar] [CrossRef] [Green Version]
- Oehlers, D.J. Simulating reinforced concrete members. Part 2: Displacement-based analyses. Struct. Build. 2014, 167, 718–727. [Google Scholar] [CrossRef] [Green Version]
- Zhang, T.; Visintin, P.; Oehlers, D.J.; Griffith, M.C. Presliding Shear Failure in Prestressed RC Beams. II: Behavior. J. Struct. Eng. 2014, 140. [Google Scholar] [CrossRef]
- Zhang, T.; Oehlers, D.J.; Visintin, P. Shear Strength of FRP RC Beams and One-Way Slabs without Stirrups. J. Compos. Constr. 2014, 18. [Google Scholar] [CrossRef]
- Branson, D.E. Deformation of Concrete Structures; McGraw-Hill: New York, NY, USA, 1977. [Google Scholar]
- Gossman, J.S. Simplified Computations for Effective Moment of Inertia Ie and Minimum Thickness to Avoid Deflection Computations. ACI J. 1980, 78, 423–439. [Google Scholar]
- Sakai, K.; Yakuta, Y. Moment-Curvature Relationships of Reinforced Concrete Members Subjected to Combined Bending and Axial Force. ACI J. Proc. 1980, 77, 189–194. [Google Scholar]
- Al-Zaid, R.; Al-Shaikh, A.H.; Abu-Hussein, M.M. Effect of Loading Type on the Effective Moment of Inertia of Reinforced Concrete Beams. ACI Struct. J. 1991, 88, 184–190. [Google Scholar]
- Bischoff, P.H. Reevaluation of Deflection Prediction for Concrete Beams Reinforced with Steel and Fiber Reinforced Polymer Bars. J. Struct. Eng. 2005, 131, 752–767. [Google Scholar] [CrossRef]
- Baker, A.L.L. Ultimate Load Theory Applied to the Design of Reinforced and Prestressed Concrete Frame; Concrete Publications: London, UK, 1956. [Google Scholar]
- Sawyer, H.A. Design of Concrete Frames for Two Failure States. In Proceedings of the International Symposium on the Flexural Mechanics of Reinforced Concrete, Miami, FL, USA, 10–12 November 1964.
- Corley, G.W. Rotation capacity of reinforced concrete beams. J. Struct. Eng. 1966, 92, 121–146. [Google Scholar]
- Mattock, A.H. Discussion of “rotational capacity of reinforced concrete beams” by WDG Corley. J. Struct. Div. 1967, 93, 519–522. [Google Scholar]
- Priestley, M.; Park, R. Strength and ductility of concrete bridge columns under seismic loading. ACI Struct. J. 1987, 84, 61–76. [Google Scholar]
- Panagiotakos, T.B.; Fardis, M.N. Deformations of reinforced concrete members at yielding and ultimate. ACI Struct. J. 2001, 98, 135–148. [Google Scholar]
- Yang, Z.J.; Chen, J. Finite element modelling of multiple cohesive discrete crack propagation in reinforced concrete beams. Eng. Fract. Mech. 2005, 72, 2280–2297. [Google Scholar] [CrossRef]
- Yang, Z.J.; Su, X.T.; Chen, J.F.; Liu, G.H. Monte Carlo simulation of complex cohesive fracture in random heterogeneous quasi-brittle materials. Int. J. Solids Struct. 2009, 46, 3222–3234. [Google Scholar] [CrossRef]
- Haskett, M.; Oehlers, D.J.; Mohamed Ali, M.S.; Wu, C. Rigid body moment–rotation mechanism for reinforced concrete beam hinges. Eng. Struct. 2009, 31, 1032–1041. [Google Scholar] [CrossRef]
- Visintin, P.; Oehlers, D.; Wu, C.; Griffith, M.C. The reinforcement contribution to the cyclic behaviour of reinforced concrete beam hinges. Earthq. Eng. Struct. Dyn. 2012, 41, 1591–1608. [Google Scholar] [CrossRef]
- Visintin, P.; Oehlers, D. A Mechanics Based Hinge Analysis for Reinforced Concrete Columns. J. Struct. Eng. 2013, 139, 1973–1980. [Google Scholar] [CrossRef]
- Tastani, S.P.; Pantazopoulou, J. Implications of yield penetration on confinement requirements of r.c. wall elements. Earthq. Struct. 2015, 9, 831–838. [Google Scholar] [CrossRef]
- Tastani, S.P.; Pantazopoulou, J. Yield penetration in seismically loaded anchorages: Effects on member deformation capacity. Earthq. Struct. 2013, 5, 527–552. [Google Scholar] [CrossRef]
- Chen, Y.; Visintin, P.; Oehlers, D.J.; Alengaram, U.J. Size-Dependent Stress-Strain Model for Unconfined Concrete. J. Struct. Eng. 2014, 140. [Google Scholar] [CrossRef]
- Ma, S.M.; Bertero, V.V.; Popov, E.P. Experimental and Analytical Studies on the Hysteretic Behavior of Reinforced Concrete Rectangular and T-Beams; UCB/EERC76/2; Earthquake Engineering Research Centre: Berkeley, CA, USA, 1976. [Google Scholar]
- Brown, R.; Jirsa, J. Reinforced concrete beams under load reversals. ACI J. Proc. 1971, 68, 380–390. [Google Scholar]
- Martínez-Rueda, J.; Elnashai, A. Confined concrete model under cyclic load. Mater. Struct. 1997, 30, 139–147. [Google Scholar] [CrossRef]
- Menegotto, M.; Pinto, P.E. Method of analysis for cyclically loaded reinforced concrete plane frames including changes in geometry and non-elastic behavior of elements under combined normal force and bending. In Resistance and Ultimate Deformability of Structures Acted on by Well-Defined Repeated Loads, Proceedings of the IABSE Symposium, Lisbon, Portugal, 12–14 September 1973.


| Reference | R-1 | R-4 | 88-35-RV5-60 | 88-35-RV10-60 |
|---|---|---|---|---|
| Type | Cantilever beam | Cantilever beam | Cantilever beam | Cantilever beam |
| Beam dimension (mm) | 229 × 407 | 229 × 407 | 254 × 457 | 254 × 457 |
| Beam length (mm) | 1587.5 | 1587.5 | 1520 | 1520 |
| Amount of tensile bar | 4 | 4 | 2 | 2 |
| Amount of compression bar | 3 | 3 | 2 | 2 |
| Size of tensile bar (mm) | 19.05 | 19.05 | 25.4 | 25.4 |
| Size of compression bar (mm) | 15.88 | 15.88 | 25.4 | 25.4 |
| Beam | R-1 | R-4 | 88-35-RV5-60 | 88-35-RV10-60 |
|---|---|---|---|---|
| Concrete strength (MPa) | 34.96 | 30.2 | 33.09 | 33.09 |
| Concrete elastic modulus (MPa) | 28282 | 26269 | 27036 | 27036 |
| Steel reinforcement yield strength (MPa) | 451.61 | 451.61 | 317.16 | 317.16 |
© 2016 by the authors; licensee MDPI, Basel, Switzerland. This article is an open access article distributed under the terms and conditions of the Creative Commons Attribution (CC-BY) license (http://creativecommons.org/licenses/by/4.0/).
Share and Cite
Shukri, A.A.; Visintin, P.; Oehlers, D.J.; Jumaat, M.Z. Mechanics Model for Simulating RC Hinges under Reversed Cyclic Loading. Materials 2016, 9, 305. https://doi.org/10.3390/ma9040305
Shukri AA, Visintin P, Oehlers DJ, Jumaat MZ. Mechanics Model for Simulating RC Hinges under Reversed Cyclic Loading. Materials. 2016; 9(4):305. https://doi.org/10.3390/ma9040305
Chicago/Turabian StyleShukri, Ahmad Azim, Phillip Visintin, Deric J. Oehlers, and Mohd Zamin Jumaat. 2016. "Mechanics Model for Simulating RC Hinges under Reversed Cyclic Loading" Materials 9, no. 4: 305. https://doi.org/10.3390/ma9040305