1. Introduction
SiO
2, CaO, and P
2O
5-based bioactive glasses (BGs) have been used as bioactive materials in drug carriers [
1,
2], dental sealing, and [
3] bone implants [
4,
5] because of their superior bioactivity, which was first proposed by Hench
et al. in 1971 [
6]. The bioactivity of a material is its ability to form hydroxyl apatite (HA) after it is embedded in the human body [
7,
8] or immersed in a simulated body fluid (SBF) [
9]. HA, the main inorganic bone component, provides the specific biological response of bonding at the tissue-BG interface [
10]. Because bioactivity is crucial, improving the bioactive behavior of BGs has attracted considerable attention.
For improving bioactive behaviors, a suitable chemical composition and high specific surface area of BGs are essential, and two methods are available for achieving this goal. First, the basis of the bone-bonding property is the chemical reaction of BGs in body fluids. This reaction involves five steps: (i) the formation of silanol (SiOH); (ii) the loss of soluble silica and formation of SiOH; (iii) polycondensation of SiOH; (iv) the formation of an amorphous calcium phosphate layer; and (v) the crystallization of the HA layer [
11]. More details can be found in the study by Hench
et al. [
11,
12]. They claimed that the kinetics of these reaction stages depend on the BG composition [
11]. For example, the first and second stages are associated with the SiOH formation, which is essential for the growth of HA [
11]. A previous study reported that non-bridging oxygen (NBO) groups exchange H
+ or H
3O from the surrounding SBFs to increase the SiOH formation [
11]. Consequently, in BGs, Ca acts as a modifier to reduce the degree of connectivity in the glassy structure for increasing the population of NBO groups. Therefore, a higher Ca concentration (e.g., 45S5 glass [
12]) provides more NBO groups, leading to a high dissolution rate and high bioactivity.
The other approach for achieving a high bioactivity is to increase the HA formation rate by maximizing the specific surface area. For example, Mačković
et al. reported that the 45S5 BG nanoparticles exhibit a higher surface area and a faster HA formation (immersion in an SBF for 1 day) than micron-sized particles do (immersion in an SBF for 3 days) [
13]. Furthermore, Yan
et al. used surfactants to prepare a well-ordered mesoporous bioactive glass (MBG) with a high specific surface area [
14], and, consequently, numerous studies have used the mesoporous structure to obtain a high bioactivity (HA formation after immersion in an SBF 4–8 h) [
15,
16]. The mesoporous structure has become a requirement for obtaining BG materials.
Because the mesoporous structure is crucial, two methods, sol-gel [
14,
15,
16] and spray pyrolysis (SP) [
17], have been used to fabricate MBGs. Compared to sol-gel, SP is faster and more continuous [
18]. Although SP-derived MBGs have the potential for mass production, inhomogeneous particles (smooth and wrinkled spheres [
17]) have been observed in SP-derived MBGs. This inhomogeneity may result in the loss of specific surface area, and, based on our research, studies that describe the relationship between morphology and specific surface area for SP-derived MBG particles are rare. For a mesoporous structure, surfactants play a crucial role to form micelles as a template for conducting pore formation [
19]. When the surfactant concentration in an aqueous solution is low, surfactants are located as separate molecules in the water and are unable to form micelle channels. When the surfactant concentration increases and reaches a critical value, the surfactant molecules come together to form micelles, and this concentration is called the critical micelle concentration (CMC) [
19]. The uses of surfactant for the MBGs, especially when the concentration is higher than the CMC, were reported by Yan
et al. [
20] and Soulie
et al. [
21]. However, increasing the concentration further causes the surfactant molecules to aggregate and produce elongated tubes and stacked lamellae at the second and third CMCs, respectively [
22,
23]. In addition, Myers
et al. predicted that the morphologies of the surfactant at high concentrations are spherical, rod-shaped, and have a flexible bilayer structure, planar extended bilayers, and reversed micelles [
24]. These morphologies may deteriorate the compacted mesoporous structure and reduce the specific surface area. Therefore, the surfactant concentration is related to the formation of mesoporous structures and affects the specific surface area and bioactivity of MBG particles.
In this study, the common triblock surfactant, F127 (Pluronic F-127, EO
106PO
70EO
106, where EO is polyethylene oxide and PO is polypropylene oxide (Sigma-Aldrich, Ludwigshafen, Germany) was used to produce the mesoporous structure of BG powder, and various surfactant concentration-treated MBG powders were synthesized and characterized to examine the relationship among surfactant concentration, specific surface area, and bioactivity. First, X-ray diffraction (XRD) was used to characterize the phase compositions of these MBG powders. Second, scanning electron microscopy (SEM) and transmission electron microscopy (TEM) were used to observe their surface structures and geometries. In addition, particle size distributions and pore sizes were acquired using a couple of SEM and TEM images, respectively. Third, the specific surface areas of the powders were determined using the nitrogen adsorption-desorption method (Brunauer-Emmett-Teller (BET) method) and were compared with particle morphologies. Finally, for
in vitro bioactive tests, the Fourier transform infrared reflection (FTIR) spectrophotometer (Varian Inc., Palo Alto, CA, USA) was used to characterize the powders after they were soaked in an SBF for 1 day, and the intensity of P-O bonding of the various MBG powders were acquired to determine their bioactivity [
7].
3. Discussion
In SP, the problem of inhomogeneity is frequently observed during the preparation of particles, including elemental particles (e.g., SrTiO
3 [
29] and CaMgSi
2O
6 [
30]) because different precursors have different precipitation rates. In a previous study, we used TEOS, CN, and TEP as precursors (Si, Ca, and P precursors, respectively) to prepare SP-derived BG at a high calcination temperature of 700 °C, and the nanoparticles of amorphous SiO
2 and the submicron particles of wollastonite-based glass were observed using TEM and X-ray energy-dispersive spectroscopy [
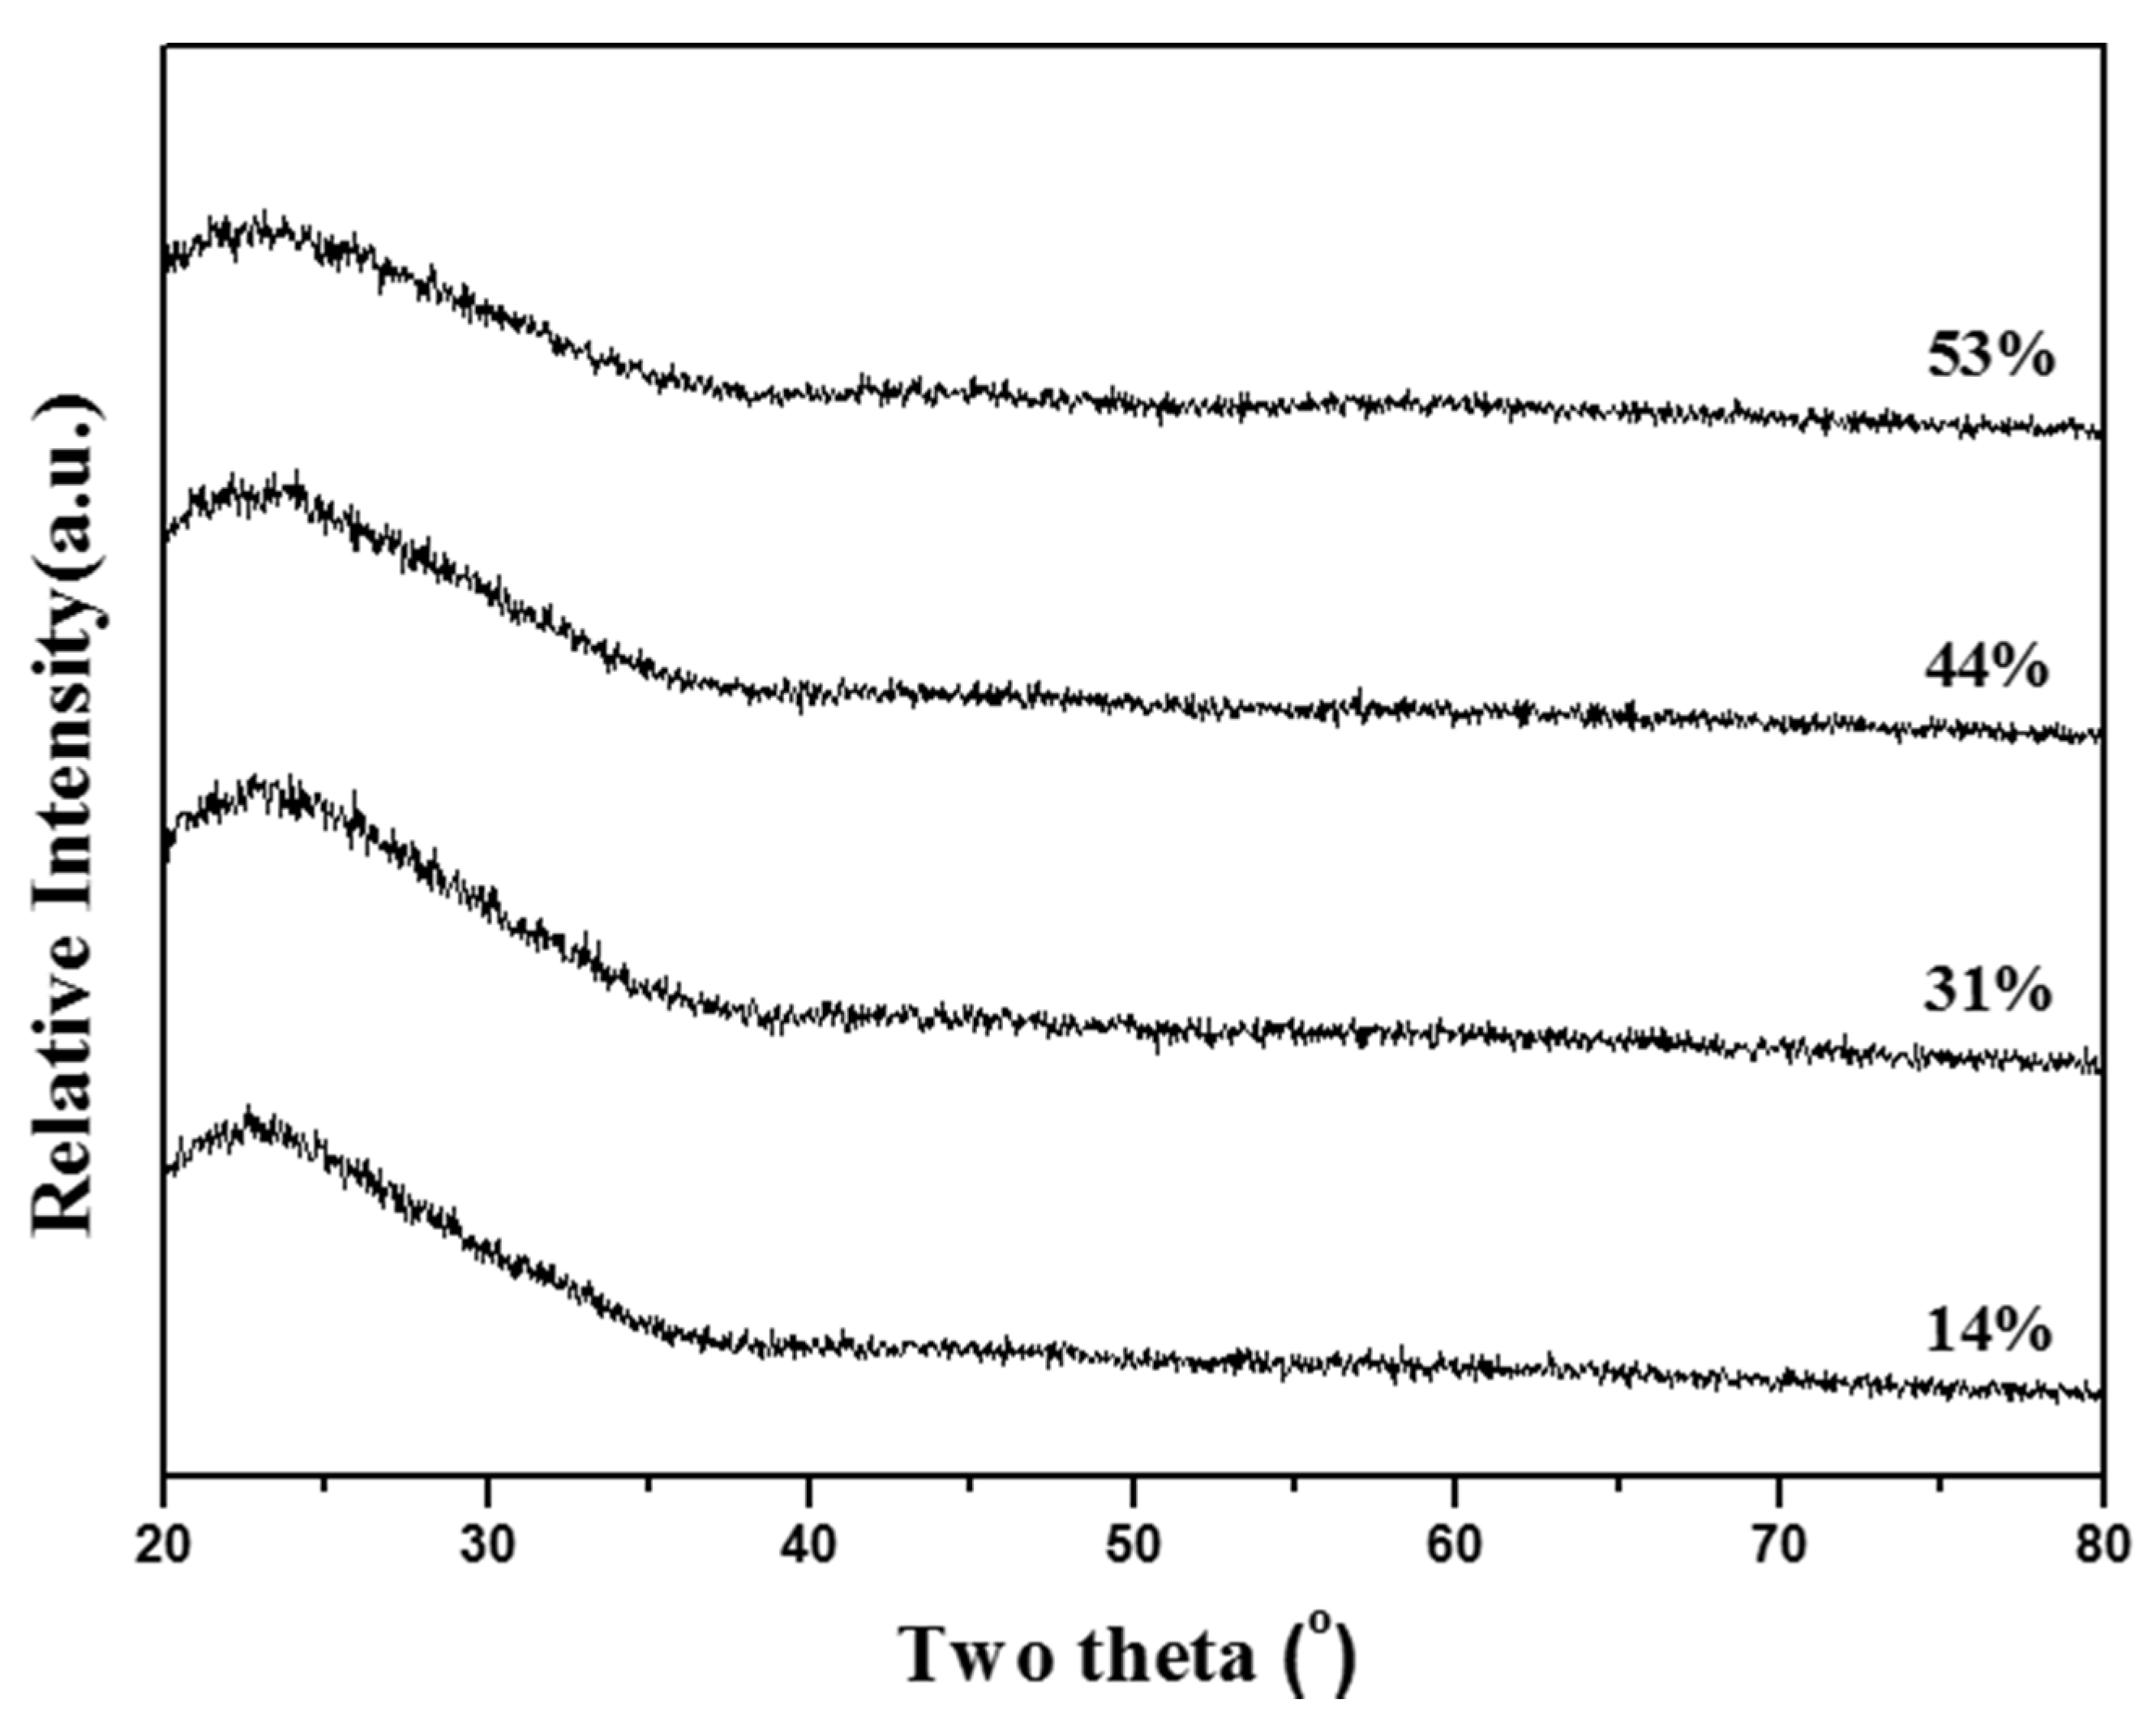
31]. TEOS is insoluble with water because of its hydrolysis behavior, whereas CN and TEP are soluble in water, and the different precipitation behaviors of TEOS, CN, and TEP led to this inhomogeneity. In this study, TEOS, CN, and TEP were used to prepare MBG particles. However, no segregation or any second phase was detected in the XRD data (
Figure 1) for any of the MBG particles (with treatments with various surfactant concentrations). This result implies that the hydrophobic PO groups and hydrophilic EO groups of the F127 surfactant attracted the insoluble TEOS and soluble CN and TEP during heating to avoid the problem of phase separation.
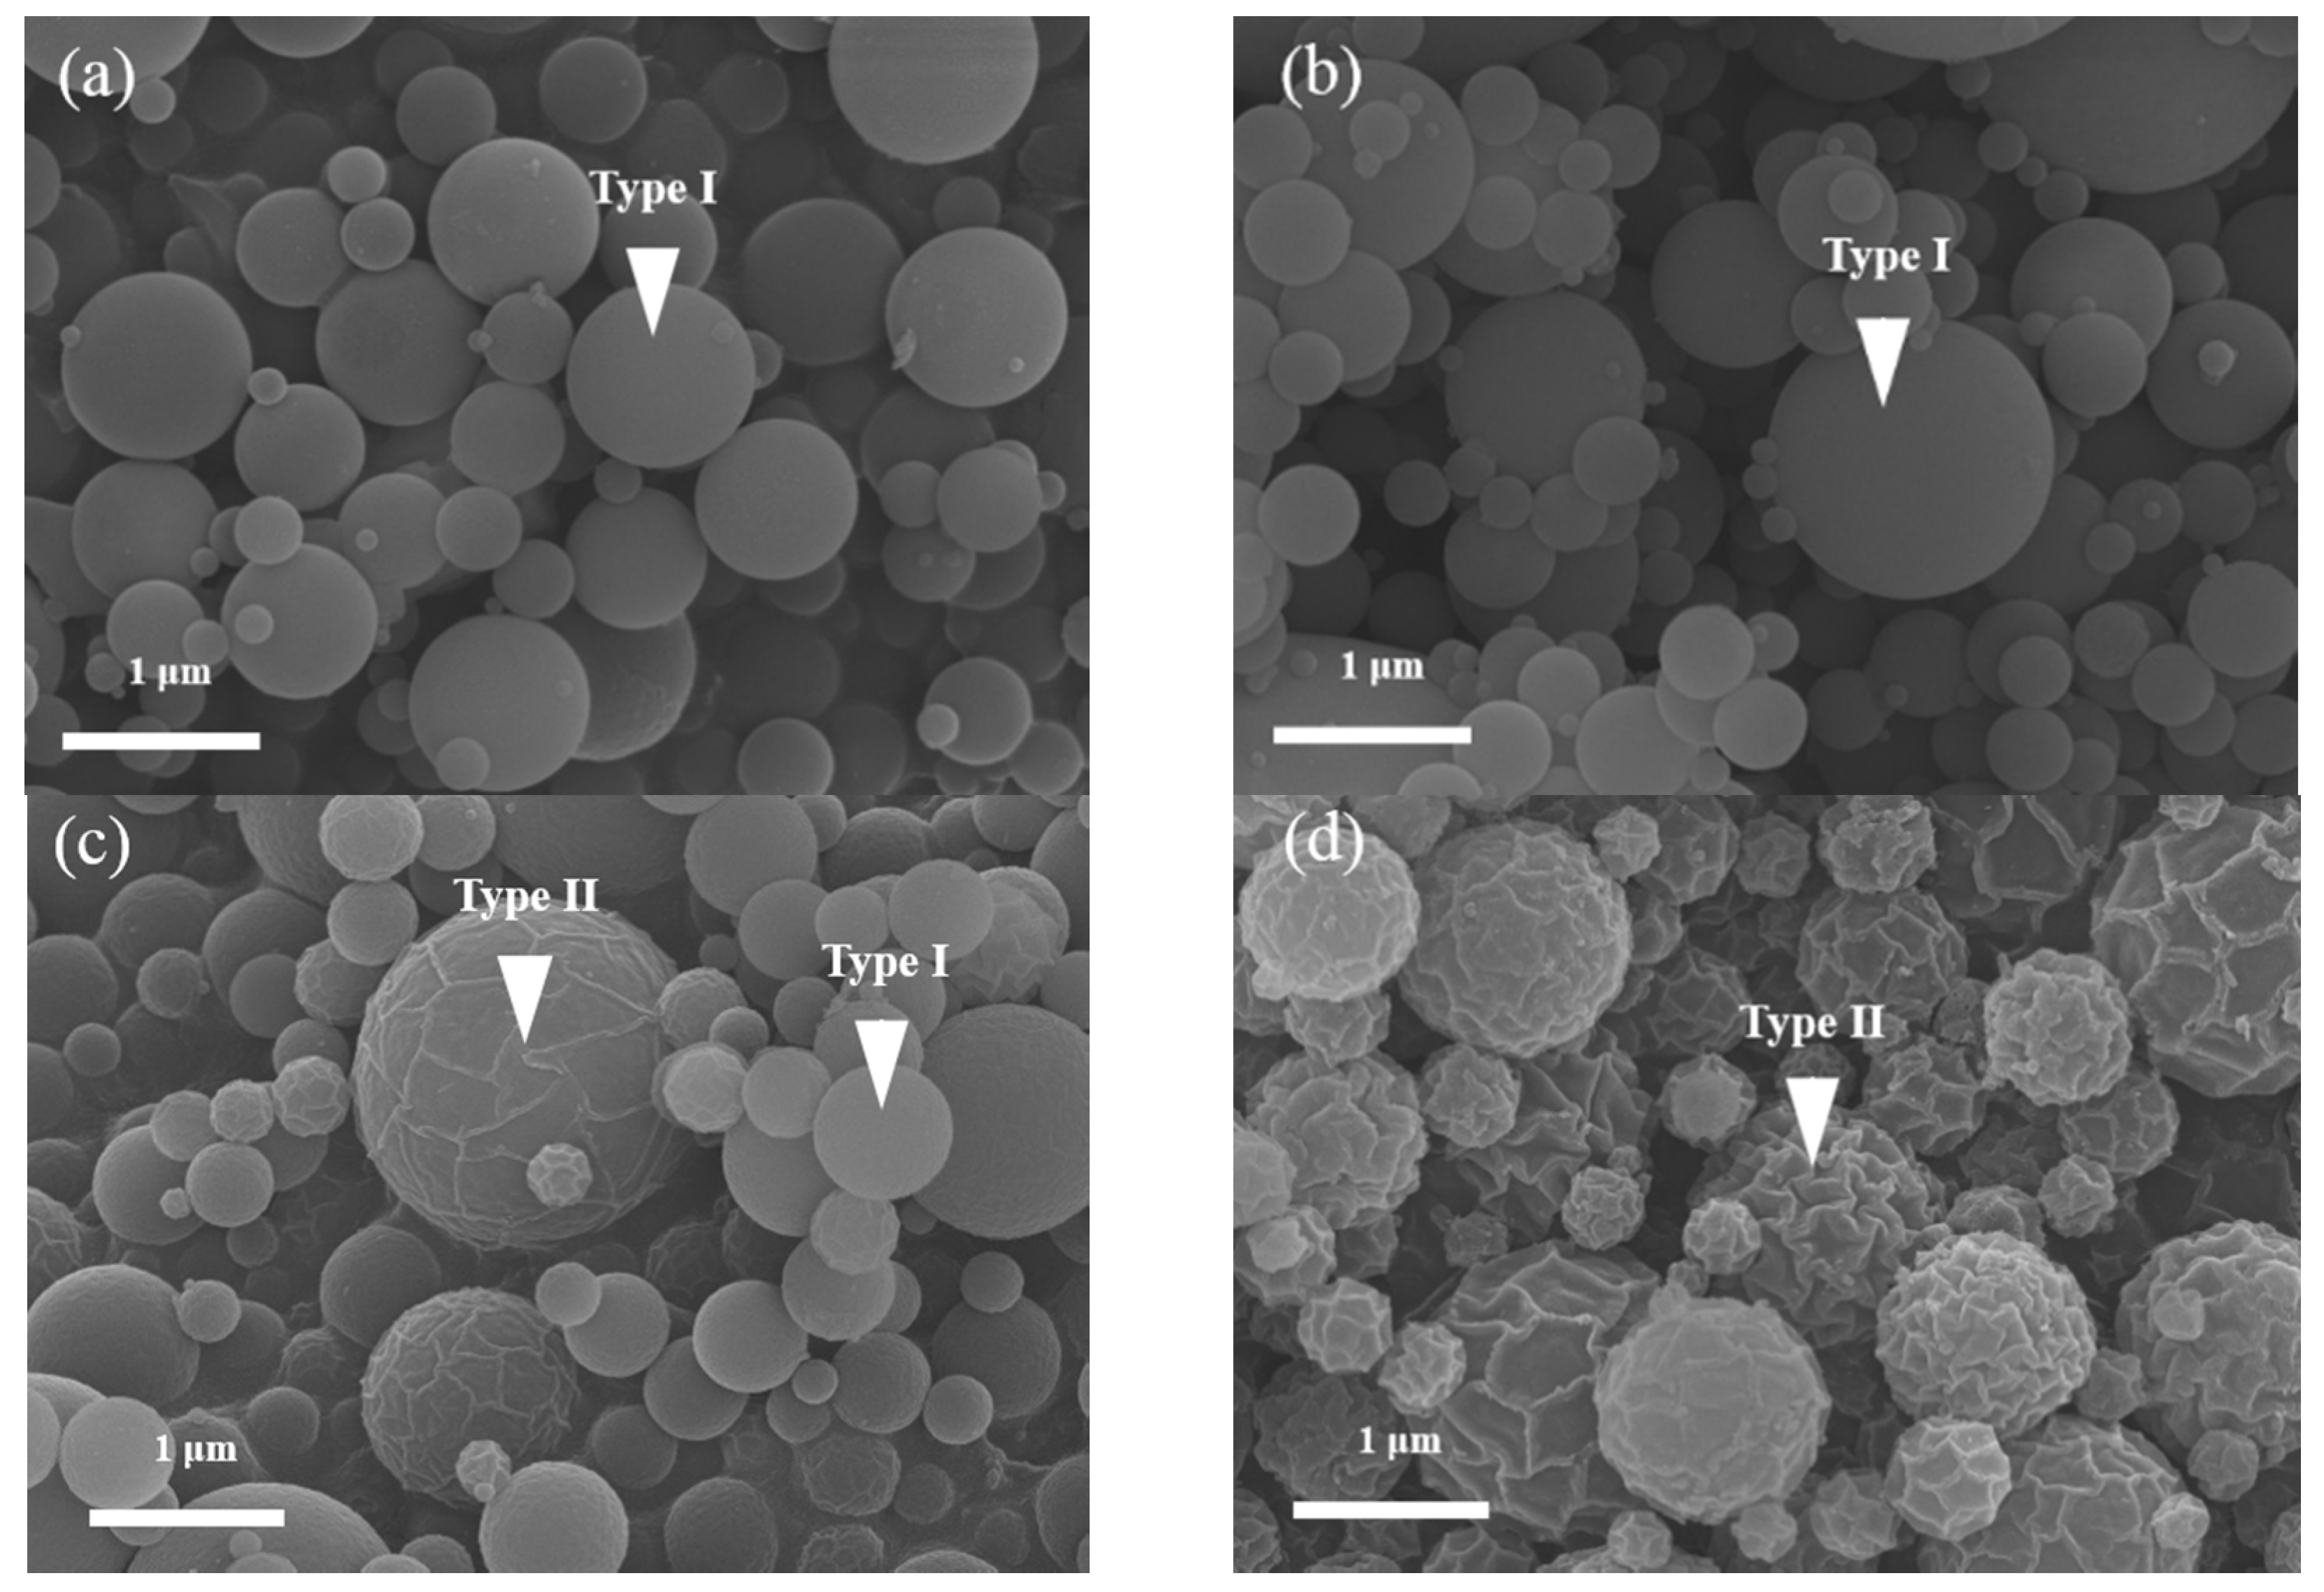
Two morphologies, smooth (Type I) and wrinkled (Type II) spheres, were observed. The Type I particles were observed frequently and were described in-depth in our previous studies [
17,
25]. A possible explanation for the formation of Type II particles is that the concentration of the partial droplets of the surfactant exceeded the CMC, causing the particles to aggregate to produce spherical micelles, elongated tubes, and stacked lamellae at the first, second, and third CMCs, respectively [
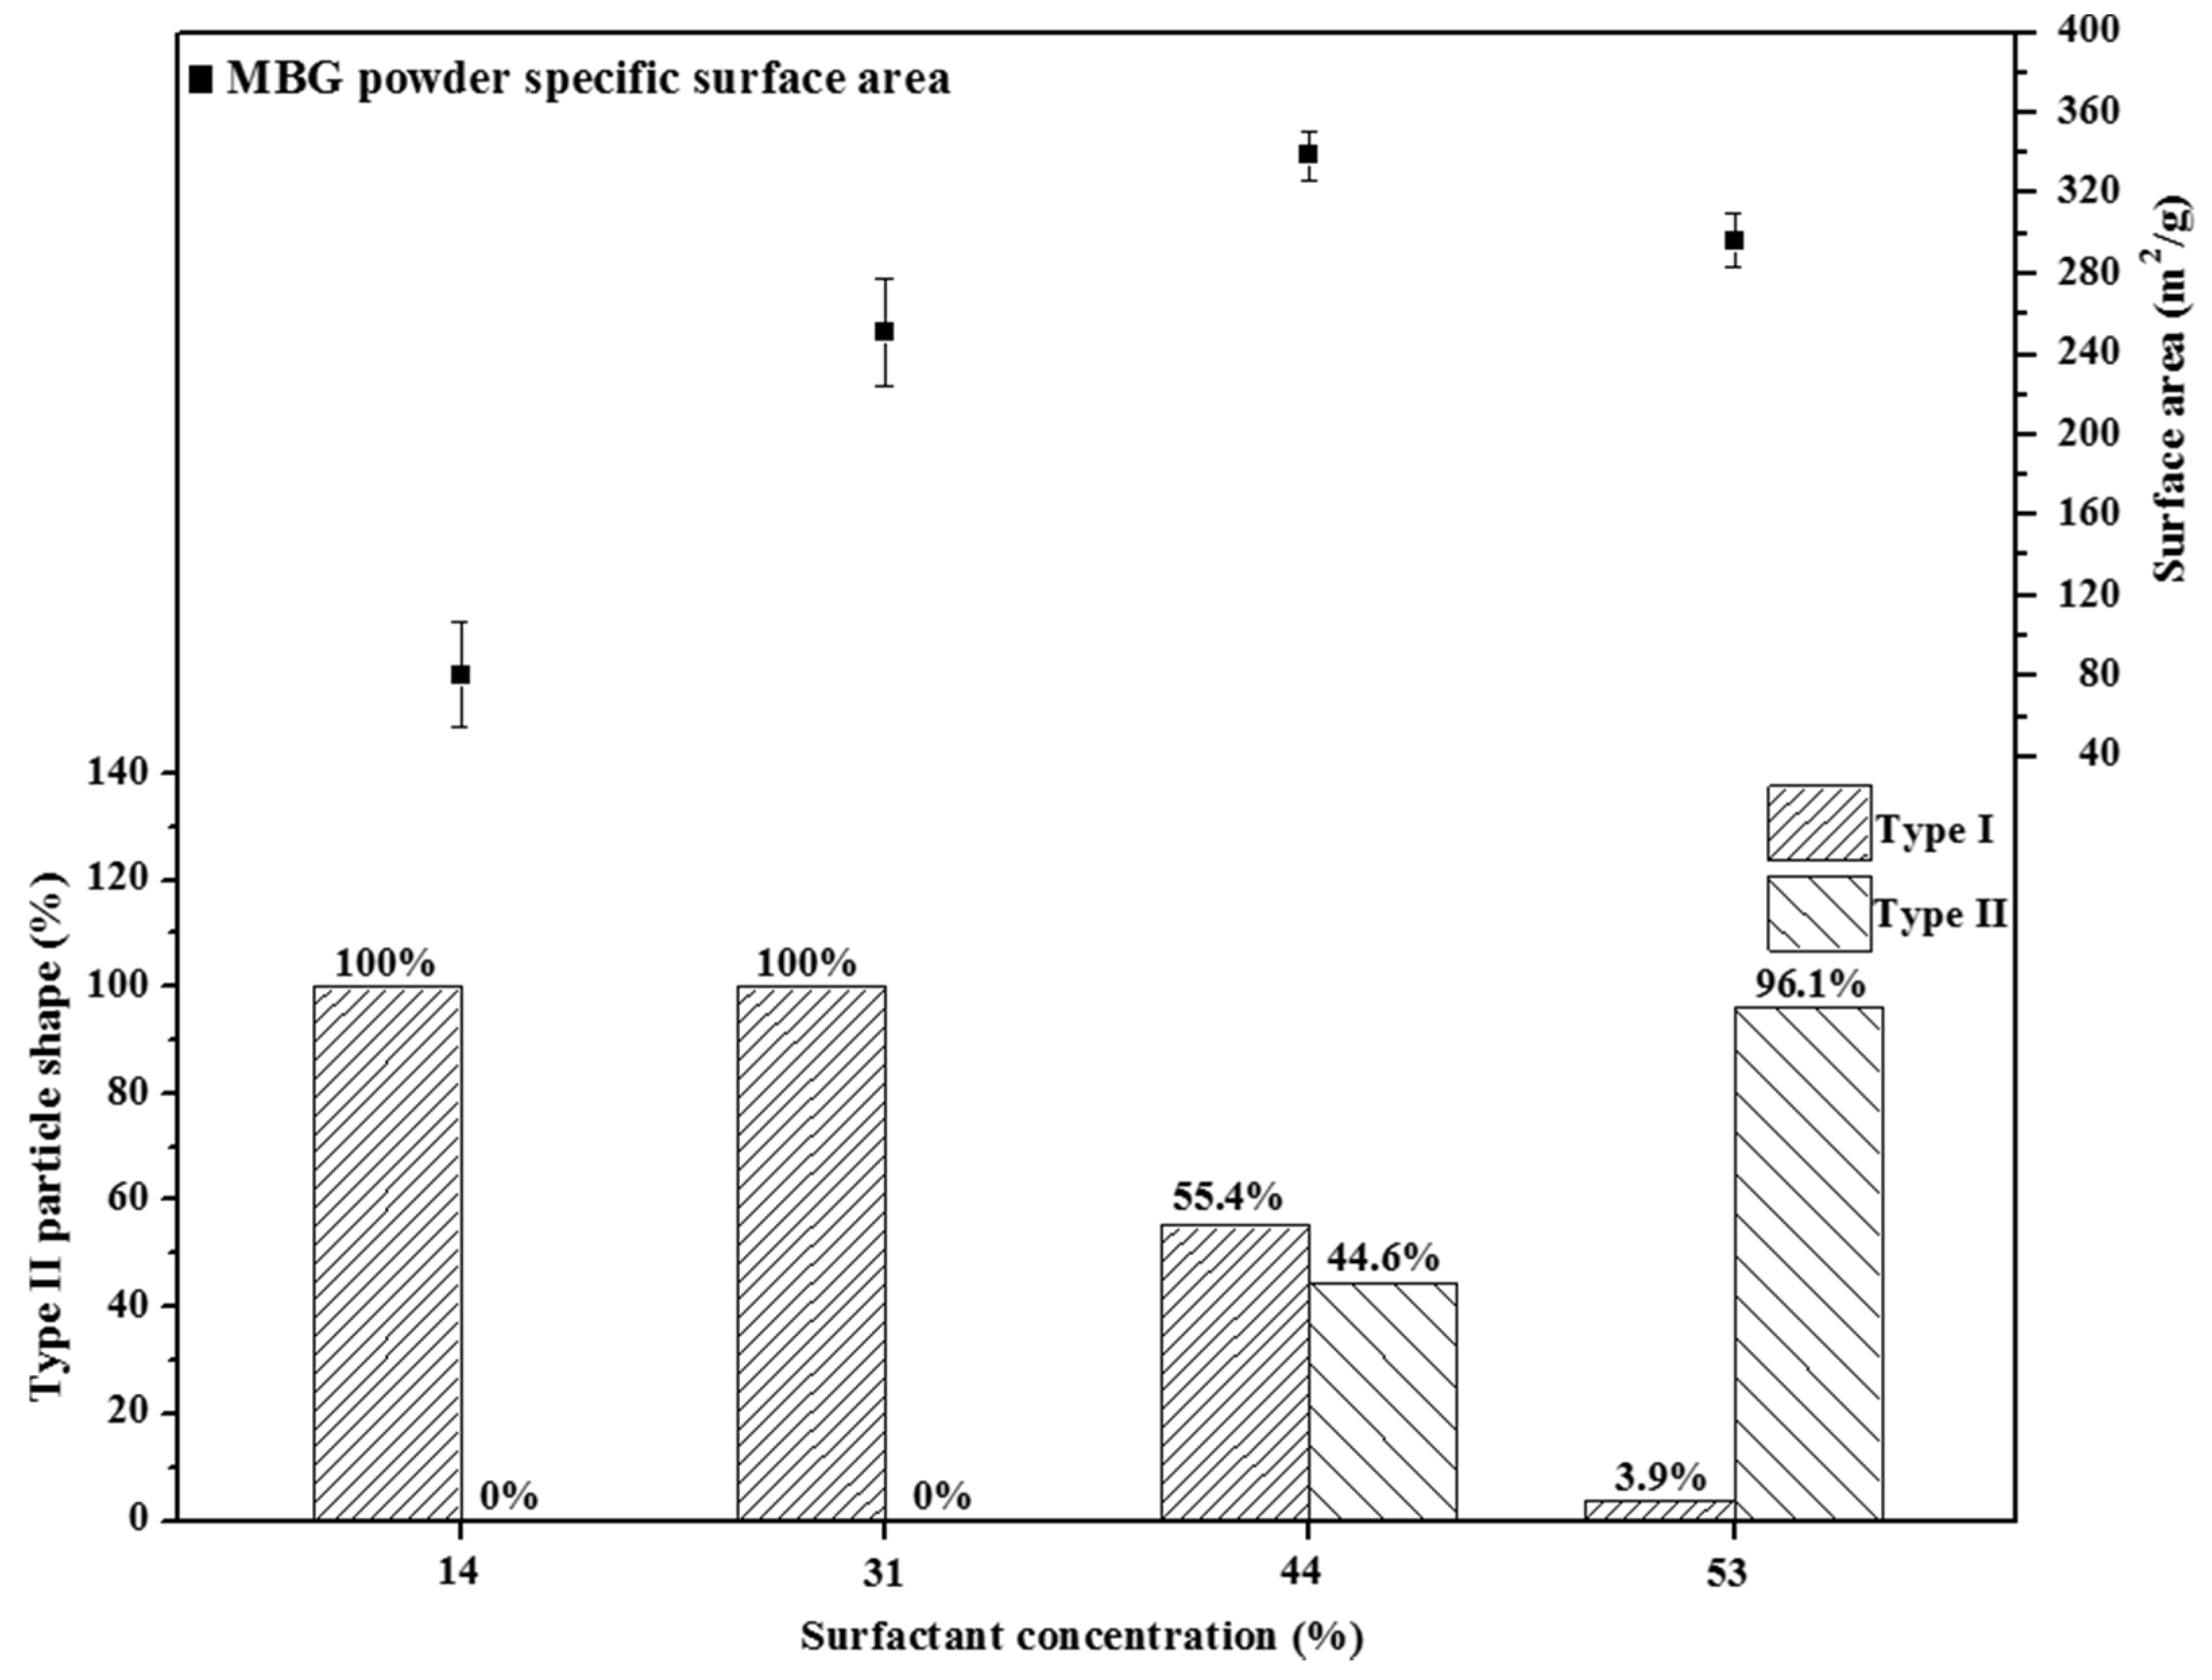
22]. After SP, these tubes and stacked lamellae burned out, and the wrinkled mesoporous spheres were obtained. According to statistical analysis, the population of Type II particles for the 14 wt %, 31 wt %, 44 wt %, and 53 wt % F127-treated MBG powders were 0.0%, 0.0%, 44.6%, and 96.1% (the population of Type I particles were 100.0%, 100.0%, 55.4%, and 3.9%), respectively. This statistical result showed that (i) the CMC of F127 in this study was between 33 and 44 wt % and (ii) the population (%) of Type II particles increased with an increase in the surfactant concentration. In summary, the population of wrinkled spherical particles was closely related to the surfactant concentration.
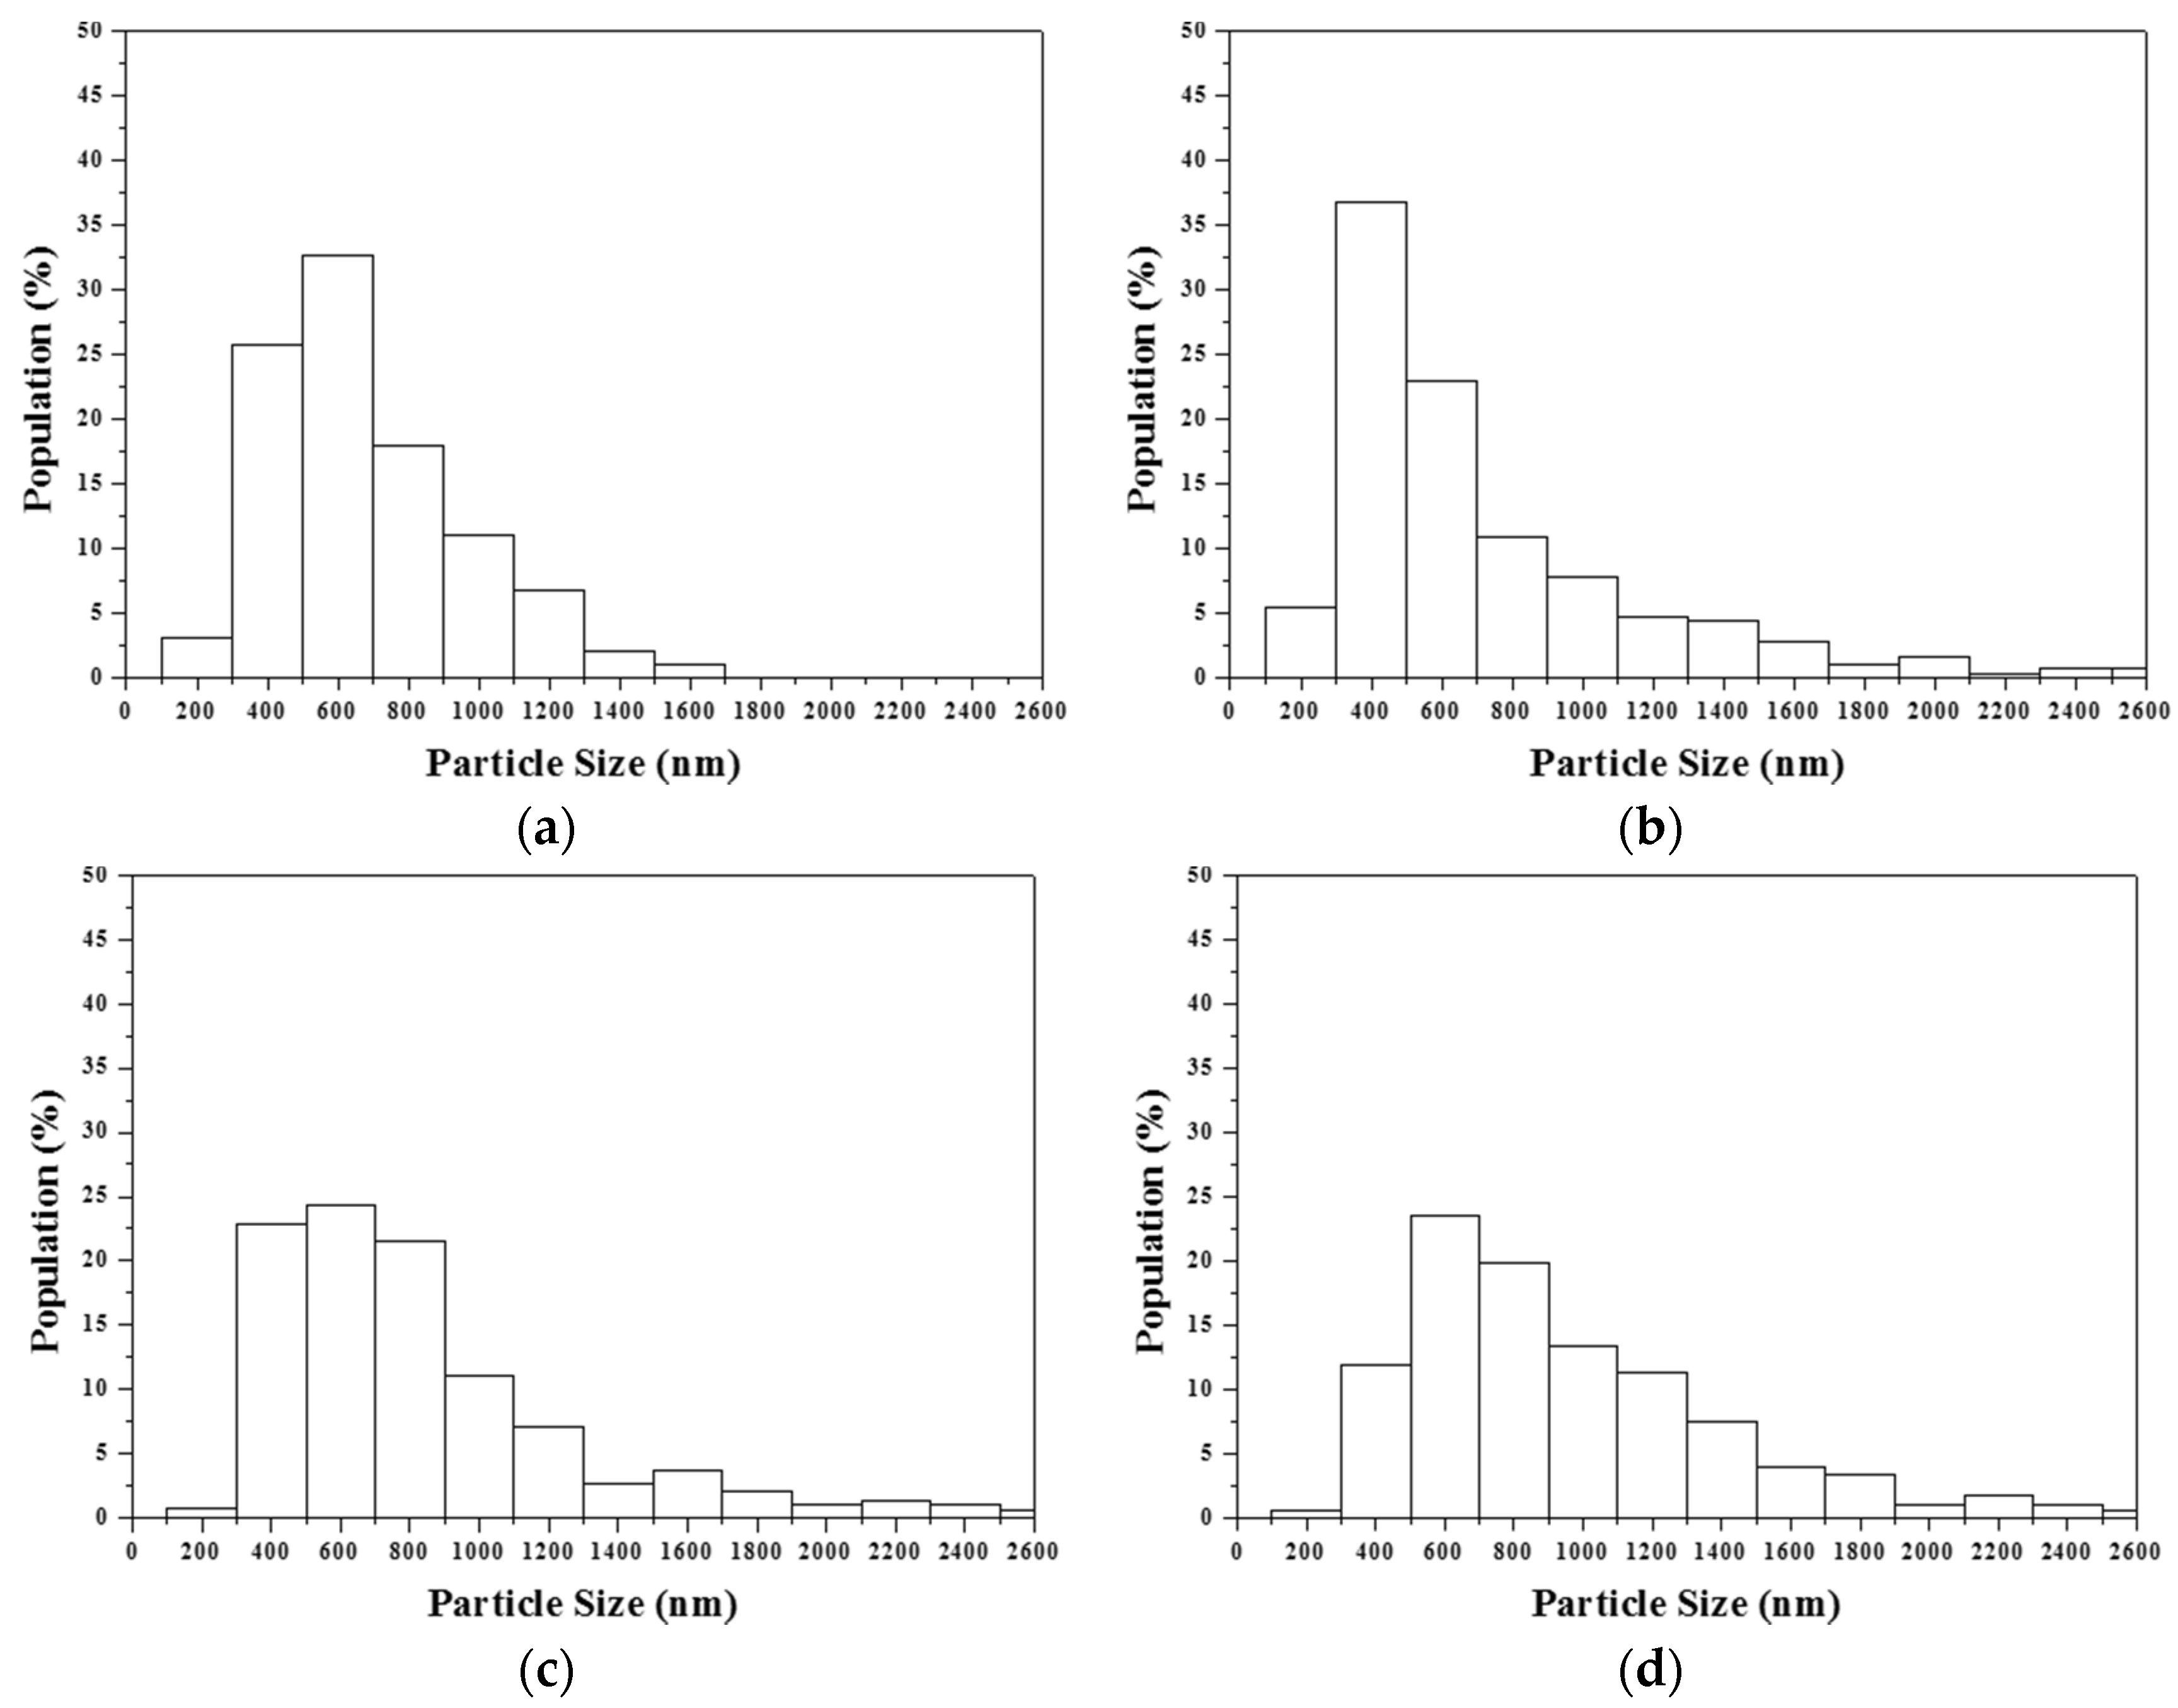
The statistical analysis suggested a direct relation between particle size and surfactant concentration; the higher the surfactant concentration, the larger the particle size. It is well known that the particle size is a function of precursor, solid content in the precursor solution, and ultrasonic frequency [
32]. In this study, the solid content in the precursor solution and ultrasonic frequency were fixed. The result suggested that the precursor solution of a high surfactant concentration provides more porosity to form larger particles than a lower surfactant concentration, which is supported by TEM results (
Figure 3). In addition, there was no considerable correlation between particle size and particle morphology; the average particle sizes and their standard deviations for Type I and II particles were 1.12 ± 0.66 and 0.85 ± 0.66 µm, respectively. This indicates the distribution of elongated tubes and stacked lamellae was homogenous.
Furthermore, a detailed examination showed that all MBG powders exhibited a normal size distribution (submicron size) and not the bimodal distribution (nano and submicron size). A normal size distribution implied that the particle formation mechanism involved only “one-particle-per-drop” and not “gas-to-particle conversion” [
33]. Furthermore, for the case of spray pyrolyzed BG (without addition of surfactant) [
26], the effects of phase separation on loss of bioactivity were investigated. This phase-separated BG powder contains the submicron glass ceramic particles, with the amorphous phases and the minor phases of monoclinic wollastonite (JCPDS of 43-1460) and triclinic wollastonite (JCPDS 29-0372), and the amorphous SiO
2 nanoparticles. These wollastonite phases reduce the amorphous region, which is responsible for bioactivity; therefore, the phase separation deteriorates the bioactivity of BG. So, the formation of amorphous SiO
2 nanoparticles inhibits the formation of HA. This result supports that the view that the addition of a surfactant stabilizes the Si precursor and avoids the formation of amorphous SiO
2 nanoparticles [
31] that cause the gas-to-particle conversion for phase separation.
Although a high specific surface area of MBGs leads to a high bioactivity [
7], the data of specific surface area must be compared with those of the bioactivity test to determine the relationship between bioactivity and specific surface area.
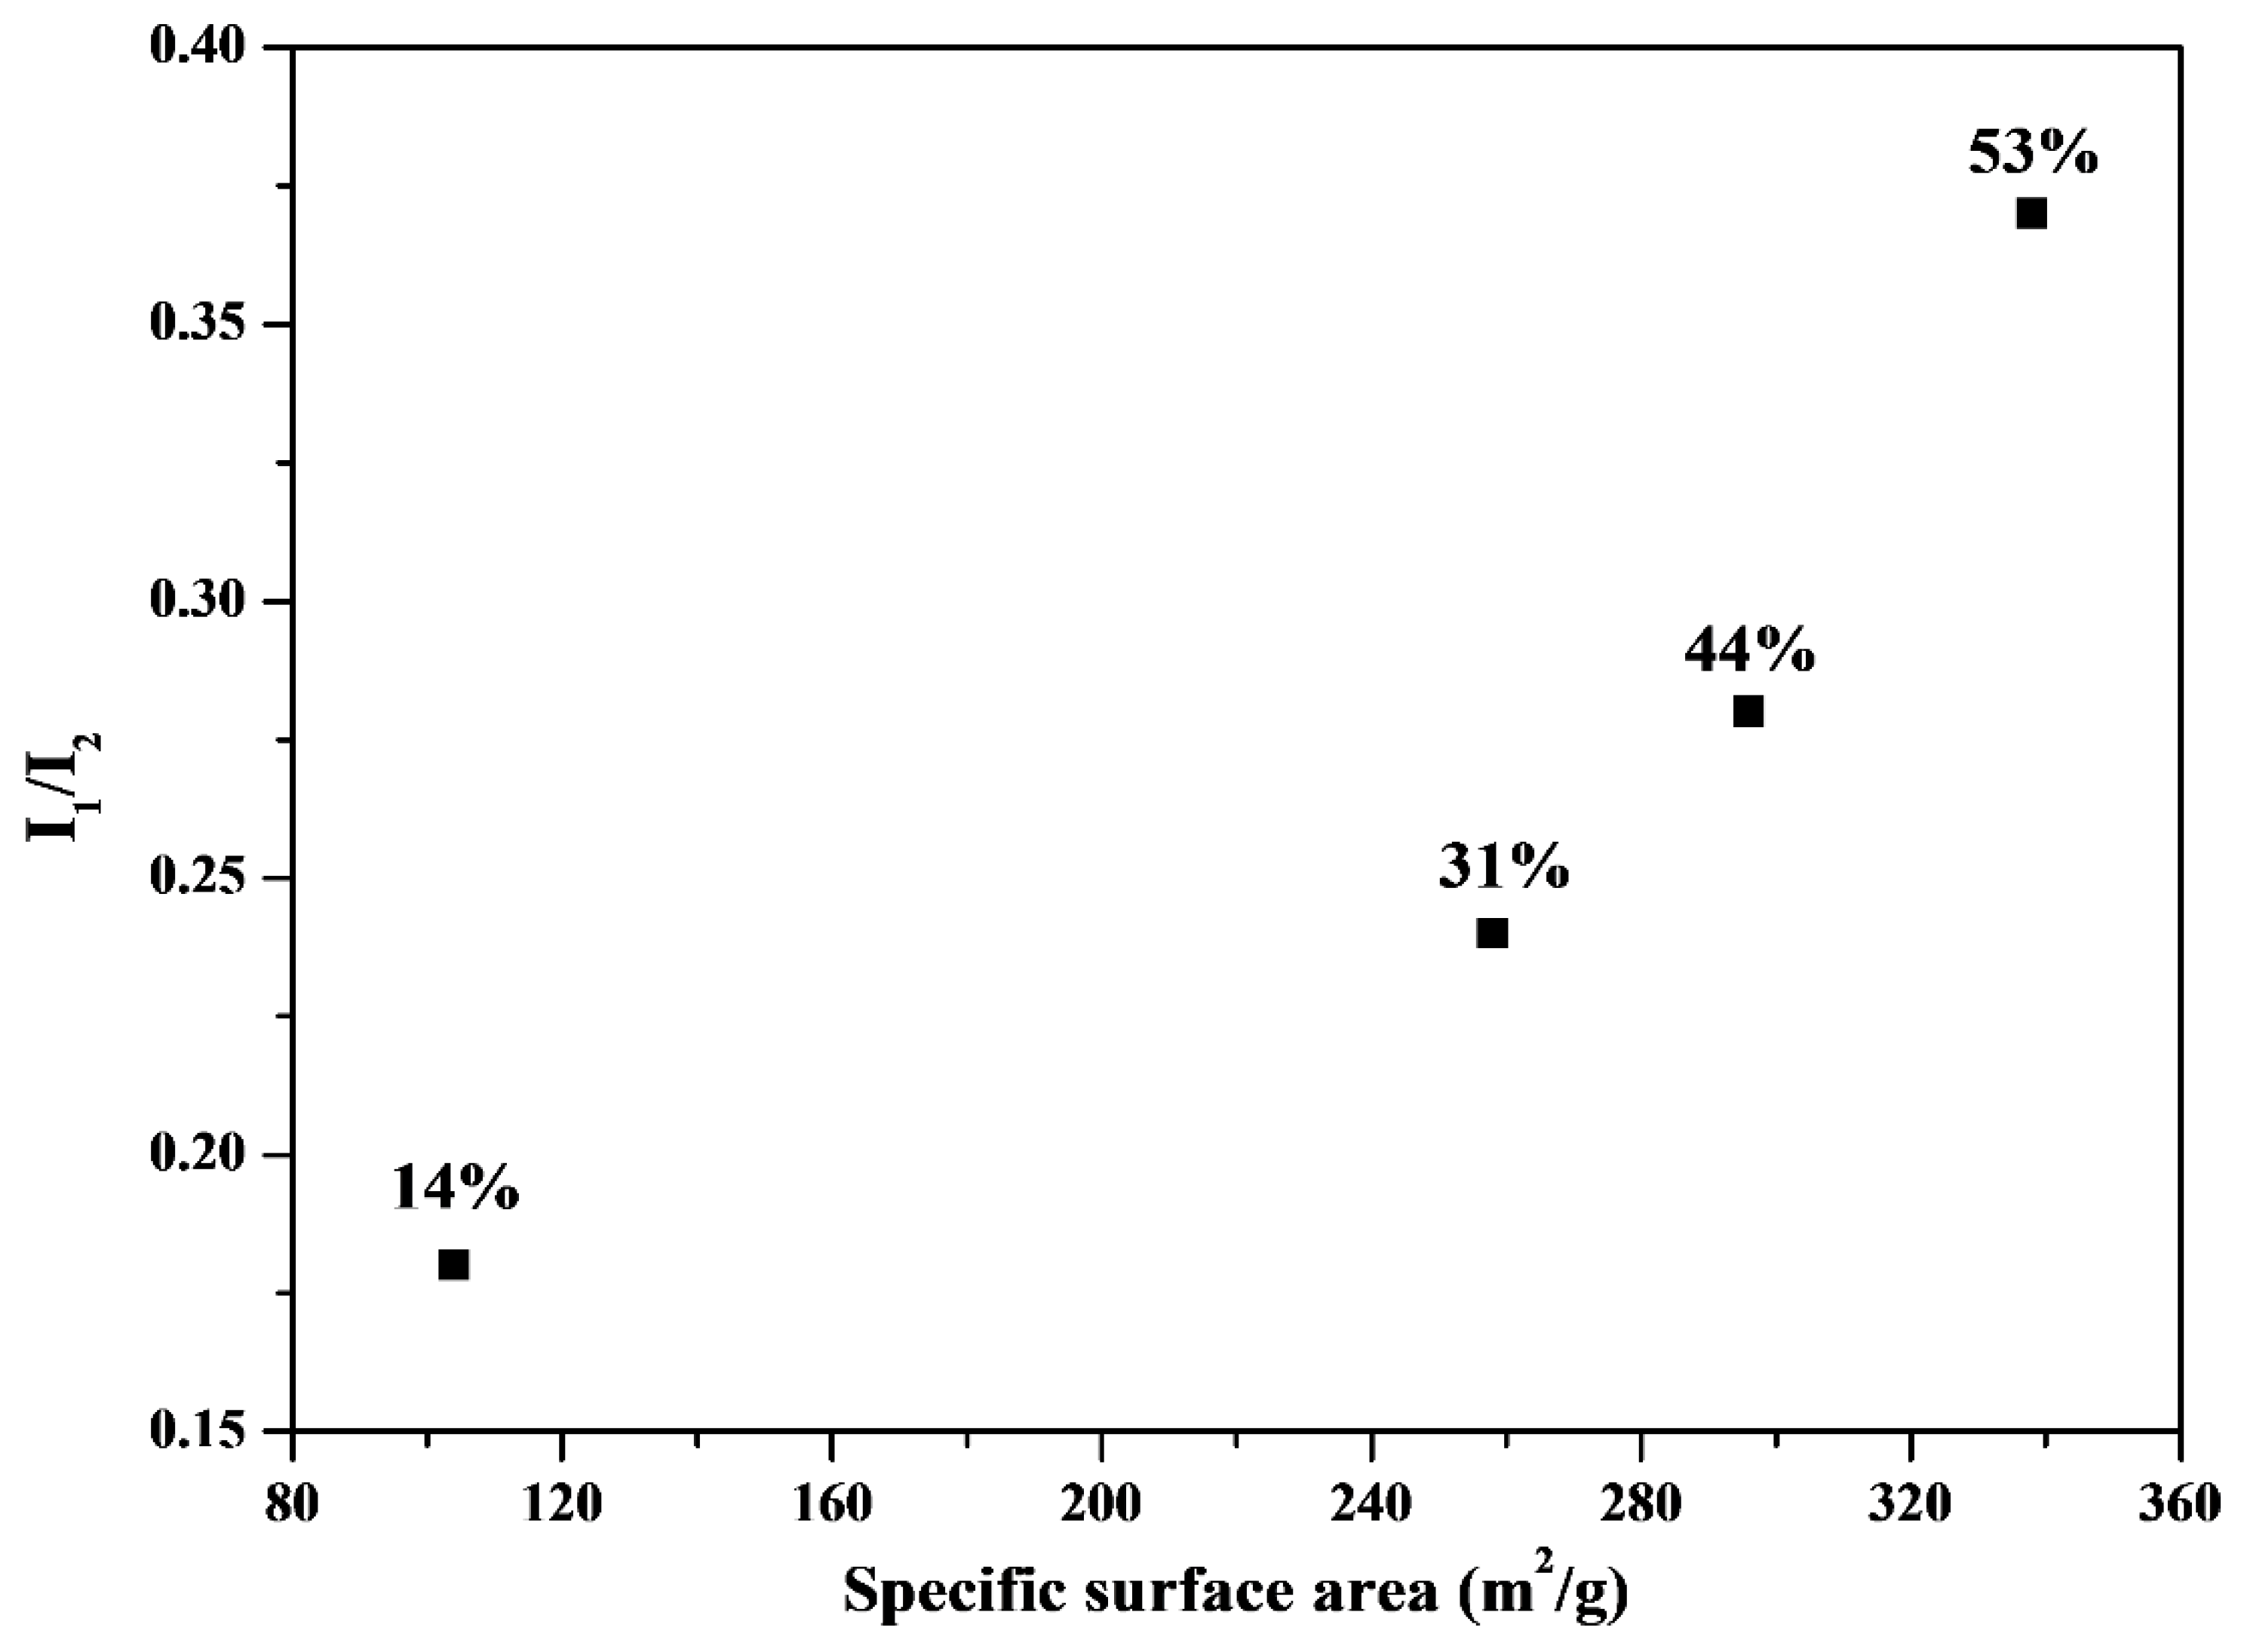
Figure 6 shows the relationship between HA bioactivity (the I
1/I
2 value) and the corresponding specific surface area. The I
1/I
2 value (
i.e., bioactivity) increased with an increase in the specific surface area. The BET data suggested that the specific surface area of the MBG powders followed the order 44% (338.9 m
2/g) > 53% (296.6 m
2/g) > 31% (258.3 m
2/g) > 14% (104.2 m
2/g), which is consistent with the bioactivity order (I
1/I
2)) (44% (0.37) > 53% (0.28) > 31% (0.24) > 14% (0.18)). Therefore, maximizing the specific surface area is critical for bioactivity improvement in SP-derived MBG particles.
Figure 6.
Comparison of I1/I2 (bioactivity) and surface area for various surfactant concentrations treated MBG. The values of surfactant concentration are given.
Figure 6.
Comparison of I1/I2 (bioactivity) and surface area for various surfactant concentrations treated MBG. The values of surfactant concentration are given.
Previous studies have reported that the specific surface area of an MBG is determined by its pore size [
5] and particle morphology [
17]. First, we considered the case of MBG powders with a similar pore size to minimize the influence of pore size on the specific surface area. For example, 14 wt %, 31 wt %, and 44 wt % F127-treated MBG powders had a similar pore size of 7 nm, and the specific surface area increased with an increase in the surfactant concentration (104.2, 258.3, and 338.9 m
2/g for 14 wt %, 31 wt %, and 44 wt %, respectively), implying that a MBG powder with a high surfactant concentration provides more micelle tubes, resulting in a high specific surface area (
i.e., a high density of the mesopores). Furthermore, in principle, a 53 wt % F127-treated MBG powder should contain the highest amount of micelle tubes and the largest specific surface area. However, the BET value of the 53 wt % F127-treated MBG powder was lower than that of the 44 wt % F127-treated MBG powder. A possible explanation is that in the case of 53 wt % F127-treated MBG powder, in precursor droplets, the surfactant concentration is higher than its CMC (between 33 wt % and 44 wt %), causing the micelles to aggregate and produce stacked lamellae and then settle on the droplets because of a lower density than water. After sintering, the organic moieties of these lamellae are burned to form the wrinkled structure (Type II).
Figure 7 shows the particle morphology as a function of the surfactant concentration. The population of Type II morphology increased from 44.6% to 96.1% when the surfactant concentration was increased from 44 wt % to 53 wt %. This wrinkled structure may be attributable to the loss of the specific surface area because the structure reduced the mesopore density on the MBG surface (
Figure 3d).
Figure 7.
Relationship between particle shape and surface area for various surfactant concentrations treated MBG powders. The percentage values of Type I and II are given.
Figure 7.
Relationship between particle shape and surface area for various surfactant concentrations treated MBG powders. The percentage values of Type I and II are given.
In summary, a suitable surfactant concentration that provides a high mesopore density and avoids the formation of aggregated surfactant lamellae must be determined for maximizing the specific surface area and in turn obtaining high bioactivity in MBGs.
4. Materials and Methods
4.1. Synthesis
The SiO2-CaO-P2O5 MBG powders were prepared from four F127 surfactant concentrations of 14 wt %, 31 wt %, 44 wt % and 53 wt %, using SP. Initially, the Si, Ca, and P precursors are 6.70 g tetraethyl orthosilicate (TEOS, Si(OC2H5)4, 99.9 wt %, Showa, Osaka, Japan), 1.40 g calcium nitrate tetrahydrate (CN, Ca(NO3)2 4H2O, 98.5 wt %, Showa, Osaka, Japan) and 0.73 g triethyl phosphate (TEP, (C2H5)3PO4, 99 wt %, Alfa Aesar, Haverhill, MA, USA), respectively for the Si:Ca:P molar ratio of 80:15:5. Then, these precursors were mixed with 1.44, 3.97, 6.95, and 9.97 g F127 surfactants (for surfactant concentrations of 14 wt %, 31 wt %, 44 wt % and 53 wt %), dissolved in 1.00 g 0.5 M HCl and 60.00 g ethanol and stirred at room temperature for 24 h to form precursor solutions. For the SP process, the 10 mL of precursor solution was mixed with 90 mL of DI water to disperse into fine droplets using the nebulizer (King Ultrasonics Co., New Taipei, Taiwan) at the frequency of 1.65 MHz. Subsequently, the droplets formed particles in a tube furnace (D110, Dengyng, New Taipei, Taiwan), which has three preheating, calcination, and cooling zones of 400, 700, and 500 °C. The surfaces of the particles were then charged by electrons released from tungsten corona wire at high voltage (16 kV). Finally, the negatively charged powders were neutralized and condensed in an earthed stainless steel collector.
4.2. Characterization
In order to understand the detailed structures of MBG powders prepared using various F127 concentrations (14, 31, 44 and 53 wt %), the data of phase composition, surface structure, geometry, and specific surface area were examined using XRD, SEM, TEM and BET, respectively. Firstly, the phase composition was observed using the X-ray diffractometer (D2 Phaser, Billerica, MA, USA) with the operating voltage of 30 kV, the operating current of 10mA, the scan range of 2θ angle from 20° to 50° and the scan rate of 1° s−1. Secondly, the surface morphology was observed by using field-emission SEM (JSM-6500F, JEOL, Tokyo, Japan), and, for each MBG powder, over 300 MBG particles from a few SEM micrographs have been acquired to obtain the corresponding particle size distribution. Thirdly, field-emission TEM (Tecnai G2 F20, FEI, Hillsboro, OR, USA) was carried out to exam the detailed geometries and pore sizes of MBG; more than 100 pores were used to obtain the average value and standard deviation of pore size. Finally, the specific surface areas of various MBG powders were measured by the Brunauer-Emmett-Teller (BET) method with nitrogen adsorption and desorption isotherms under the temperature of −196 °C; the powders were degassed at 400 °C for 3 h before the BET measurements.
In addition, the test solution of Kokubo’s simulated body fluid (SBF) [
9] has been previously used for
in vitro bioactivity tests. The MBG powders were immersed in SBF at 37 °C for 1 day. The amount of SBF was adjusted to the specific surface areas of MBG. Solid to liquid ratio of 2 mg to 10 mL for the case of 14 wt %, 2 mg to 25 mL for the case of 31 wt %, 2 mg to 33 mL for the case of 44 wt % and 2 mg to 29 mL for the case of 53 wt %. Then, the immersed powers were dried at 100 °C for 1 day, and the phase composition of immersed powders was characterized using XRD to examine the bioactivity of MBG, the HA formation ability of MBG in SBF. The quantitative values of bioactivity of MBG powders were determined using the peak area from the largest peak of HA.


