3.1. Yields, and Proximate and Ultimate Analysis of Pyrolysis Solids
The characteristics of the solids obtained in the pyrolysis experiments can be influenced by the operating conditions of the first pyrolysis reactor. Olive tree cuttings and eucalyptus were pyrolyzed at different temperatures and heating rates, therefore, several biochars were obtained. Their yields and characterization are presented in
Table 2 and
Table 3.
Table 2.
Proximate and ultimate analyses of the pyrolysis solids obtained at different temperatures (20 °C·min−1).
Table 2.
Proximate and ultimate analyses of the pyrolysis solids obtained at different temperatures (20 °C·min−1).
| (Weight %) | Olives | Eucalyptus |
|---|
| 600 °C | 750 °C | 600 °C | 750 °C |
|---|
| Solid yields | 22.9 | 21.3 | 22.4 | 22.9 |
| Proximate analysis (ap) a | Moisture | 2.0 | 1.7 | 2.2 | 1.4 |
| Volatile matter | 11.8 | 10.0 | 12.0 | 8.6 |
| Ash | 9.5 | 9.2 | 5.9 | 6.2 |
| Fixed Carbon c | 76.7 | 79.1 | 79.9 | 83.8 |
| Ultimate analysis (daf) b | C | 86.0 | 94.5 | 88.0 | 90.1 |
| H | 2.1 | 0.9 | 1.4 | 0.8 |
| N | 0.8 | 1.2 | 0.6 | 0.6 |
| Others (mainly O) c | 11.1 | 3.4 | 10.0 | 8.5 |
| HHV (ap) a (MJ kg−1) | 30.8 | 28.8 | 31.6 | 31.0 |
Table 3.
Characteristics of the pyrolysis solids obtained at different heating rates (750 °C).
Table 3.
Characteristics of the pyrolysis solids obtained at different heating rates (750 °C).
| (Weight %) | Olives | Eucalyptus |
|---|
| 20 °C·min−1 | 15 °C·min−1 | 3 °C·min−1 | 20 °C·min−1 | 3 °C·min−1 |
|---|
| Solid yields | 21.3 | 24.6 | 26.1 | 22.9 | 26.0 |
| Proximate analysis (ap) a | Moisture | 1.7 | 1.6 | 1.7 | 1.4 | 1.4 |
| Volatile matter | 10.0 | 10.1 | 10.6 | 8.6 | 8.0 |
| Ash | 9.2 | 10.2 | 9.2 | 6.2 | 5.3 |
| Fixed Carbon b | 79.1 | 78.1 | 78.5 | 83.8 | 85.3 |
| Ultimate analysis (daf) c | C | 94.5 | 92.9 | 94.6 | 90.1 | 96.2 |
| H | 0.9 | 1.1 | 0.8 | 0.8 | 0.9 |
| N | 1.2 | 1.4 | 1.3 | 0.6 | 0.9 |
| Others (mainly O) b | 3.4 | 4.6 | 3.3 | 8.5 | 2.0 |
| HHV (ap) a (MJ kg−1) | 28.8 | 27.5 | 29.5 | 31.0 | 31.6 |
Taking a look at the solid yields, in
Table 2 it can be seen that temperature has not much influence. However,
Table 3 shows an influence of the heating rate: the lower the heating rate, the higher the solid yield. These results are in agreement with the results obtained by other authors [
24,
25]. The pyrolysis solid yields are in the range of 21–23 wt % at 20 °C·min
−1 and 26 wt % when the lowest heating rate is used. Therefore the reduction of heating rate has the beneficial effect of increasing the pyrolysis solids yields. Liquid and gas yields obtained in these pyrolysis experiments can be found in [
26].
Pyrolysis solids are mainly composed of carbon, with elemental carbon contents around 90 wt %. The moisture content is rather low (≈1.7 wt %), the volatiles content is quite low (≈11 wt %) and the ash content is around 9 and 6 wt % for olives and eucalyptus samples respectively.
It is well known that the higher the fixed carbon and the lower the volatile matter content, the better is the quality of metallurgical reducing agents.
Table 2 shows that the fixed and elemental carbon contents of the biocokes of both samples are higher while the volatile matter is lower when the higher pyrolysis temperature (750 °C) is used. Similar tendencies regarding the effect of temperature in the fixed carbon and volatile matter contents of pyrolysis solids have been reported in the literature [
27].
Table 3 shows that there is no influence of heating rate on the composition of pyrolysis solids. Although it is a well-known fact that decreasing heating rates intensifies the carbonization process giving rise to carbon-richer products, this tendency is not observed in the results of
Table 3. The reason for this may be that 20 °C·min
−1 is a heating rate slow enough to produce a well carbonized product at 750 °C, so that slower heating rates do not further promote carbonization at such temperature.
Regarding the HHV of the pyrolysis solids it can be seen that it is rather high (≈30 MJ·kg
−1) which is in the range of the HHV of commonly used solid fossil fuels, such as bituminous coals [
28].
In view of the characteristics of biomass derived pyrolysis solids, many potential applications for them can be proposed. They can be used as rather good quality solid fuel (high HHV, low pollutants (S, N) content and low ash contents compared to fossil fuels), or as sorbent material provided that it is firstly activated, or as soil amendment agent. However, the application proposed in this work is as reducing agent for metallurgical purposes. For this reason, the three previously mentioned commercial reducing agents (metallurgical coke, petroleum coke, and anthracite), used for Zn reduction in rotary kilns by Befesa Zinc Aser S.A. company, were characterized. The detailed specifications that Befesa Zinc Aser S.A. requires from their providers of reducing agents are presented in
Table 4. The specifications on dry basis, which are also included in the table, have been calculated considering that the moisture content is 20 wt %, which is as the table shows, the maximum allowable moisture specified by Befesa; these data on dry basis would be the permitted values if the sample did not contain moisture and enable coke samples to be compared regardless of their moisture.
Table 4.
Quality specifications for commercial reducing agents required by Befesa Zinc Aser S.A. company 2013.
Table 4.
Quality specifications for commercial reducing agents required by Befesa Zinc Aser S.A. company 2013.
| Material | Parameter | Befesa Zinc Aser Technical Specifications (wt %) | Specifications on Dry Basis (wt %) * |
|---|
| Metallurgical coke | Granulometry | >10 mm: ≤20% <2 mm: ≤40% on daily sample | – |
| Dry ash | ≤20% on monthly sample | ≤20% |
| Moisture | ≤20% on daily sample | – |
| Volatile matter | ≤7% on monthly sample | ≤8.75% |
| Sulfur | ≤3% on monthly sample | ≤3.75% |
| Petroleum coke | Granulometry | <2 mm: >30% >10 mm: ≤20% on diary sample | – |
| Dry ash | ≤20% on monthly sample | ≤20% |
| Moisture | ≤20% on daily sample | – |
| Volatile matter | ≤15% on monthly sample | ≤18.75% |
| Sulfur | ≤3% on monthly sample | ≤3.75% |
| Anthracite | Granulometry | <2 mm: >30% >10 mm: ≤20% on diary sample | – |
| Dry ash | ≤20% on monthly sample | ≤20% |
| Moisture | ≤20% on daily sample | – |
| Volatile matter | ≤7% on monthly sample | ≤8.75% |
| Sulfur | ≤3% on monthly sample | ≤3.75% |
Table 5 presents the proximate and ultimate analyses of the commercial reducing agents and the biomass-based reducing agents obtained at 3 °C·min
−1 and 750 °C, all on dry basis. For better analysis of the results, the Befesa specifications are included in brackets in
Table 5.
Table 5.
Proximate and ultimate analyses of the commercial reducers and the bioreducers (750 °C and 3 °C·min−1).
Table 5.
Proximate and ultimate analyses of the commercial reducers and the bioreducers (750 °C and 3 °C·min−1).
| Dry Basis (wt %) | Commercial Reducers | Bioreducers |
|---|
| Metallurgical Coke | Petroleum Coke | Anthracite | Olives | Eucalyp. |
|---|
| Moisture | 11.4 (<20) | 6.4 (<20) | 18.0 (<20) | 1.7 | 1.4 |
| Proximate analysis | Volatile matter | 3.9 (<8.75) | 10.1 (<18.75) | 7.2 (<8.75) | 10.8 | 8.1 |
| Ash | 12.5 (<20) | 2.0 (<20) | 11.2 (<20) | 9.4 | 5.4 |
| Fixed carbon * | 83.6 | 87.9 | 81.6 | 79.9 | 86.5 |
| Ultimate analysis | C | 84.4 | 83.5 | 86.6 | 85.6 | 90.9 |
| H | 0.5 | 2.8 | 0.6 | 0.8 | 1.0 |
| N | 1.0 | 1.3 | 1.0 | 1.2 | 0.8 |
| S | 0.9 (<3.75) | 5.6 (<3.75) | 0.6 (<3.75) | <0.05 | <0.05 |
| Others * | 0.8 | 4.9 | 0.0 | 3.0 | 1.9 |
| HHV (MJ·kg−1) | 29.3 | 35.9 | 31.1 | 29.5 | 31.6 |
It is a fact worth mentioning that the commercial reducers have very high moisture contents. Such contents certainly do not correspond to the natural inherent moisture of these materials, and it is most probably accidental moisture incorporated into the samples during their transport and/or storage. As a matter of fact, water drops could be seen in the containers in which the commercial reducers were provided. For this reason, the proximate and ultimate analyses of all the samples are presented in
Table 5 on dry basis, in order to more fairly compare the intrinsic properties of the commercial and the biomass derived reducers, regardless of the moisture content.
It has also to be mentioned that although the commercial reducers were provided by Befesa Zinc Aser S.A. itself, one of them (petroleum coke) does not totally fulfill the quality requirements specified by the company, since it contains more sulfur (5.6 wt %) than that specified in
Table 4 (<3 wt %).
Comparing the results of the commercial reducers and the bioreducers, the following advantages of the bioreducers can be mentioned: they have much lower moisture contents than any of the commercial reducers, lower ash contents than the metallurgical coke and the anthracite, and significantly lower sulfur contents than any of the commercial reducers. There is only one specification not fulfilled in the bioreducer derived from the olives sample: the volatile content is slightly higher than that specified for metallurgical coke and anthracite, though it does meet, by far, the petroleum coke volatile matter specification.
Therefore, it can be concluded that as far as composition is concerned, the olives and eucalyptus derived bioreducers can replace the commercial reducers in metallurgical processes in rotary kilns with the great advantage of having lower ash and sulfur contents.
3.2. Real Density, Specific Surface Area, and Porosity Measurements
Real density, specific surface area, and porosity of the pyrolysis reducers and of the commercial reducers were measured.
The results obtained in the textural characterization of the pyrolysis solids obtained at 20 °C·min
−1 and different pyrolysis temperatures are presented in
Figure 1 and
Figure 2, and
Table 6.
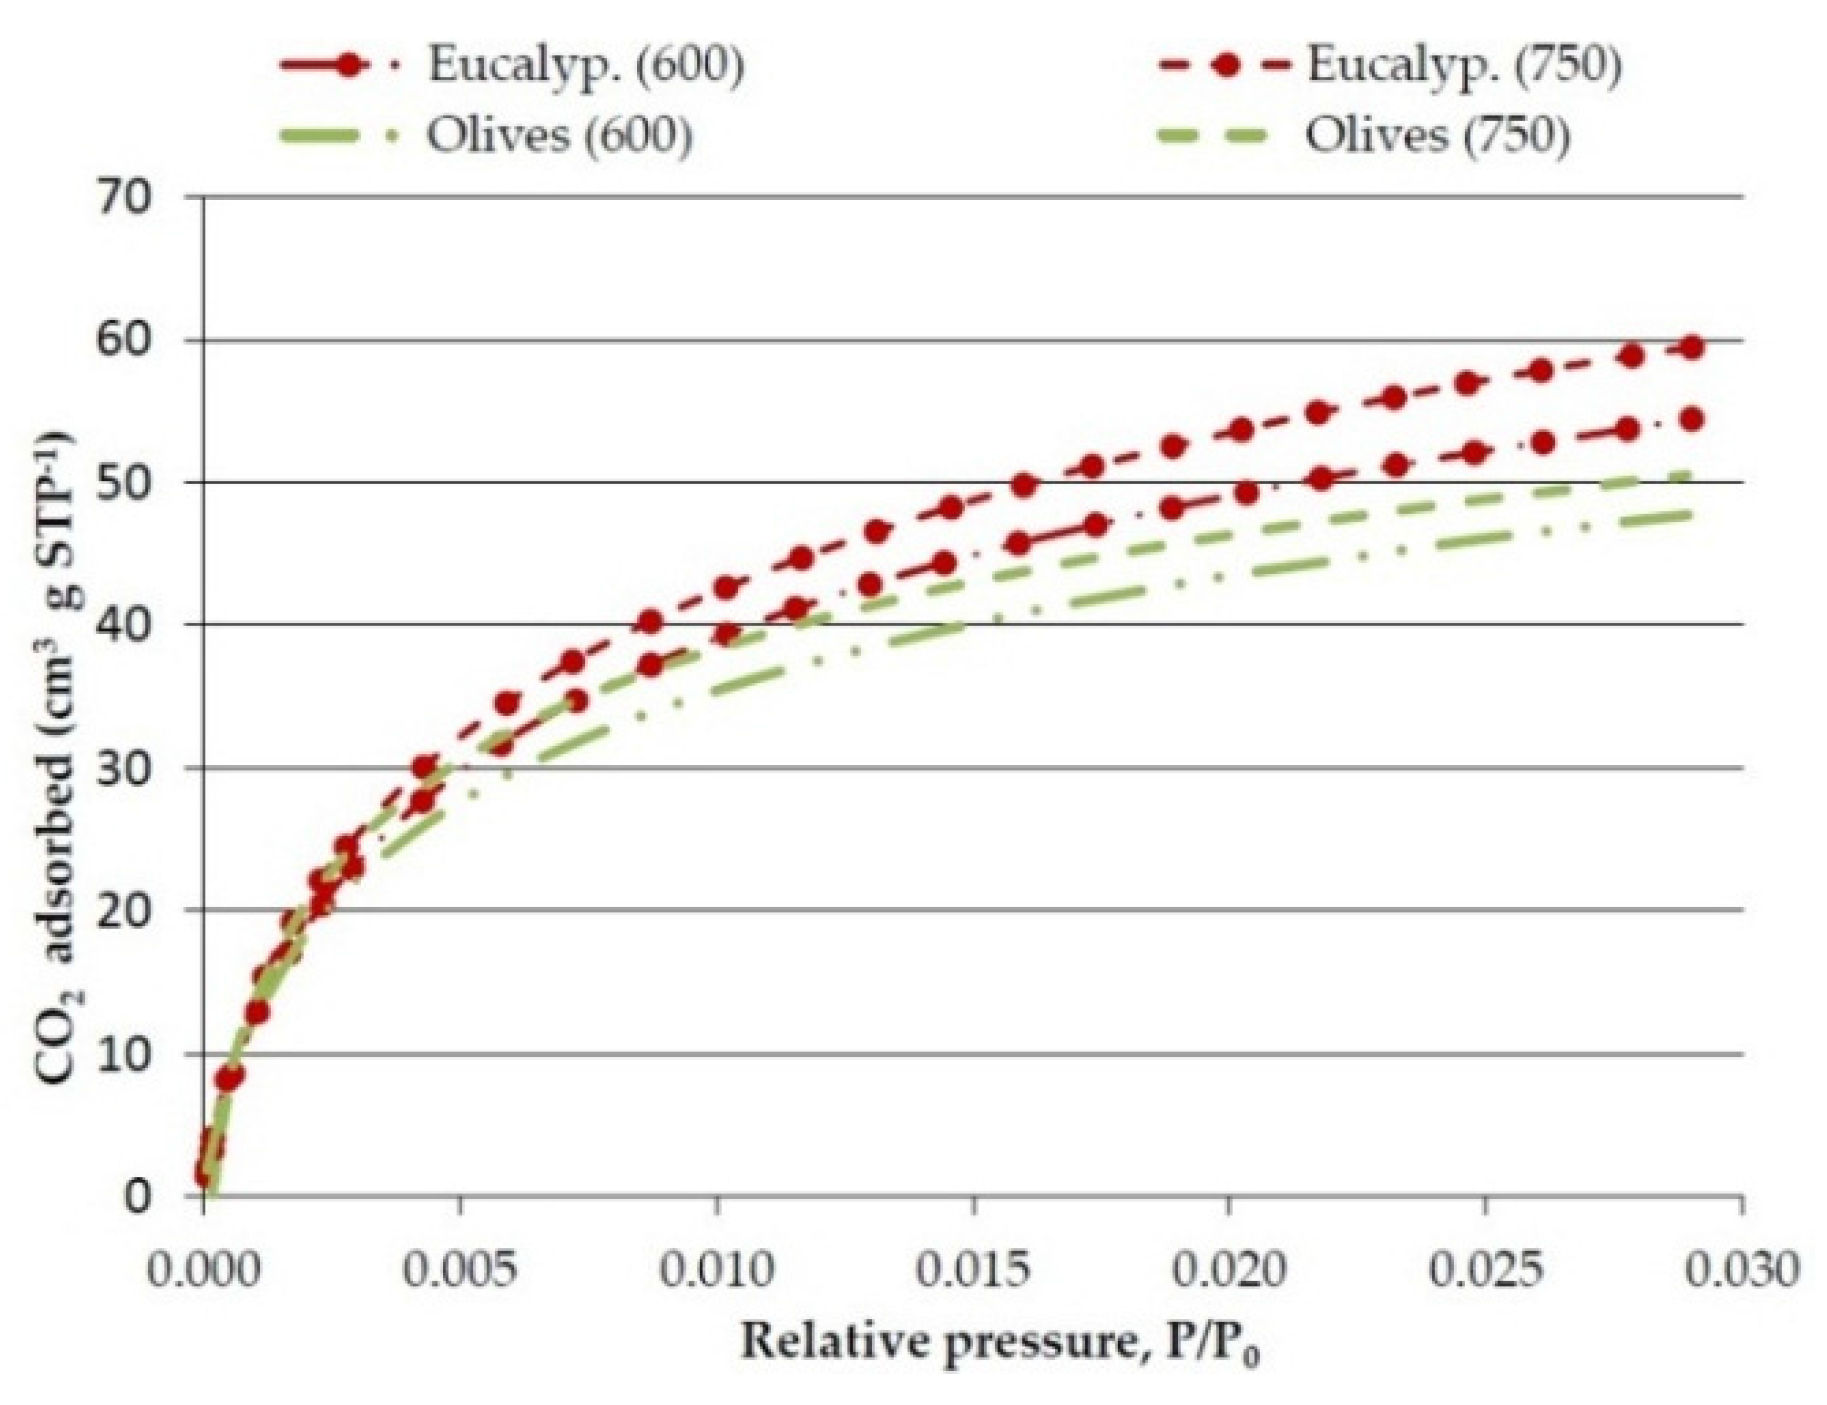
Figure 1.
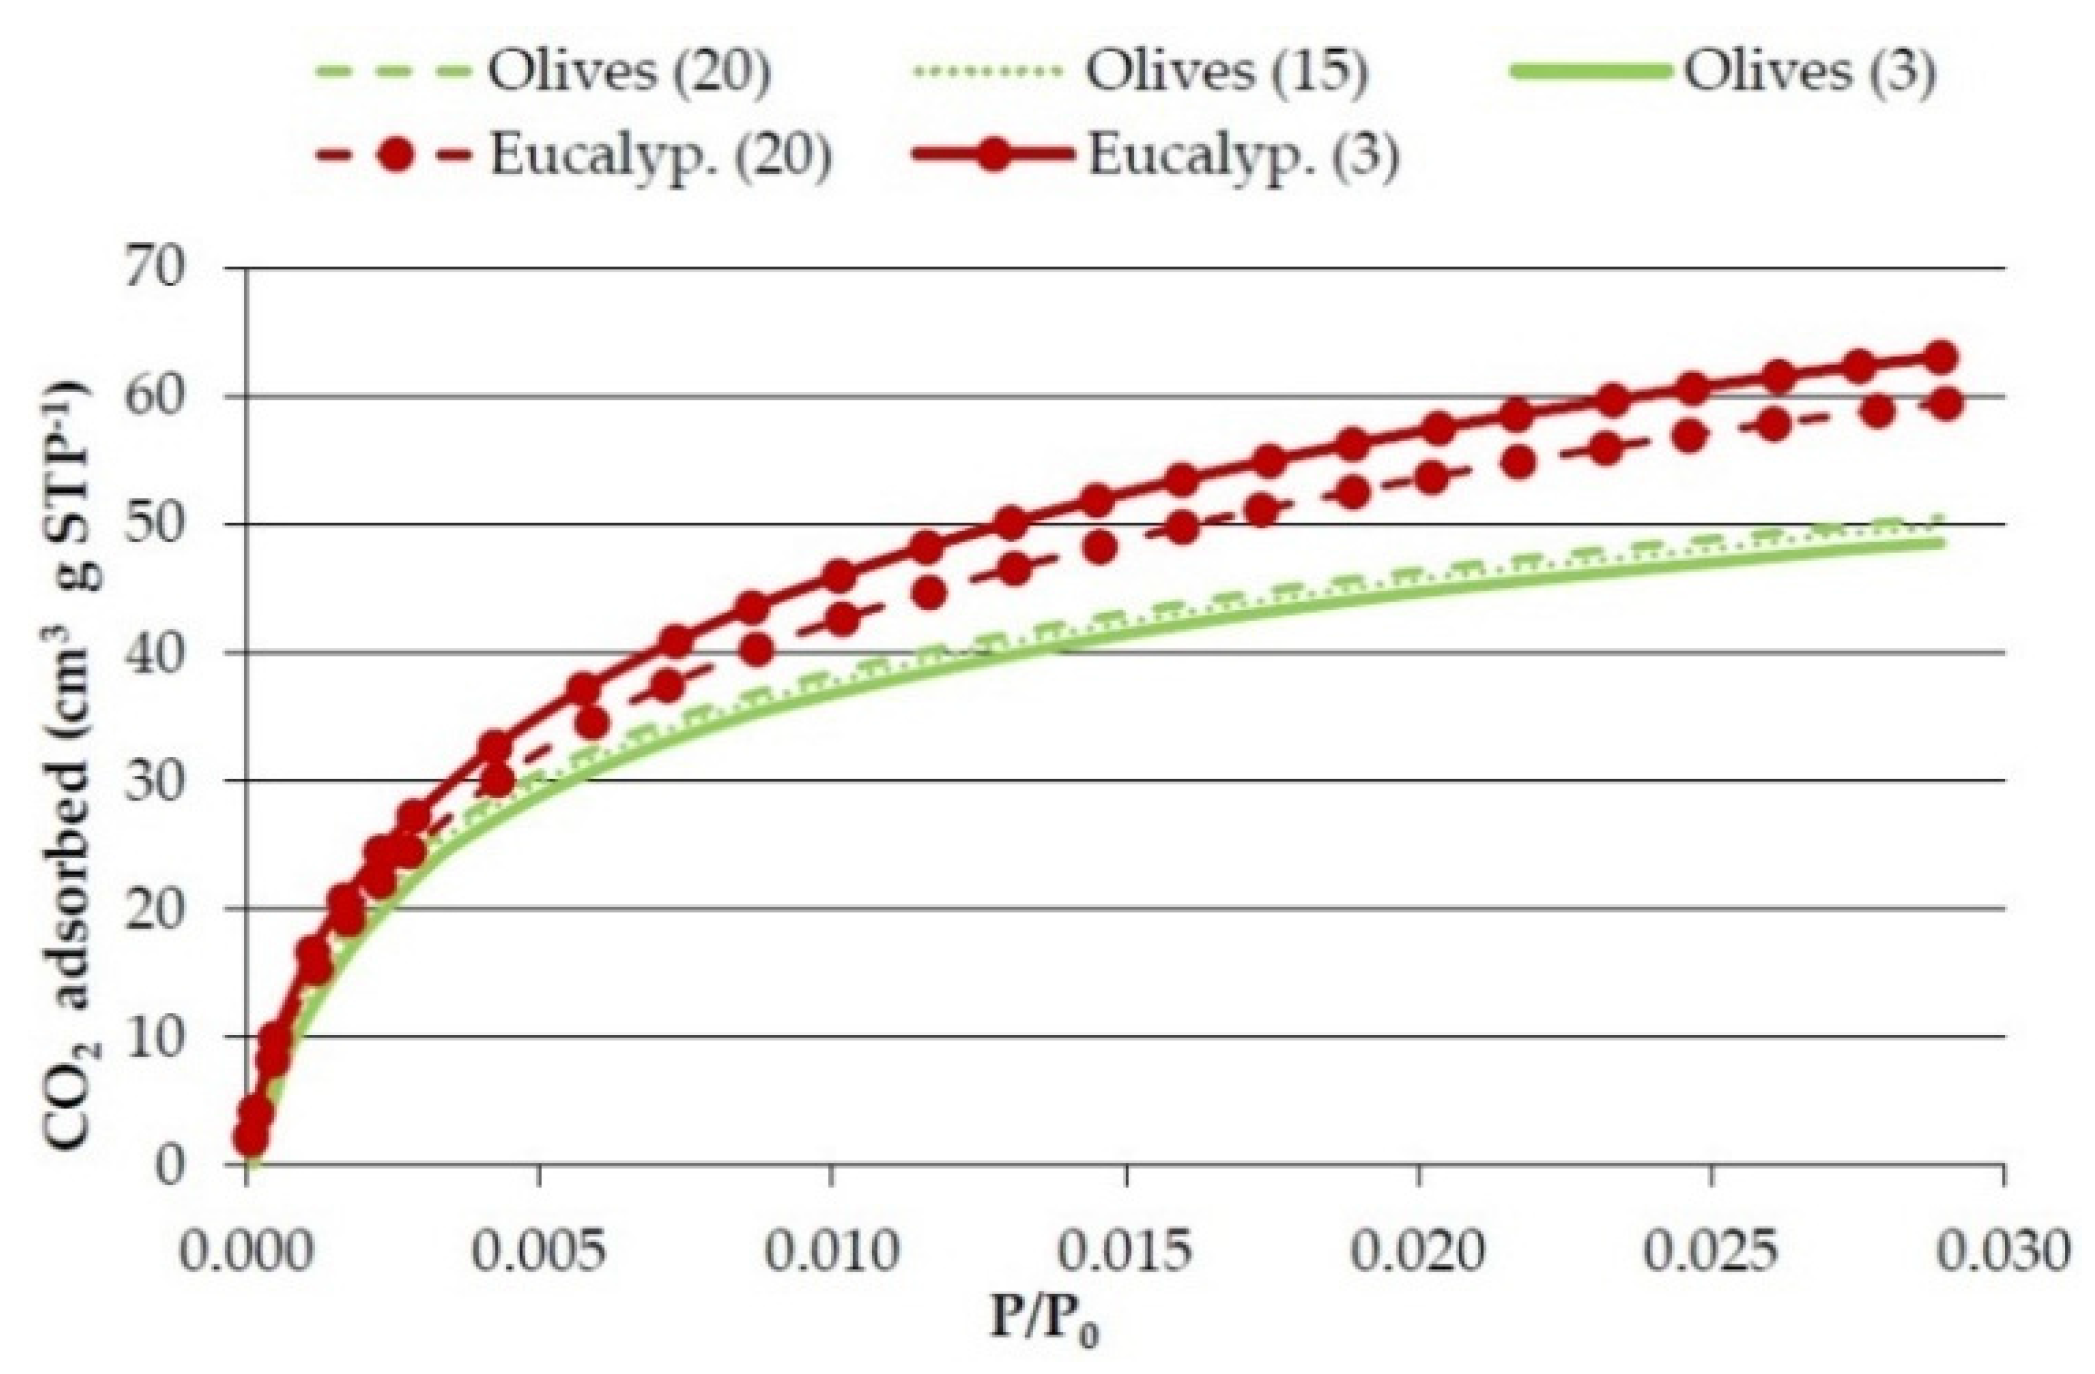
Effect of temperature on CO2 adsorption isotherms of the bioreducers obtained at 20 °C·min−1 from olives and eucalyptus samples.
Figure 1.
Effect of temperature on CO2 adsorption isotherms of the bioreducers obtained at 20 °C·min−1 from olives and eucalyptus samples.
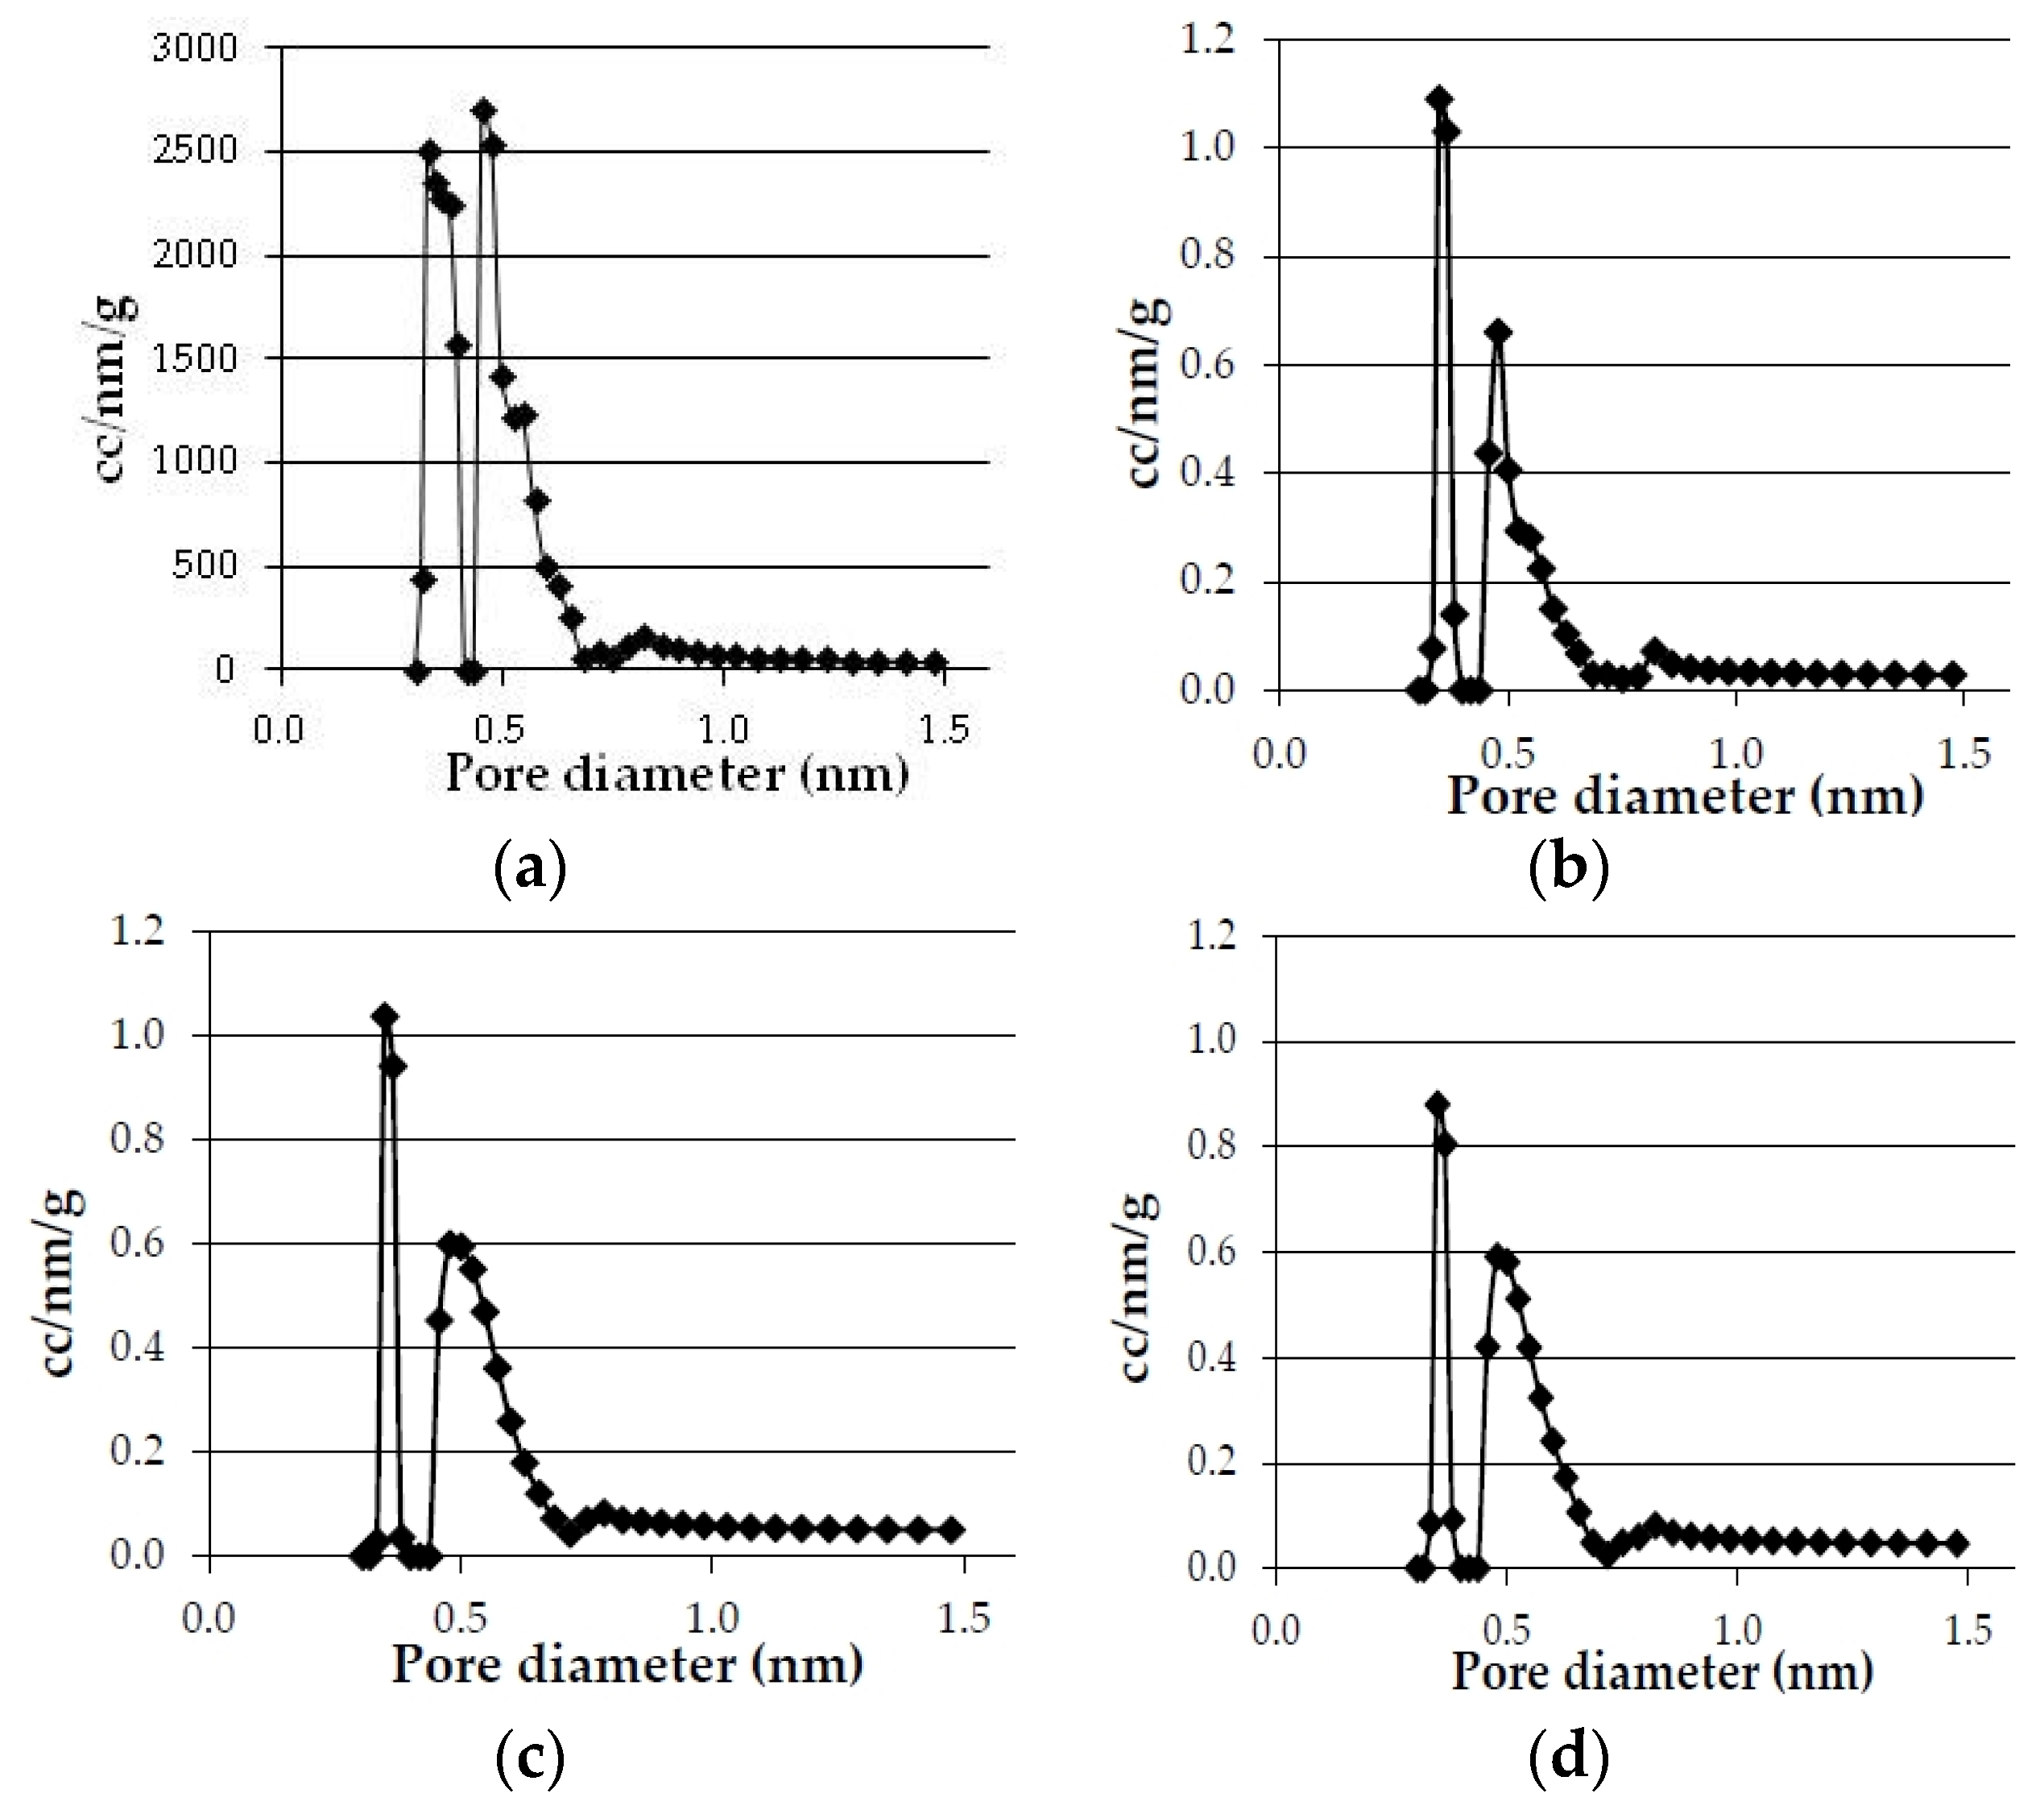
Figure 2.
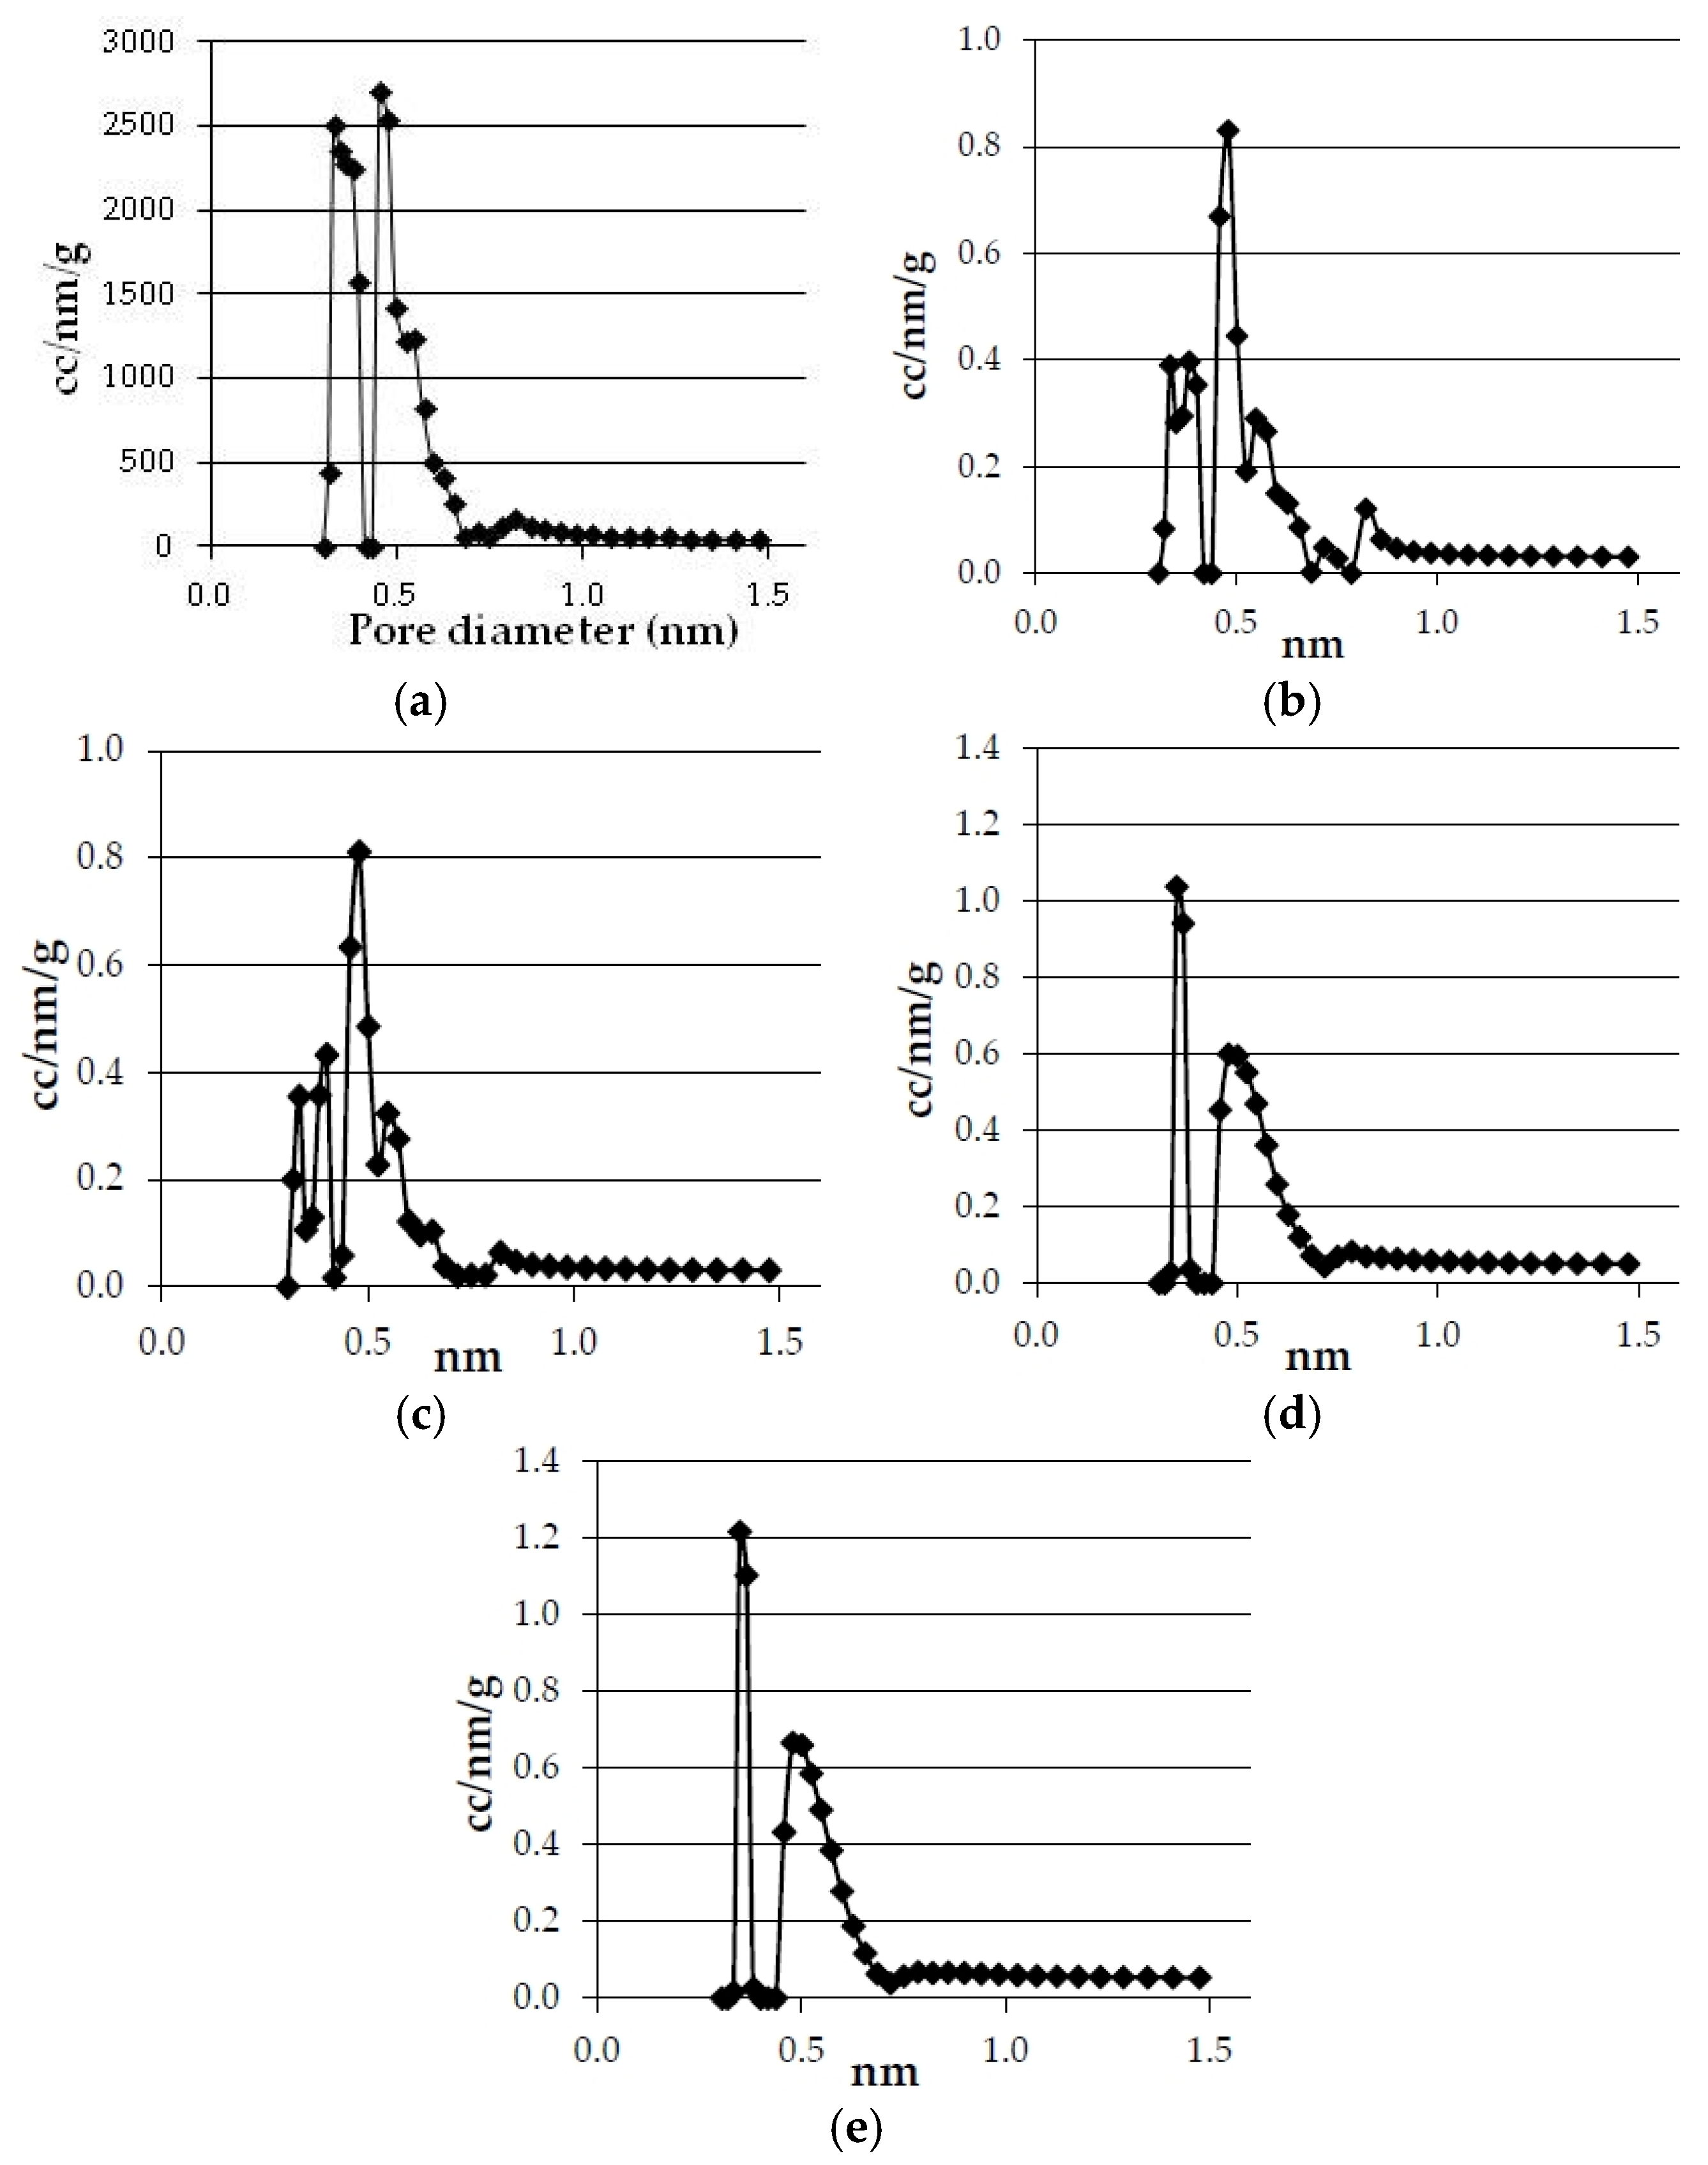
Effect of temperature in pore size distribution of the bioreducers obtained at 20 °C·min−1 from olives and eucalyptus samples. (a) Olives (750 °C); (b) Olives (600 °C); (c) Eucalyptus (750 °C); (a) Eucalyptus (600 °C).
Figure 2.
Effect of temperature in pore size distribution of the bioreducers obtained at 20 °C·min−1 from olives and eucalyptus samples. (a) Olives (750 °C); (b) Olives (600 °C); (c) Eucalyptus (750 °C); (a) Eucalyptus (600 °C).
Table 6.
Effect of the temperature in the textural characterization of the bioreducers (20 °C·min−1).
Table 6.
Effect of the temperature in the textural characterization of the bioreducers (20 °C·min−1).
| | Temperature (°C) | Real Density (g·cm−3) | Micropore Volume (cm3·g−1) | Micropore Equivalent Surface Area (m2·g−1) |
|---|
| Olives | 600 | 1.669 | 0.15 | 360 |
| 750 | 1.926 | 0.16 | 375 |
| Eucalyptus | 600 | 1.622 | 0.19 | 444 |
| 750 | 1.849 | 0.20 | 476 |
The CO
2 adsorption isotherms presented in
Figure 1 show the CO
2 volume adsorbed (cm
3·g
−1) against the relative pressure (
P/
P0). The CO
2 adsorption isotherms are clearly of Type I that are typical of microporous materials. Although there is some controversy, it is frequently considered that the micropores volume determined by CO
2 adsorption corresponds to narrow micropores (<0.7 nm).
The pore size distributions of the bioreducers samples calculated by the NL-DFT method are presented in
Figure 2, which show that the bioreducers do not have micropores greater than 0.7 nm, therefore, the micropores volume determined corresponds to the total pores volume.
Concerning the effect of the pyrolysis temperature,
Table 6 shows that the real density clearly increases as the temperature is raised from 600 °C to 750 °C, while the micropore volume and surface area also increases but very slightly.
The increase of micropore surface area with temperature is contrary to what has been observed by Burhenne,
et al. [
29] who reported a decrease in char surface area when the pyrolysis temperature was raised from 500 °C to 800 °C. This discrepancy may be due to differences in the surface area determination methods: N
2 (used by Burhenne)
versus CO
2 adsorption (used in this study). Burhenne’s reasoning is that at higher temperature an occlusion of most micropores occurs; however it is plausible that what happens is that at higher pyrolysis temperature, narrower micropores are produced, and these, as will be explained next, are difficult to be measured with liquid N
2.
Agirre,
et al. [
30] also found that the surface area increases when the pyrolysis temperature is raised. The reason for the increase of surface area with temperature may be that at higher temperatures greater amount of volatiles are driven out of the solid, giving rise to more micropores.
Concerning the effect of heating rate
Figure 3 and
Figure 4, and
Table 7 show the results obtained on the textural characterization of the solids obtained with olives and eucalyptus samples in pyrolysis at 750 °C with different heating rates.
Figure 3.
Effect of heating rate on CO2 adsorption isotherms of the bioreducers obtained at 750 °C from the olives and eucalyptus samples.
Figure 3.
Effect of heating rate on CO2 adsorption isotherms of the bioreducers obtained at 750 °C from the olives and eucalyptus samples.
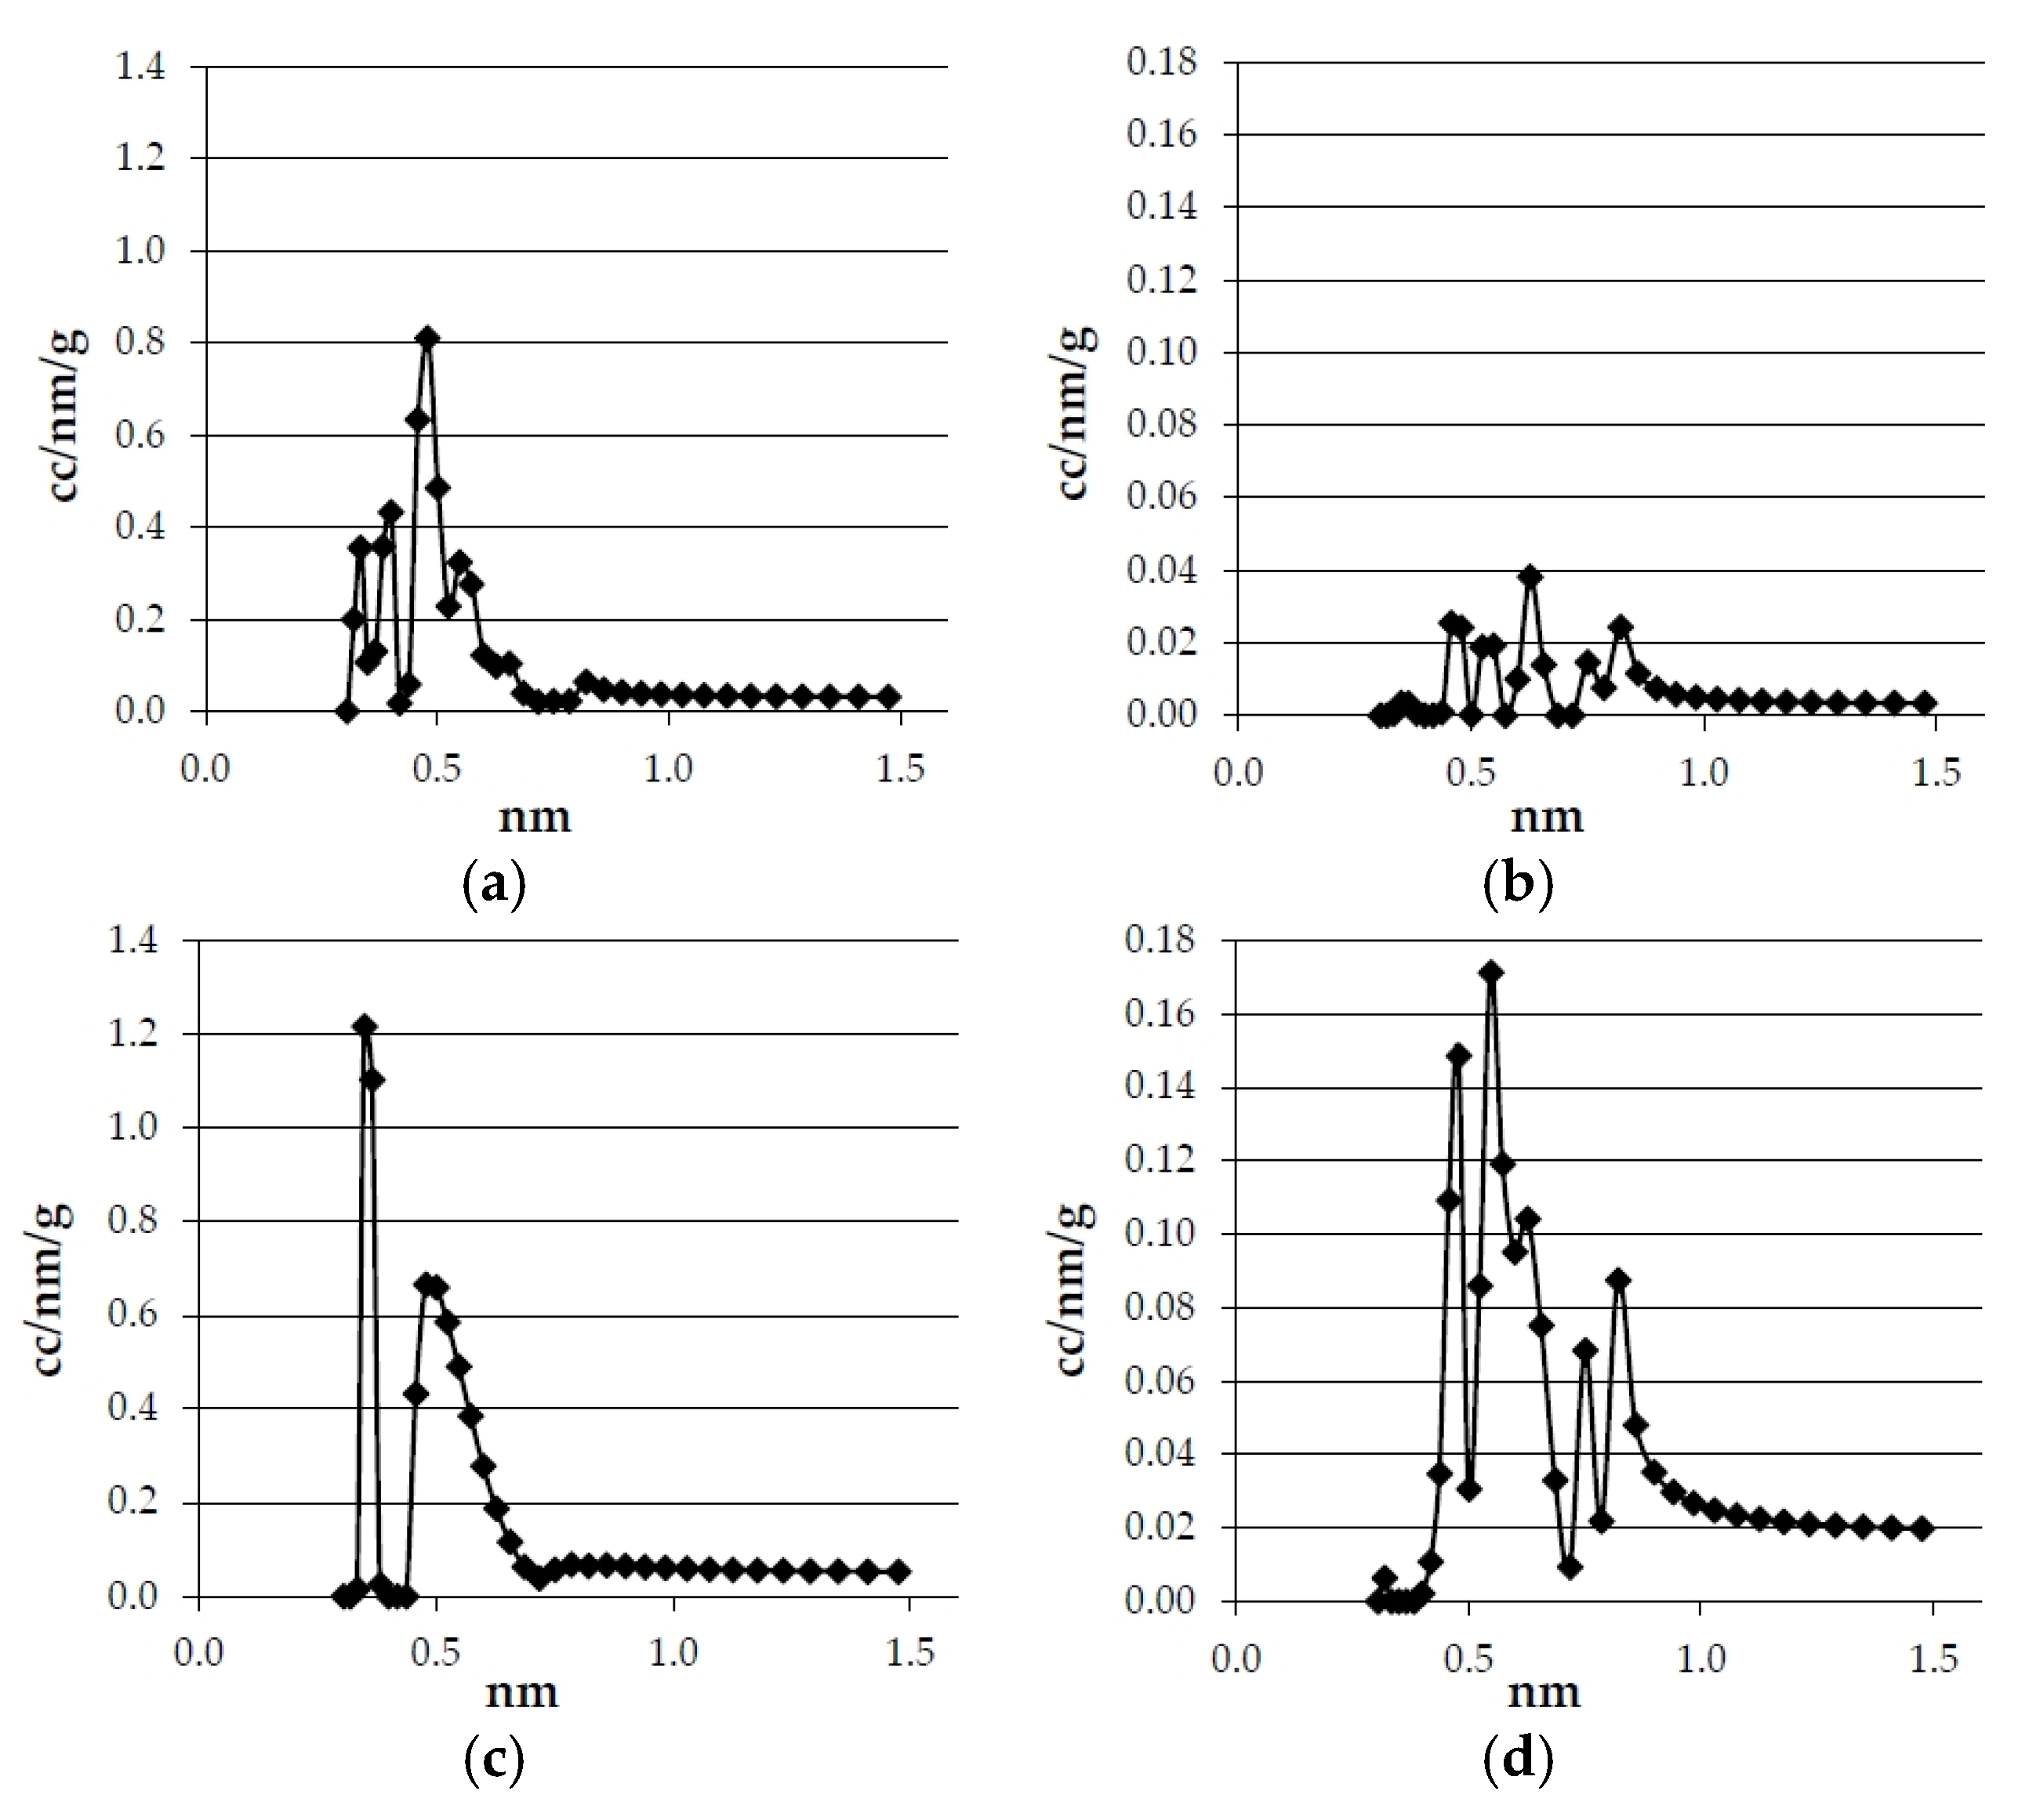
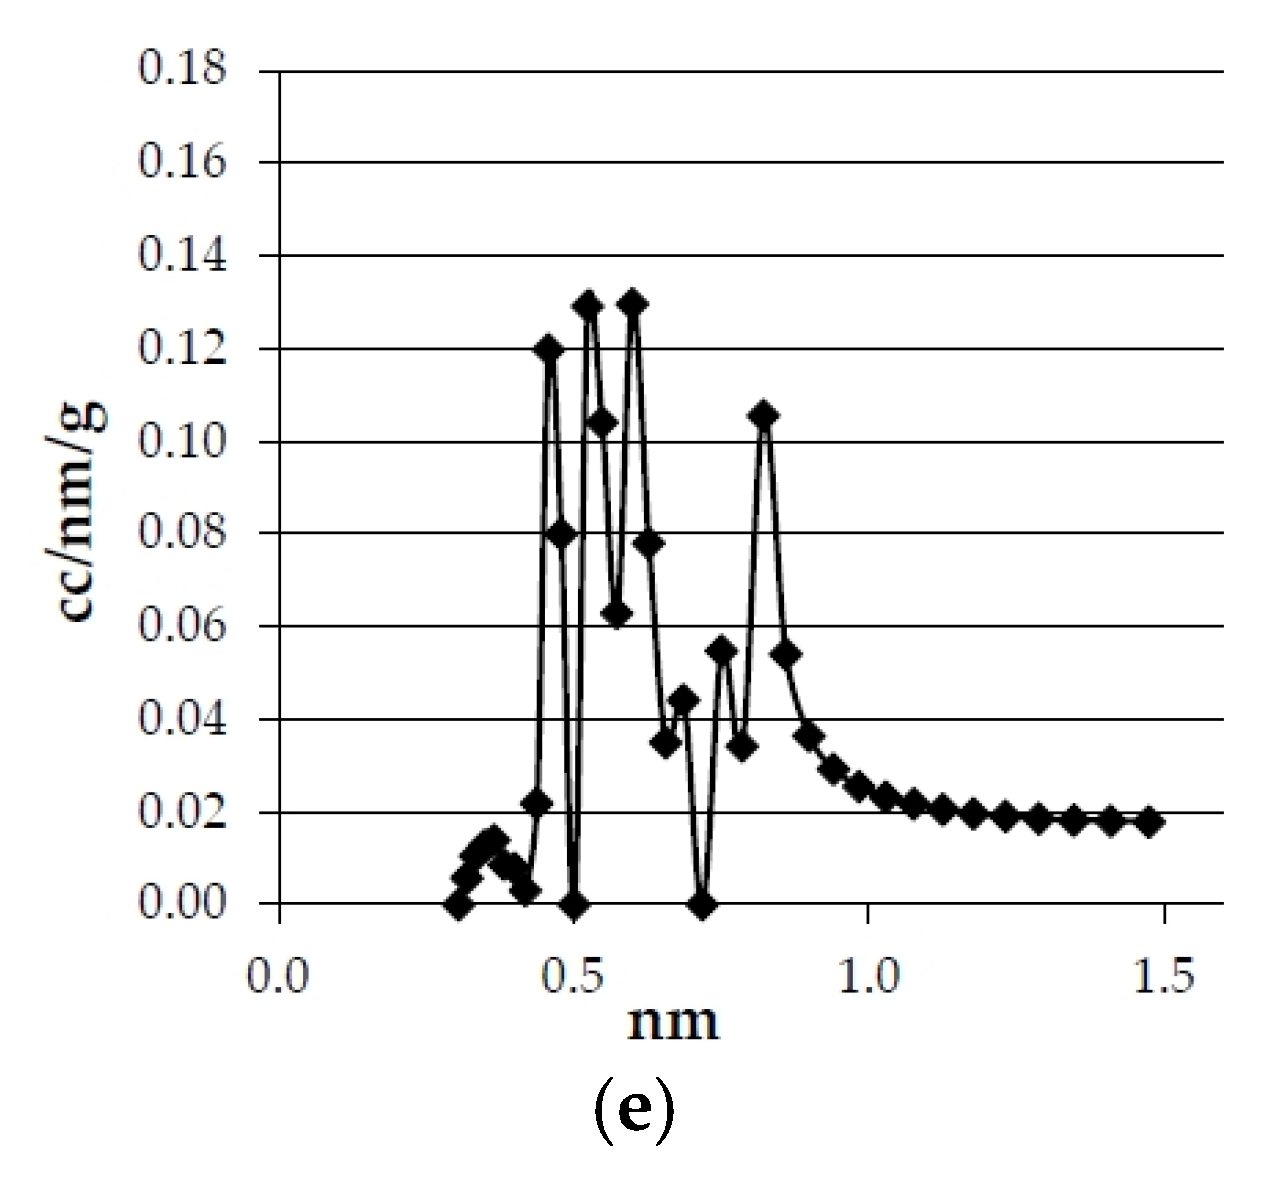
Figure 4.
Effect of heating rate in pore size distribution of the bioreducers obtained at 750 °C from the olives and eucalyptus samples. (a) Olives 20 °C·min−1; (b) Olives 15 °C·min−1; (c) Olives 3 °C·min−1; (d) Eucalyptus 20 °C·min−1; (e) Eucalyptus 3 °C·min−1.
Figure 4.
Effect of heating rate in pore size distribution of the bioreducers obtained at 750 °C from the olives and eucalyptus samples. (a) Olives 20 °C·min−1; (b) Olives 15 °C·min−1; (c) Olives 3 °C·min−1; (d) Eucalyptus 20 °C·min−1; (e) Eucalyptus 3 °C·min−1.
Table 7.
Effect of heating rate in the textural characterization of the bioreducers (750 °C).
Table 7.
Effect of heating rate in the textural characterization of the bioreducers (750 °C).
| | Heating Rate (°C·min−1) | Real Density (g·cm−3) | Micropore Volume (cm3·g−1) | Micropore Equivalent Surface Area (m2·g−1) |
|---|
| Olives | 20 | 1.926 | 0.16 | 375 |
| 15 | 1.867 | 0.15 | 362 |
| 3 | 1.871 | 0.15 | 363 |
| Eucalyptus | 20 | 1.849 | 0.20 | 476 |
| 3 | 1.830 | 0.21 | 501 |
There is no clear influence of heating rate on the textural properties.
Table 7 shows that in the case of olives the real density, micropore volume, and surface area somewhat decrease with the decrease in the heating rate, but in the case of the eucalyptus sample the density also decreases but the micropore volume and surface area somewhat increase.
Figure 3 and
Figure 4 also show a different effect of heating rate in olive solids and in eucalyptus solids. It has been reported that the longer the char residence time, the greater its surface area [
31,
32]. This was not the case in this study, which may be due to the fact that 20 °C·min
−1 is a low enough heating rate under which no further increase in surface area is produced.
If the surface areas of the bioreducers are compared to those presented in the literature, it can be seen that there are great differences. Very low charcoal surface areas have been reported by several authors: Huo,
et al. [
33] reported N
2 BET area < 9 m
2·g
−1 for chars obtained at 900 °C from saw dust and straw, Burhenne,
et al. [
29] reported N
2 BET area ≈ 1 m
2·g
−1 for spruce wood chars obtained at 800 °C, Senneca [
34] also reported N
2 BET areas < 1 m
2·g
−1 for char samples obtained from pine wood at 850 °C.
On the contrary, other authors report surface areas in the range of those obtained in this study. Rösler,
et al. [
35] obtained surface areas (measured by CO
2 adsorption) between 325 and 425 m
2·g
−1 for biochars obtained at 750 °C, Burhenne,
et al. [
29] obtained BET areas of 200–400 m
2·g
−1 for chars produced at 500 °C, and Carrier,
et al. [
36] reported a N
2 BET area of 259 m
2·g
−1 for char obtained from sugarcane bagasse at 460 °C and 349–452 m
2·g
−1 for that same char but after heating it to 800 °C and 900 °C in a N
2 atmosphere, as well as 441–570 m
2·g
−1 after activating the char with steam at 700–900 °C.
The reason for these differences in the surface areas is, most probably, the determination method used. As has been mentioned before, it is difficult to obtain reliable results with N
2 adsorption methods with carbonaceous materials, since it is carried at −196 °C and at such low temperature, N
2 has diffusion problems in the narrow micropores and therefore, it may take a long time to reach thermodynamic adsorption equilibrium, it may take (if reached) even weeks. Another reason for erroneous BET area measurements with liquid N
2 that has been reported in the literature [
37], is that there can be pore shrinkage, so that the measured surface areas are apparent, and not real. In this study, in the first place, it was tried to determine the surface areas by liquid N
2 adsorption, but for most of the bioreducers samples the equilibrium was not reached, even after a week, and in those samples that reached equilibrium, the BET area obtained was very low (7–15 m
2·g
−1).
The bioreducers obtained in this study have surface areas comparable to those reported by Carrier,
et al. [
36]. In particular, the eucalyptus derived bioreducers present surface areas (476–501 m
2·g
−1) equivalent to those reported by Carrier,
et al. [
36] for sugarcane derived chars activated with steam at 700–900 °C for 1 hour (441–570 m
2·g
−1). Therefore, the eucalyptus bioreducers could be used as a sorbent material without needing to be activated. However, it has to be mentioned that the surface area of the eucalyptus bioreducers, the same as that of Carrier,
et al. [
36] activated chars, are well below commercial activated carbon values (BET area ≈ 1000 m
2·g
−1).
A comparison between the textural properties of the three commercial reducing agents and of the pyrolysis solids obtained from olives and eucalyptus samples at 750 °C and 3 °C·min
−1 are presented in
Table 8.
Table 8.
Textural characterization of commercial reducers and bioreducers (750 °C and 3 °C·min−1).
Table 8.
Textural characterization of commercial reducers and bioreducers (750 °C and 3 °C·min−1).
| | Real Density (g·cm−3) | Micropore Volume (cm3·g−1) | Micropore Equivalent Surface Area (m2·g−1) |
|---|
| Olives | 1.871 | 0.15 | 363 |
| Eucalyptus | 1.830 | 0.21 | 501 |
| Metallurgical coke | 1.916 | 0.01 | 24 |
| Petroleum coke | 1.389 | 0.07 | 156 |
| Anthracite | 1.793 | 0.05 | 122 |
Concerning real density,
Table 8 shows that the bioreducers are comparable to metallurgical coke and anthracite, while petroleum coke has a significantly lower real density. This may be attributed to the lower ash content and the higher micropore volume of petroleum coke.
With respect to surface area, it can be seen that the bioreducers surface areas are much greater than those of the commercial reducers. Therefore, a higher reactivity of the bioreducers compared to the commercial reducers might be expected (this will be discussed in the following section).
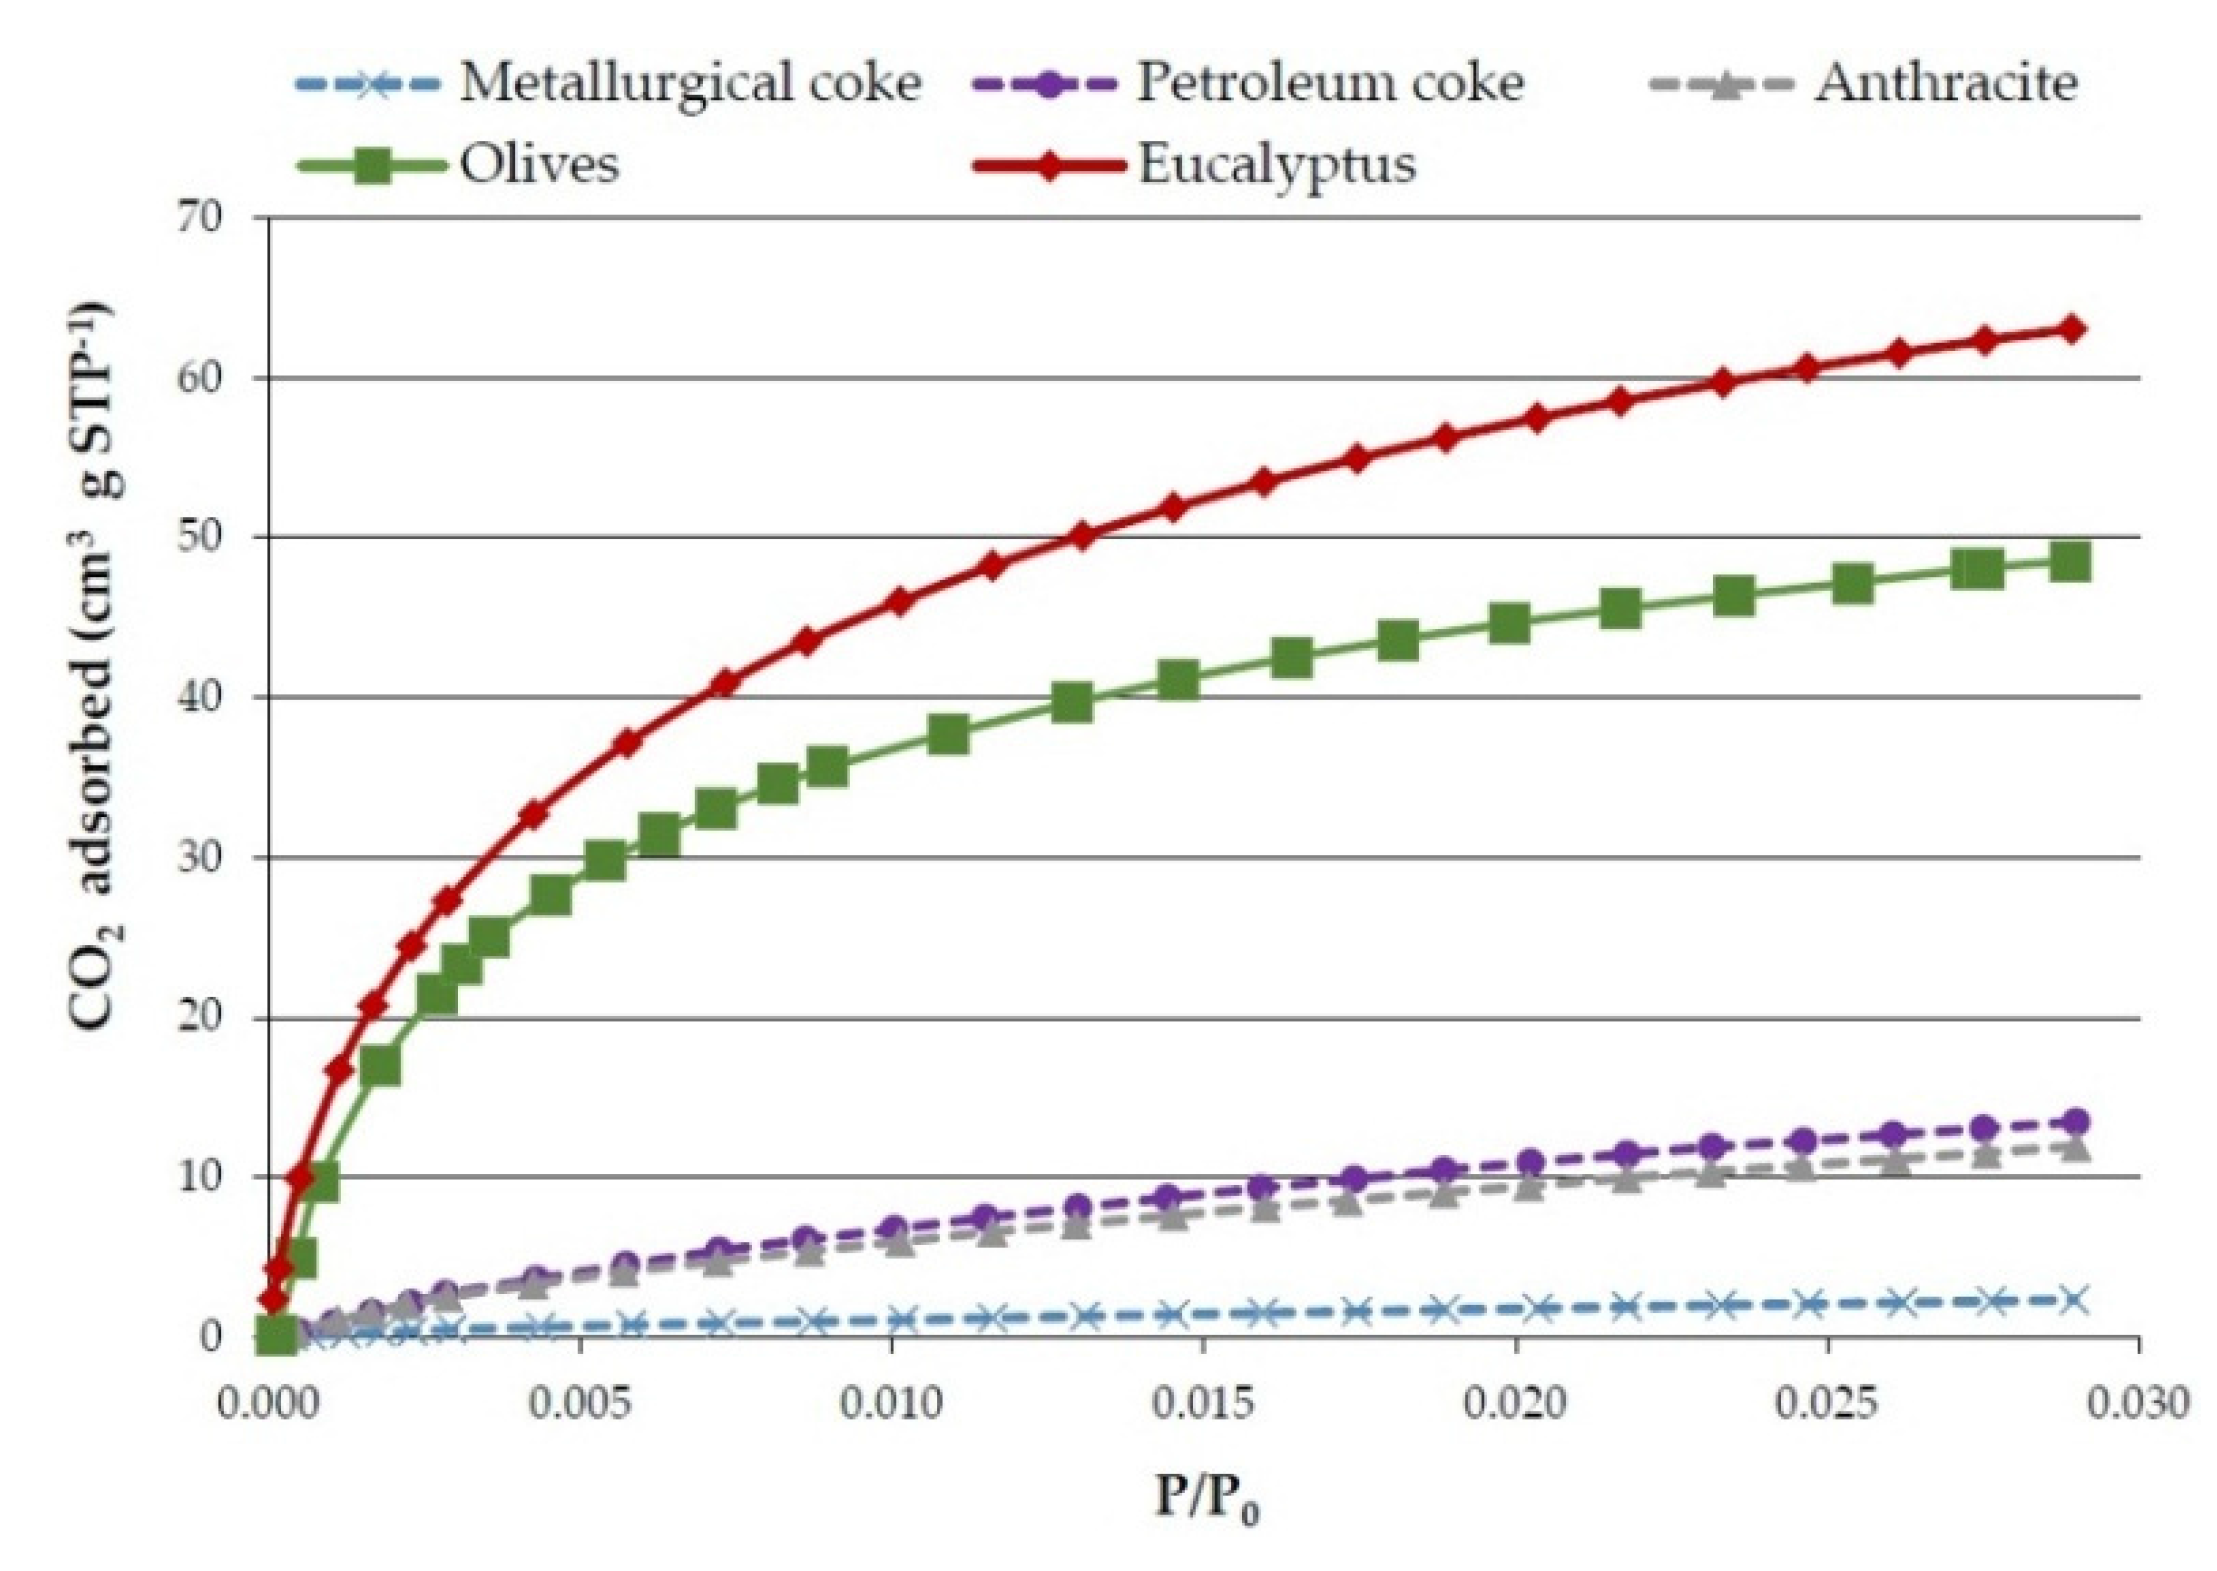
Figure 5 shows the CO
2 adsorption isotherms of the three commercial reducing agents and of the pyrolysis solids obtained from olives and eucalyptus samples at 750 °C and 3 °C·min
−1. It has to be mentioned that although it is not clearly visible (due to the scale) the commercial reducers isotherms are also Type I, which is typical of microporous materials. However, as might have been expected, according to the surface area data, the commercial reducers’ curves are much lower than those of the bioreducers.
Figure 5.
CO2 adsorption isotherms of commercial reducers and olives and eucalyptus bioreducers (obtained at 750 °C and 3 °C·min−1).
Figure 5.
CO2 adsorption isotherms of commercial reducers and olives and eucalyptus bioreducers (obtained at 750 °C and 3 °C·min−1).
The pore size distributions of the bioreducers and the commercial reducing agents calculated by the NL-DFT method are presented in
Figure 6. It can be seen that there are important differences between the curves that correspond to the commercial reducers and the pore size distribution of the bioreducers. First of all, the amount of pore of each size is much smaller in the commercial reducers than in the bioreducers. It has to be born in mind that the
y-axis scale is about 10 times lower in the commercial reducers’ graphs than in the bioreducers’ graphs.
Figure 6.
Pore size distribution of commercial reducers and olives and eucalyptus bioreducers (obtained at 750 °C and 3 °C·min−1). (a) Olives; (b) Metallurgical coke; (c) Eucalyptus; (d) Petroleum coke; (e) Anthracite.
Figure 6.
Pore size distribution of commercial reducers and olives and eucalyptus bioreducers (obtained at 750 °C and 3 °C·min−1). (a) Olives; (b) Metallurgical coke; (c) Eucalyptus; (d) Petroleum coke; (e) Anthracite.
To summarize, the main conclusion concerning the comparison of the bioreducers with the commercial reducing agents is that, although in terms of composition (proximate and ultimate analyses) both types of reducing agents are quite similar, or even better, the bioreducers, in terms of surface area and porosity, are very different, and this brings about, as will be seen in the following section, different reactivity behaviors.
3.3. Reactivity
The reactivity experiments carried out were classified in the following three groups:
Reactivity tests with the three commercial reducers (metallurgical coke, petroleum coke, and anthracite) using 50 g of sample and 1375 mL·min−1 of CO2 flow.
Reactivity tests with metallurgical coke using different amounts of sample and two CO2 flow ratios (1375 mL·min−1 and 750 mL·min−1).
Reactivity tests with the two bioreducers (olives and eucalyptus) using 30 g of sample and 750 mL·min−1 of CO2 flow.
The reasons for performing these three sets of experiments as well as the results obtained are explained in the following section.
3.3.1. Reactivity Tests with the Commercial Reducers
The objective of this first set of reactivity tests was to determine the reactivity behavior of the reducing agents used and provided by Befesa Zinc Aser S.A. (metallurgical coke, petroleum coke, and anthracite). As has been mentioned in
Section 2.2.2 the reactivity tests were performed based on the ASTM D 5341-99 standard but with a smaller amount of sample. In this first set of tests, 50 g of sample and 1375 mL·min
−1 CO
2 flow were used, which are proportional to the specifications of the ASTM standard.
The results obtained of both, CRI and R factor, are presented in
Table 9. It can be seen that the metallurgical coke and anthracite have similar reactivities according to both, their CRI and R factor, while both parameters are significantly lower for the petroleum coke. Agirre,
et al. [
30] have reported CRI and R values for a typical commercial petroleum coke (13.7% and 16.5%, respectively) which are comparable but somewhat lower than those obtained in this study (16.5% and 20.0%, respectively). Other authors have also observed that petroleum cokes have lower reactivities than metallurgical cokes [
38]. It has been reported that this may be because petroleum coke has somewhat more crystalline structures which are less reactive [
39].
Table 9.
Reactivity results of commercial reducing agents (50 g and 1375 mL·min−1 CO2).
Table 9.
Reactivity results of commercial reducing agents (50 g and 1375 mL·min−1 CO2).
| | Metallurgical Coke | Petroleum Coke | Anthracite |
|---|
| CRI (%) | 30.9 ± 0.1 | 16.5 ± 0.2 | 31.6 ± 0.7 |
| R factor (%) | 47.4 ± 1.8 | 20.0 ± 0.1 | 47.4 ± 0.6 |
After this first set of reactivity tests, it was attempted to determine the reactivity of the pyrolysis solids. However, due to the lower apparent density of these solids (0.45 g cm−3 for olives and 0.42 g·cm−3 for eucalyptus, compared to 1.11 for metallurgical coke, 0.72 for petroleum coke and 1.31 for anthracite), it was not possible to introduce 50 g of sample in the tubular reactor. Therefore, it was decided to carry out some experiments to investigate if the amount of sample used could have an influence on the results obtained on the reactivity tests. The results are presented in the following section.
3.3.2. Reactivity Tests of the Metallurgical Coke with Different Amounts of Sample and Different CO2 Flows
The CRI and
R factor obtained with the metallurgical coke using different amounts of sample and different CO
2 flows are presented in
Table 10.
Table 10.
Reactivity results of metallurgical coke.
Table 10.
Reactivity results of metallurgical coke.
| | 1375 mL·min−1 | 750 mL·min−1 |
|---|
| 50 g | 30 g | 15 g | 30 g |
|---|
| CRI (%) | 30.9 ± 0.1 | 43.5 ± 1.3 | 41.0 ± 2.0 | 34.5 ± 0.5 |
| R factor (%) | 47.4 ± 1.8 | 27.0 ± 0.4 | 9.8 ± 0.1 | 45.9 ± 1.2 |
The reactivity results obtained with 1375 mL·min−1 CO2 flow and with different amounts of sample show that the CRI index significantly increases when the amount of sample is reduced from 50 g to 30 g, but no further increase is observed from 30 g to 15 g. The explanation of this fact may be the following: the greater the amount of sample, the larger is the height occupied by it inside the tubular reactor; the CO2 stream is fed into the reactor through the bottom, therefore it starts reacting with the coke, and as it goes up through the char bed it is impoverished in CO2, leading to a lower reaction rate at the upper part of the reactor. This effect is not observed from the 15 g to the 30 g tests probably because with smaller column heights there is CO2 enough all through the column both with the 15 and the 30 g samples and therefore, the negative effect of increasing the amount of sample is not observed in this range.
Regarding the R factor, it clearly decreases when the amount of sample is reduced in the whole mass sample range. This was obviously the expected trend, since as less sample is used, less total CO is produced, and consequently, for the same CO2 flow, the CO/CO2 ratio is lower and therefore, the R factor as well.
Comparing the results obtained with 30 g of sample at the two different CO2 flows, it was observed that the CRI decreases while the R factor increases as the CO2 flow decreases. This was to be expected since, if there is less CO2 available for the same amount of sample, on the one hand, less coke reacts and therefore, the weight loss is smaller, and consequently the CRI decreases. On the other hand, since the CO2 concentration is much lower, even though less CO has been produced, the CO/CO2 ratio increases, and consequently, the R factor increases.
If the results obtained with 30 g and 750 mL·min−1 are compared with those obtained with 50 g and 1375 mL·min−1, it can be seen that they are quite similar, which is attributed to the fact that the amount of sample/CO2 flow ratio used in these two tests is quite similar (≈26).
Therefore, it has been demonstrated that in the reactivity tests the amount of sample used, plays a very important role, but that if the amount of sample/CO2 flow ratio is kept constant, the influence of the amount of sample can be neglected.
Therefore, the reactivity tests of the bioreducers, which are presented in the following section, were carried out with 30 g of sample and 750 mL·min−1 CO2 flow, so that they could be compared with the reactivity tests of the commercial reducers carried out with 50 g and 1375 mL·min−1 CO2.
3.3.3. Reactivity Tests with the Bioreducers
The results of the reactivity tests of the pyrolysis solids (olives and eucalyptus) carried out using 30 g and 750 mL·min
−1 CO
2 are included in
Table 11. It has to be mentioned that the error of these measurements could not be determined in all cases due to the shortage of sample which made it impossible to repeat some of the tests. In those cases in which the errors were determined, the CRI error was in the range 1–3 and the
R factor error in the range 2–4.
Table 11.
Reactivity results of pyrolysis bioreducers (750 °C) (30 g and 750 mL·min−1 CO2).
Table 11.
Reactivity results of pyrolysis bioreducers (750 °C) (30 g and 750 mL·min−1 CO2).
| | Olives | Eucalyptus |
|---|
| 20 °C·min−1 | 15 °C·min−1 | 3 °C·min−1 | 3 °C·min−1 |
|---|
| CRI (%) | 87.8 | 86.8 | 86.1 | 93.7 |
| R factor (%) | 81.3 | 82.4 | 74.4 | 76.1 |
It can be seen that the reactivity of the bioreducers is very high. In the case of the olives sample, the CRI values are around 87% therefore only 13% of the initial mass has not reacted in the reactivity test. Taking into account that the ash contents of the olive derived bioreducers is close to 10% (
Table 5) it can be concluded that the sample has almost completely reacted with CO
2. The same happens in the case of the eucalyptus derived bioreducer: the CRI value is as high as 94% when it has an ash content of 5.4%. Therefore, the values in
Table 11 can be considered to be the maximum achievable reactivities. Burhenne,
et al. [
29] also obtained almost 100% reactivity of spruce wood derived char in tests carried out both in TGA at 800 °C for 3–5 h and in a fixed bed reactor at 800 °C for 30 min. For this reason, a discussion of the influence of the heating rate or type of sample on the reactivity of the bioreducers obtained in this study does not deserve attention.
Comparing
Table 9 and
Table 11 it can be seen that the reactivity of bioreducers is far higher than that of the commercial reducers. This may be attributed to the fact that the surface areas of the commercial reducers are much lower (24–156 m
2·g
−1) than those of the bioreducers derived from olives and eucalyptus samples (363–501 m
2·g
−1). Huo,
et al. [
33] also obtained much higher reactivities of bioreducers than of petroleum coke or anthracite, and they also reported that there was a relationship between reactivity and surface area.
On the contrary, bioreducers obtained by pyrolysis of fruit tree cuttings at 900 °C by Agirre,
et al. [
30], have CRI values in the range of 20%–50% and
R factor 35%–70%, both values much lower than those obtained in this study, and comparable to those of commercial reducing agents. There are several reasons to explain these differences: (1) on the one hand, the equipment used for reactivity measurements by Agirre,
et al., is very different from the one used in this study; it is a horizontal tubular furnace and the sample is placed in a crucible inside the reactor, therefore the CO
2 stream is only in contact with the upper surface of the sample, while in this study a vertical reactor is used, and therefore the CO
2 stream goes through the whole bioreducer bed; (2) the reaction time once reached at the reaction temperature (1000 °C) used by Agirre,
et al., was only 15 min instead of 2 h which is the time specified in the ASTM D 5341-99 and the one used in the reactivity tests of this study; (3) the particle size used by Agirre,
et al., (4–5 cm) was larger than that used in this study (1 cm); (4) the type of original biomass from which bioreducers were derived was different (fruit tree cuttings
vs. olive tree cuttings and eucalyptus); this fact, although less influential than the previous ones, may also be of importance.
In view of the characteristics of the olive and eucalyptus derived bioreducers and in order to analyze their suitability for metallurgical processes, it is worth mentioning that there are three roles that coke plays in metallurgical processes: (1) it has to provide heat or energy; (2) it has to provide a reducing atmosphere by means of the reaction: ; (3) it has to act as a support medium for the burden if the process is carried out in a blast furnace.
The first two requirements are well fulfilled by the bioreducers obtained in this study; they have rather high heating values (≈30 MJ·kg−1) and they are fully reactive. However, bioreducers cannot fulfill the third requirement, and therefore, due to their missing strength and high reactivity, cannot be used in blast furnaces as support medium, but they can be used tuyére-injected in the lower part of the blast furnaces to substitute typically used fossil fuels (pulverized carbon, oils, natural gas). On the other hand, bioreducers can also be used in the non-ferrous metal industry since no mechanical strength is required, because rotary kilns, where the burden is mixed and rotates with the coke, are frequently used.
Nevertheless, the final decision to determine the suitability of bioreducers for the non-ferrous metallurgical industry depends on the specific characteristics of the process itself. Metal reduction experiments should be carried out with the bioreducers in order to determine if the high reactivities could be a handicap for the process, but such kind of experiments were beyond the scope of this paper. However, it has been reported in the literature, experiments on the reduction of electric arc furnace dusts carried out with charcoal which show that with bioreducers higher zinc volatilization and iron oxide reduction can be achieved in comparison to those obtained with the fossil cokes normally used in industry [
15].


 ,
, 