1. Introduction
Electrical fires are among the main causes of building fires. Often, there is nothing but ash and noncombustible materials, such as metals, left at a fire scene. The critical evidence for a fire investigator to identify an electrical fire caused by a short circuit is the presence of “arc beads”, which are melted marks found at a fire scene. Such melted marks, which might be found anywhere at a fire scene, are divided into two categories: fire-melted marks (FMMs) and electric-melted marks (EMMs). The EMMs can be further divided into fire-causing arc beads (FCABs) and fire-resulting arc beads (FRABs). An FMM is a mark of an electrical wire melted as a result of the heat of the flames at a fire scene. An EMM is a melted mark formed when a huge short-circuit current surges through an electrical wire. An FCAB is a melted mark resulting from the initial short circuit that caused the fire. An FRAB is a melted mark from a short circuit that occurred on the electrical wire after the wire insulation had been burned off by the flames.
Therefore, a short circuit can cause a fire, and the fire can reciprocally enhance the damage of the short circuit. Many short-circuit arc beads might be found after a fire. It is necessary to verify whether these arc beads are FCABs or FRABs. An FMM is a large mark in the shape of a burnt melted drop; an FCAB is a much glossier and finer bead; and an FRAB is a non-glossy rough bead [
1]. The differences between an FMM and an EMM can be distinguished easily by comparing the melted ranges and shapes, but distinguishing between an FCAB and an FRAB can be difficult. Fire investigators in fire departments typically attempt to identify melted marks through visual inspection with reference to the literature [
1], even though the resolution of the human eyes is only approximately 62.5 μm and macroscopic comparison can be quite subjective. Identification based on visual observation of the size and color of an arc bead remains controversial.
Using scanning electron microscopy (SEM), Gray
et al. [
2] observed numerous square and rectangular pockmarks on FCABs. Erlandsson and Strand [
3] found copious voids in the cross sections of arc beads. A study by the Tokyo Fire Department revealed that even arc beads formed in the air at 1000 °C contained voids, albeit smaller and more likely to be near the surface of the FCAB. On the other hand, large voids have been observed deeper inside FRABs [
4]. Lee
et al. [
5] found that the spacing between the dendrite arms reflected the ambient temperature where the beads solidified; thus, the dendrite arm spacings of FCABs were smaller than those of FRABs.
The identification of arc beads remains controversial. Until now, there has been no scientific evidence regarding FCABs available for investigations [
6,
7]. Therefore, concrete scientific evidence still cannot be provided in judicial courts for cases related to electrical fires [
8]. Thus, the evidential power of the investigation affects the judicial prosecution, litigation, and judgment of fire cases. Because the public reliance on FCAB verification is also uncertain, urgent issues must be addressed by fire agencies [
9].
In this study, we simulated the external environmental conditions required for the formation of FCABs; herein, we discuss their effects on the metallography of electrical wires based on materials science especially, solidification theory. We investigated the relationships among the primary spacing of dendrites (λ), the growth velocity (ν) and the temperature difference due to heat flow (∆Tt) of fire-causing samples at various wire diameters (D).
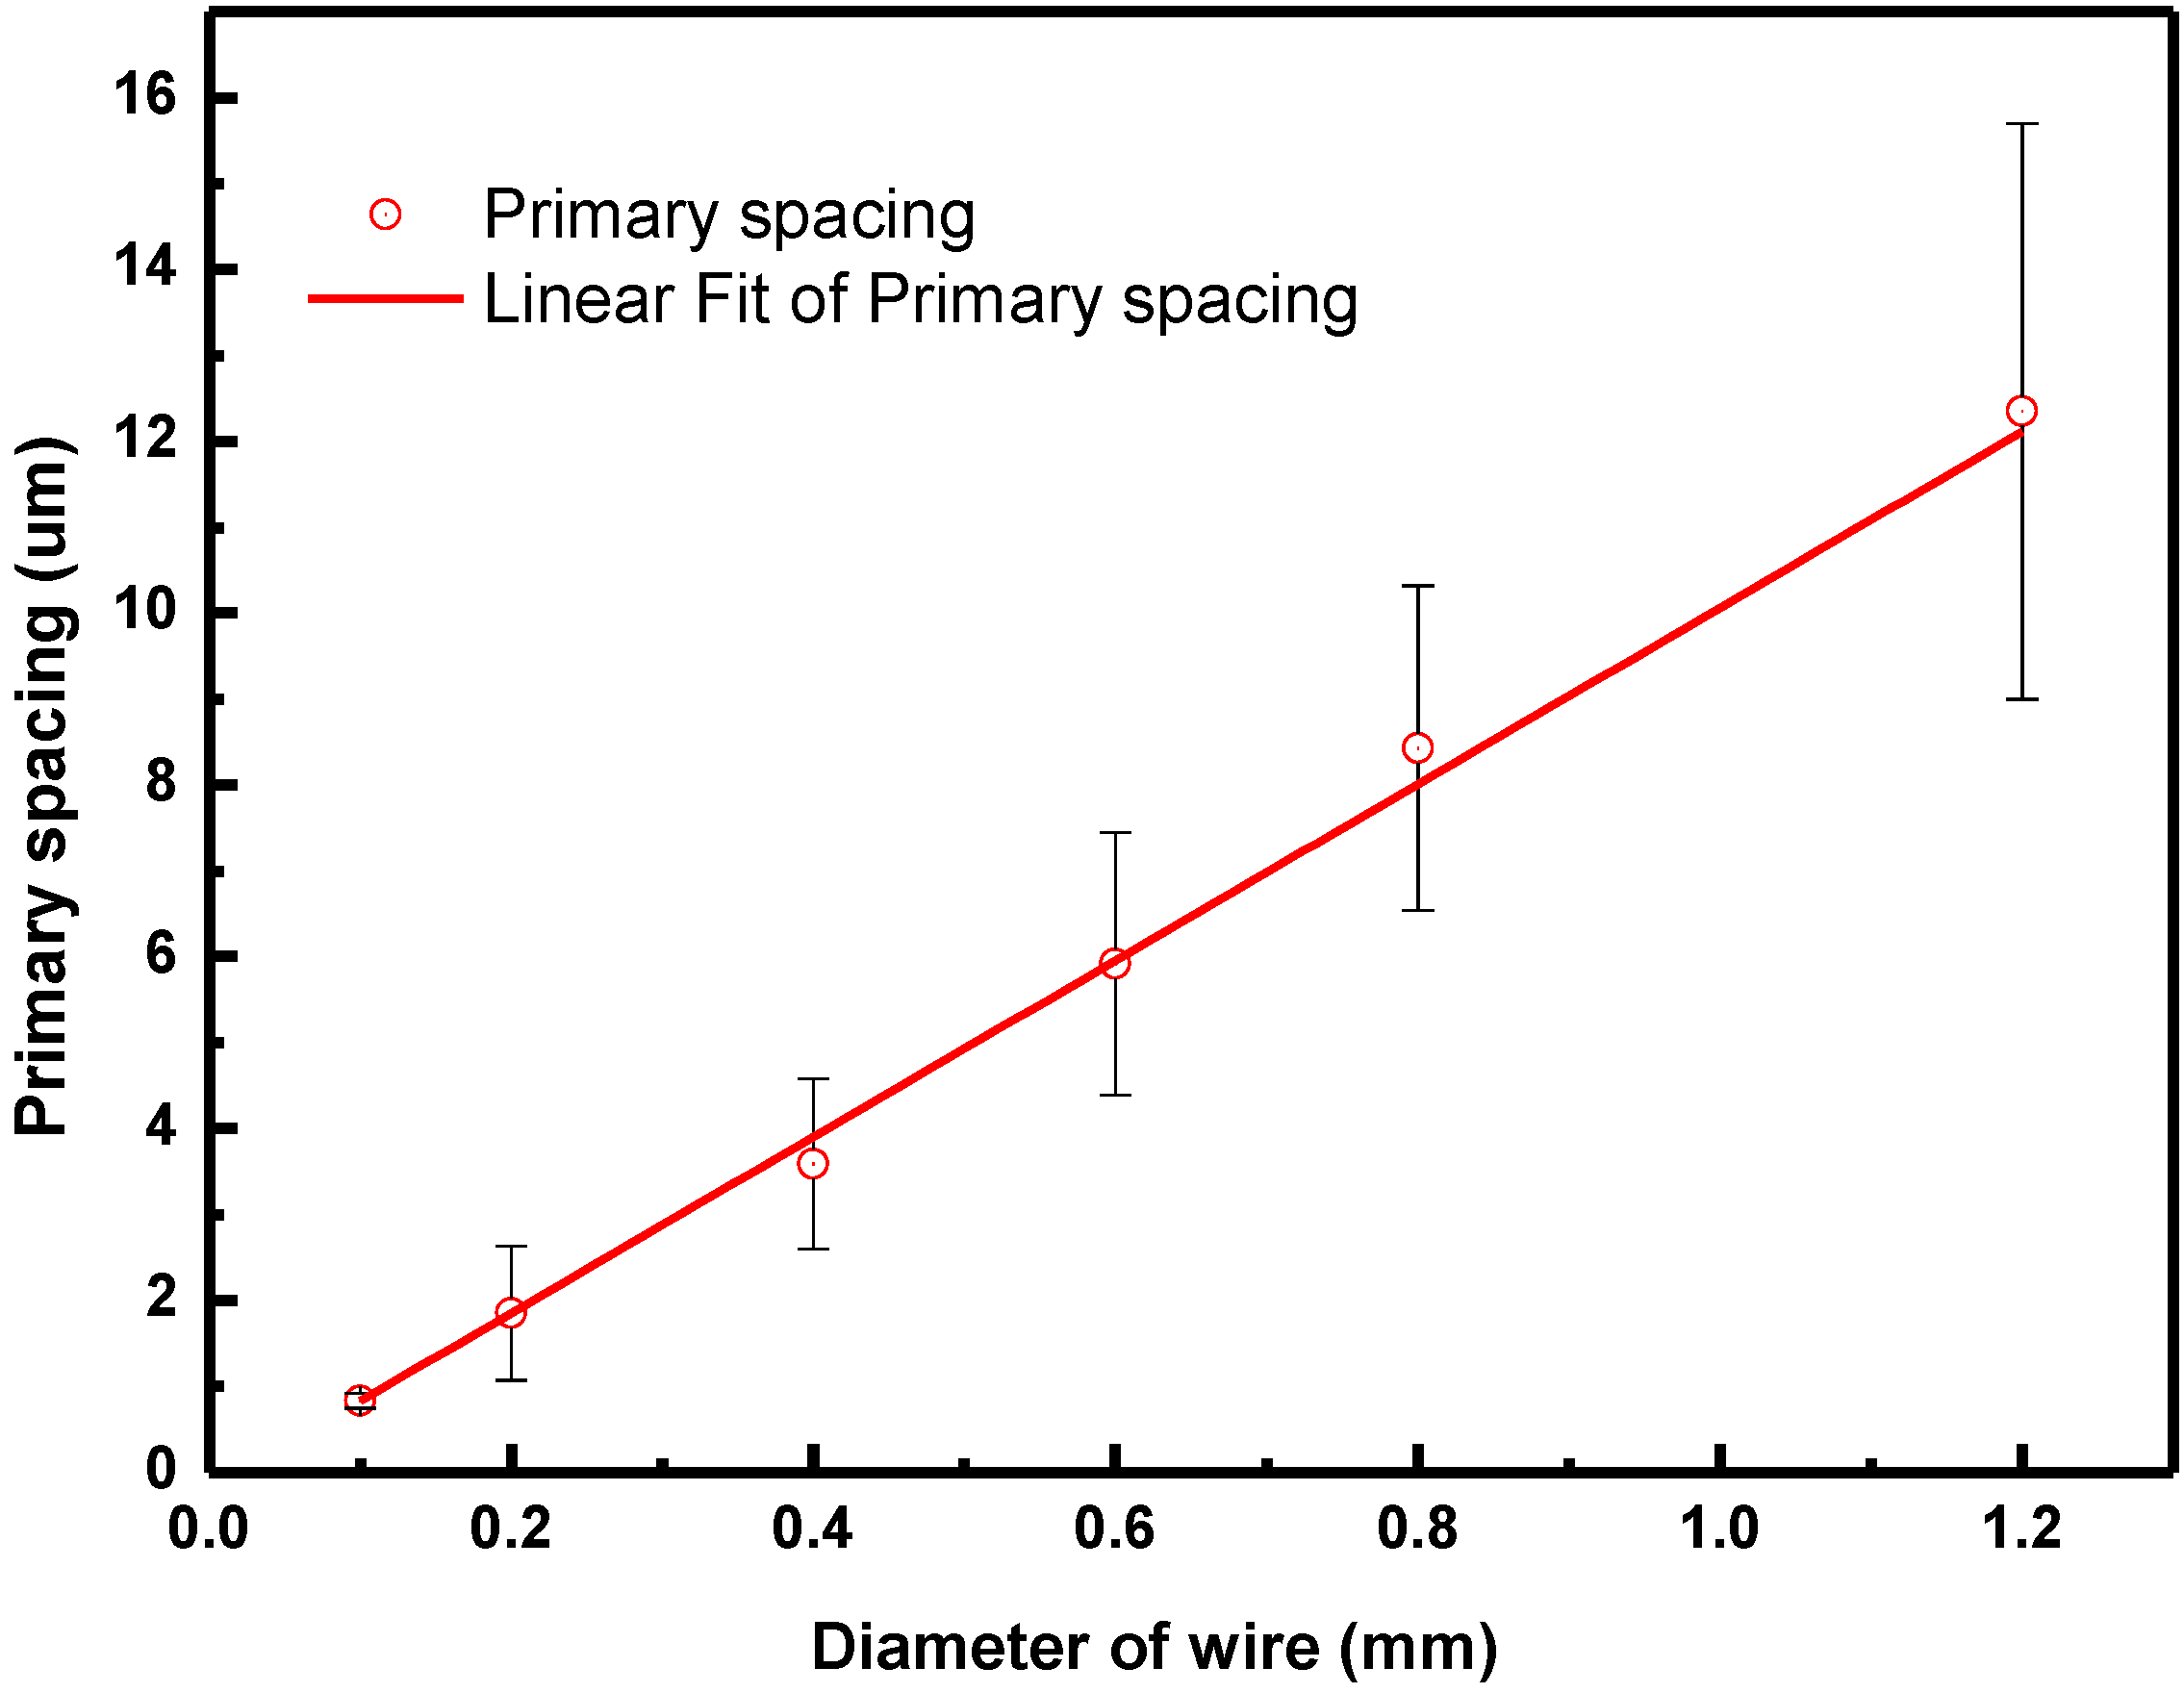
The primary spacing (λ) of thermal dendrites after the solidification process reflects the cooling rate of the melted metal. We determined the relationship between the wire diameter and the primary spacing of thermal dendrites to explore the effects of the steady-state growth-tip radius (RS), extremum radius (Re), growth velocity (ν), and the temperature difference due to heat flow (∆Tt) from the primary trunks of various thermal dendrites.
In this study, we used X-ray diffraction (XRD), focused ion beam (FIB), SEM, energy dispersive spectroscopy (EDS), and transmission electron microscopy (TEM), as well as corresponding mathematical models, to examine the microstructural constituents of FCABs. We believe that our results will improve the scientific basis for identifying FCABs. This microstructural study of FRABs is ongoing; we will provide comparisons of FCABs and FRABs in future studies.
3. Results
When copper electrical wires were short-circuited and blown out, the melted copper liquid formed arc beads and marks at the blown part of the wire under the effect of surface tension [
11].
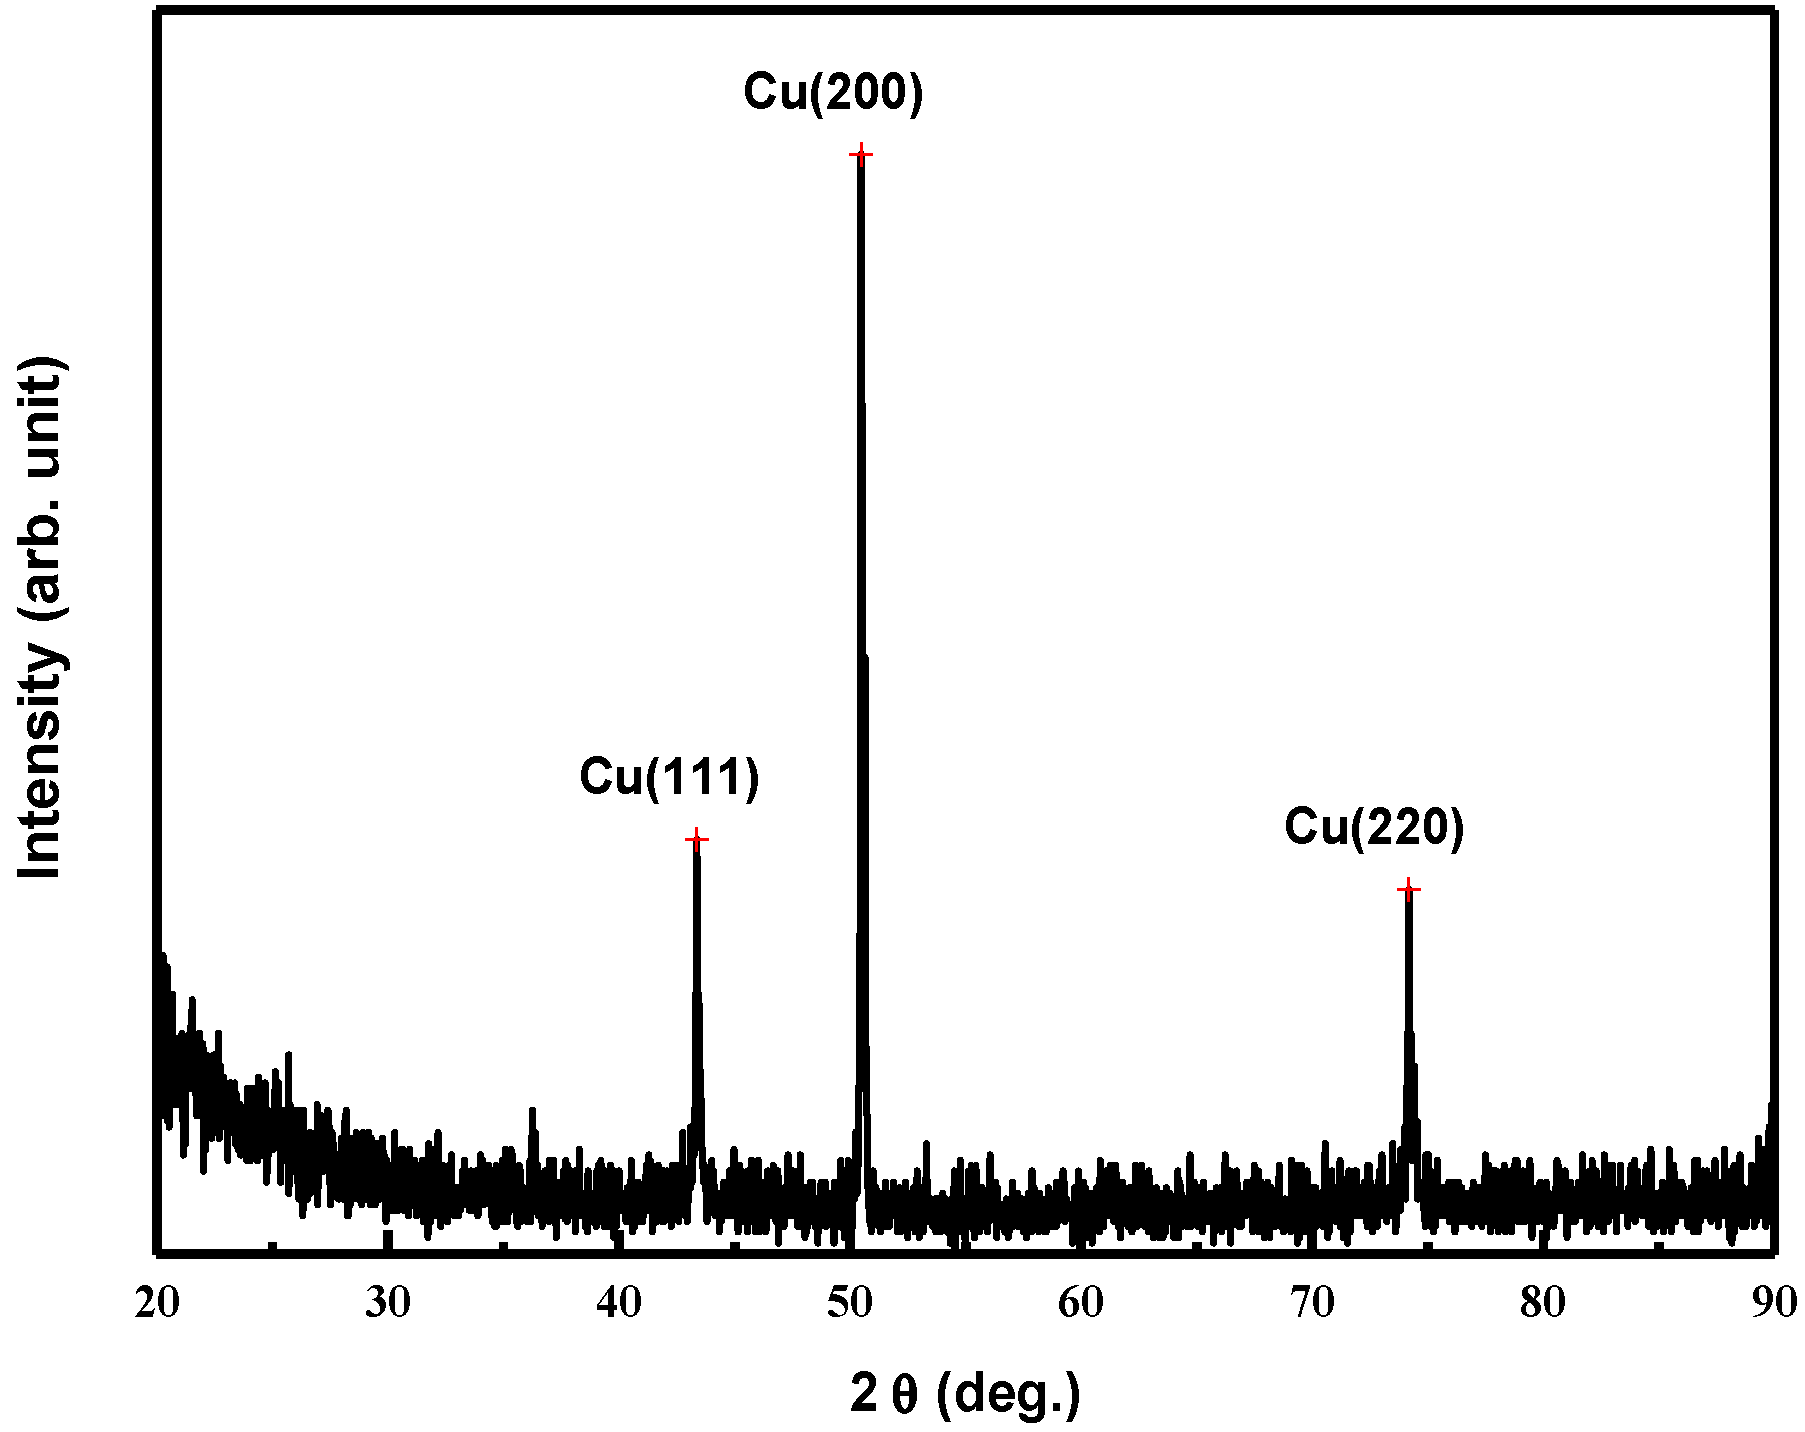
The XRD patterns of the arc bead samples (
Figure 2) revealed peaks at values of 2θ of 43.33°, 50.47°, and 74.20° representing the (111), (200), and (220) planes respectively, of pure copper. Because the growth rates of high-index planes with high surface energy were quicker than those of low-index planes in the solidified copper, the low-index planes of copper were left in the final solidification. The peak at a value of 2θ of 50.47° was the strongest, suggesting that the (200) plane was the preferred crystallographic plane.
Figure 2.
X-ray diffraction (XRD) analysis of the arc bead samples.
Figure 2.
X-ray diffraction (XRD) analysis of the arc bead samples.
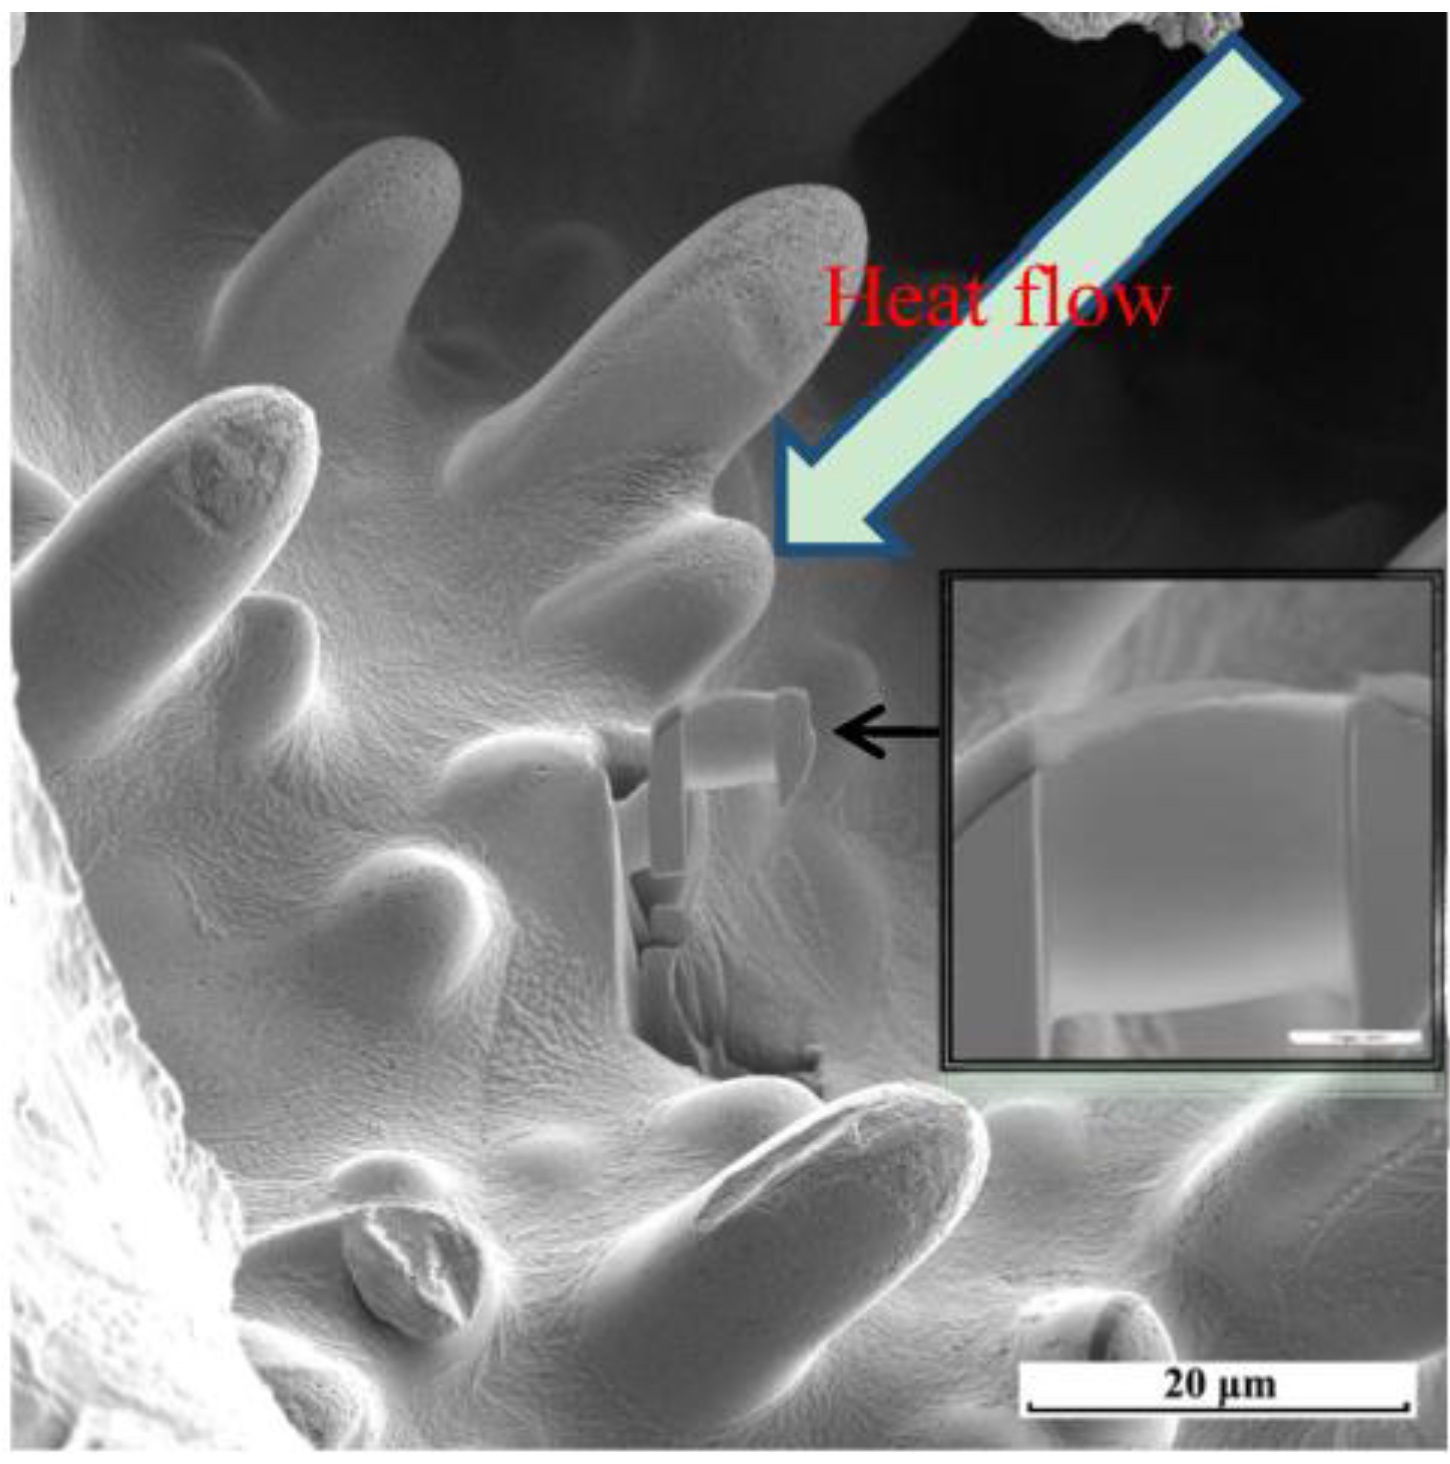
The surface morphologies of the arc bead samples exhibited the single-phase growth of primary dendritic crystals.
Figure 3 reveals that the primary dendrites possessed a non-faceted growth surface morphology, with outward growth derived from the unfused wire [
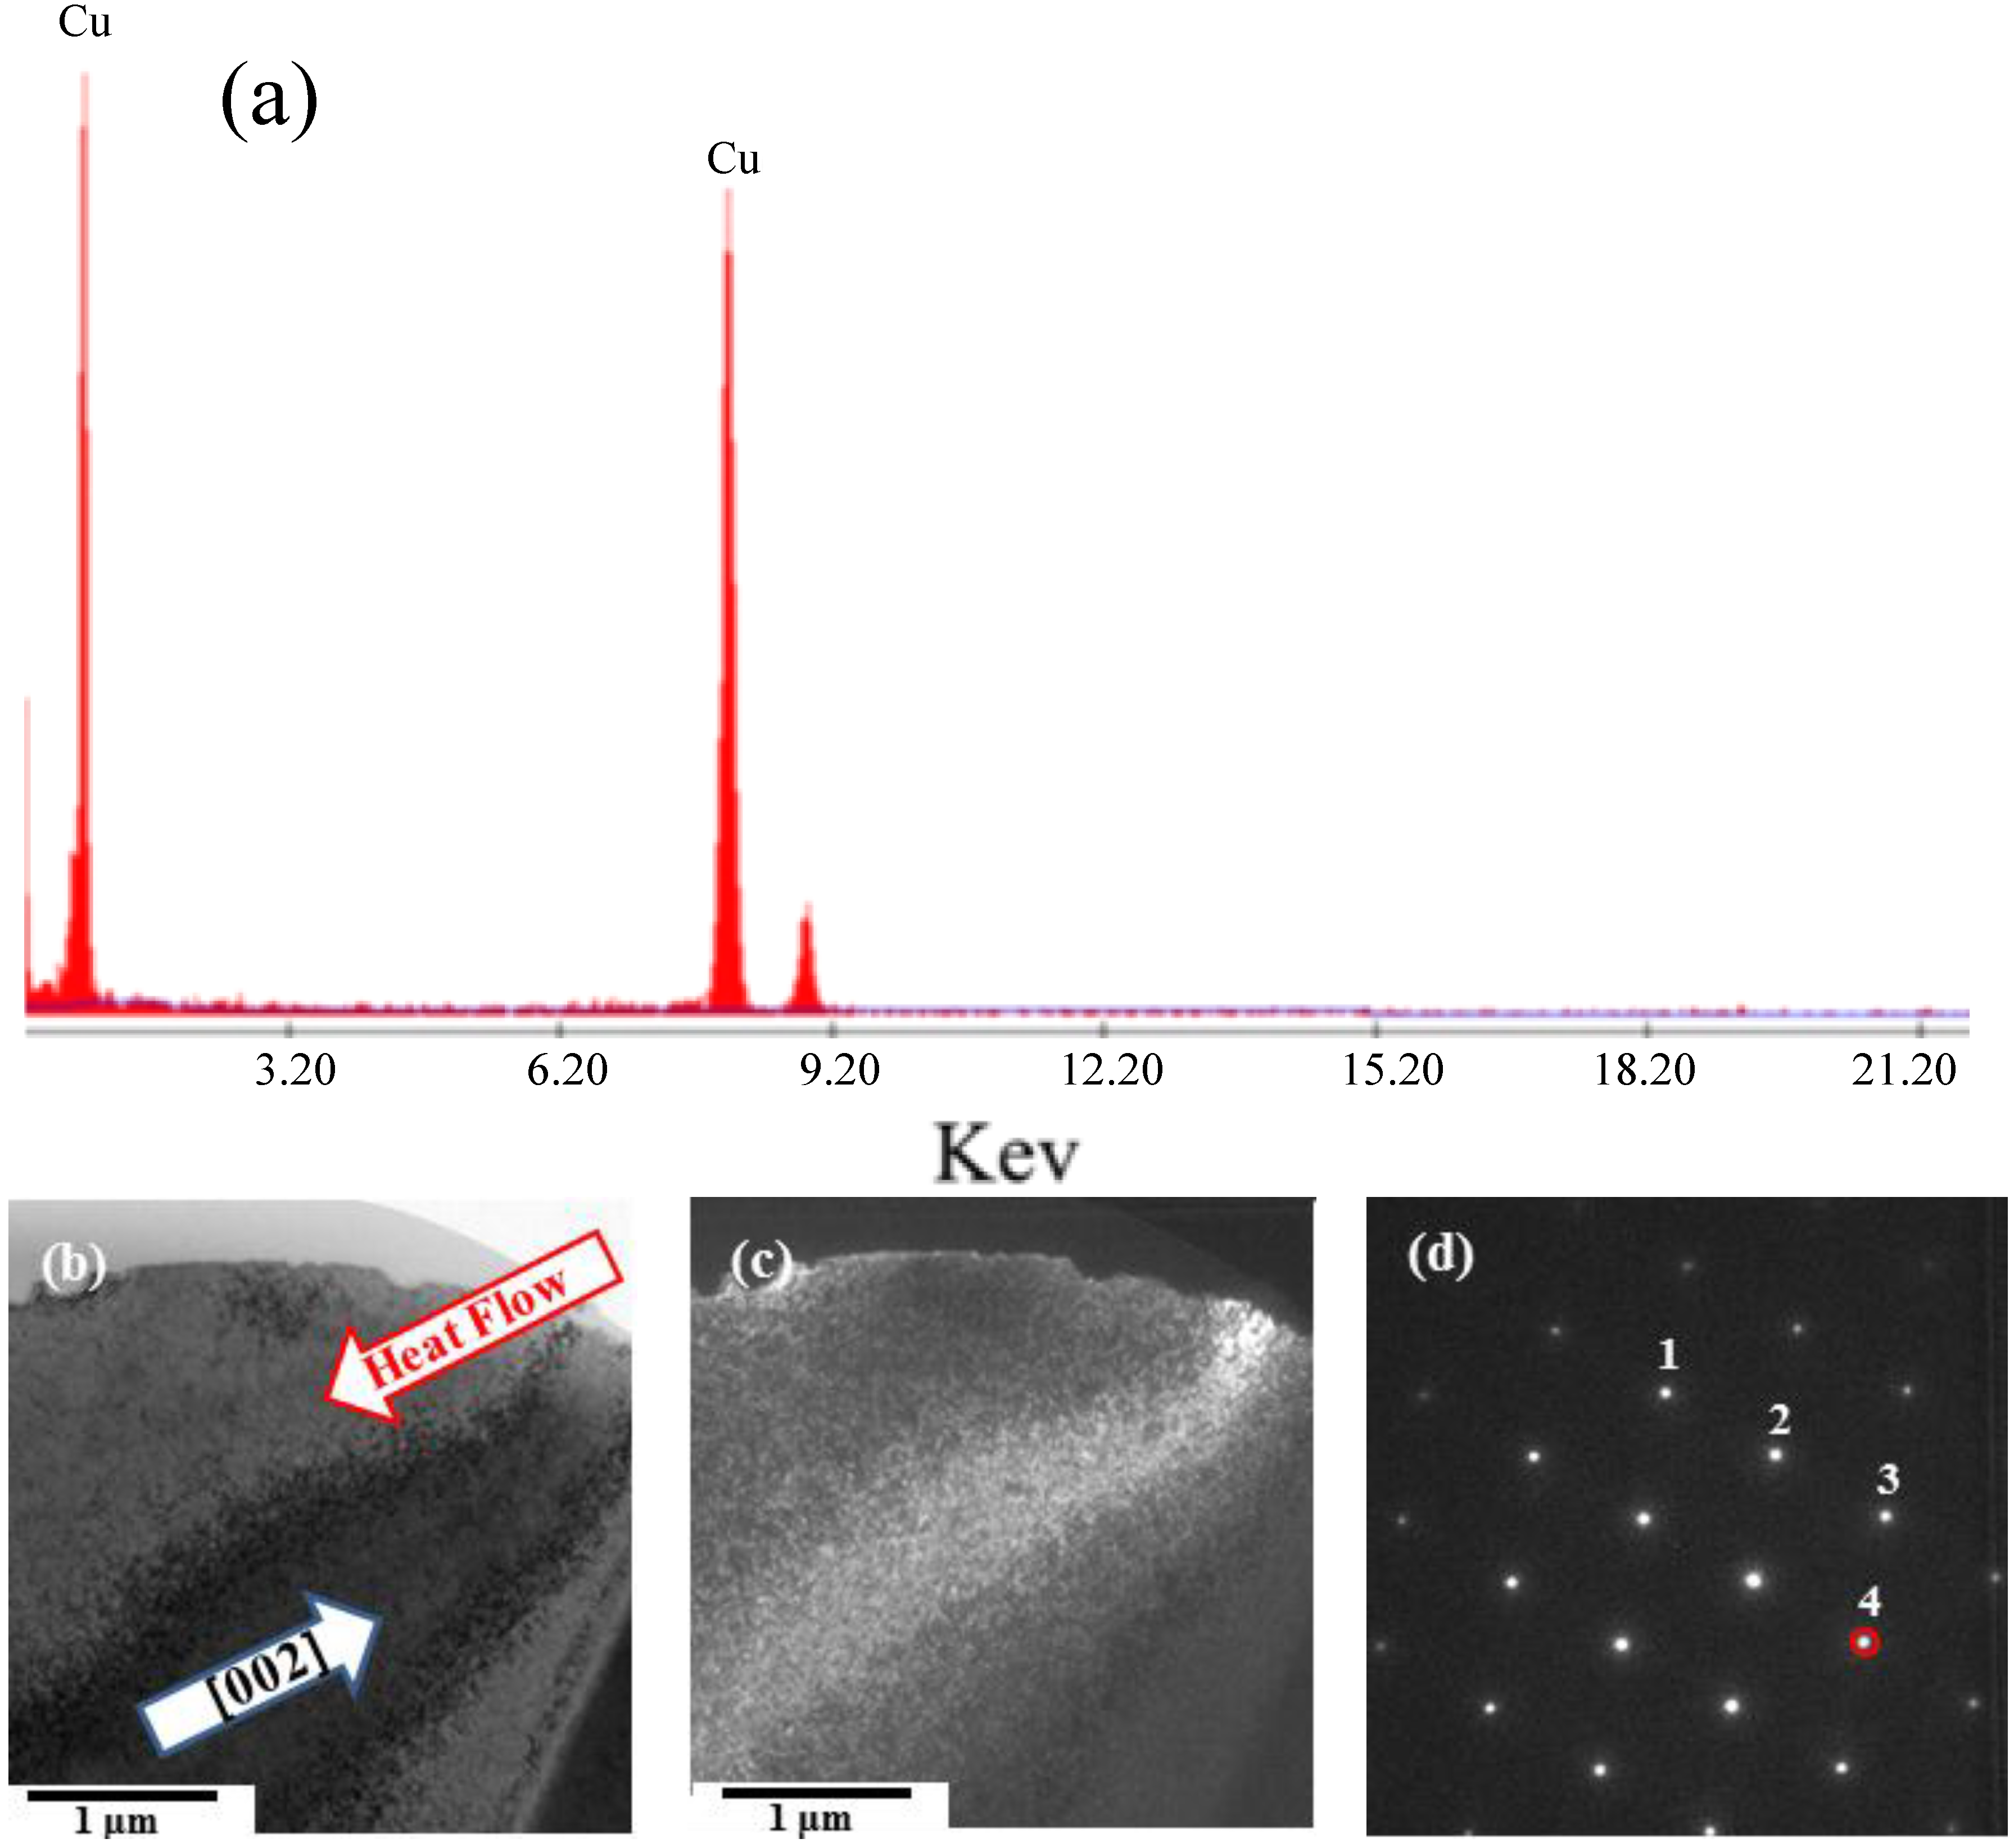
12]. We used a FIB for ion-bombardment cutting of the primary dendrite tips to prepare TEM specimens. The main element in the primary crystal specimens was copper (
Figure 4a). We employed electron diffraction through TEM for structural analysis of the primary crystal specimens (
Figures 4b–d), measuring the values of
L and θ from the diffraction pattern and calculating the corresponding plane indices (
hkl) from Equations (1)–(4). Matching the data from JCPDS cards to the interplanar spacing confirmed that the primary crystal was a copper phase with a face-centered cubic crystal structure and a lattice constant of 0.3615 nm (
Table 1).
Figure 3.
Microstructures of arc bead samples observed through focused ion beam SEM (FIB-SEM) and the sampling of a transmission electron microscopy (TEM) specimen.
Figure 3.
Microstructures of arc bead samples observed through focused ion beam SEM (FIB-SEM) and the sampling of a transmission electron microscopy (TEM) specimen.
Figure 4.
TEM analysis of primary crystallites: (a) energy dispersive spectroscopy (EDS) spectrum; (b) TEM bright-field image; (c) dark-field image and (d) diffraction pattern along the [01] direction.
Figure 4.
TEM analysis of primary crystallites: (a) energy dispersive spectroscopy (EDS) spectrum; (b) TEM bright-field image; (c) dark-field image and (d) diffraction pattern along the [01] direction.
Table 1.
Interplanar spacings of dendrite specimens calculated from the electron diffraction pattern.
Table 1.
Interplanar spacings of dendrite specimens calculated from the electron diffraction pattern.
| Spot | Calculated Interplanar Distance (Å) | Standard Interplanar Distance (Å) | Crystalline Plane (hkl) |
|---|
| 1 | 1.2728 | 1.2780 | |
| 2 | 2.0859 | 2.0880 | |
| 3 | 1.8034 | 1.8080 | |
| 4 | 2.0864 | 2.0880 | |
Although plate-like primary crystallites are often observed during solid-state precipitation, the primary crystallites in our present experiment grew into rod-like shapes. The conducting wire was a good thermal extracting material. Heat from the melted copper liquid was extracted into the super-cooled melt through a conduction effect; the solid-liquid interface generated a temperature inversion [
13,
14]. As the latent heat was released from the solid-liquid interface, the temperature at the interface became hotter than that on the liquid side. Therefore, an unstable interface appeared because the interface front produced a negative temperature gradient that led to part of the heat flowing toward the super-cooled liquid [
15]. When the crystallization of copper occurred toward the super-cooled liquid region, the primary dendrites crystallized rapidly in rod-like form, while the secondary branch cell body grew in the <001> preferred direction, out of the surface where the primary trunk contacted the super-cooled liquid. The latent heat released from the dendrite growth of the secondary branch increased the temperature of the liquid nearby obstructing the formation of other protruding interfaces [
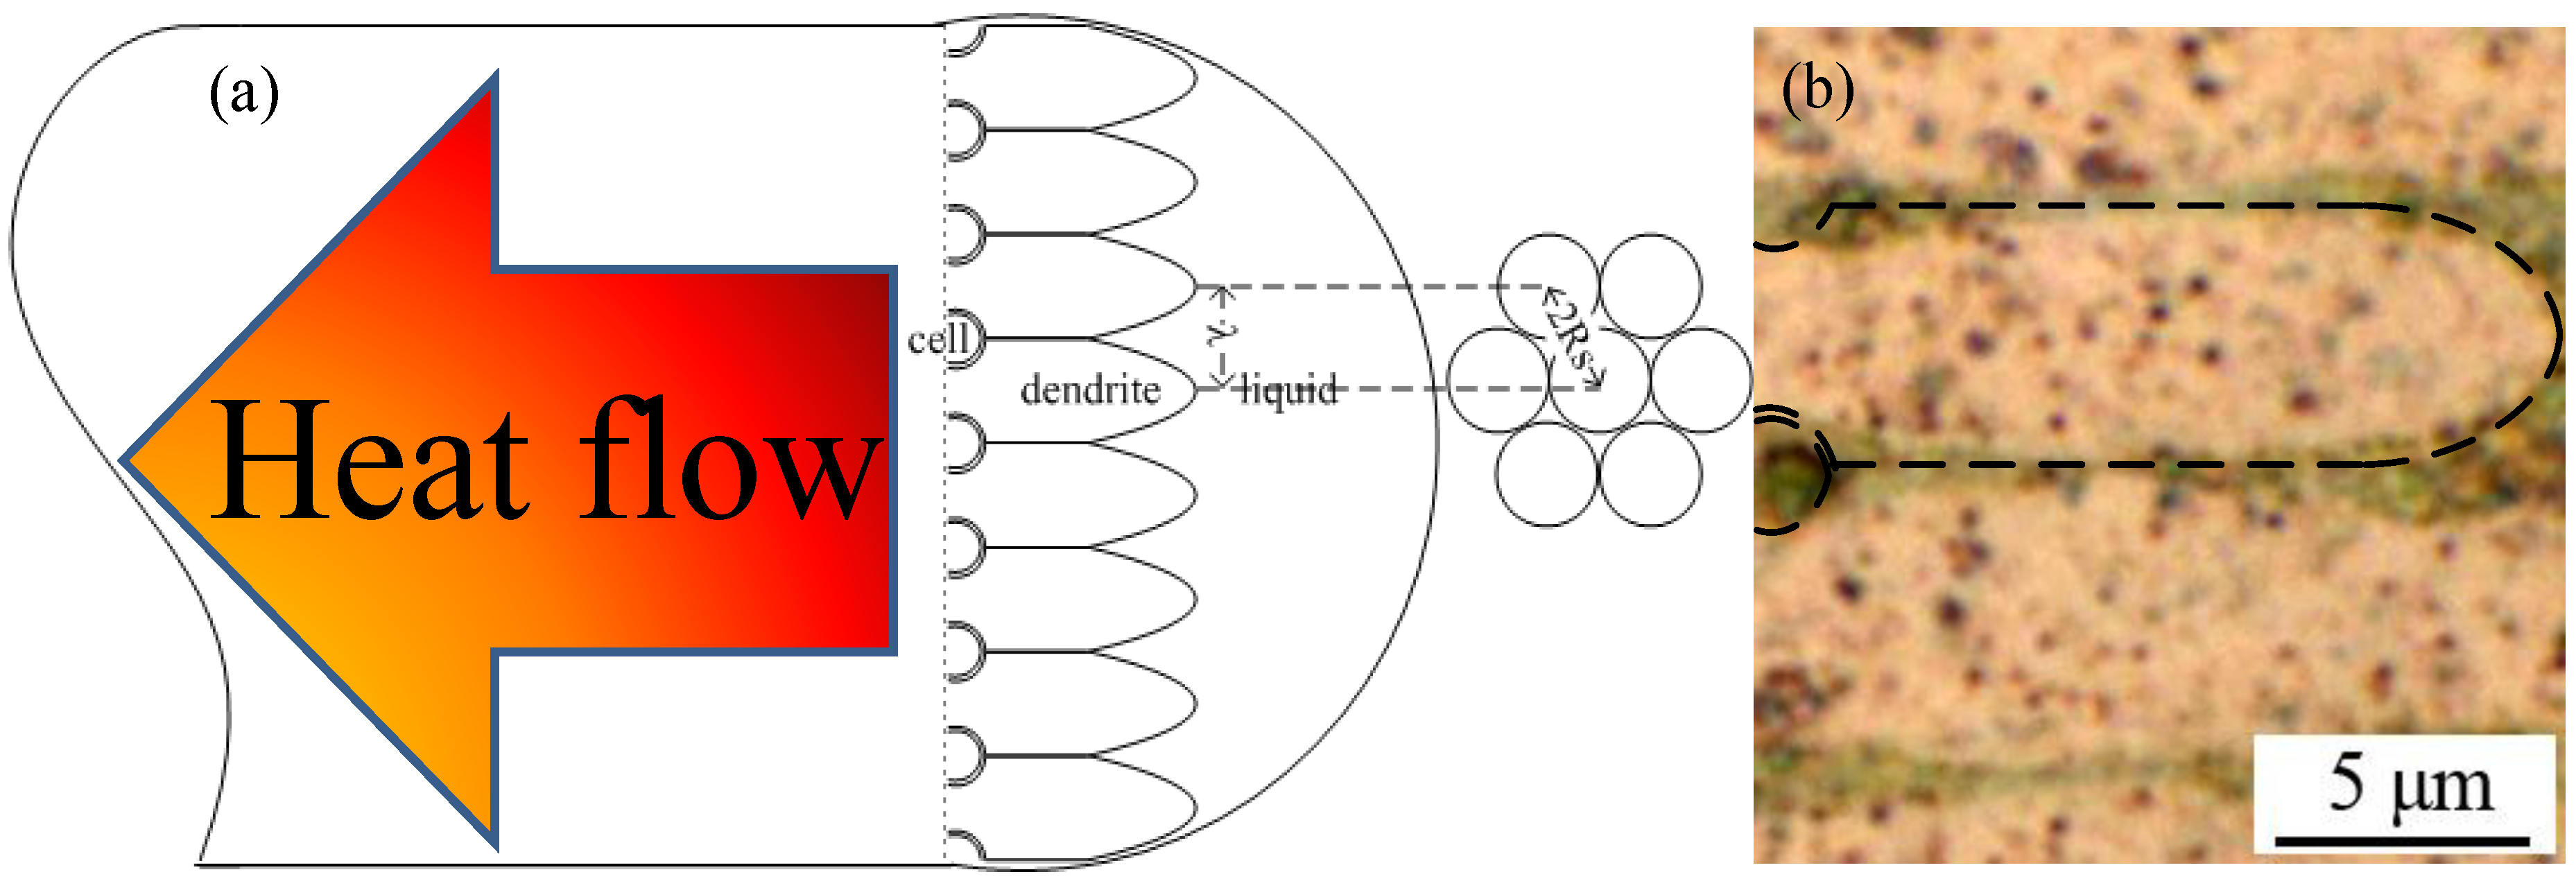
16]. As a result, the secondary branch dendrites competed with, and restricted, one another in terms of their growth. The direction anti-parallel to the heat flow became the dominant growth direction. Therefore, the primary trunks of the thermal dendrites grew in a parallel manner to form the columnar crystalline structure displayed in
Figure 5. The formation of thermal dendrites is the unique fingerprint of FCABs in the load-side wire.
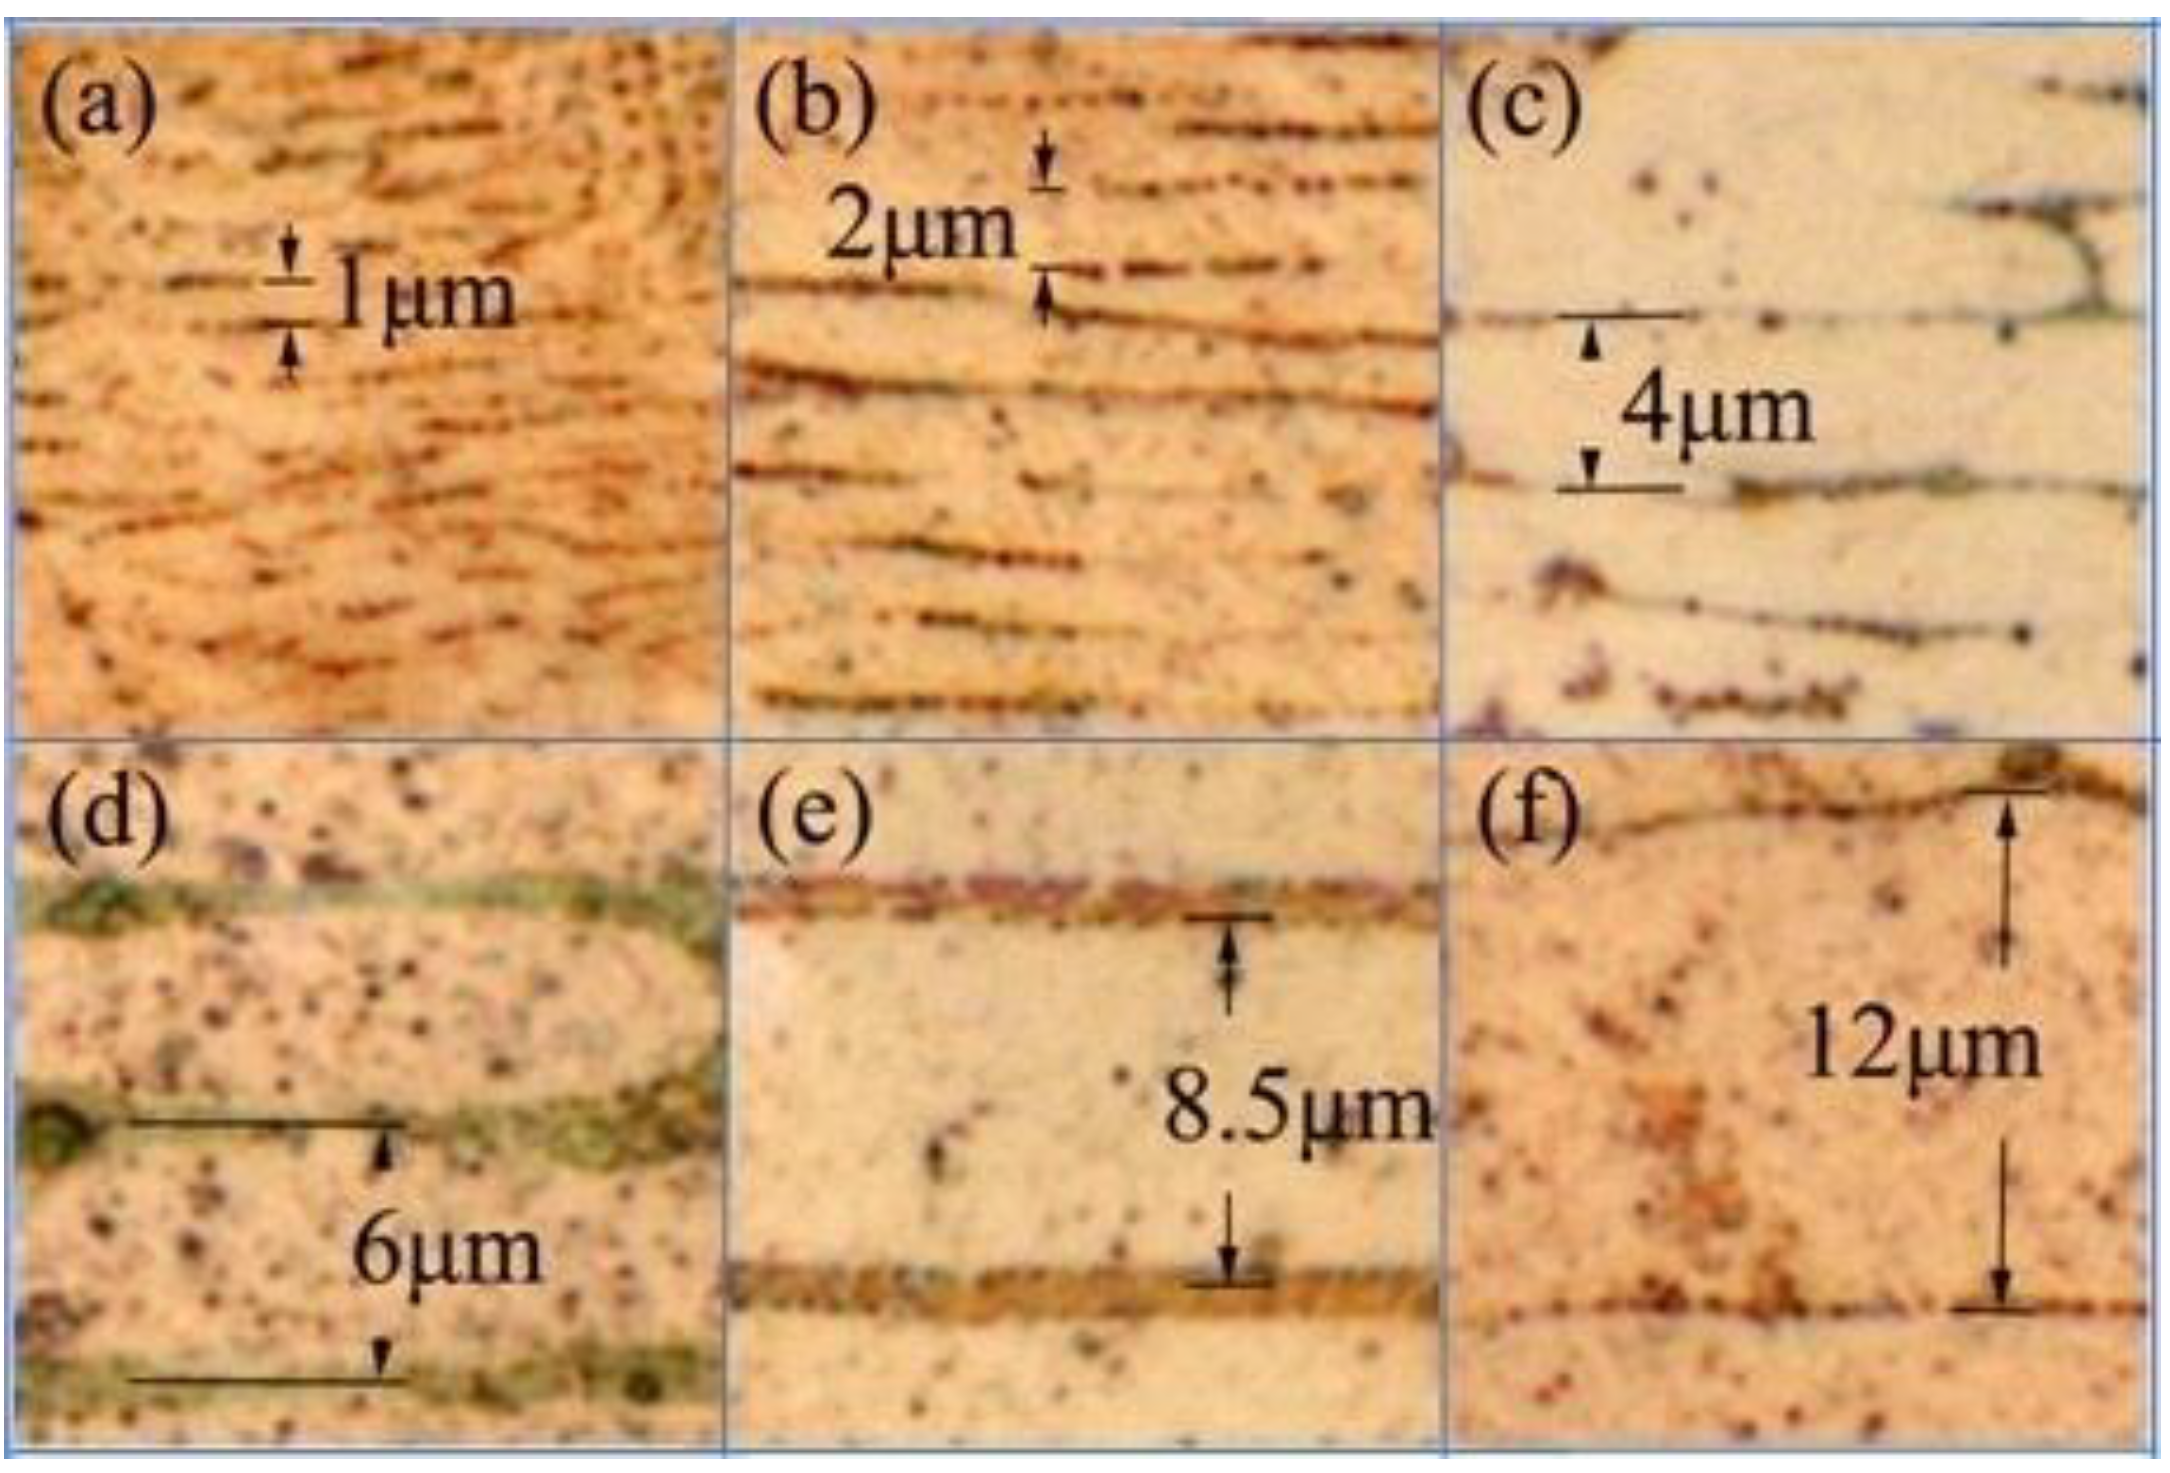
We repeated the short-circuit experiments 10 times for the wires of each diameter. The samples were obtained from two ends of the load-side wire at the short-circuit site. We used metallography to measure the values of λ of the FCABs at five sites for each sample as shown in
Figure 6. The sampling number,
N, was more than 100 for the FCABs at each wire diameter.
Table 2 lists the average value of λ of the FCABs at each diameter, λ
ɑve, and the standard deviations,
, are calculated.
Figure 5.
Growth of primary trunk of thermal dendrites in a melted bead (anti-parallel to the heat flow direction); (a) schematic diagram of the thermal dendrites; (b) metallographic photo of thermal dendrites in arc bead of 0.6mm wire.
Figure 5.
Growth of primary trunk of thermal dendrites in a melted bead (anti-parallel to the heat flow direction); (a) schematic diagram of the thermal dendrites; (b) metallographic photo of thermal dendrites in arc bead of 0.6mm wire.
Table 2.
Average primary spacings (λɑve), growth velocities (νs), and the temperature differences (∆TtS) of thermal dendrites of copper arc beads obtained from wires of various diameters.
Table 2.
Average primary spacings (λɑve), growth velocities (νs), and the temperature differences (∆TtS) of thermal dendrites of copper arc beads obtained from wires of various diameters.
| Parameter | Correspondind Datum |
|---|
| Diameter of Wire (mm) | 0.1 | 0.2 | 0.4 | 0.6 | 0.8 | 1.2 |
| λɑve (μm) | 0.83 ± 0.17 | 1.85 ± 0.36 | 3.59 ± 0.70 | 5.92 ± 0.95 | 8.43 ± 1.41 | 11.83 ± 1.61 |
| νs (μm/s) | 3.58 × 10⁶ | 8.95 × 10⁵ | 2.24 × 10⁵ | 9.94 × 10⁴ | 5.59 × 10⁴ | 2.48 × 10⁴ |
| ∆TtS (K) | 10.09 | 5.04 | 2.52 | 1.68 | 1.26 | 0.85 |
Figure 6.
Cross-sectional metallographic analyses of arc beads of copper wire with diameters of (a) 0.1, (b) 0.2, (c) 0.4, (d) 0.6, (e) 0.8, and (f) 1.2 mm.
Figure 6.
Cross-sectional metallographic analyses of arc beads of copper wire with diameters of (a) 0.1, (b) 0.2, (c) 0.4, (d) 0.6, (e) 0.8, and (f) 1.2 mm.
4. Discussion
Although the kinetics of atomic addition plays a key role in some materials, we assumed that the diffusion of atoms from the liquid phase to the crystalline phase was rapid so that the kinetics model could be neglected [
17,
18,
19,
20,
21,
22] because the dendrite morphologies clearly exhibited “non-faceted” growth.
Because heat diffusivity is much faster than mass diffusivity [
23], the solid-liquid interface of a pure metal will always be unstable if the temperature gradient is negative. Perturbations will grow if the temperature gradient is negative at the interface, resulting from the heat flux due to the temperature gradient (
G = d
T/d
z) [
24]. The total undercooling (∆
T0) of the melt is equal to the difference between
Tm (the melting point) and
Tl (the liquid temperature).
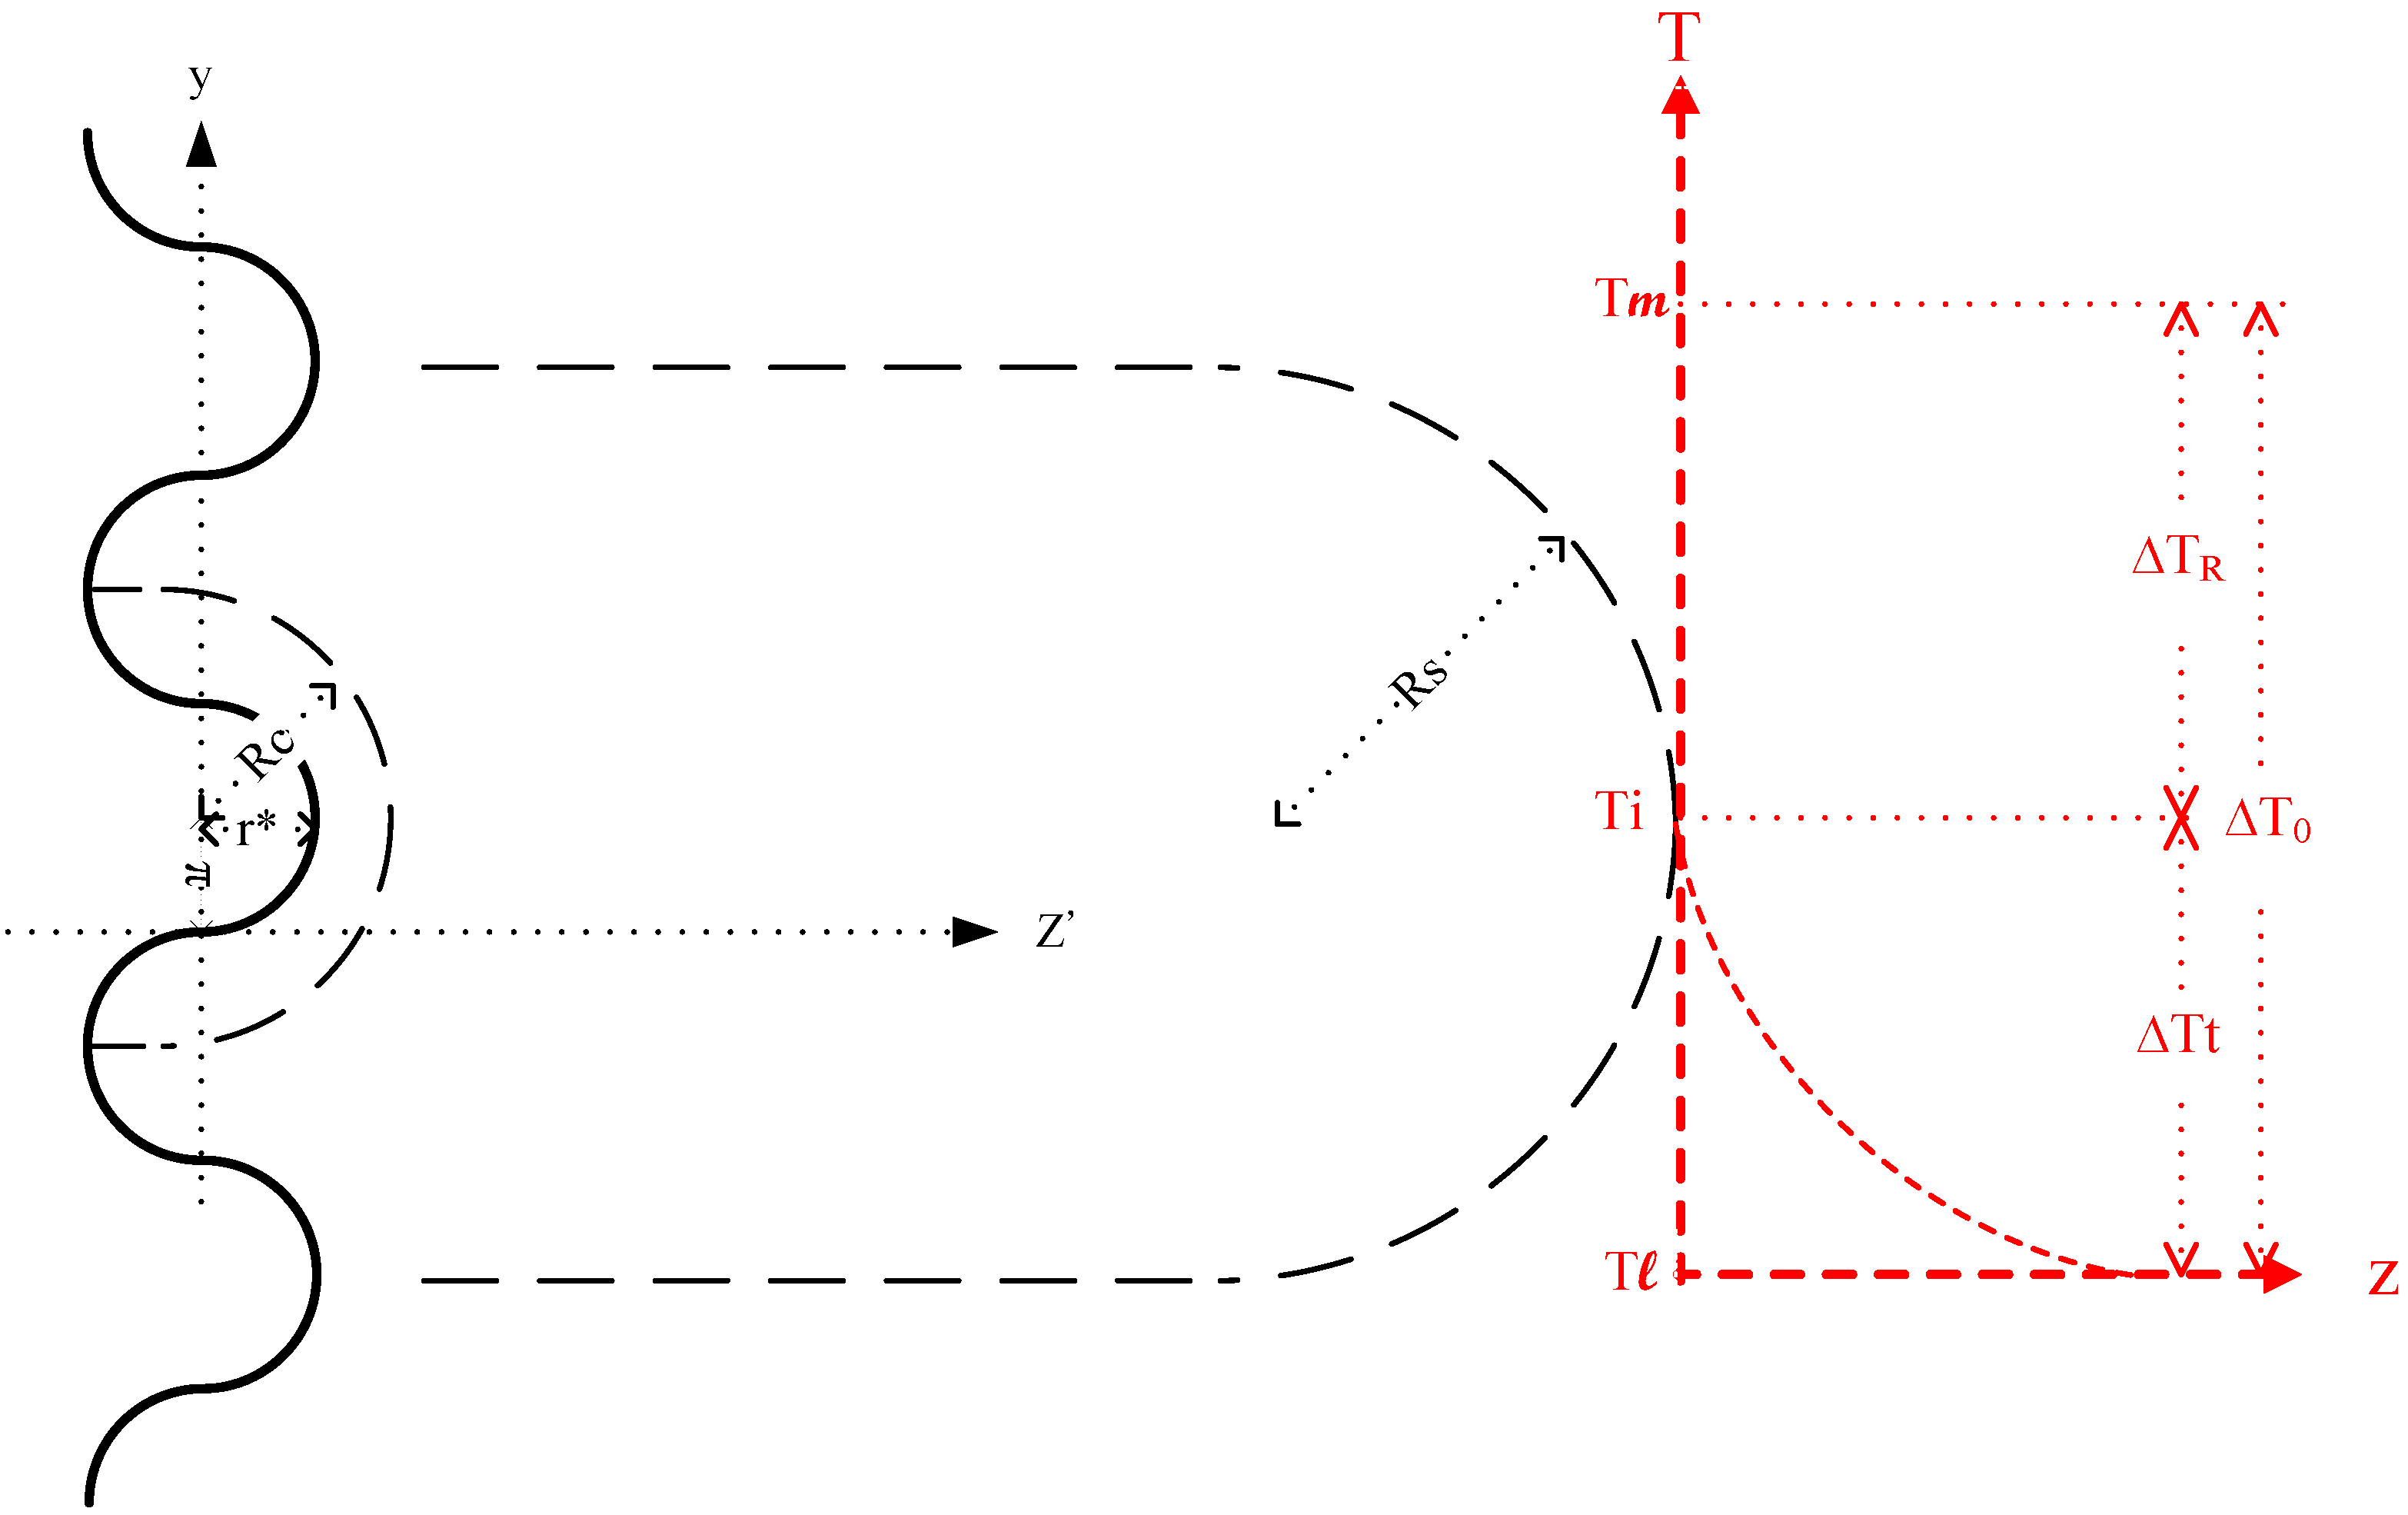
The perturbations have an infinitesimal critical amplitude
r*, a quarter wave length, which does not affect the diffusion fields. The perturbed interface can be described by a simple sine function (
Figure 7):
where ω = π/2
r* is the wave number.
The interface temperature
Ti can be deduced from the assumption of local equilibrium:
here
Ti equals the difference between the melting point (
Tm) and the curvature undercooling ∆
TR = Γ
K, where the Gibbs–Thomson coefficient (Γ
) is equal to γ∆
f/
Tm, and the curvature
K is
; γ is the interface energy and ∆
f is the latent heat.
The temperature difference between the tips (at point
t) and depressions (at point
d) of the interface is given by:
Figure 7.
Schematic representation of dendrite growth initiated by perturbation at the solid–liquid interface, and the corresponding temperature curve in front of the dendrite tip.
Figure 7.
Schematic representation of dendrite growth initiated by perturbation at the solid–liquid interface, and the corresponding temperature curve in front of the dendrite tip.
When a protrusion appears on the solid (
Figure 7), the negative temperature gradient in the liquid becomes even more negative. The advancing perturbations then continuously evolve into the cell, with the cell radius
Rc having twice the value of
r* at ∆
t0,
.
The tip growth at the cell is isothermal; the thermal diffusion equation in cylindrical coordinates at the solid-liquid interface of the growing tip can be written [
25,
26]:
a: thermal diffusivity; ∆Tt: the temperature difference due to heat flow.
The heat moving away from the interface through the liquid must balance the sum of the heat from the solidification and the latent heat generated at the interface:
ν: growth velocity; c: volumetric specific heat.
The cell grows continuously into dendrite, due to the temperature difference ∆Tt at the tips of the solid–liquid interface. From the Gibbs–Thomson effect, the equilibrium across the dendritic tip radius occurs at a curvature undercooling (∆TR) below the melting point Tm is given by .
The total undercooling of melt
equals the sum of the undercooling due to curvature (∆
TR) and the temperature difference from the heat flow (∆
Tt):
The growth of a thermal dendrite at marginal stability is given by
Rs: dendrite radius at marginal stability.
The primary trunk tip radius of thermal dendrite growth at marginal stability is obtained [
27,
28,
29,
30,
31]:
Gs: temperature gradient of dendritic tip at marginal stability; ∆Tts: temperature difference of dendritic tip at marginal stability due to heat flow.
Our experiment revealed the relationship between the wire diameter and the primary spacing of the thermal dendrite of the short-circuit arc bead samples, as illustrated in
Figure 8. From the microstructure, the
D–λ relationship between the wire diameter and the primary spacing of the thermal dendrite is obtained as follows:
Figure 8.
Relationship between the primary spacings of thermal dendrites and the diameter of the wire.
Figure 8.
Relationship between the primary spacings of thermal dendrites and the diameter of the wire.
Meanwhile, the stability limit of the thermal dendrite tip radius
Rs is proportional to λ. The proportionality constant depends on the geometrical arrangement of the dendrites grown in steady state. From the hexagonal arrangement in
Figure 5, it is likely that the last liquid solidifies at the gravity center of the equilateral triangle that is formed by the three densely packed dendrites [
31]. This assumption leads to the value of
A cylinder having a hemispherical tip (
Figure 7) growing along its axis is the simplest approximation that can be adapted to the growth of a dendrite tip [
32,
33]. The cross-section of the cylinder,
, determines the volume that grows in a time
and is responsible for the rejection of thermal heat. The surface area of the hemispherical cap,
, determines the amount of radial thermal diffusion. Thus, the flux due to thermal rejection
J1 equals the thermal diffusion in the liquid ahead of tip (
J2) which can be written by:
νs: growth velocity of thermal dendrite at marginal stability.
Under steady-state conditions, the heat flux balance must lead to the thermal Péclet numbers (
Pt) which are defined by the dimensionless ratio of the radius
R to the thermal-diffusion distance 2
a/ν at thermal diffusion-limited growth [
34,
35,
36,
37]:
Because the stability limit of the dendrite tip lies at a larger tip radius than that of the extremum, the capillarity effect can be neglected [
38,
39].
At marginal stability, the thermal supersaturation Ω can be defined as the ratio of the thermal undercooling to the unit undercooling (θ
t = ∆
f/c) The relationship defining the thermal diffusion at the tip for the marginally stable growth of a thermal dendrite is given by
. Thus, the temperature difference due to heat flow can be written as ∆
Tt =
Ptθ
t; the temperature difference due to the heat flow of dendrite growth at stability is obtained by
Combining Equations (6), (9), and (10) into Equation (5), the growth velocity and the radius of thermal dendrite growth at marginal stability are obtained respectively by
Table 2 lists the growth velocities (ν
s) of the thermal dendrites in the arc beads. The growth velocities of the thermal dendrites of the melted beads having diameters ranging from 0.1 to 1.2 mm are inversely proportional to the square of the wire diameter. That is, as the diameter of the wire increases, the growth velocity of the thermal dendrite decreases.
By combining Equations (9) and (12) into Equation (10), ∆
Tts is obtained:
As listed in
Table 2, the values of ∆
Tts due to the thermal dendrite growth of the melted beads having diameters from 0.1 to 1.2 mm are inversely proportional to the wire diameters. Thus, when the diameter of the wire increases, the value of ∆
Tts also decreases.
The extremum growth of a thermal dendrite is influenced by diffusion, capillarity effects, and the degree of thermal supersaturation (Ω). This thermal supersaturation is defined by the equation
The temperature difference ∆
Tte due to the heat flow of extremum growth is equal to Ω
eθ
t. The extremum of growth velocity (ν
e) is used to define the tip radius (
Re). The maximum velocity in an isothermal environment corresponds to a minimum in the total undercooling (∆
T0) for constant-velocity growth. Therefore, minimizing ∆
T0 will give the extremum radius (
Re) and the temperature difference due to heat flow (∆
Tte):
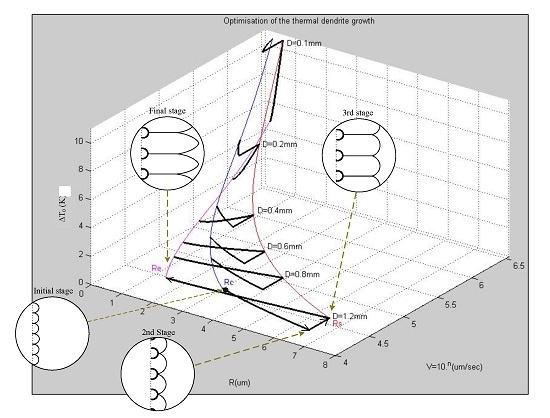
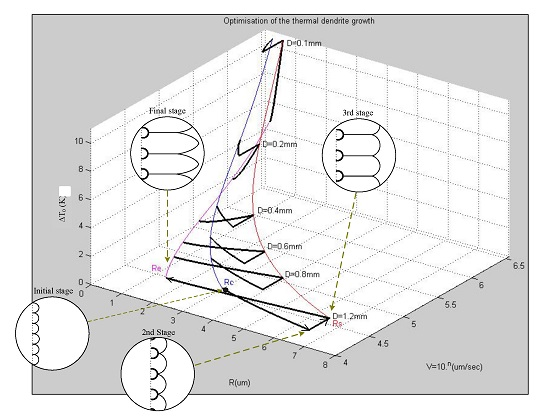
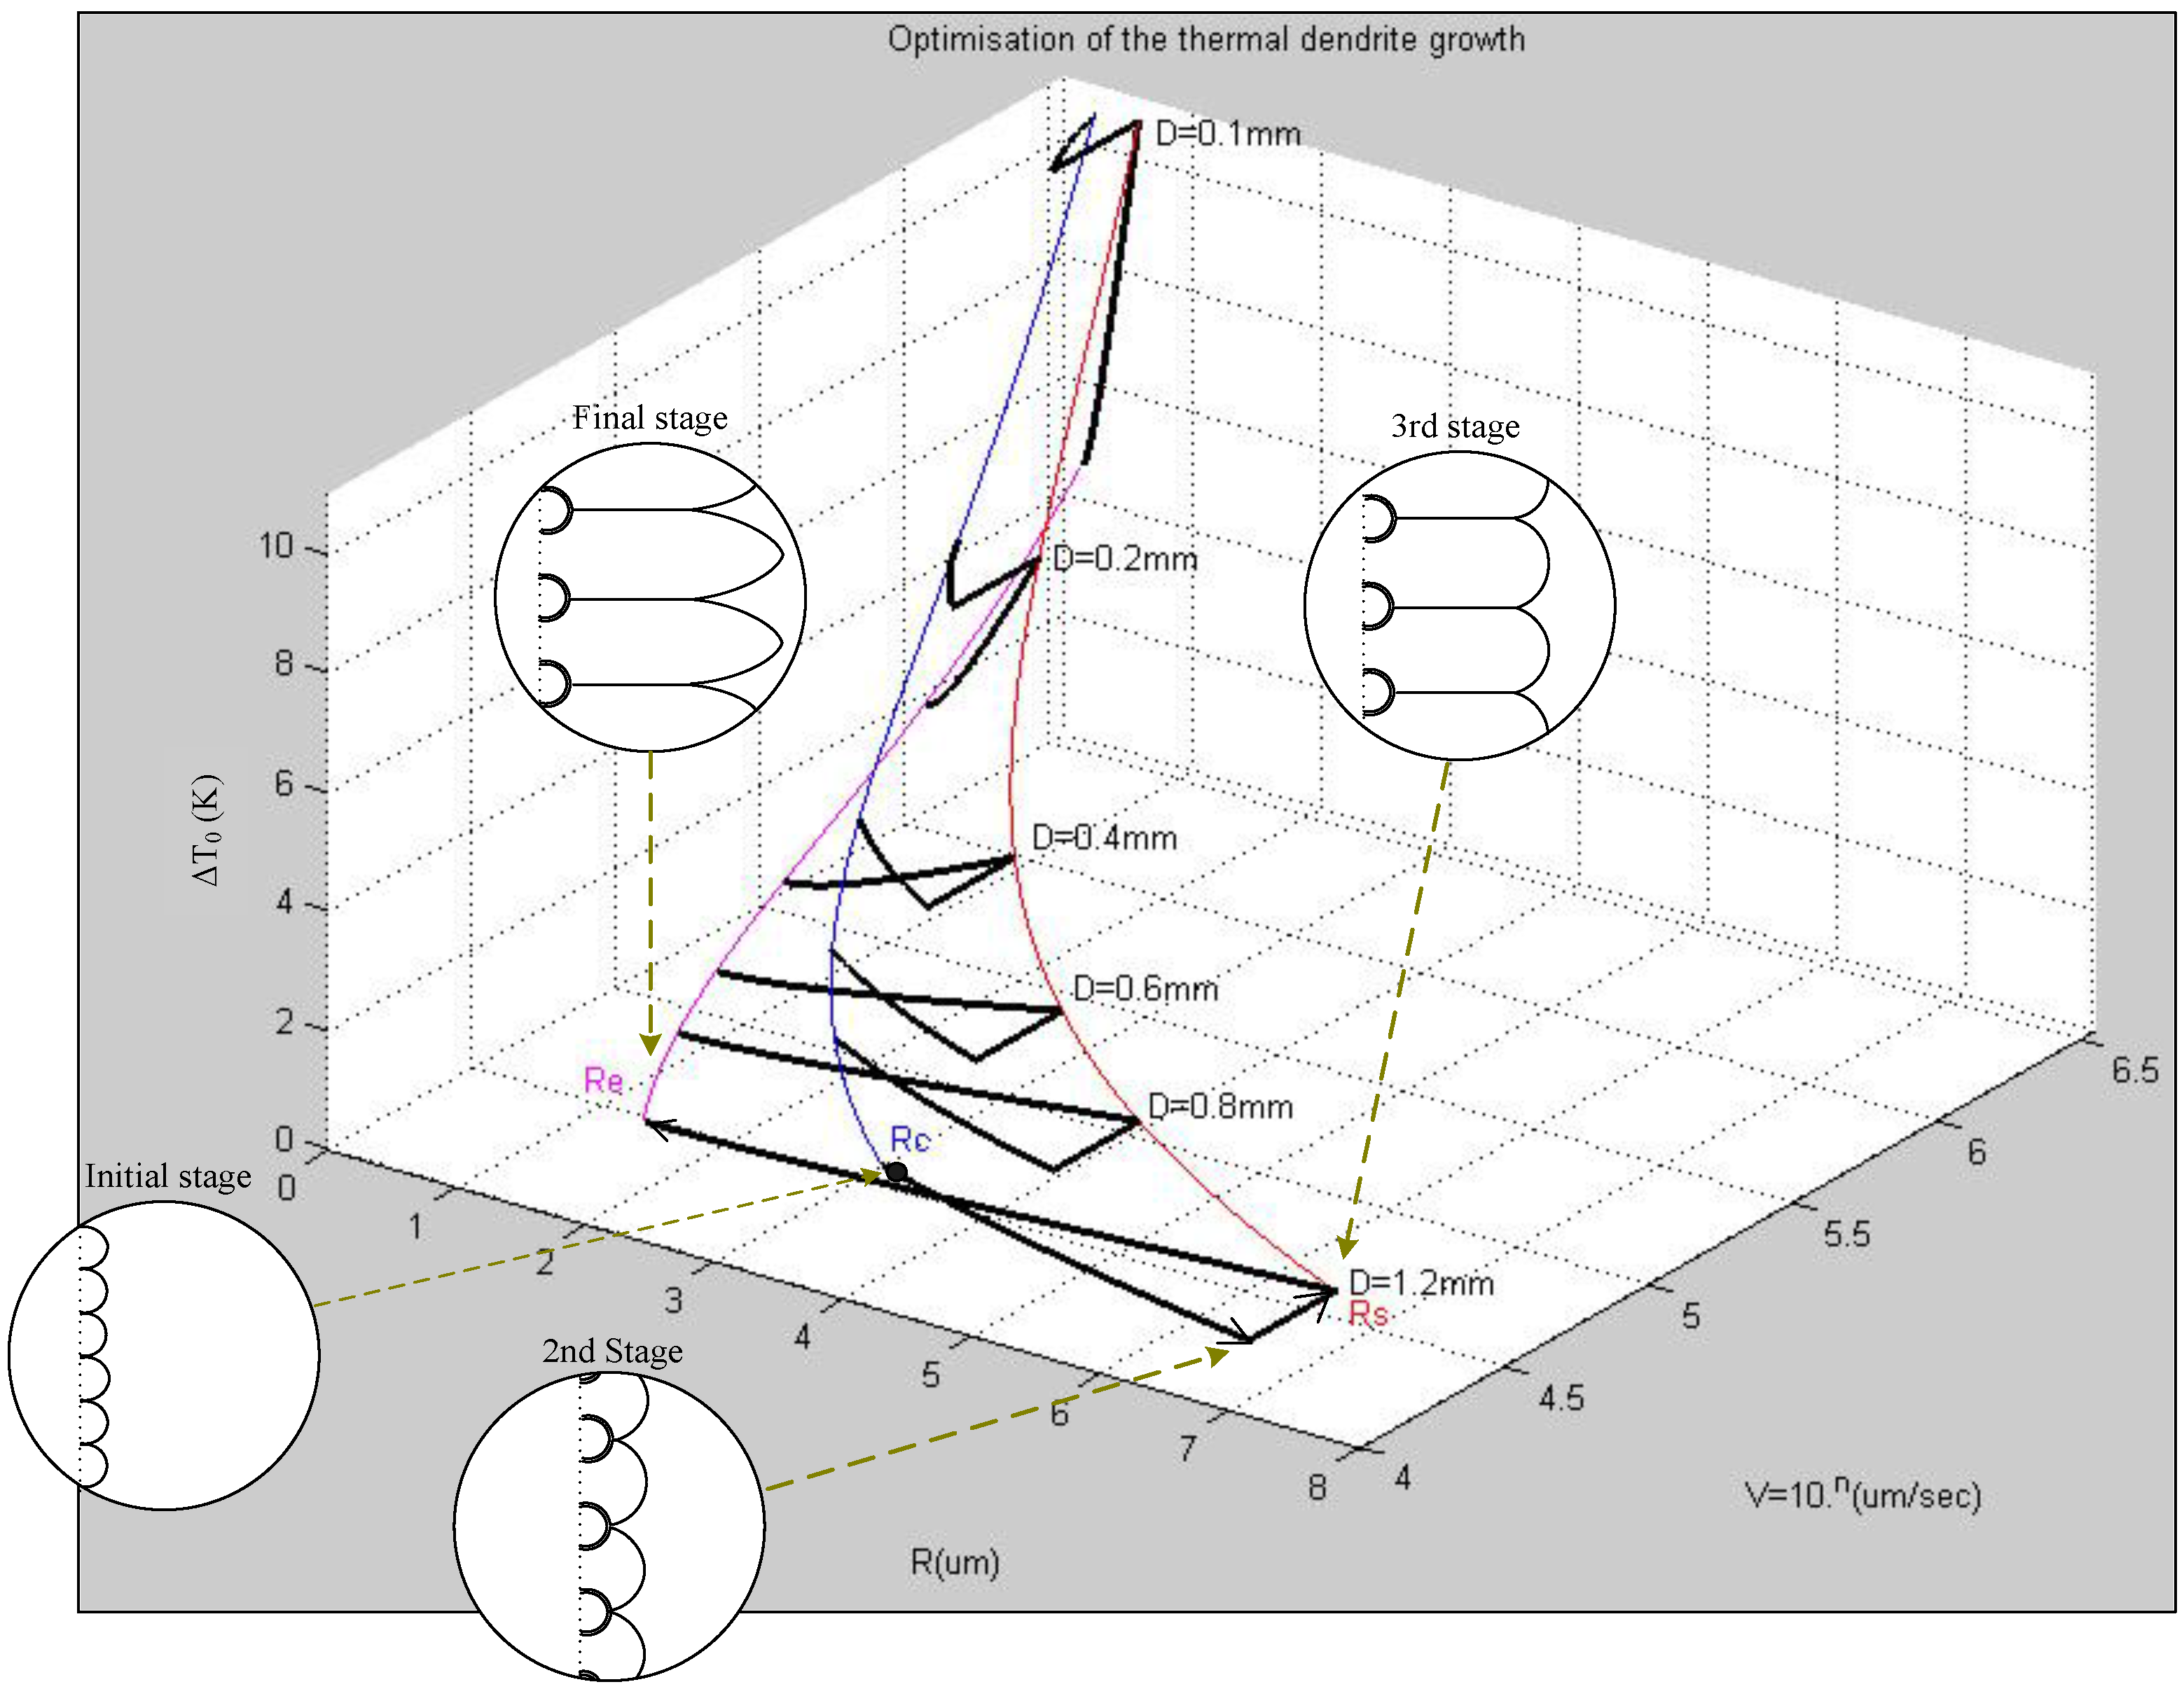
Figure 9 presents the overall relationships between the wire diameter (
D), the total undercooling (∆
T0), the tip radius (
Rs,
Re), and the growth velocity (
ν) of thermal dendrites at various growth stages.
Figure 9.
Relationships among the values of ΔT0, R, and ν, of the thermal dendrites obtained from various wire diameters (D) during different growth stages.
Figure 9.
Relationships among the values of ΔT0, R, and ν, of the thermal dendrites obtained from various wire diameters (D) during different growth stages.


