3.1. Fourier Transform Infrared Spectroscopy
Figure 1 and
Figure 2 illustrate typical Fourier transform infrared (FTIR) spectra of sodium hexametaphosphate (SHMP), TPS
100BC
0.02, TPS
100BC
0.02SHMP
x and (TPS
100BC
0.02SHMP
x)
75PLA
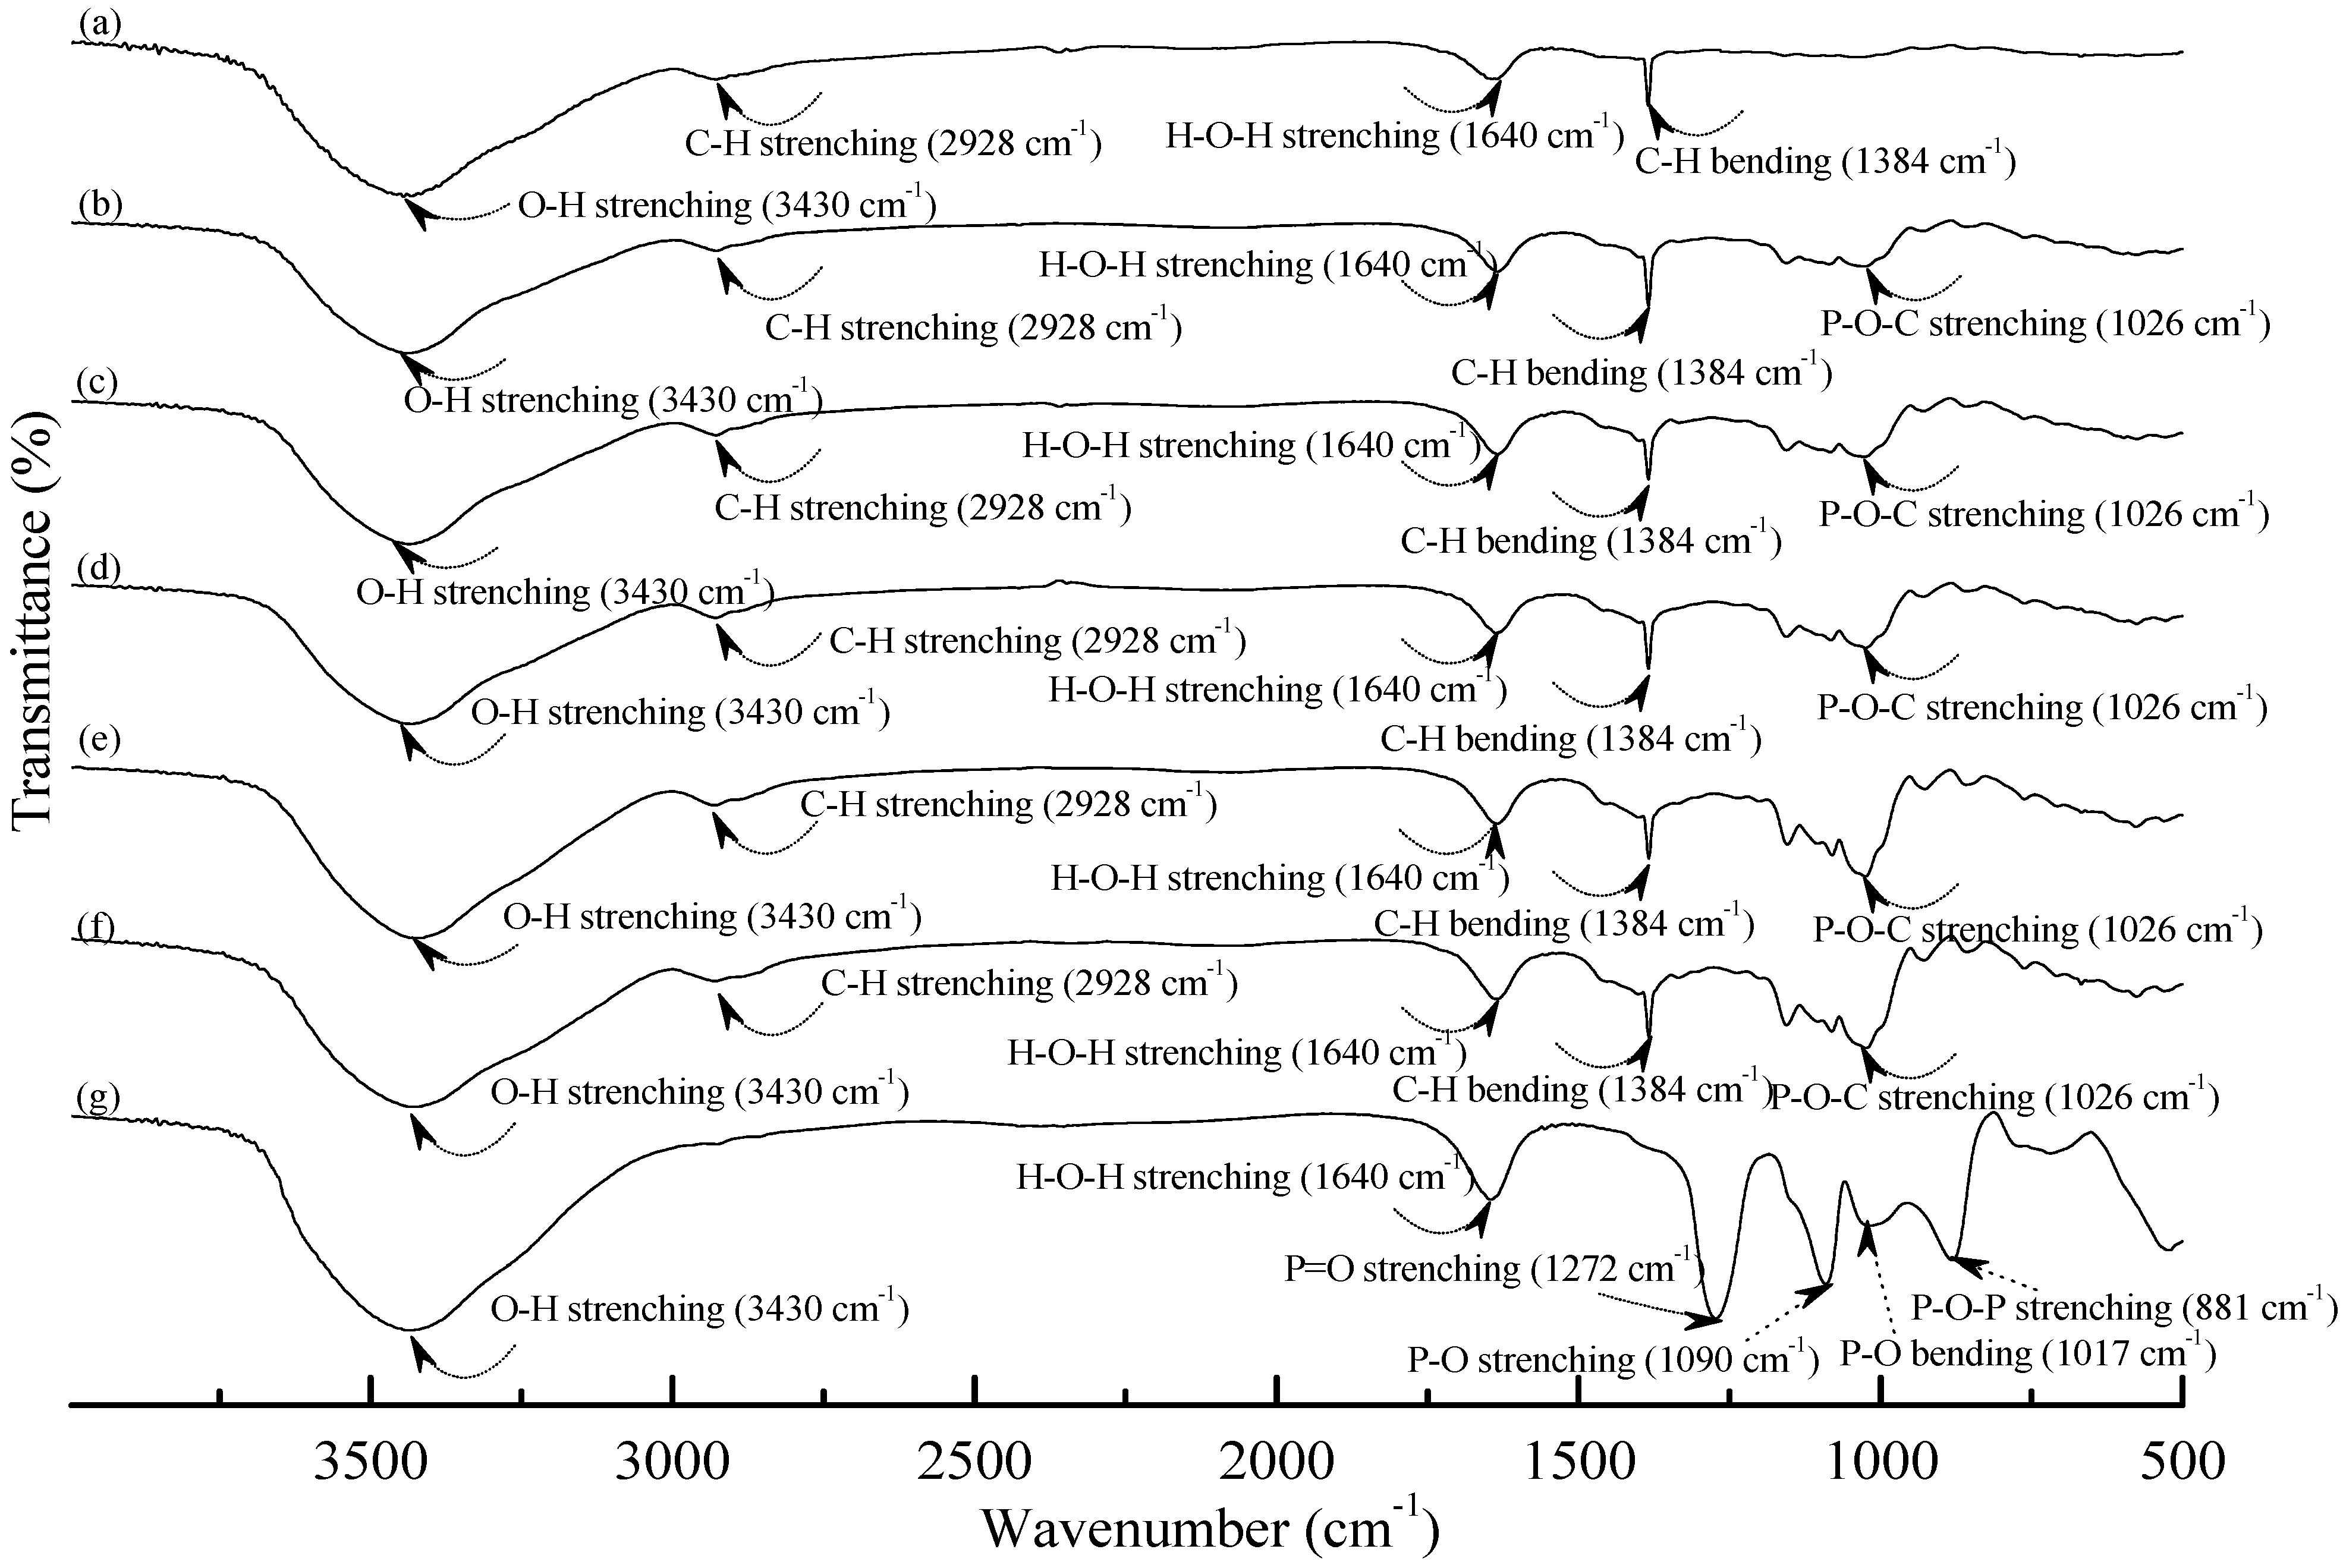
25 specimens. Four distinctive absorption bands placed at 881, 1017, 1090 and 1272 cm
−1 corresponding to the motions of P–O–P stretching, P–O bending, P–O and P=O stretching vibrations, respectively, were found on the FTIR spectrum of SHMP specimen [
46] (see
Figure 1g). Two other distinctive absorption bands placed at 1640 and 3430 cm
−1 corresponding to motions of H–O–H and O–H stretching vibrations of absorbed water molecules were also found on FTIR spectrum of SHMP specimen [
47]. As shown in
Figure 1a, FTIR spectrum of the TPS
100BC
0.02 specimen exhibited four distinctive absorption bands placed at 1384, 1640, 2928 and 3430 cm
−1, which were generally attributed to the motion of C–H bending, H–O–H, C–H and O–H stretching vibrations, respectively [
47]. In addition to the C–H bending, H–O–H, C–H and gradually strengthened O–H stretching vibration bands, a new absorption band placed at 1026 cm
−1 corresponding to ester (P–O–C) [
48] stretching vibration gradually grew on FTIR spectra of TPS
100BC
0.02SHMP
x and (TPS
100BC
0.02SHMP
x)
75PLA
25 series specimens as their SHMP contents increased (see
Figure 1b–f and
Figure 2b–g). However, after modification with varying amounts of SHMP, the absorption bands originally corresponding to the motions of P–O–P stretching, P–O bending, P–O and P=O stretching vibrations of phosphate group of SHMP disappeared nearly completely in FTIR spectra of TPS
100BC
0.02SHMP
x and (TPS
100BC
0.02SHMP
x)
75PLA
25 series specimens. The newly developed ester stretching bands and disappeared P–O–P stretching, P–O bending, P–O and P=O stretching bands of TPS
100BC
0.02SHMP
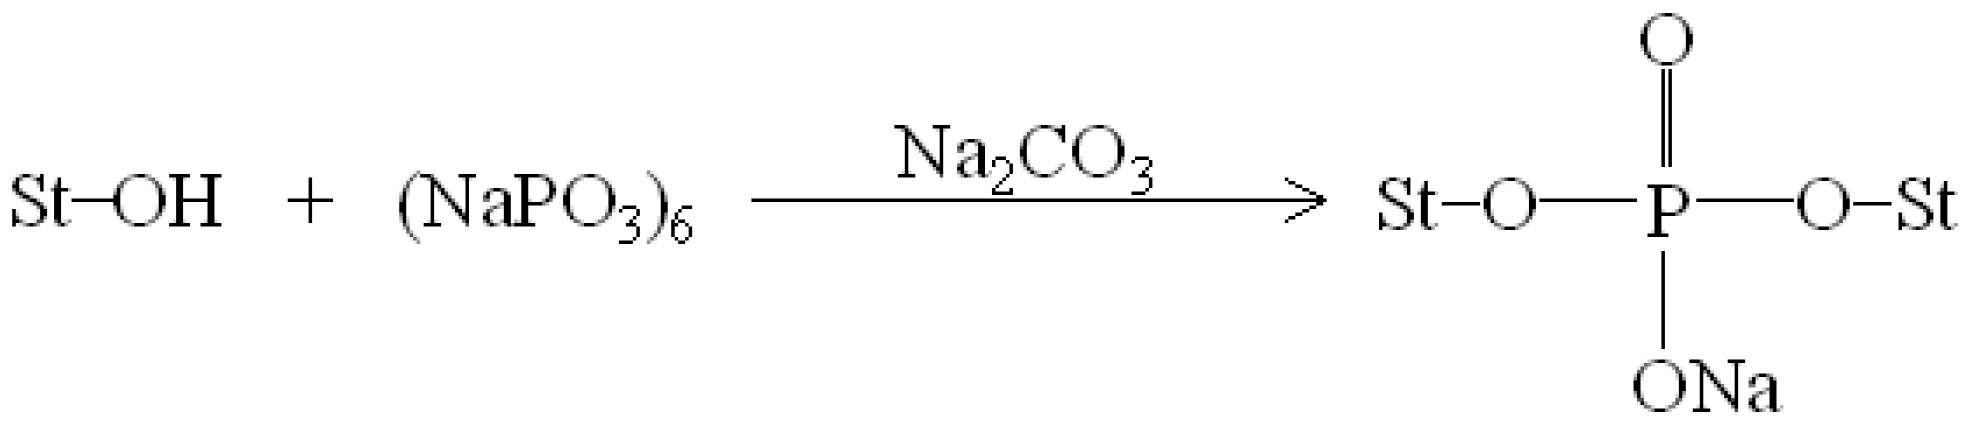
x series specimens are most likely due to the reaction of the hydroxyl groups of TPS
100BC
0.02 specimens with the phosphate groups of SHMP molecules during their modification processes. It is highly likely that crosslinking reaction between starch and SHMP molecules can occur to some extent. The possible reaction mechanism between hydroxyl groups of TPS
100BC
0.02 specimens and phosphate groups of SHMP molecules is illustrated in
Scheme 1 [
47].
Figure 1.
FTIR spectra of (a) TPS100BC0.02; (b) TPS100BC0.02SHMP4; (c) TPS100BC0.02SHMP8; (d) TPS100BC0.02SHMP10; (e) TPS100BC0.02SHMP16; (f) TPS100BC0.02SHMP32 and (g) SHMP specimens.
Figure 1.
FTIR spectra of (a) TPS100BC0.02; (b) TPS100BC0.02SHMP4; (c) TPS100BC0.02SHMP8; (d) TPS100BC0.02SHMP10; (e) TPS100BC0.02SHMP16; (f) TPS100BC0.02SHMP32 and (g) SHMP specimens.
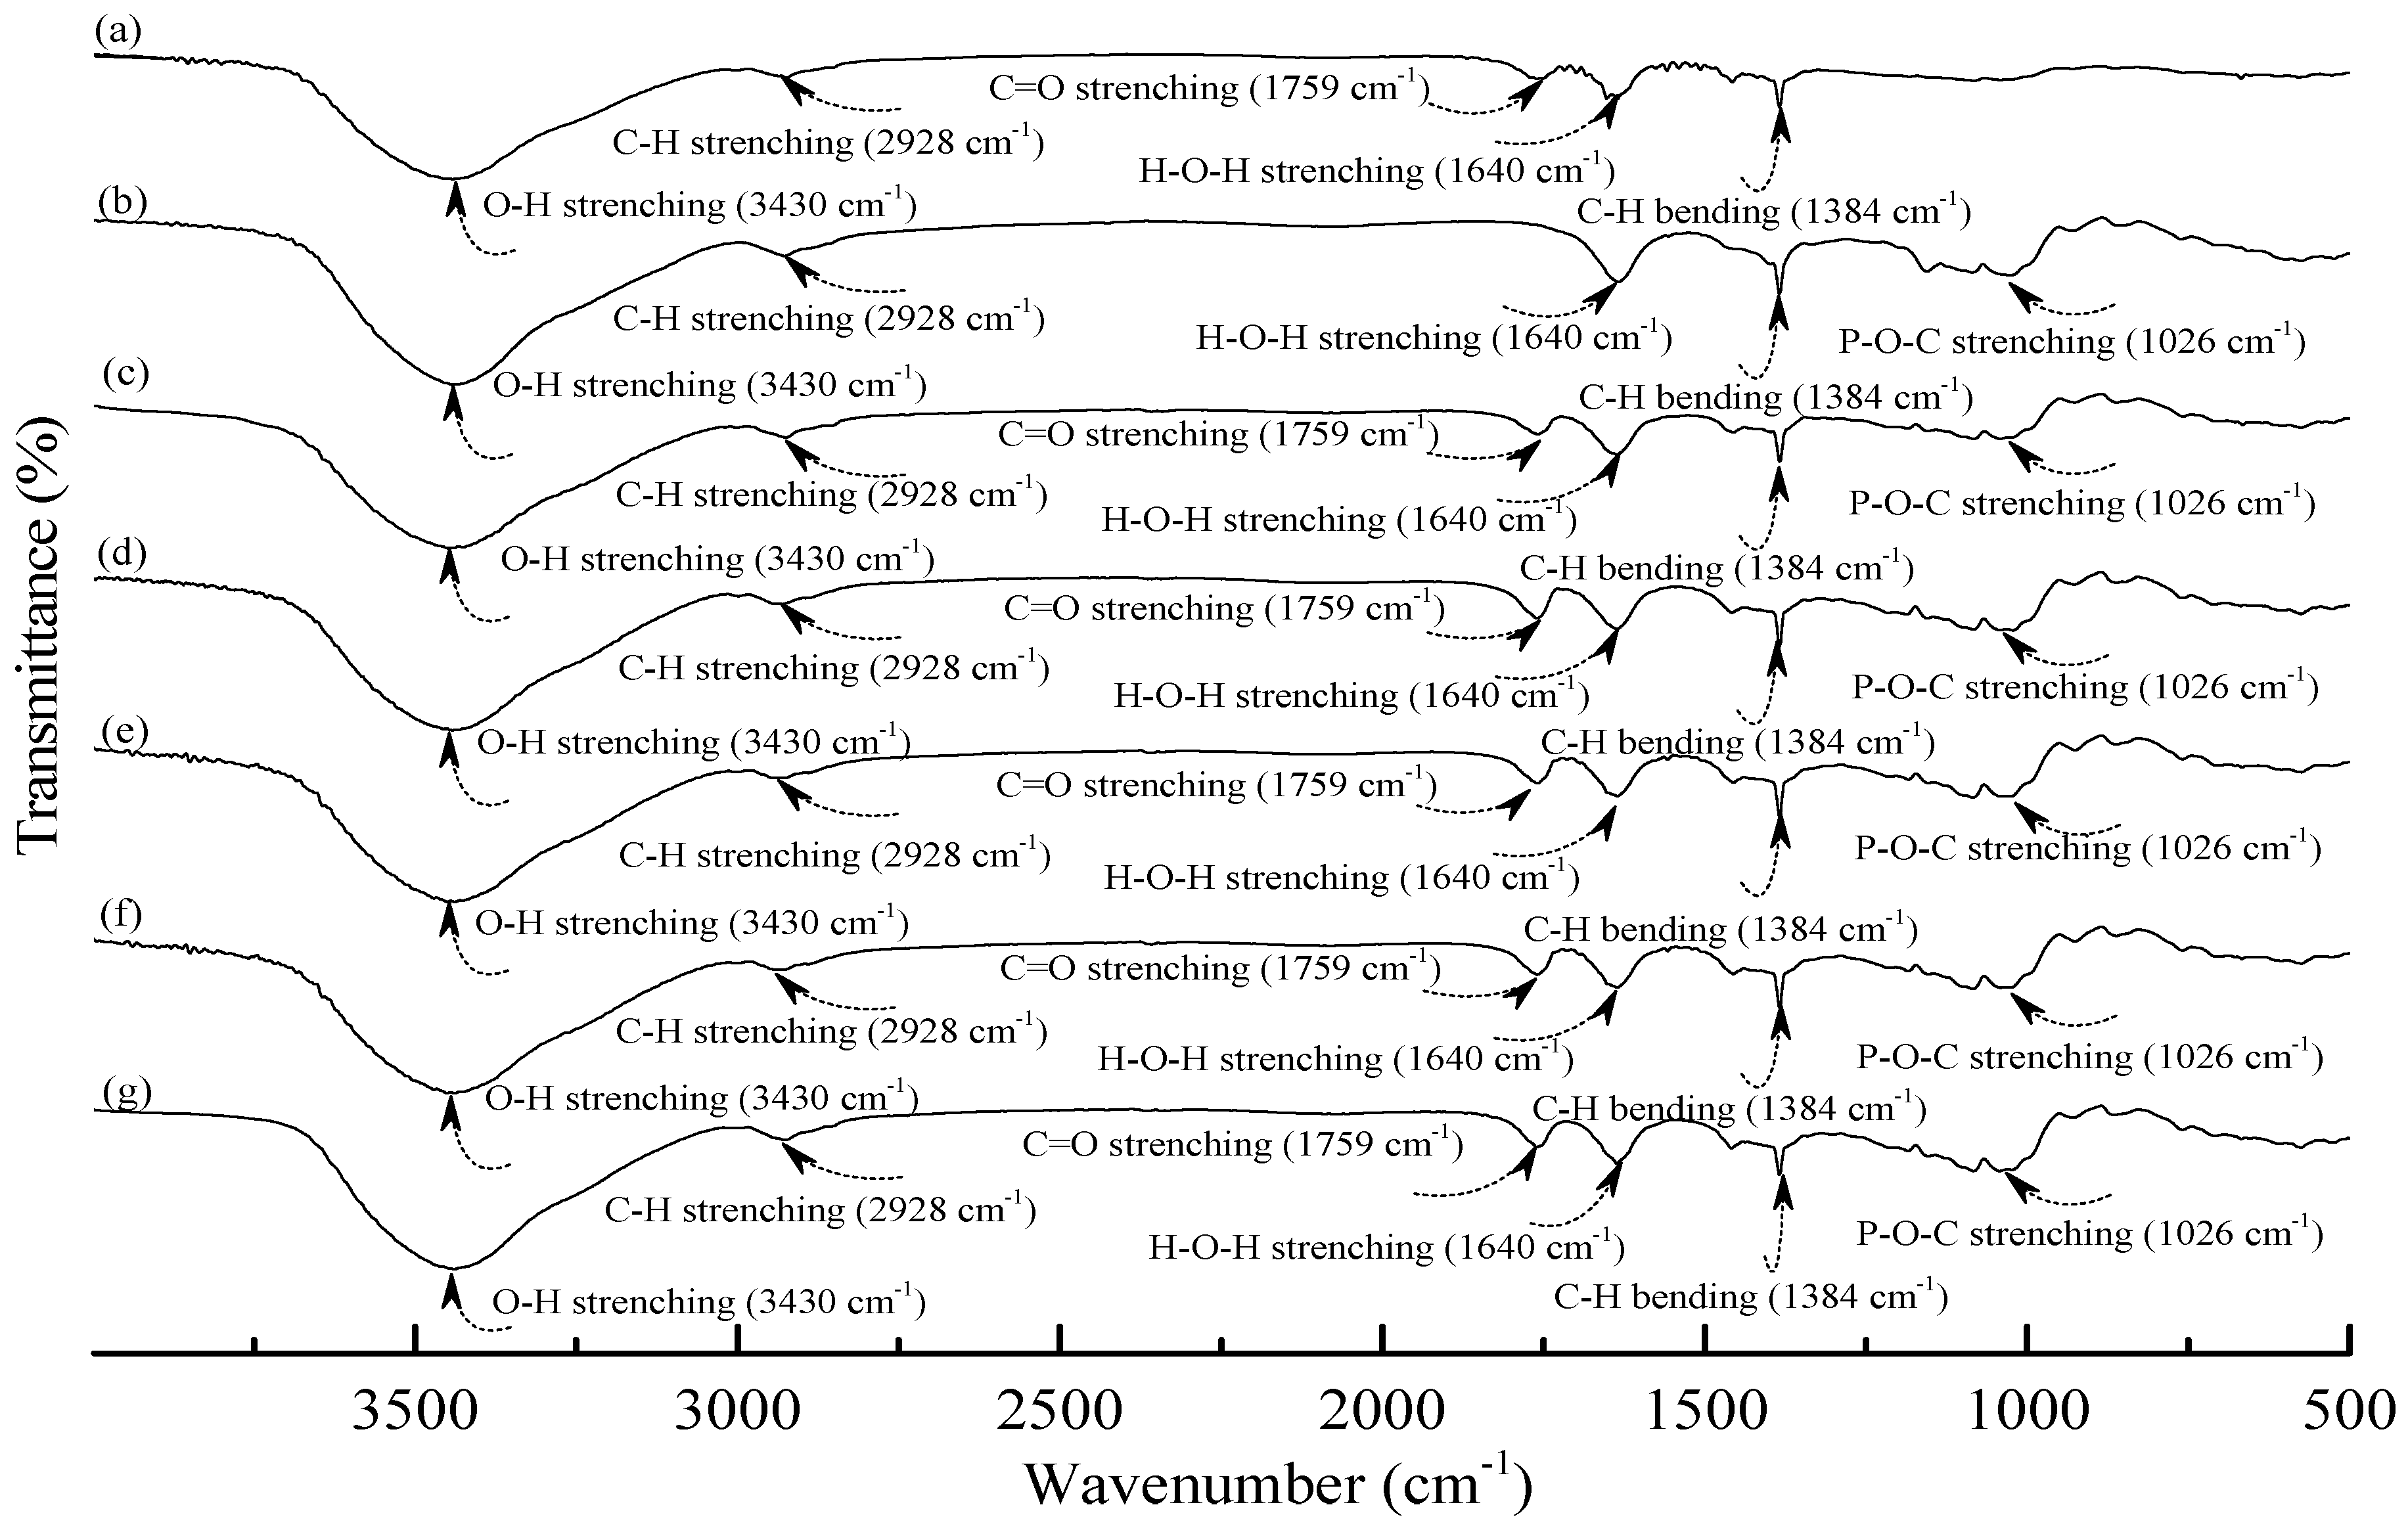
Figure 2.
FTIR spectra of (a) PLA; (b) TPS100BC0.02SHMP4; (c) (TPS100BC0.02SHMP4)75PLA25; (d) (TPS100BC0.02SHMP8)75PLA25; (e) (TPS100BC0.02SHMP10)75PLA25; (f) (TPS100BC0.02SHMP16)75PLA25 and (g) (TPS100BC0.02SHMP32)75PLA25 specimens.
Figure 2.
FTIR spectra of (a) PLA; (b) TPS100BC0.02SHMP4; (c) (TPS100BC0.02SHMP4)75PLA25; (d) (TPS100BC0.02SHMP8)75PLA25; (e) (TPS100BC0.02SHMP10)75PLA25; (f) (TPS100BC0.02SHMP16)75PLA25 and (g) (TPS100BC0.02SHMP32)75PLA25 specimens.
Scheme 1.
Reaction mechanism of sodium hexametaphosphate and starch molecules [
47].
Scheme 1.
Reaction mechanism of sodium hexametaphosphate and starch molecules [
47].
As shown in
Figure 2a, PLA.specimen exhibited five distinctive absorption bands centered at 1384, 1640, 1759, 2928 and 3430 cm
−1 corresponding to the motions of C–H bending vibration, H–O–H, C=O, C–H and O–H stretching vibrations bands [
49,
50,
51], respectively. After blending 25 wt % PLA with TPS
100BC
0.02SHMP
x, the FTIR spectra of (TPS
100BC
0.02SHMP
x)
75PLA
25 series specimens look nearly the same as the integration of FTIR spectra of PLA and corresponding TPS
100BC
0.02SHMP
x specimens, in which no new vibration band but only vibration bands originally present in spectra of PLA and TPS
100BC
0.02SHMP
x specimens were found in FTIR spectra of (TPS
100BC
0.02SHMP
x)
75PLA
25 series specimens, respectively. These results suggest that no distinctive chemical reaction or molecular interactions occurred during the melt-blending processes of PLA and TPS
100BC
0.02SHMP
x resins.
3.2. Morphology Analyses
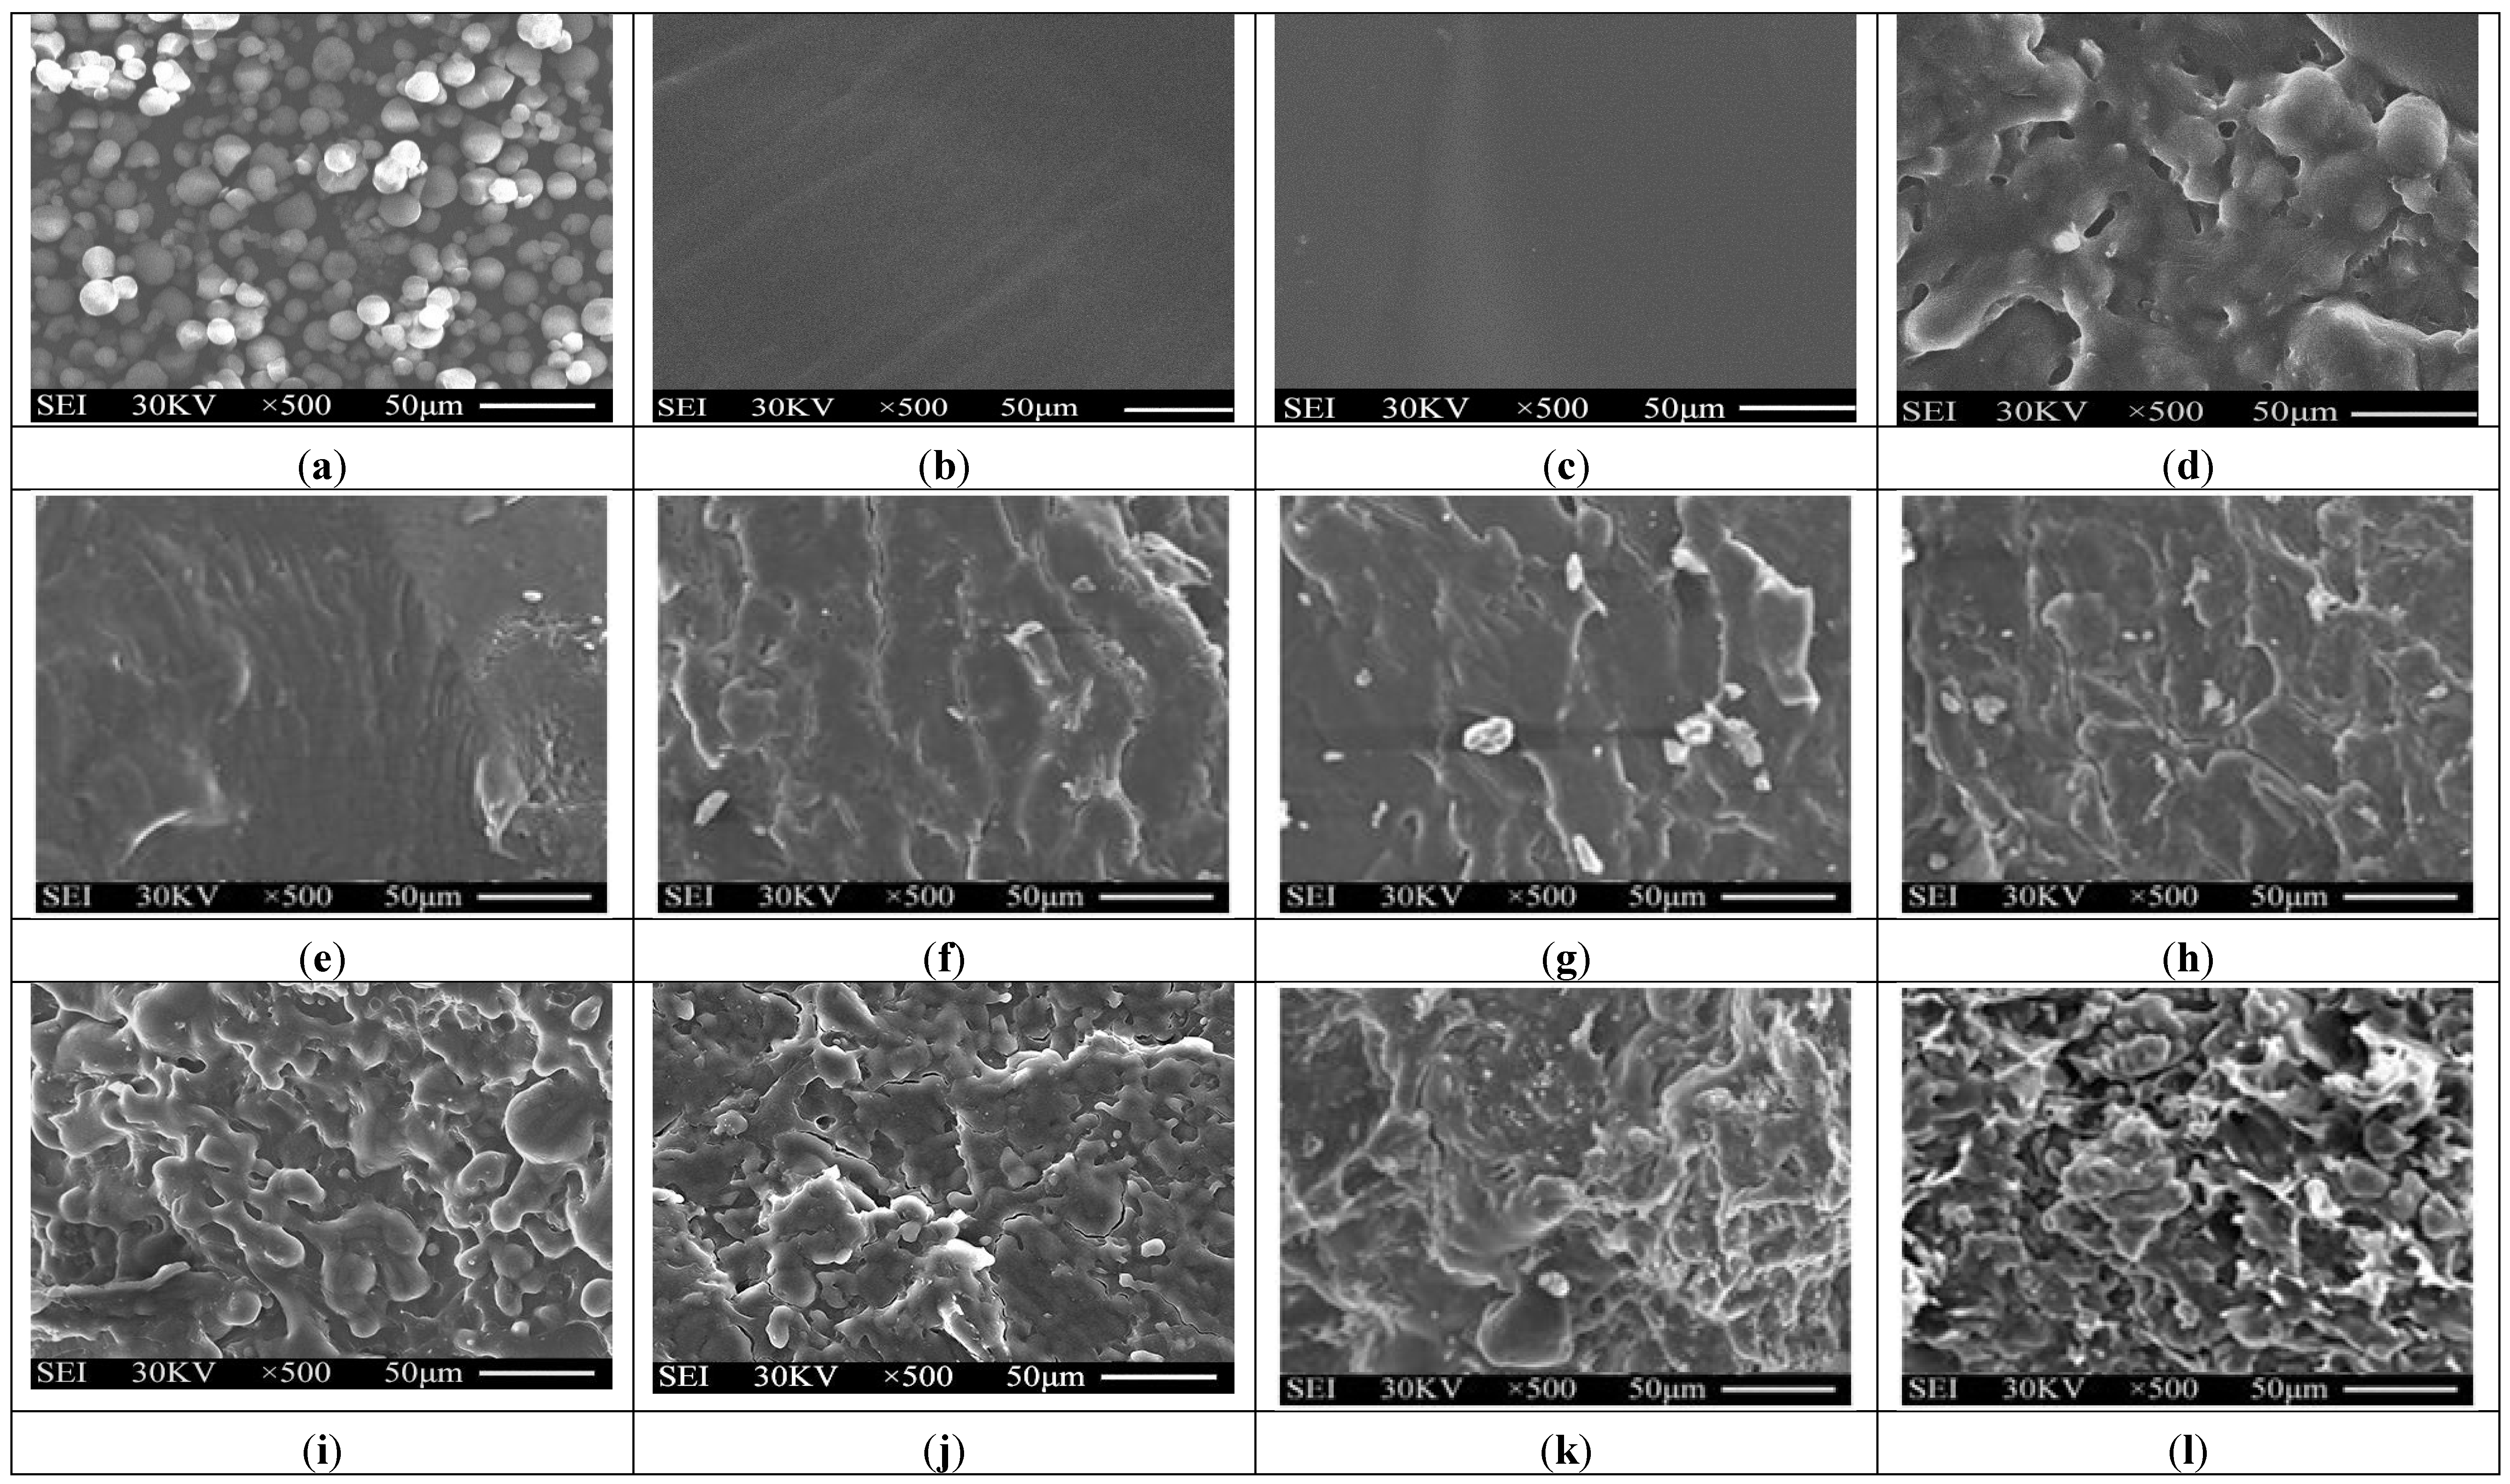
Typical SEM micrographs of the fracture surfaces of tapioca starch, TPS, TPS
100BC
0.02SHMP
x and (TPS
100BC
0.02SHMP
x)
75PLA
25 specimens are summarized in
Figure 3. Granular tapioca starches with 5–10 μm in diameter were found on SEM micrograph of the original tapioca starches (see
Figure 3a). The granular tapioca starches were completely dismantled and gelatinized as a continuous phase after gelatinization, in which only smooth characteristics were found on the fracture surface of TPS and TPS
100BC
0.02 specimens (see
Figure 3b,c). After modification by SHMP, more ductile characteristics with drawn debris were found on the fracture surfaces of TPS
100BC
0.02SHMP
x and (TPS
100BC
0.02SHMP
x)
75PLA
25 specimens (see
Figure 3e–l). As evidenced by FTIR analyses in the previous section, this is most likely due to the crosslinking reaction of the hydroxyl groups of TPS
100BC
0.02 specimens with the phosphate groups of SHMP molecules. As shown in
Figure 3d, clearly separated PLA droplets were found on (TPS
100BC
0.02)
75PLA
25 specimen that are attributed to the incompatibility between TPS
100BC
0.02 and PLA molecules during their melt-blending processes. In contrast, significantly less and smaller separated PLA droplets were found on fracture surfaces of (TPS
100BC
0.02SHMP
x)
75PLA
25 specimens than were found for the (TPS
100BC
0.02)
75PLA
25 specimen. These results clearly suggested that the SHMP modified TPS
100BC
0.02SHMP
x molecules are much more compatible with PLA molecules.
Figure 3.
SEM micrographs of fracture surfaces of initial (a) Tapioca starch; (b) TPS; (c) TPS100BC0.02; (d) (TPS100BC0.02)75PLA25; (e) TPS100BC0.02SHMP4; (f) TPS100BC0.02SHMP8; (g) TPS100BC0.02SHMP10; (h) TPS100BC0.02SHMP16; (i) (TPS100BC0.02SHMP4)75PLA25; (j) (TPS100BC0.02SHMP8)75PLA25; (k) (TPS100BC0.02SHMP10)75PLA25 and (l) (TPS100BC0.02SHMP16)75PLA25 specimens.
3.3. Moisture Contents
The moisture contents of initial and conditioned TPS, TPS
100BC
0.02, TPS
100BC
0.02SHMP
x and (TPS
100BC
0.02SHMP
x)
75PLA
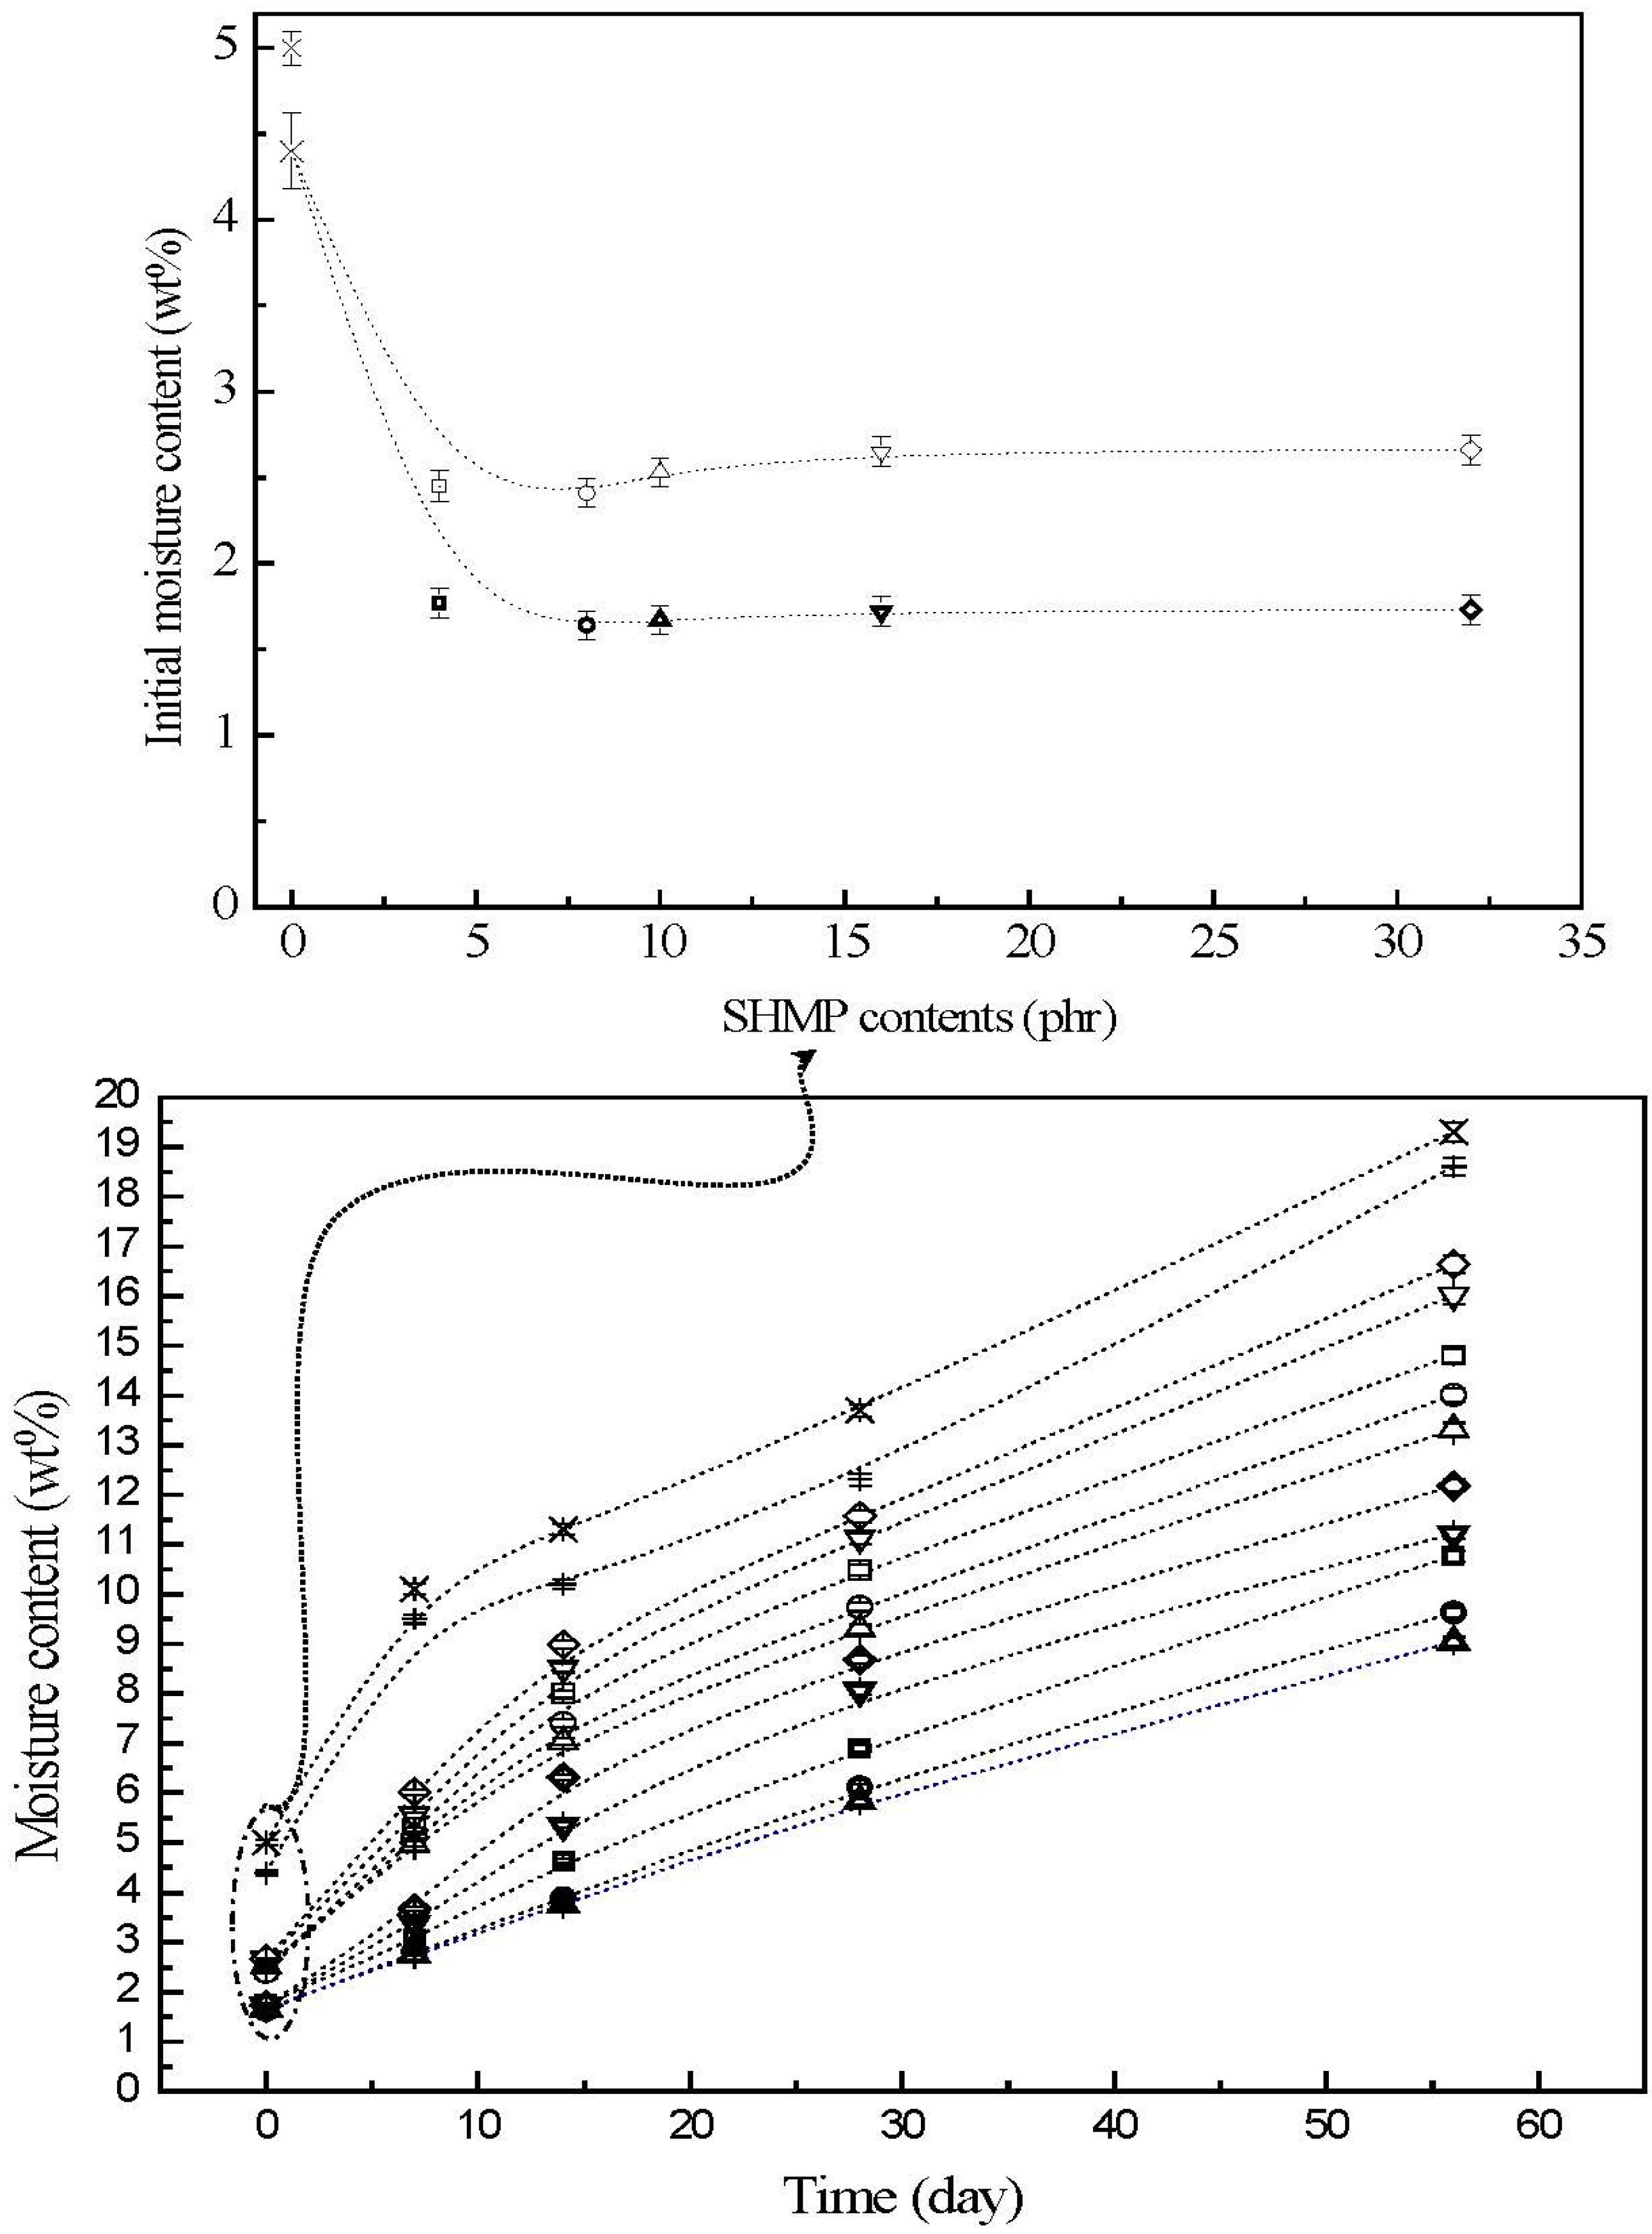
25 specimens are summarized in
Figure 4. The initial TPS and TPS
100BC
0.02 specimens exhibited relatively high moisture contents at 5.0% and 4.4%, respectively. After remaining at 20 °C/50% RH for varying amounts of time, the moisture contents of conditioned TPS and TPS
100BC
0.02 specimens increased significantly from 5.0% and 4.4% to 10.1% and 9.5%, 13.7% and 12.3% and then to 19.6% and 19.3%, respectively, as the conditioning time increased from 0 to 7, 28 and to 56 days. After modification with varying amounts of SHMP, the moisture contents of initial TPS
100BC
0.02SHMP
x and (TPS
100BC
0.02SHMP
x)
75PLA
25 specimens were reduced significantly to around 2.4% and 1.6%, respectively. The moisture contents of all conditioned TPS
100BC
0.02SHMP
x and (TPS
100BC
0.02SHMP
x)
75PLA
25 specimens are significantly lower than those of corresponding conditioned TPS and TPS
100BC
0.02 specimens conditioned at 20 °C/50% RH for the same amounts of time, in which aged (TPS
100BC
0.02SHMP
x)
75PLA
25 specimens exhibited even lower moisture contents than the corresponding conditioned TPS
100BC
0.02SHMP
x specimens without blending with 25 wt % of PLA. Moreover, it is noteworthy that conditioned (TPS
100BC
0.02SHMP
10)
75PLA
25 specimens exhibited significantly lower moisture contents than conditioned (TPS
100BC
0.02SHMP
x)
75PLA
25 specimens modified with SHMP contents other than 10 part per hundred parts of TPS resin (phr). In fact, after conditioning at 20 °C/50% relative humidity for 56 days, the moisture contents of conditioned (TPS
100BC
0.02SHMP
10)
75PLA
25 specimens reached only 8.0%, which is less than half of the moisture contents of those of corresponding conditioned TPS and TPS
100BC
0.02 specimens.
As evidenced by FTIR analyses in the previous section, significant amounts of hydroxyl groups of starch molecules were reacted with phosphate groups of SHMP molecules into ester functional groups during the modification processes of TPS100BC0.02SHMPx specimens. Apparently, the significant improvement in waterproof properties of the initial and conditioned TPS100BC0.02SHMPx and/or (TPS100BC0.02SHMPx)75PLA25 specimens is mainly due to the efficient blocking of the moisture-absorbing hydroxyl groups of starch molecules present in TPS100BC0.02SHMPx specimens during their modification processes. However, excess amounts of relatively large SHMP molecules can no longer react with the hydroxyl groups of starch molecules during the modification processes of TPS100BC0.02SHMPx specimens. As a consequence, conditioned TPS100BC0.02SHMPx specimens exhibited higher moisture contents than those of TPS100BC0.02SHMP10 specimen, since the remaining SHMP molecules are with strong hygroscopicity. In addition, blending TPS100BC0.02SHMPx with inherently hydrophobic PLA can further prevent TPS100BC0.02SHMPx from absorbing moisture and hence improve the waterproof properties of the initial and conditioned (TPS100BC0.02SHMPx)75PLA25 specimens.
Figure 4.
The moisture contents of initial and conditioned TPS (+), TPS100BC0.02 (▷), TPS100BC0.02SHMP4 (□), TPS100BC0.02 SHMP8 (○), TPS100BC0.02 SHMP10 (△), TPS100BC0.02SHMP16 (▽), TPS100BC0.02SHMP32 (◇), (TPS100BC0.02SHMP4)75PLA25 (□), (TPS100BC0.02SHMP8)75PLA25 (○), (TPS100BC0.02SHMP10)75PLA25 (△), (TPS100BC0.02SHMP16)75PLA25 (▽) and (TPS100BC0.02SHMP32)75PLA25 (◇) specimens. (Symbol (Ι) represents the error bar).
3.4. Thermal Properties
Typical DSC thermograms of TPS, TPS
100BC
0.02 and TPS
100BC
0.02SHMP
x specimens are shown in
Figure 5 and
Figure 6. Smooth thermograms without any endotherms were found for initial TPS, TPS
100BC
0.02 and TPS
100BC
0.02SHMP
x specimens (see
Figure 5a,f, and
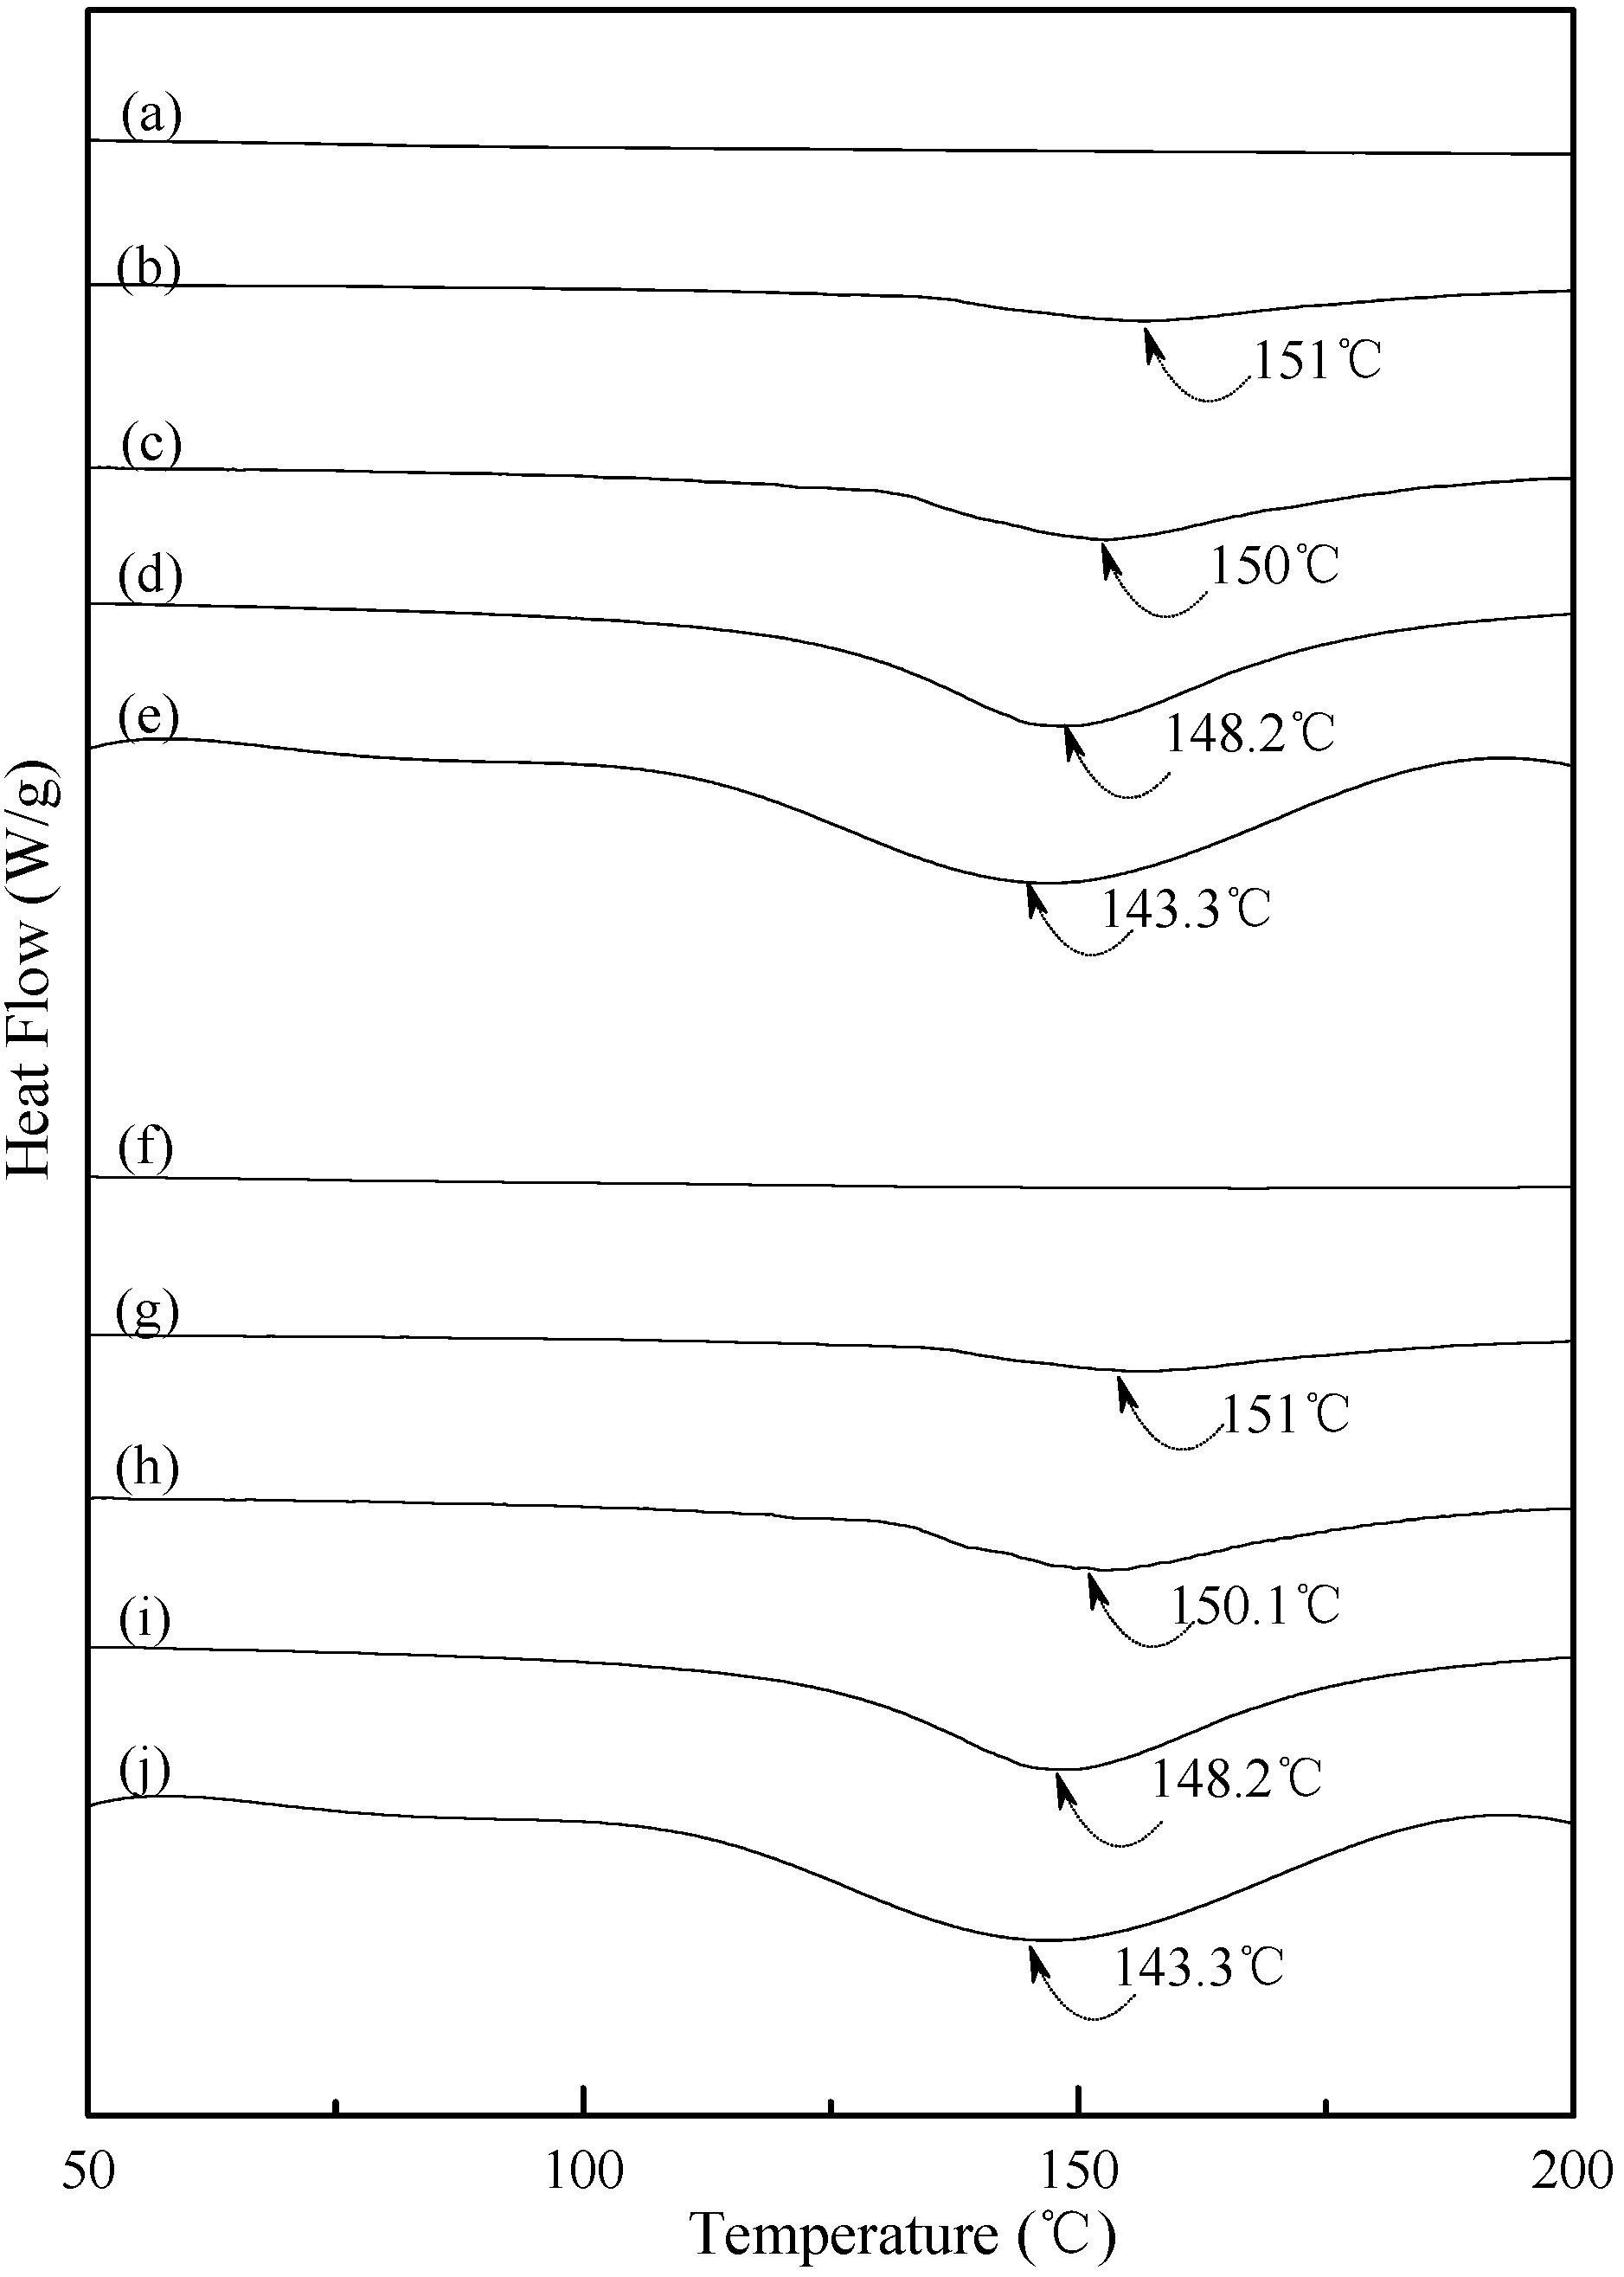
Figure 6a,f,k,p). A new melting endotherm with a peak temperature at about 150 °C gradually appeared on the DSC thermograms of TPS and TPS
100BC
0.02 specimens, respectively, after they were conditioned at 20 °C/50% RH for 7 days or more than 7 days. The size of the new melting endotherm grew significantly as the conditioning time increased. However, as shown in
Figure 5b–e and
Figure 5g–j, the peak melting temperatures of conditioned TPS and TPS
100BC
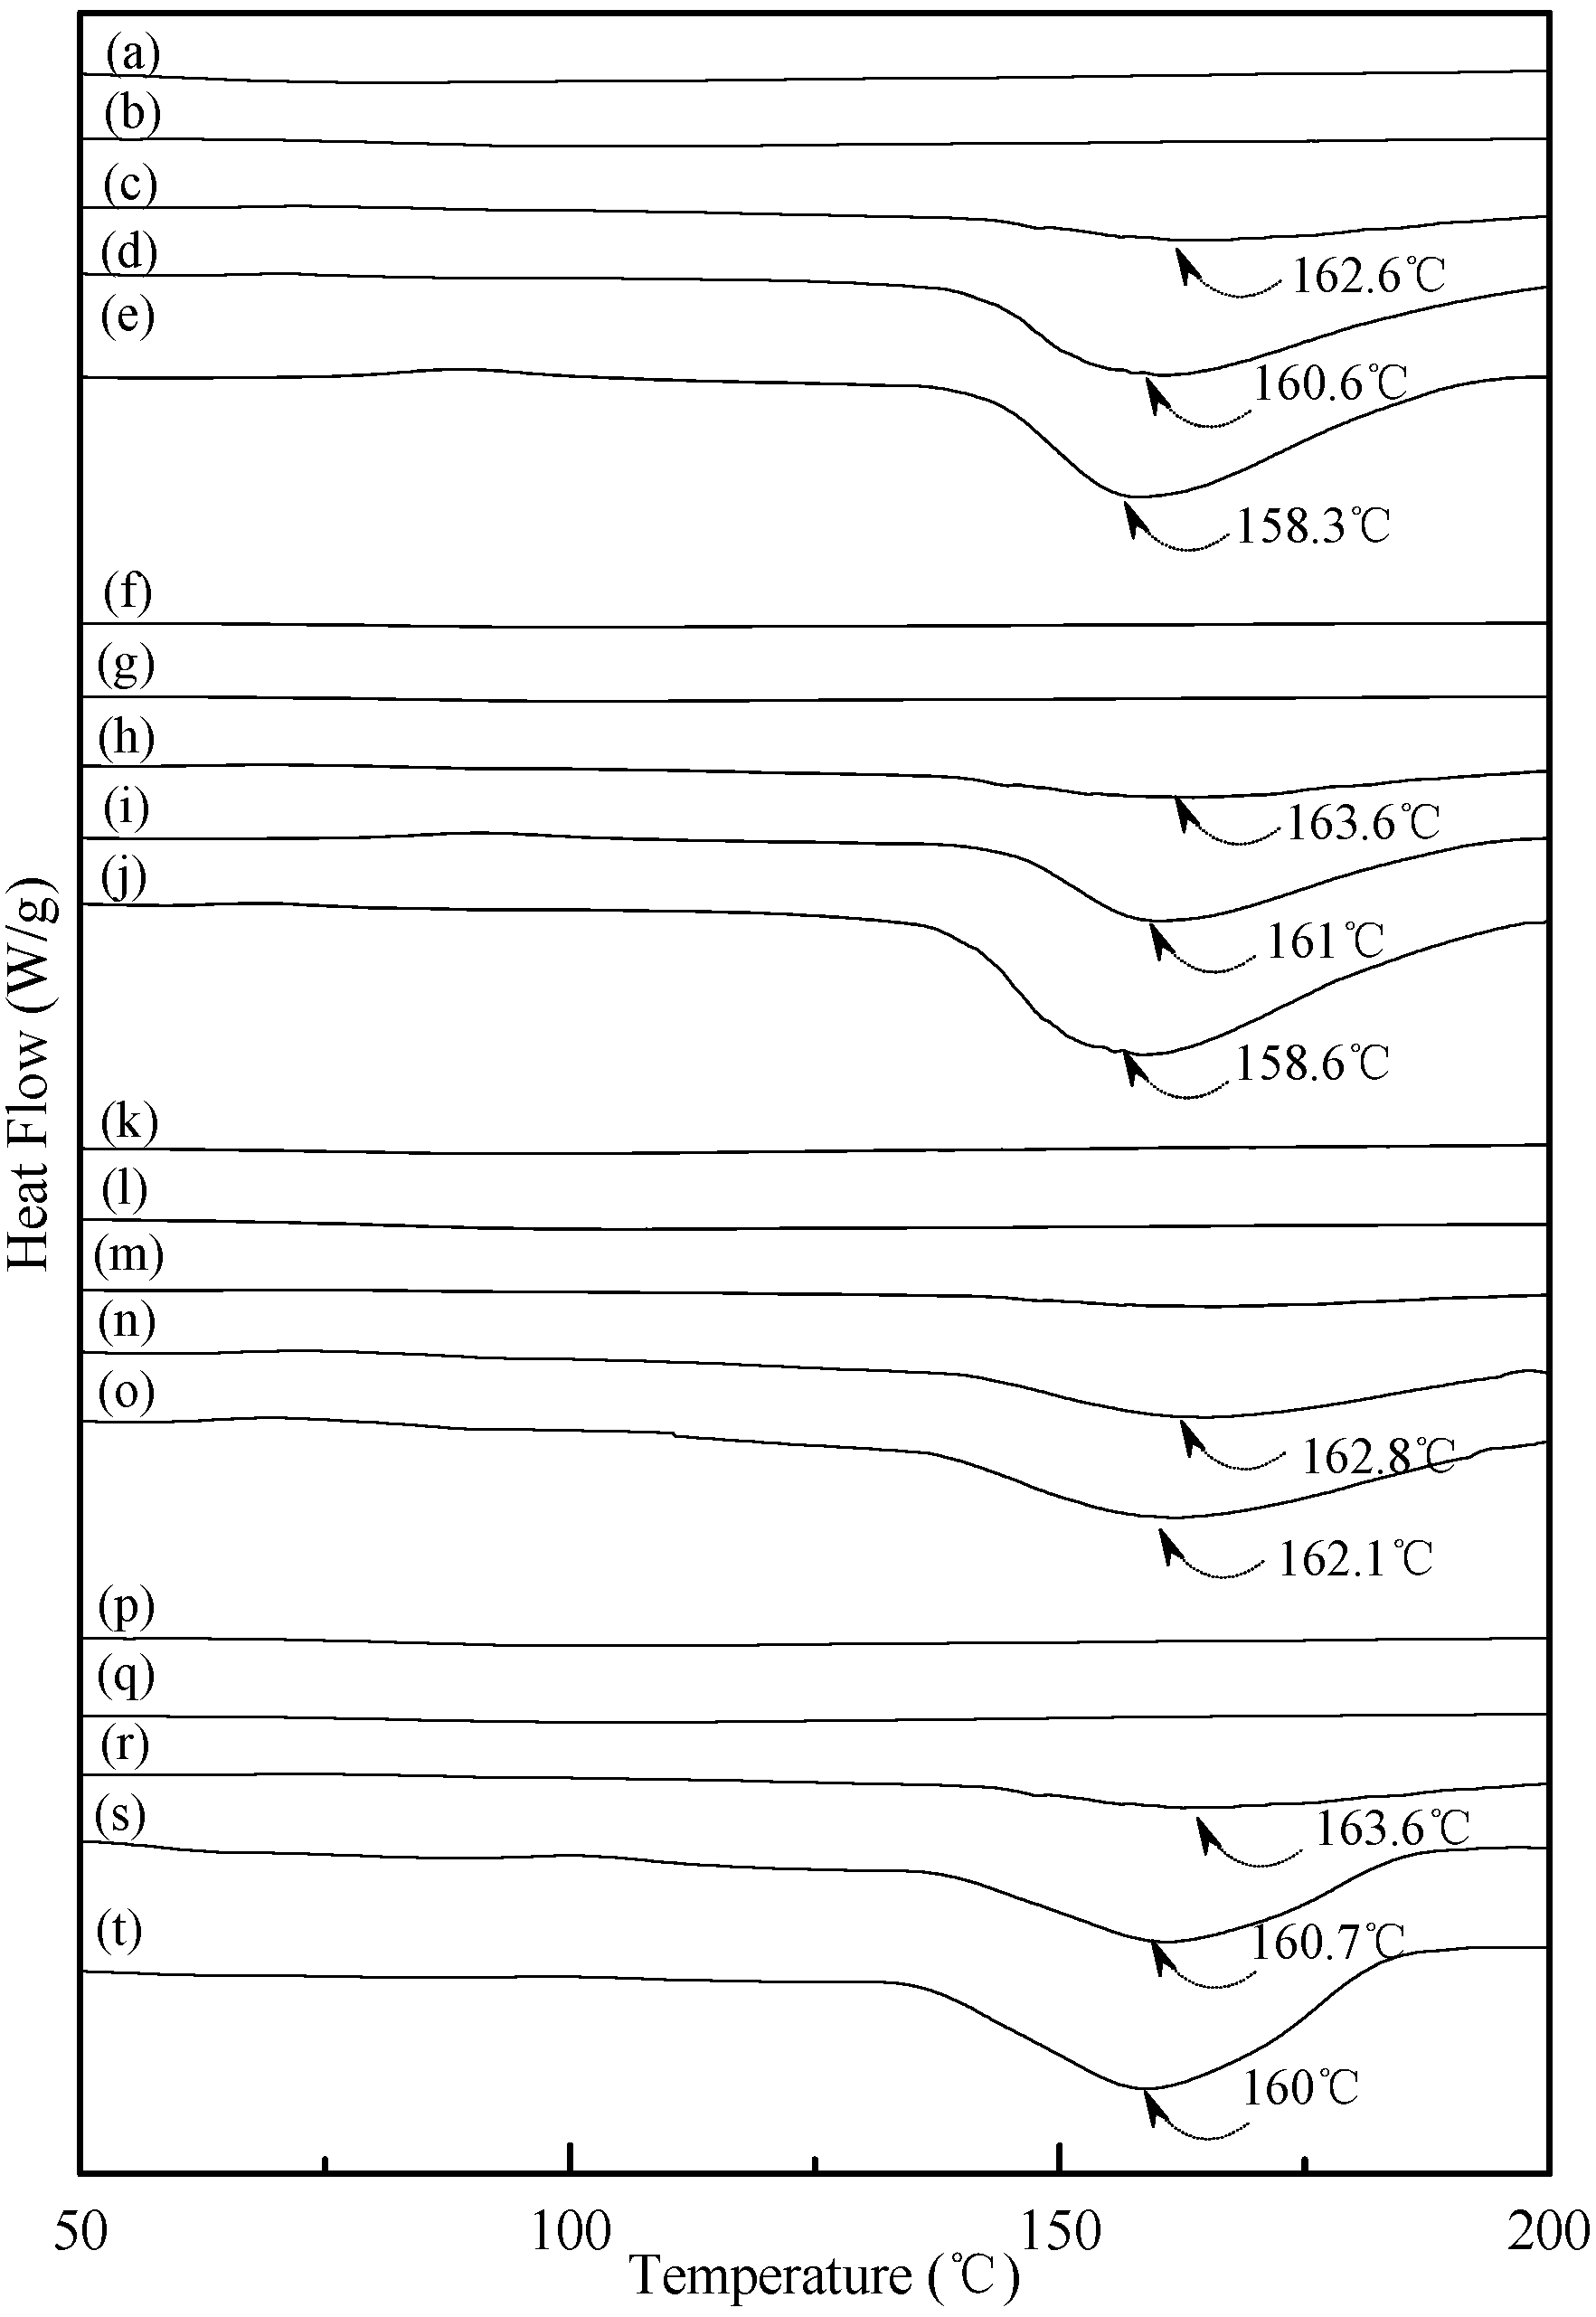
0.02 specimens shifted from around 151.0 °C to 150.0 °C, 148.2 °C and then to 143.3 °C as the conditioning time increased from 7, 14 to 28 and 56 days, respectively. In contrast, one can barely find any endotherm on DSC thermograms of TPS
100BC
0.02SHMP
x specimens after they were conditioned at 20 °C/50% RH for less than 14 days (see
Figure 6b,g,l,m,q). In fact, the thermograms of TPS
100BC
0.02SHMP
10 specimen remained relatively smooth without any distinguished endotherm even after conditioning at 20 °C/50% RH for less than 28 days (see
Figure 6l,m). Similarly, the peak melting temperatures of conditioned TPS
100BC
0.02SHMP
4 and TPS
100BC
0.02SHMP
16 specimens were reduced from 162.6 °C and 163.6 °C to 158.3 °C and 160 °C, respectively, as the conditioning time values increased from 14 to 56 days (see
Figure 6c–e and
Figure 6r–t). The above results revealed that recrystallization of tapioca starch molecules of TPS, TPS
100BC
0.02 and/or TPS
100BC
0.02SHMP
x specimens only occurred after the specimens absorbed enough amounts of plasticizers (e.g., water) during their conditioning processes. Apparently, higher amounts of water molecules absorbed during longer conditioning processes of TPS, TPS
100BC
0.02 and/or TPS
100BC
0.02SHMP
x specimens facilitate the crystallization of the tapioca starches into higher amounts of tapioca starch crystals but with lower melting temperatures, respectively.
Figure 5.
DSC thermograms of TPS specimens conditioned at 20 °C/50% RH for (a) 0; (b) 7; (c)14; (d) 28 and (e) 56 days, respectively; and TPS100BC0.02 specimens conditioned at 20 °C/50% RH for (f) 0; (g) 7; (h) 14; (i) 28 and (j) 56 days, respectively.
Figure 5.
DSC thermograms of TPS specimens conditioned at 20 °C/50% RH for (a) 0; (b) 7; (c)14; (d) 28 and (e) 56 days, respectively; and TPS100BC0.02 specimens conditioned at 20 °C/50% RH for (f) 0; (g) 7; (h) 14; (i) 28 and (j) 56 days, respectively.
Figure 6.
DSC thermograms of TPS100BC0.02SHMP4 specimens conditioned at 20 °C/50% RH for (a) 0; (b) 7; (c) 14; (d) 28 and (e) 56 days respectively; TPS100BC0.02SHMP8 specimens conditioned at 20 °C/50% RH for (f) 0; (g) 7; (h) 14; (i) 28 and (j)56 days, respectively; TPS100BC0.02SHMP10 specimens conditioned at 20 °C/50% RH for (k) 0; (l) 7; (m) 14; (n) 28 and (o) 56 days, respectively; and TPS100BC0.02SHMP16 specimens conditioned at 20 °C/50% RH for (p) 0; (q) 7; (r) 14; (s) 28 and (t) 56 days, respectively.
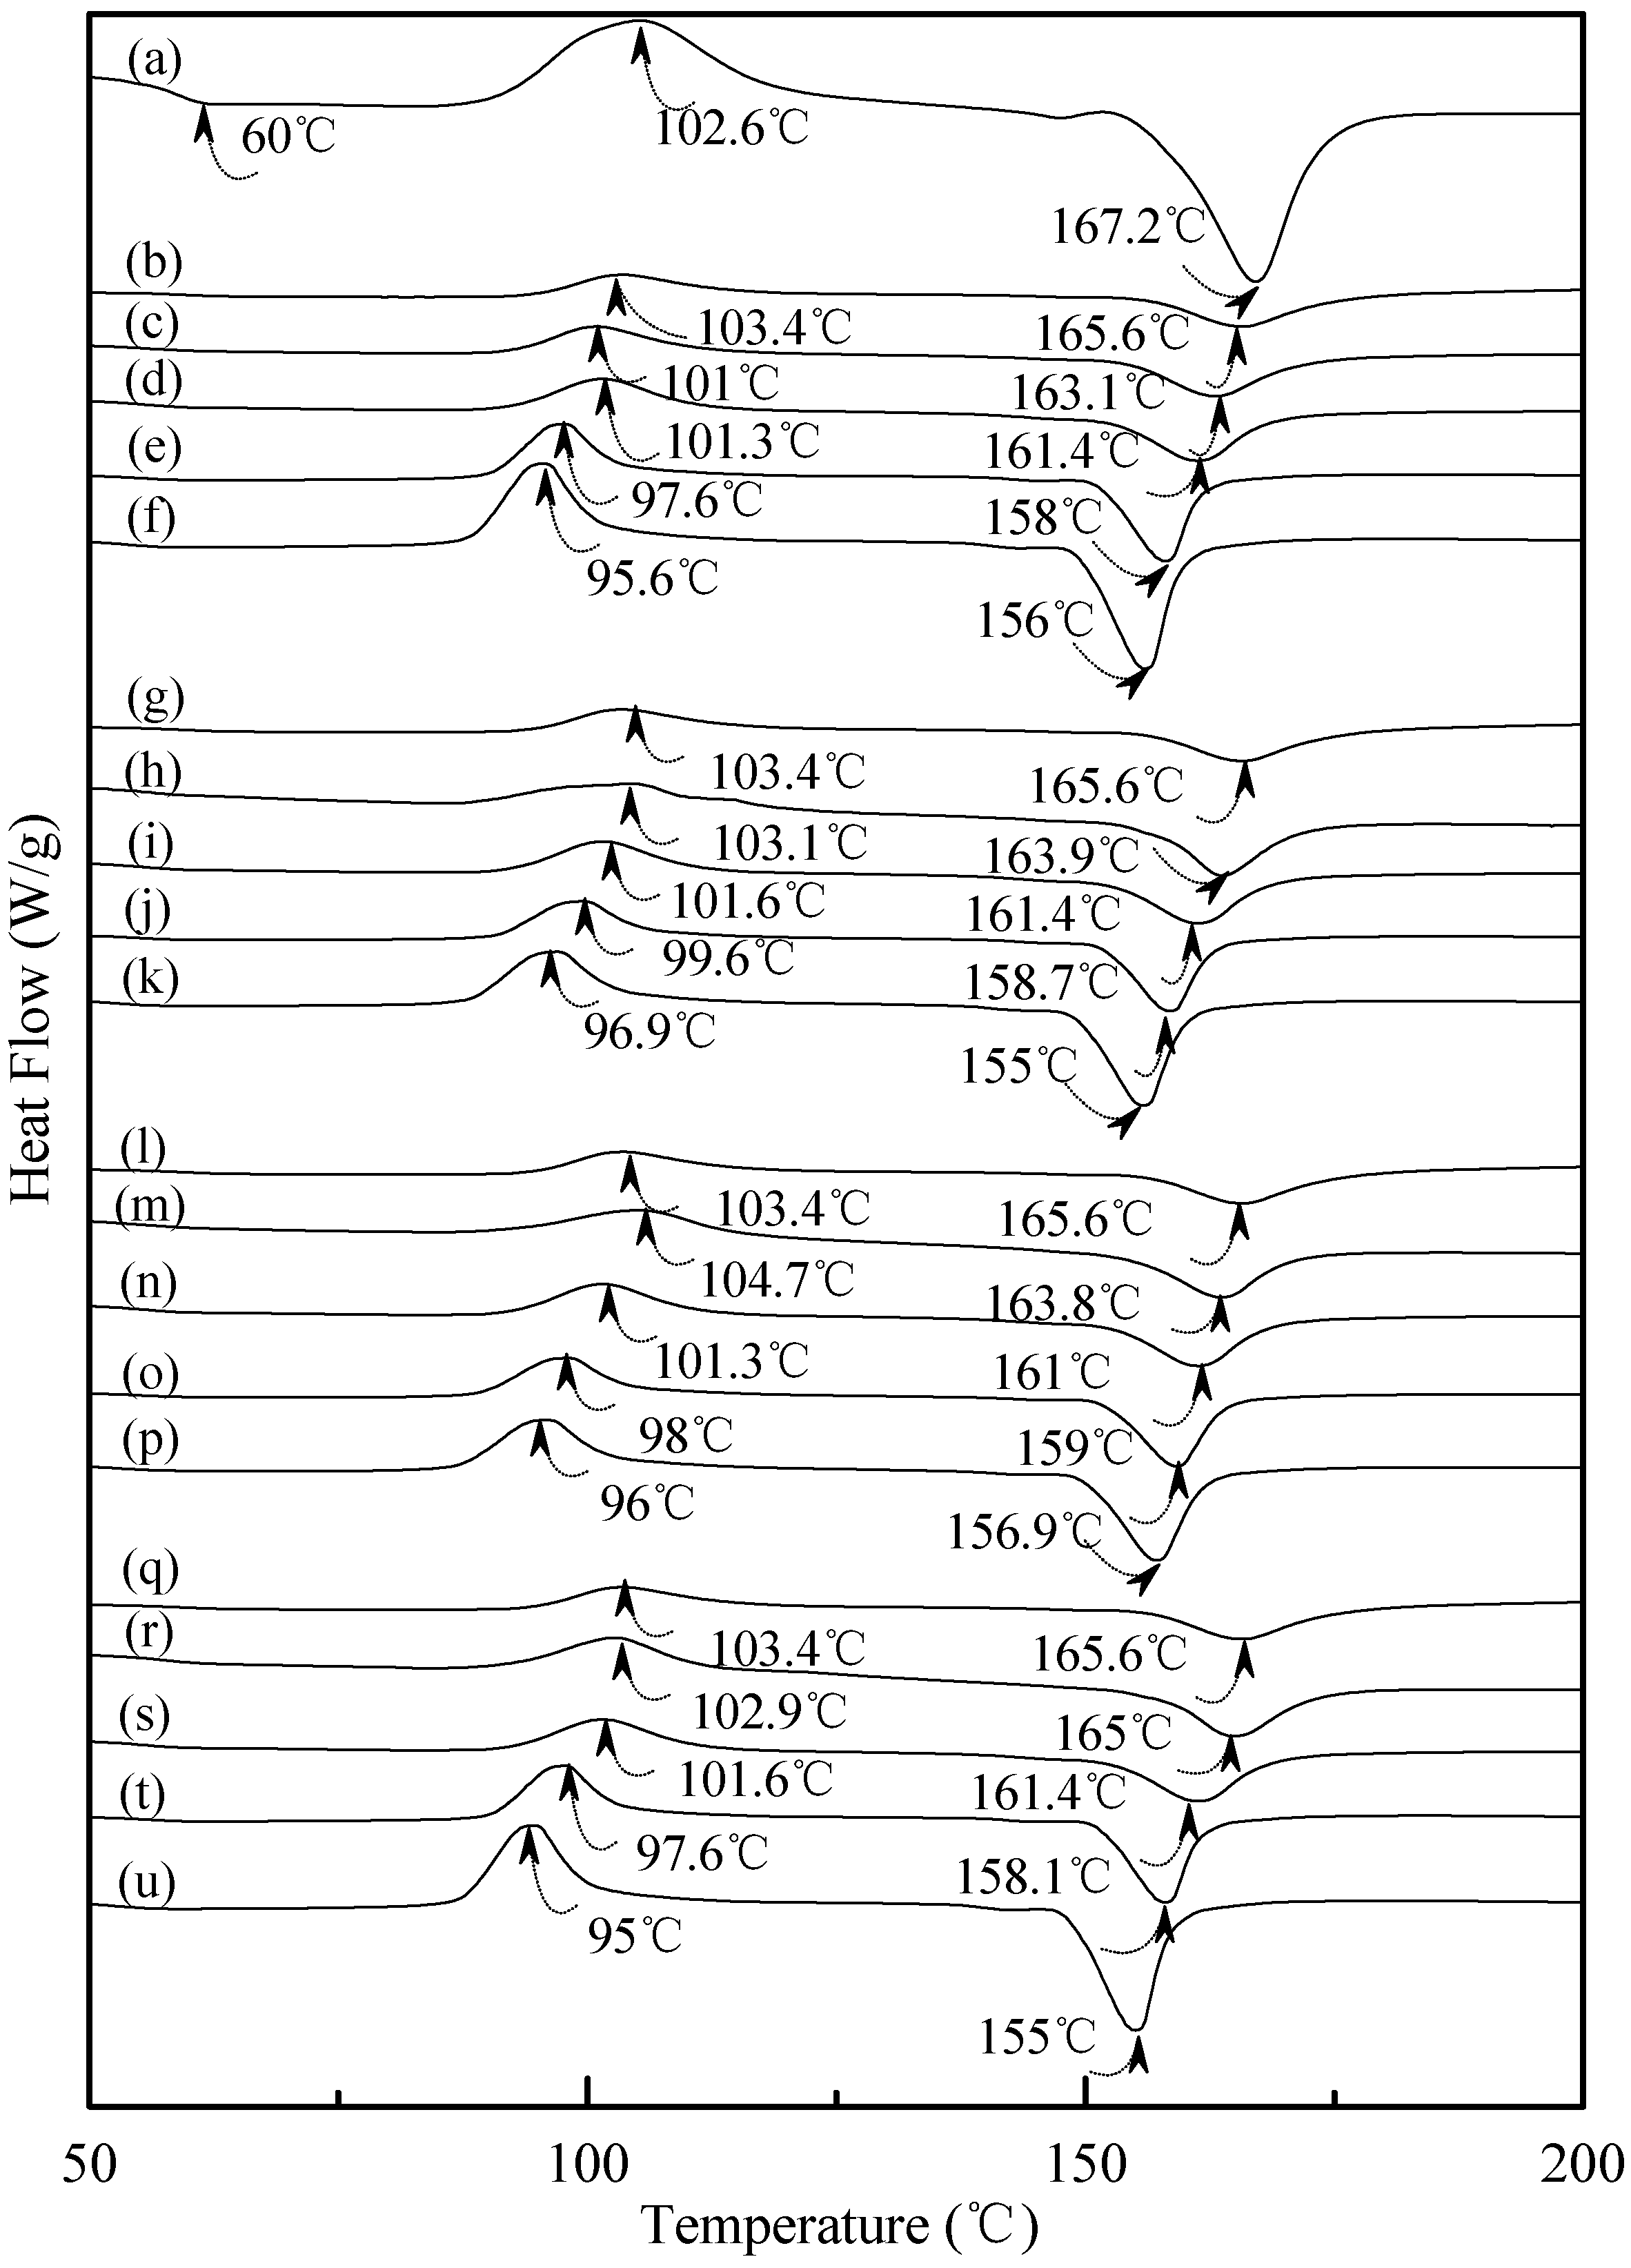
Figure 7 exhibited typical DSC thermograms of (TPS
100BC
0.02SHMP
x)
75PLA
25 specimens. As shown in
Figure 7a, a distinguished melting endotherm with a peak melting temperature 167.2 °C was found on the DSC thermogram of PLA specimen. Moreover, a glass transition at 60.0 °C and a recrystallization exotherm with a peak temperature at 102.6 °C was found on the DSC thermogram of PLA specimen. After blending 25 wt % PLA with TPS
100BC
0.02SHMP
x, the DSC thermograms of (TPS
100BC
0.02SHMP
x)
75PLA
25 series specimens look nearly the same as the integration of thermograms of PLA and corresponding TPS
100BC
0.02SHMP
x specimens, respectively. It is interesting to note that thermograms of conditioned (TPS
100BC
0.02SHMP
x)
75PLA
25 specimens remained relatively unchanged regardless of their conditioning time at 20 °C/50% RH. In contrast to those TPS
100BC
0.02SHMP
x specimens conditioned at 20 °C/50% RH for 28 or 56 days, one can barely find the newly developed melting endotherm on thermograms of (TPS
100BC
0.02SHMP
x)
75PLA
25 specimens, even when they were conditioned at 20 °C/50% RH for 56 days.
Figure 7.
DSC thermograms of (a) PLA, (TPS100BC0.02SHMP4)75PLA25 specimens conditioned at 20 °C/50% RH for (b) 0; (c) 7; (d) 14; (e) 28 and (f) 56 days respectively; (TPS100BC0.02SHMP8)75PLA25 specimens conditioned at 20 °C/50% RH for (g) 0; (h) 7; (i) 14; (j) 28 and (k)56 days, respectively; (TPS100BC0.02SHMP10)75PLA25 specimens conditioned at 20 °C/50% RH for (l) 0; (m) 7; (n) 14; (o) 28 and (p) 56 days, respectively; and (TPS100BC0.02SHMP16)75PLA25 specimens conditioned at 20 °C/50% RH for (q) 0; (r) 7; (s) 14; (t) 28 and (u) 56 days, respectively.
3.5. Wide Angle X-ray Diffraction
Typical wide angle X-ray diffraction (WAXD) patterns of tapioca, initial and conditioned TPS, TPS
100BC
0.02, TPS
100BC
0.02SHMP
x, (TPS
100BC
0.02SHMP
x)
75PLA
25 and PLA specimens are shown in
Figure 8,
Figure 9 and
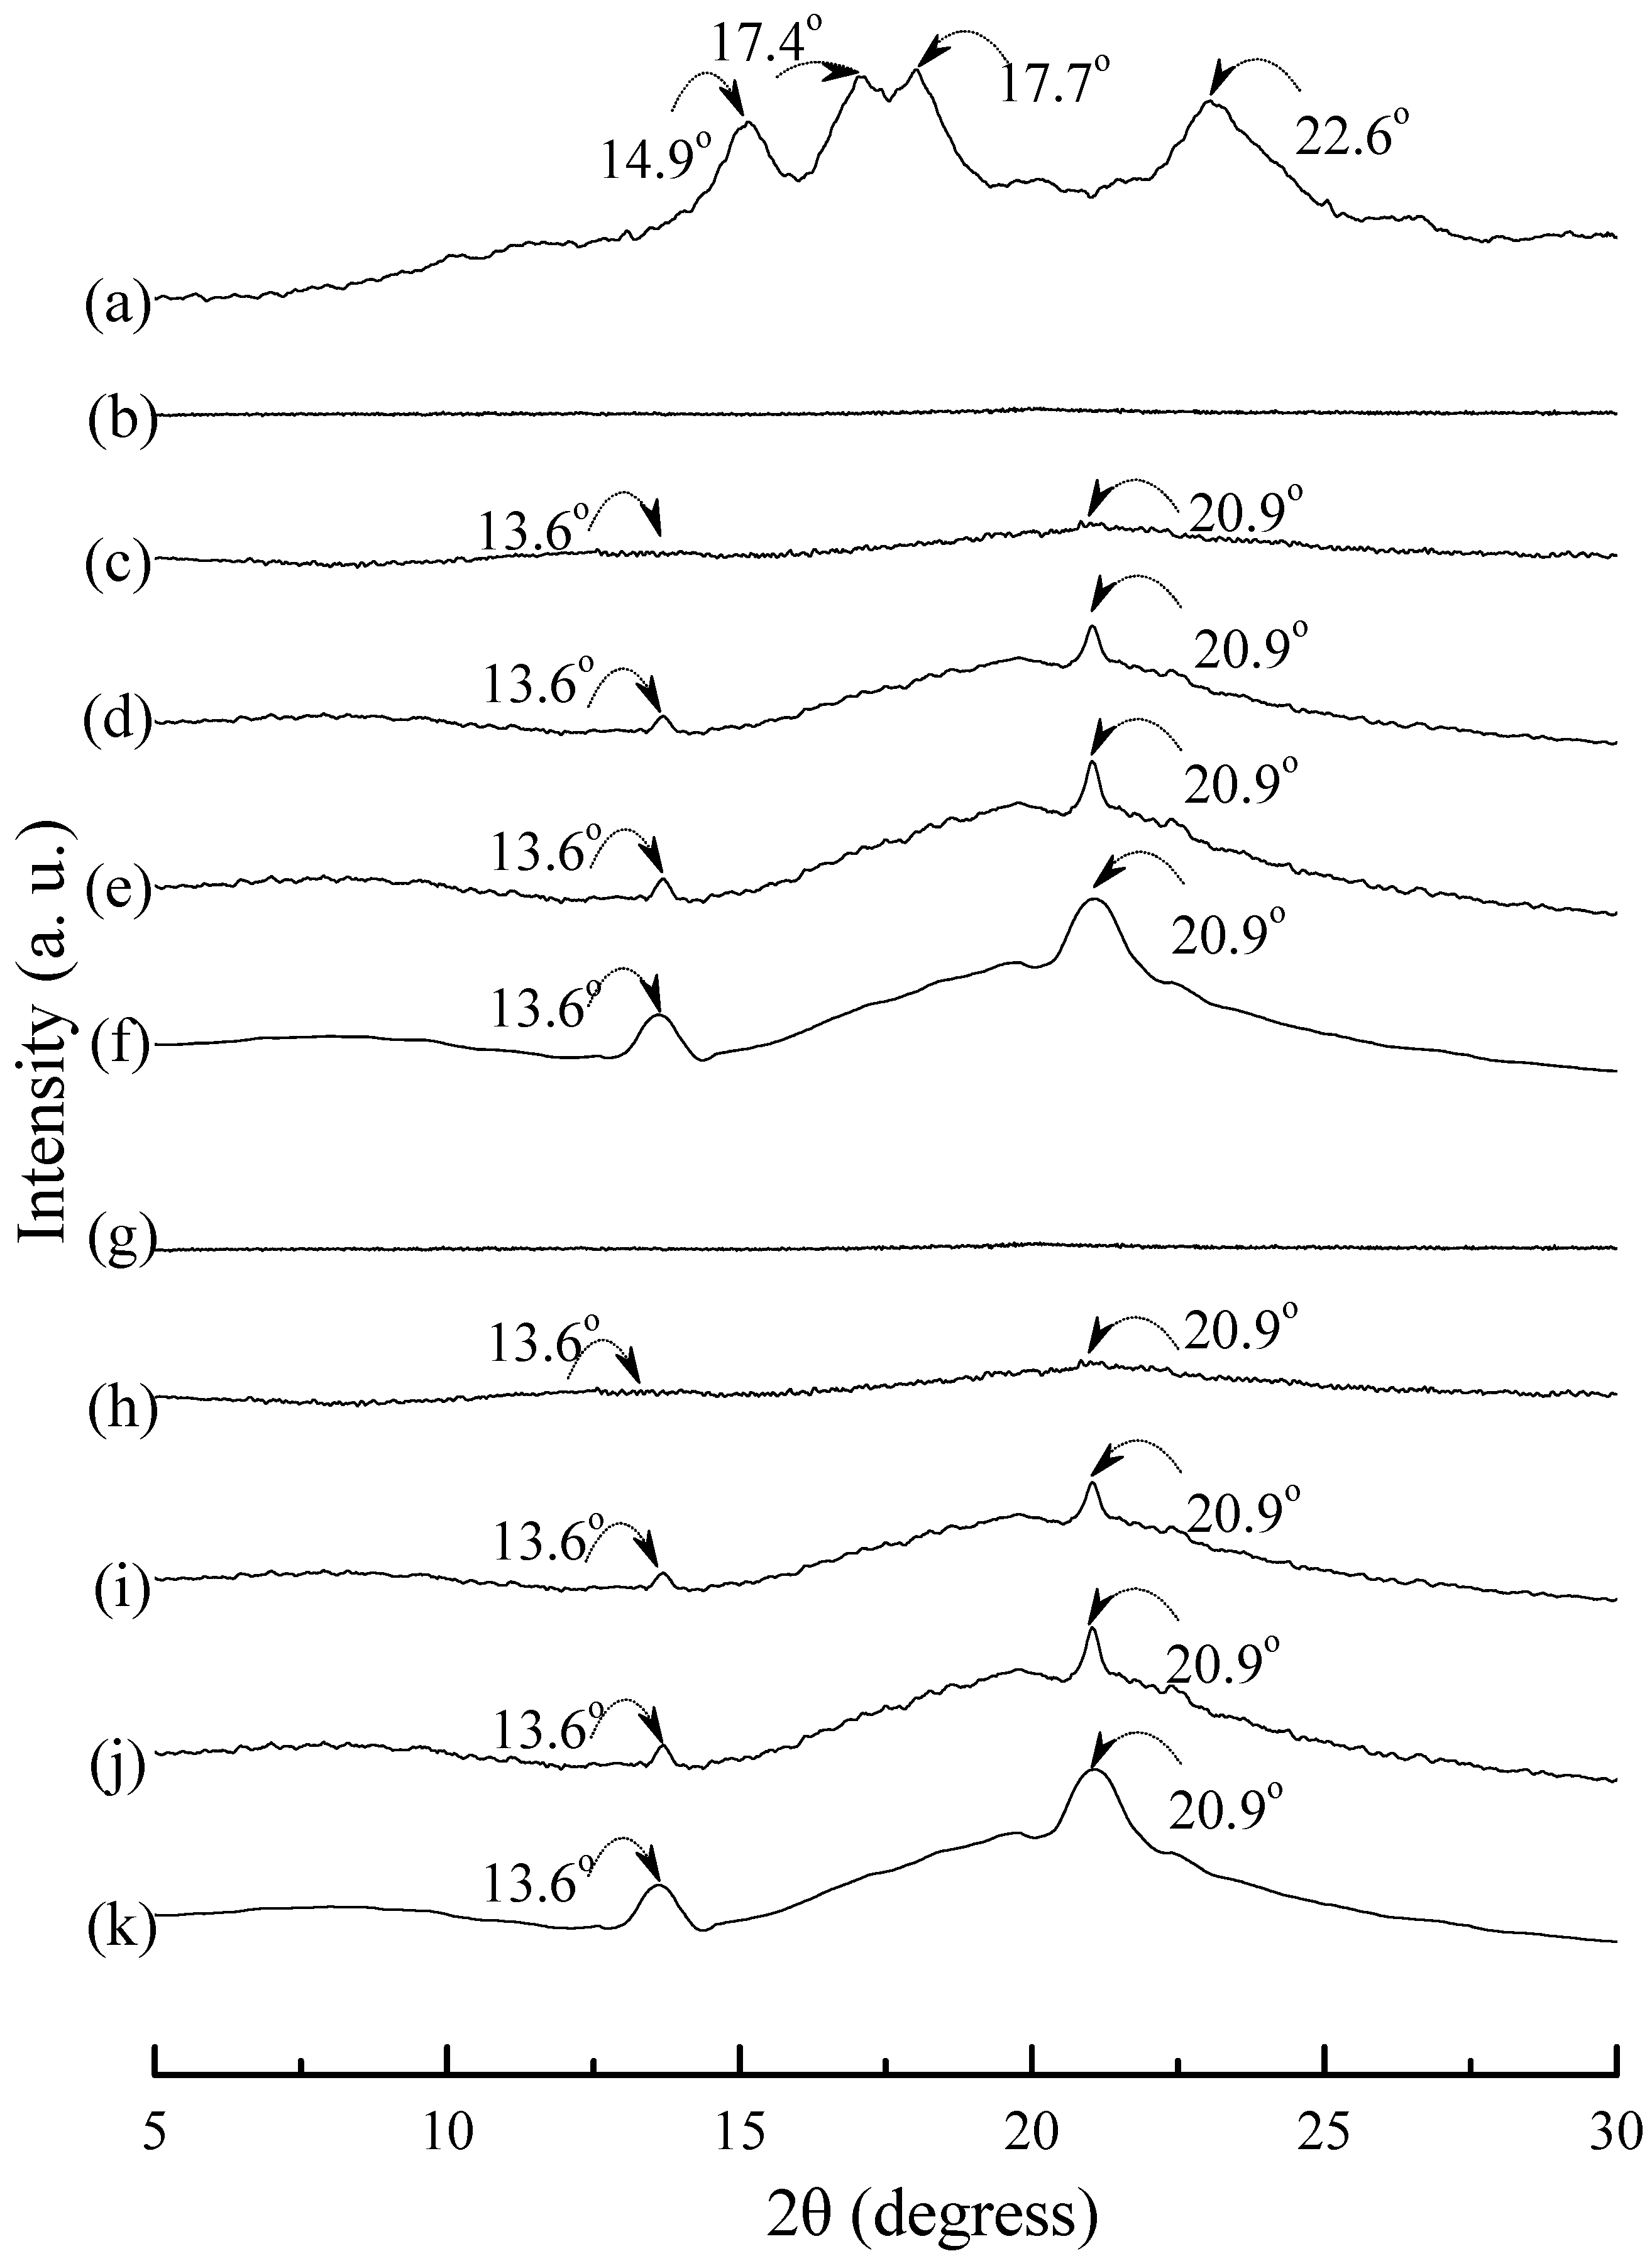
Figure 10. As shown in
Figure 8a, distinguished diffraction peaks centered at 14.9°, 17.4°, 17.7° and 22.6° were found on WAXD diffraction patterns of tapioca starches. These diffraction peaks most likely correspond to A-type starch crystals with strong reflections at 2θ around 14.8° and an unresolved doublet at around 17° and 22.6° [
37,
52,
53]. After gelatinization, the diffraction peaks corresponding to A-type starch crystals disappeared near completely on the WAXD diffraction pattern of the initial TPS, and TPS
100BC
0.02 specimens (see
Figure 8b–g). Two new diffraction peaks centered at 2θ = 13.6° and 20.9° appeared gradually on WAXD patterns of TPS and TPS
100BC
0.02 specimens, respectively, after they were conditioned at 20 °C/50% RH for 7 days or more than 7 days. In fact, the sizes of two new diffraction peaks grew significantly, as the conditioning time increased from 0 to 56 days (see
Figure 8b–f and
Figure 8g–k). The two new diffraction peaks were reported to originate from diffraction of V
H-type crystallinity [
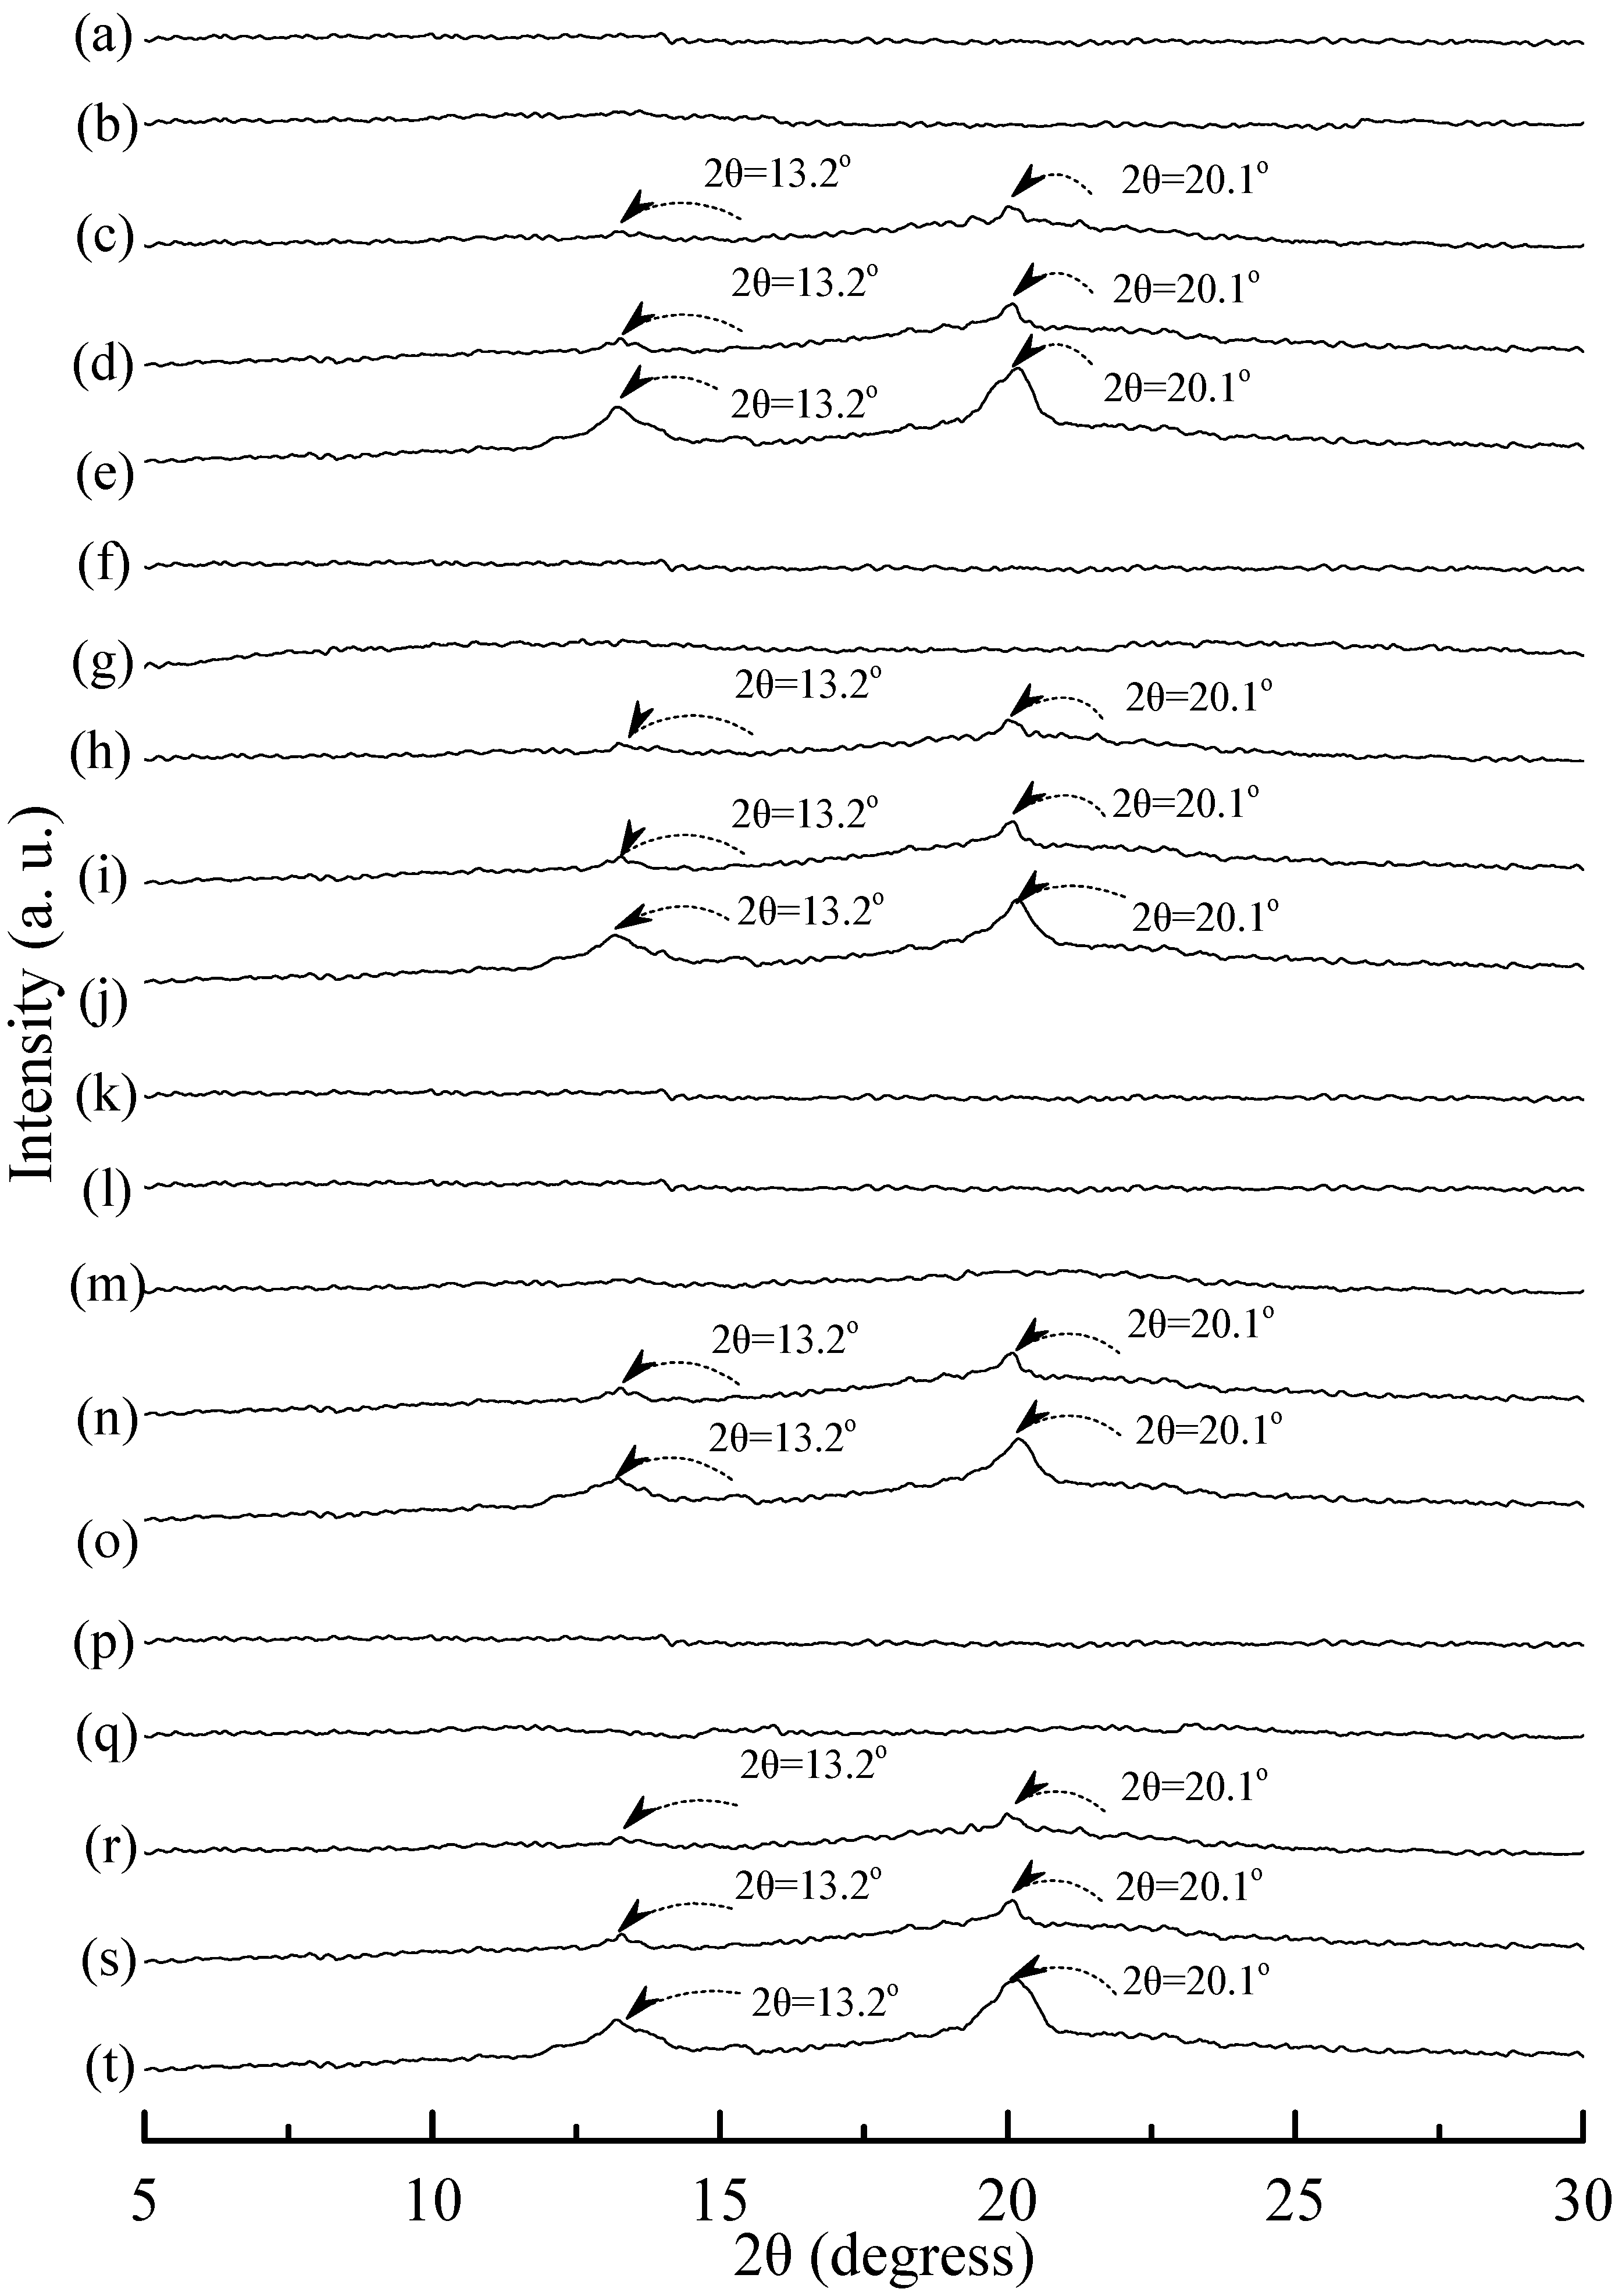
29], which was induced during their plasticization processes. In contrast, one can barely find the two new diffraction peaks on WAXD patterns of TPS
100BC
0.02SHMP
x specimens conditioned at 20 °C/50% RH for less than 14 days (see
Figure 9). The two new diffraction peaks of most of TPS
100BC
0.02SHMP
x specimens reappeared and grew gradually, as the conditioning time were equal to or more than 14 days (see
Figure 9c–e, h–j, n–o and r–t). In which, WAXD patterns of TPS
100BC
0.02SHMP
10 specimen remained relatively smooth without any diffraction peak even after conditioning at 20 °C/50% RH for less than 28 days (see
Figure 9k–m).
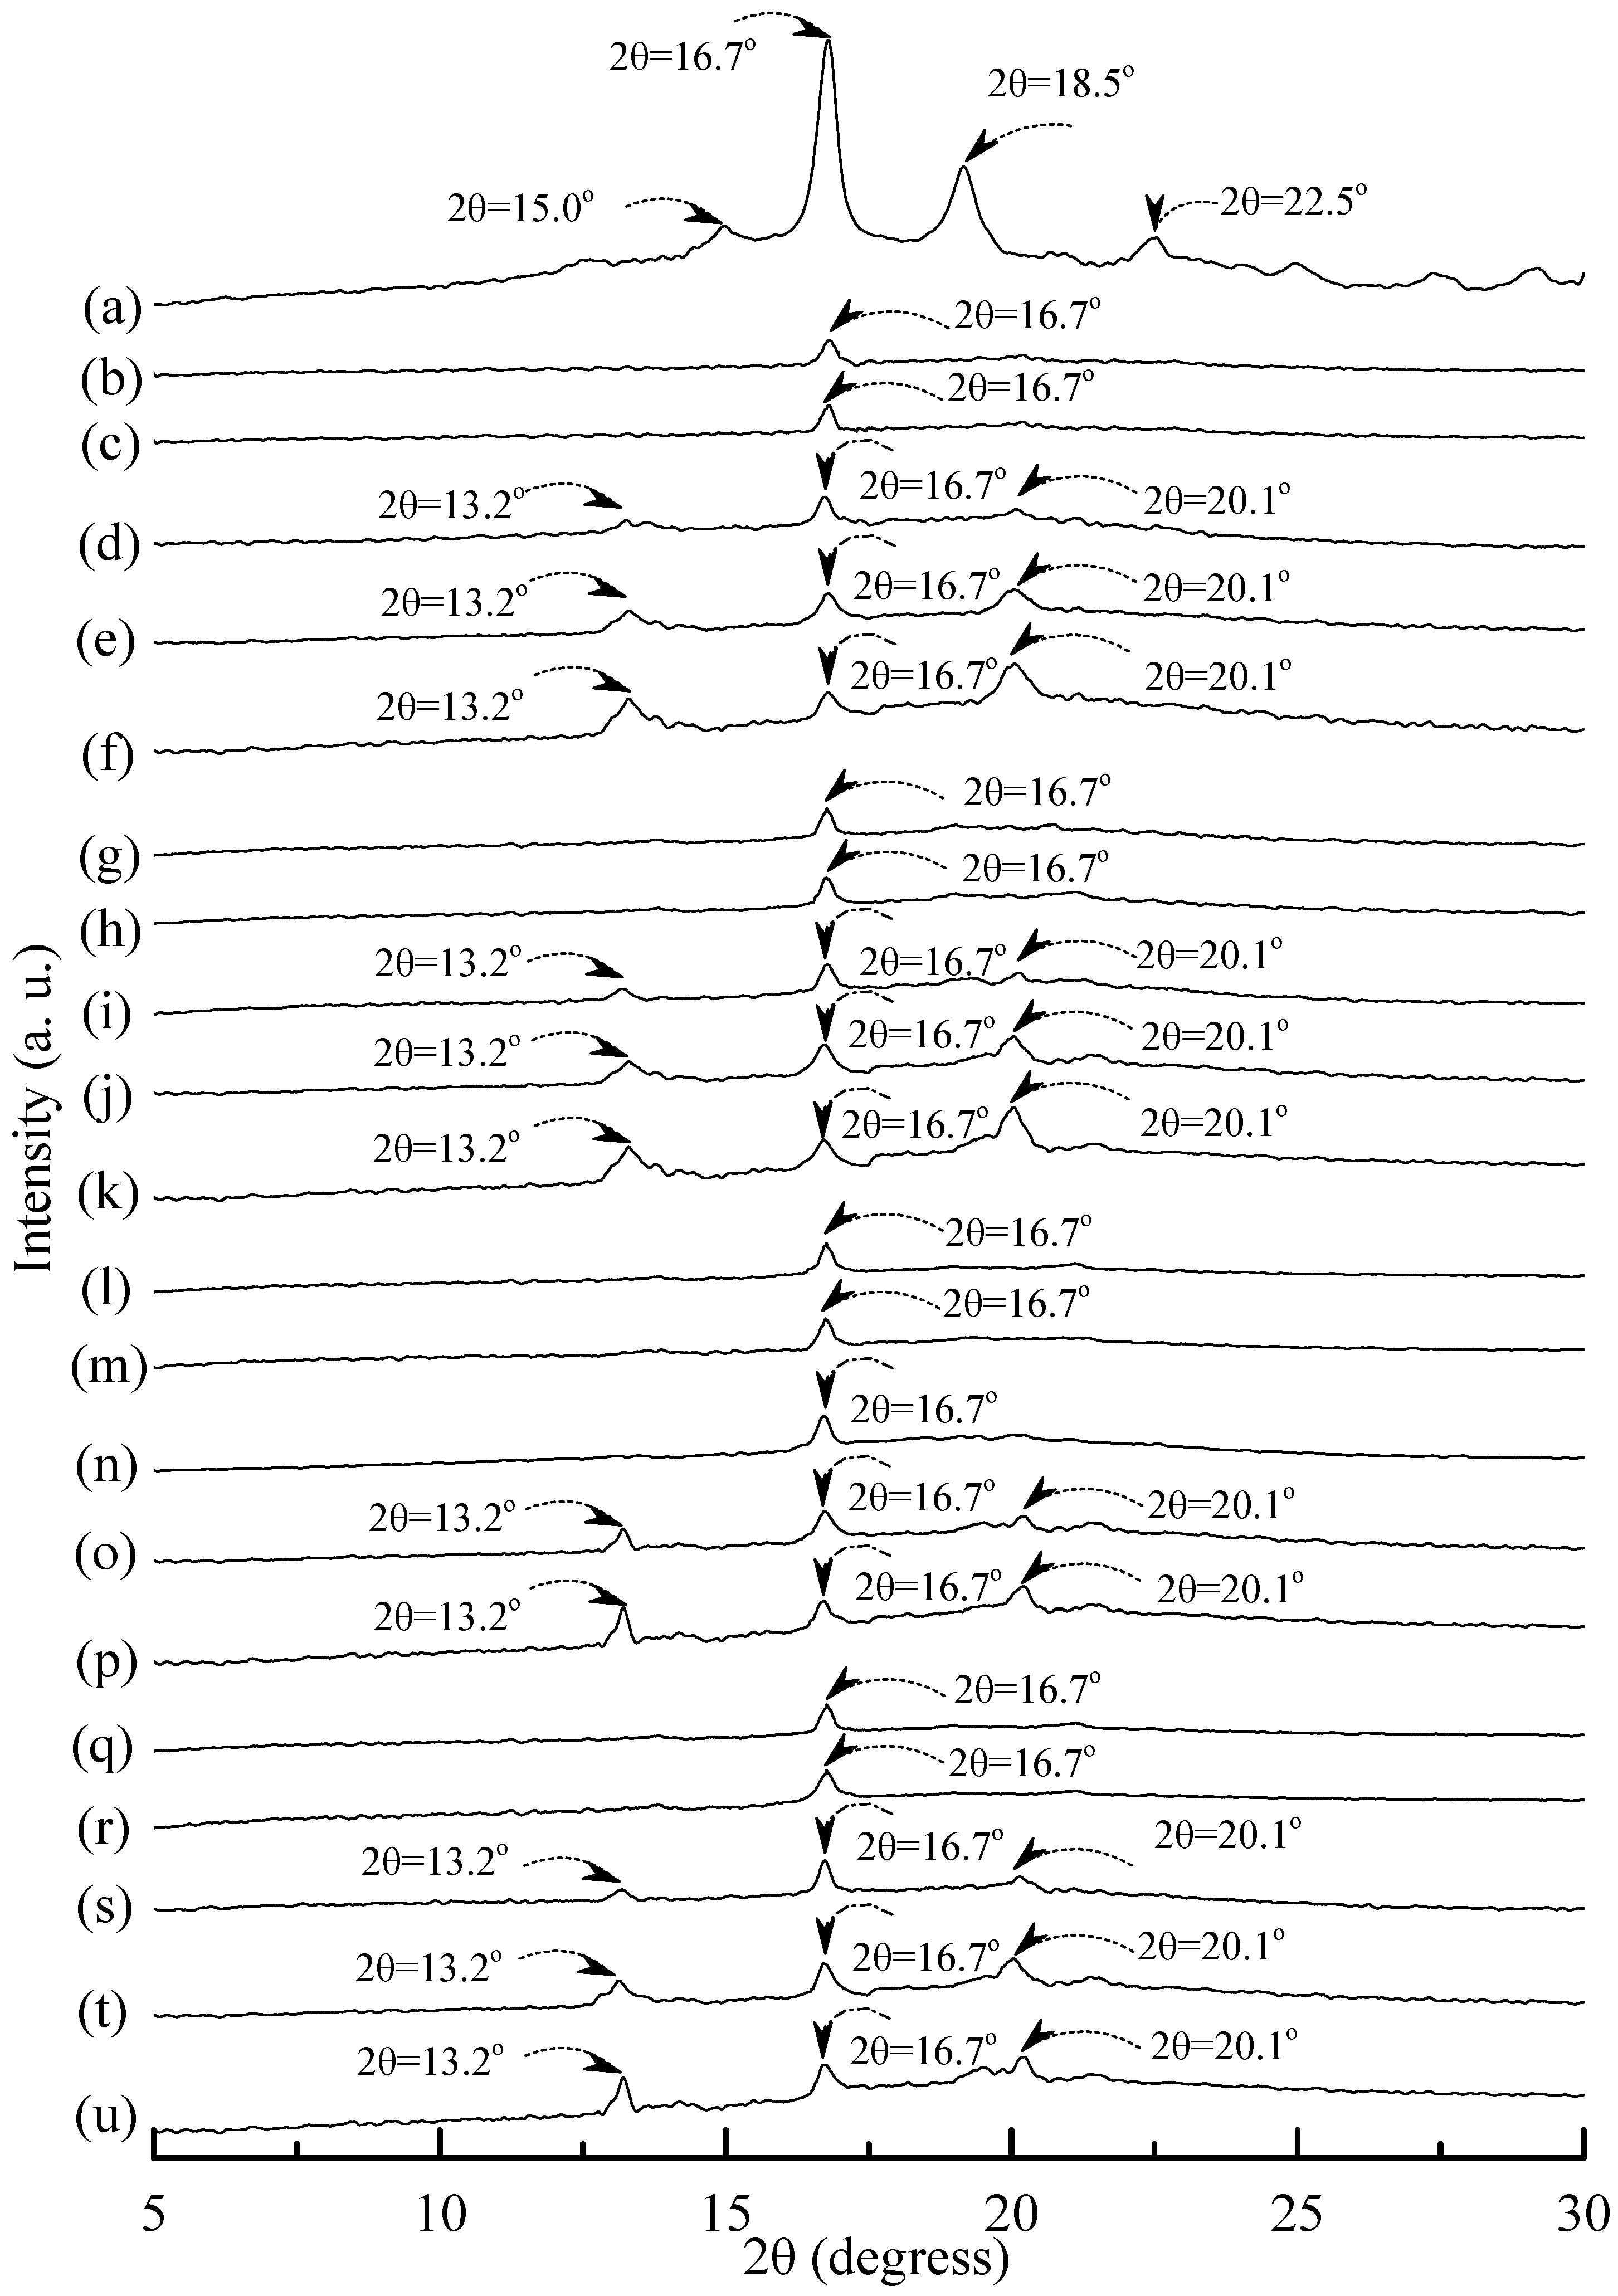
Distinguishable diffraction peaks centered at 2θ = 15°, 16.7°, 18.5° and 22.5° were found on the WAXD pattern of the PLA specimen (see
Figure 10a). These diffraction peaks were reported to originate from the diffraction of α form PLA crystals [
54]. After blending 25 wt % PLA with TPS
100BC
0.02SHMP
x, one can only find a weak diffraction peak centered at 16.7° on WAXD diffraction patterns of (TPS
100BC
0.02SHMP
x)
75PLA
25 specimens (see
Figure 10). No additional diffraction peak was found on WAXD patterns of (TPS
100BC
0.02SHMP
x)
75PLA
25 specimens, when they were conditioned at 20 °C/50% RH for less than 14 days. Two new diffraction peaks centered at 2θ = 13.2° and 20.1° gradually appeared on WAXD patterns of (TPS
100BC
0.02SHMP
x)
75PLA
25 specimens conditioned at 20 °C/50% RH for 14 days or more than 14 days.
WAXD analyses revealed that A-type starch crystals originally present in granular tapioca starches were completely dismantled during their gelatinization processes. The new melting endotherm and diffraction peaks of VH-type crystals found in DSC thermograms and WAXD patterns of conditioned TPS or TPS100BC0.02 specimens, respectively, was attributed to the significant retrogradation of tapioca starch molecules occurred during their conditioning processes. During retrogradation, recrystallization of tapioca starch molecules of TPS and/or TPS100BC0.02 specimens occurred significantly in moisture rich environment, since TPS or TPS100BC0.02 specimens can easily absorb moisture during their conditioning processes. However, one can barely find any new melting endotherm or diffraction peaks on DSC thermograms or WAXD patterns of TPS100BC0.02SHMPx and/or (TPS100BC0.02SHMPx)75PLA25 specimens, respectively, even after they were conditioned at 20 °C/50% RH for less than 28 days. Apparently, this is due to the significant improvement in waterproof properties of the TPS100BC0.02SHMPx and/or (TPS100BC0.02SHMPx)75PLA25 specimens, since the moisture-absorbing hydroxyl groups of starch molecules were successfully reacted with the phosphate groups of SHMP molecules during the modification processes of TPS100BC0.02SHMPx specimens.
Figure 8.
Wide-angle X-ray diffraction patterns of (a) tapioca, TPS specimens conditioned at 20 °C/50% RH for (b) 0; (c) 7; (d) 14; (e) 28 and (f) 56 days, respectively; and TPS100BC0.02 specimens conditioned at 20 °C/50% RH for (g) 0; (h) 7; (i) 14; (j) 28 and (k) 56 days, respectively.
Figure 8.
Wide-angle X-ray diffraction patterns of (a) tapioca, TPS specimens conditioned at 20 °C/50% RH for (b) 0; (c) 7; (d) 14; (e) 28 and (f) 56 days, respectively; and TPS100BC0.02 specimens conditioned at 20 °C/50% RH for (g) 0; (h) 7; (i) 14; (j) 28 and (k) 56 days, respectively.
Figure 9.
Wide-angle X-ray diffraction patterns of TPS100BC0.02SHMP4 specimens conditioned at 20 °C/50% RH for (a) 0; (b) 7; (c) 14; (d) 28 and (e) 56 days respectively; TPS100BC0.02SHMP8 specimens conditioned at 20 °C/50% RH for (f) 0; (g) 7; (h) 14; (i) 28 and (j)56 days, respectively; TPS100BC0.02SHMP10 specimens conditioned at 20 °C/50% RH for (k) 0; (l) 7; (m) 14; (n) 28 and (o) 56 days, respectively; and TPS100BC0.02SHMP16 specimens conditioned at 20 °C/50% RH for (p) 0; (q) 7; (r) 14; (s) 28 and (t) 56 days, respectively.
Figure 10.
Wide-angle X-ray diffraction patterns of (a) PLA, (TPS100BC0.02SHMP4)75PLA25 specimens conditioned at 20 °C/50% RH for (b) 0; (c) 7; (d) 14; (e) 28 and (f) 56 days respectively; (TPS100BC0.02SHMP8)75PLA25 specimens conditioned at 20 °C/50% RH for (g) 0; (h) 7; (i) 14; (j) 28 and (k)56 days, respectively; (TPS100BC0.02SHMP10)75PLA25 specimens conditioned at 20 °C/50% RH for (l) 0; (m) 7; (n) 14; (o) 28 and (p) 56 days, respectively; and (TPS100BC0.02SHMP16)75PLA25 specimens conditioned at 20 °C/50% RH for (q) 0; (r) 7; (s) 14; (t) 28 and (u) 56 days, respectively.
3.6. Tensile and Tensile Retention Properties
The initial and retention values of tensile strength (σ
f) and elongation at break (ɛ
f) of TPS, TPS
100BC
0.02, TPS
100BC
0.02SHMP
x and (TPS
100BC
0.02SHMP
x)
75PLA
25 specimens are summarized in
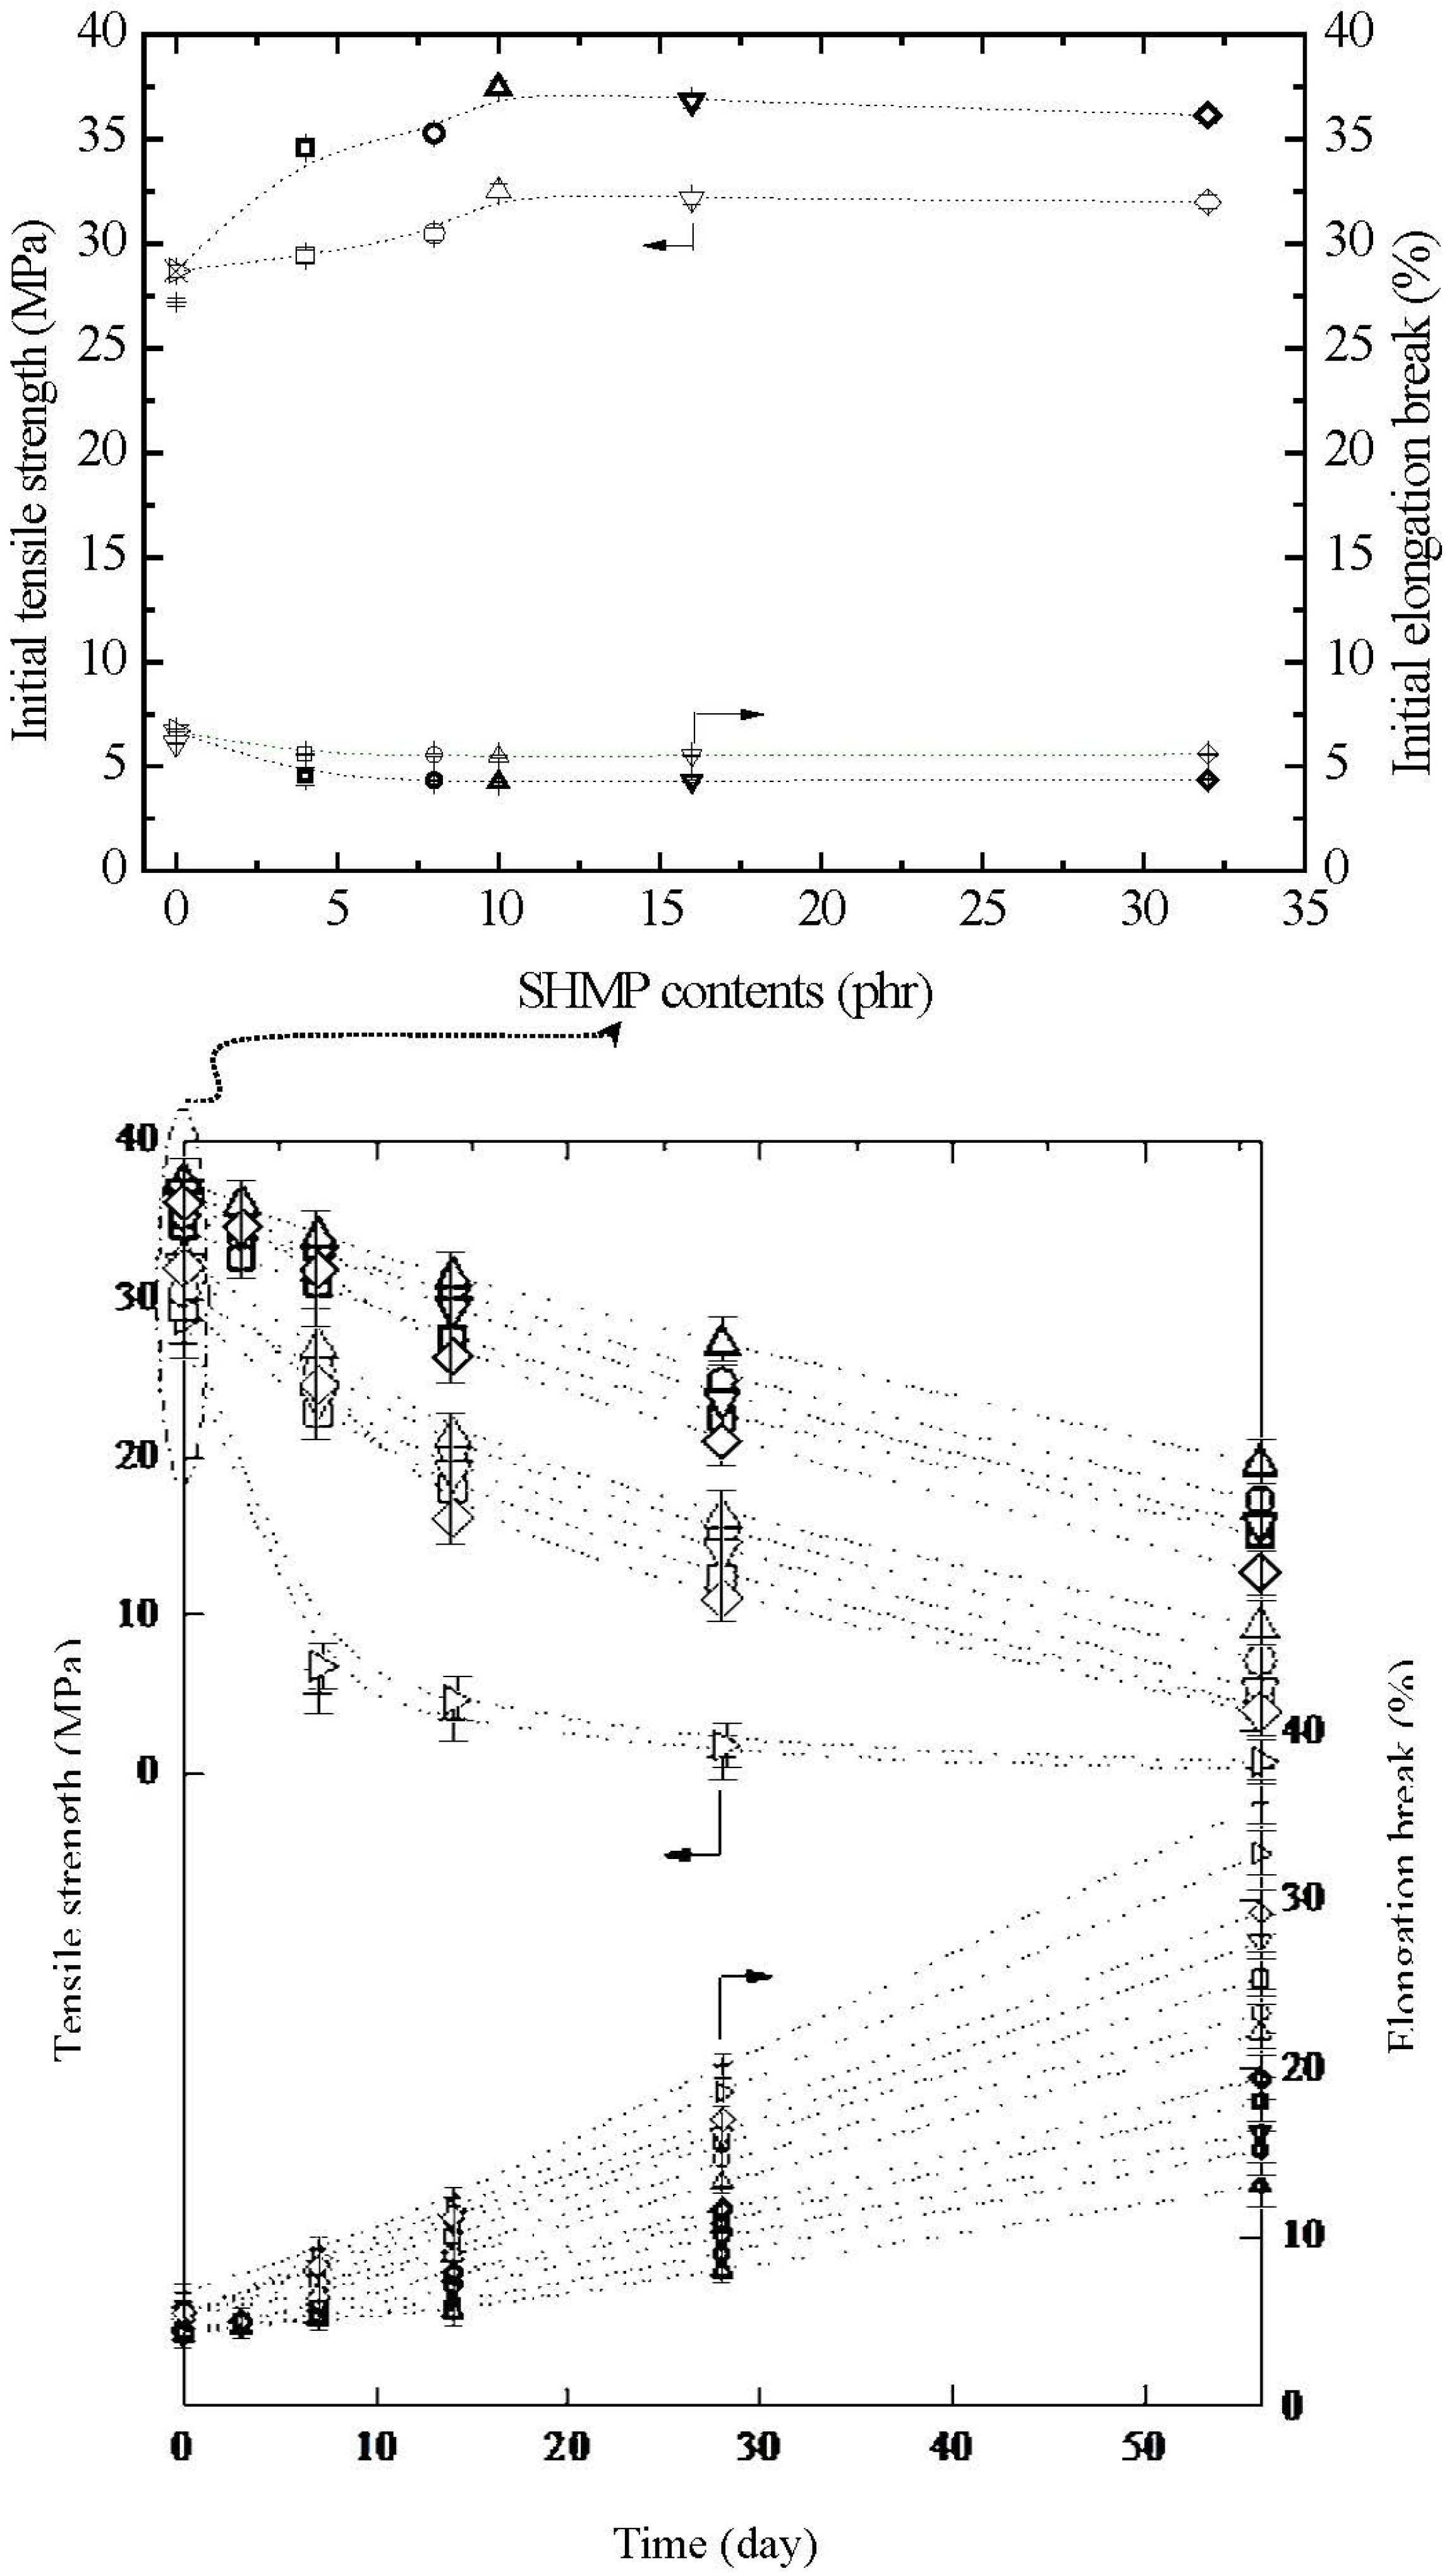
Figure 11. Relatively high σ
f and ɛ
f values at 27.2 MPa/6.7% and 28.7 MPa/6.1% were found for the initial TPS and TPS
100BC
0.02 specimens, respectively. However, after maintaining the specimens at 20 °C/50% RH for certain amounts of time, the σ
f retention values of TPS and TPS
100BC
0.02 specimens were reduced rapidly from 27.2 MPa/28.7 MPa to 5.1 MPa/6.8 MPa to 1.3 MPa/1.8 MPa and then to 0.3 MPa/0.6 MPa, respectively, as the conditioning time increased from 0 to 7, 28 and to 56 days. In contrast, the ɛ
f retention values of of TPS and TPS
100BC
0.02 specimens increased significantly from 6.7%/6.1% to 9.3%/8.8%, 20.2%/18.6% and then to 35.8%/32.8%, respectively, as the conditioning time increased from 0 to 7, 28 and to 56 days. Apparently, initial and conditioned TPS
100BC
0.02 specimen with very small amounts of BC nanofibers exhibited significantly higher σ
f values but lower ɛ
f values than those of corresponding TPS specimens conditioned at 20 °C/50% RH for the same amounts of time.
After modification with varying amounts of SHMP during TPS
100BC
0.02 gelatinization processes, the σ
f and ɛ
f values of initial TPS
100BC
0.02SHMP
x and (TPS
100BC
0.02SHMP
x)
75PLA
25 specimens increased and reduced significantly to a maximal and minimal value at 32.5 MPa/37.4 MPa and 5.5%/4.3%, respectively, as their SHMP contents reached an optimal value at 10 phr. However, after conditioning at 20 °C/50% RH for varying amounts of time, the σ
f retention values of TPS
100BC
0.02SHMP
x and (TPS
100BC
0.02SHMP
x)
75PLA
25 specimens were significantly higher than those of TPS and TPS
100BC
0.02 specimens conditioned for the same amounts of time, whereas significantly lower ɛ
f retention values were found for conditioned TPS
100BC
0.02SHMP
x and (TPS
100BC
0.02SHMP
x)
75PLA
25 specimens than those of TPS and TPS
100BC
0.02 specimens conditioned for the same amounts of time. Conditioned (TPS
100BC
0.02SHMP
x)
75PLA
25 specimens exhibited significantly higher σ
f but lower ɛ
f retention values than corresponding TPS
100BC
0.02SHMP
x specimens conditioned for the same amounts of time but without blending with 25 wt % of PLA (see
Figure 11). Moreover, it is noteworthy that conditioned TPS
100BC
0.02SHMP
10 or (TPS
100BC
0.02SHMP
10)
75PLA
25 specimens exhibited the highest σ
f but the lowest ɛ
f retention values than other TPS
100BC
0.02SHMP
x or (TPS
100BC
0.02SHMP
x)
75PLA
25 specimens conditioned for the same amounts of time but modified with SHMP contents other than 10 phr, respectively. In fact, after conditioning at 20 °C/50% RH for 56 days, the σ
f and ɛ
f retention values of (TPS
100BC
0.02SHMP
10)
75PLA
25 specimen remained at 19.5 MPa and 13.1%, respectively, which is equivalent to 52% and 3.1 times its initial σ
f and ɛ
f value, respectively, and is 32.5 times and 40% those of TPS
100BC
0.02 specimen conditioned for 56 days, respectively.
Figure 11.
Tensile strength and elongation at break of initial and conditioned TPS (+,+), TPS100BC0.02 (▷,▷), TPS100BC0.02SHMP4 (□,□), TPS100BC0.02SHMP8 (○,○), TPS100BC0.02 SHMP10 (△,△), TPS100BC0.02SHMP16 (▽,▽), TPS100BC0.02SHMP32 (◇,◇), (TPS100BC0.02SHMP4)75PLA25 (□,□), (TPS100BC0.02SHMP8)75PLA25 (○,○), (TPS100BC0.02SHMP10)75PLA25 (△,△), (TPS100BC0.02SHMP16)75PLA25 (▽,▽) and (TPS100BC0.02SHMP32)75PLA25 (◇,◇) specimens conditioned at 20 °C/50% RH for varying amounts of time. (Symbol (Ι) represents the error bar).
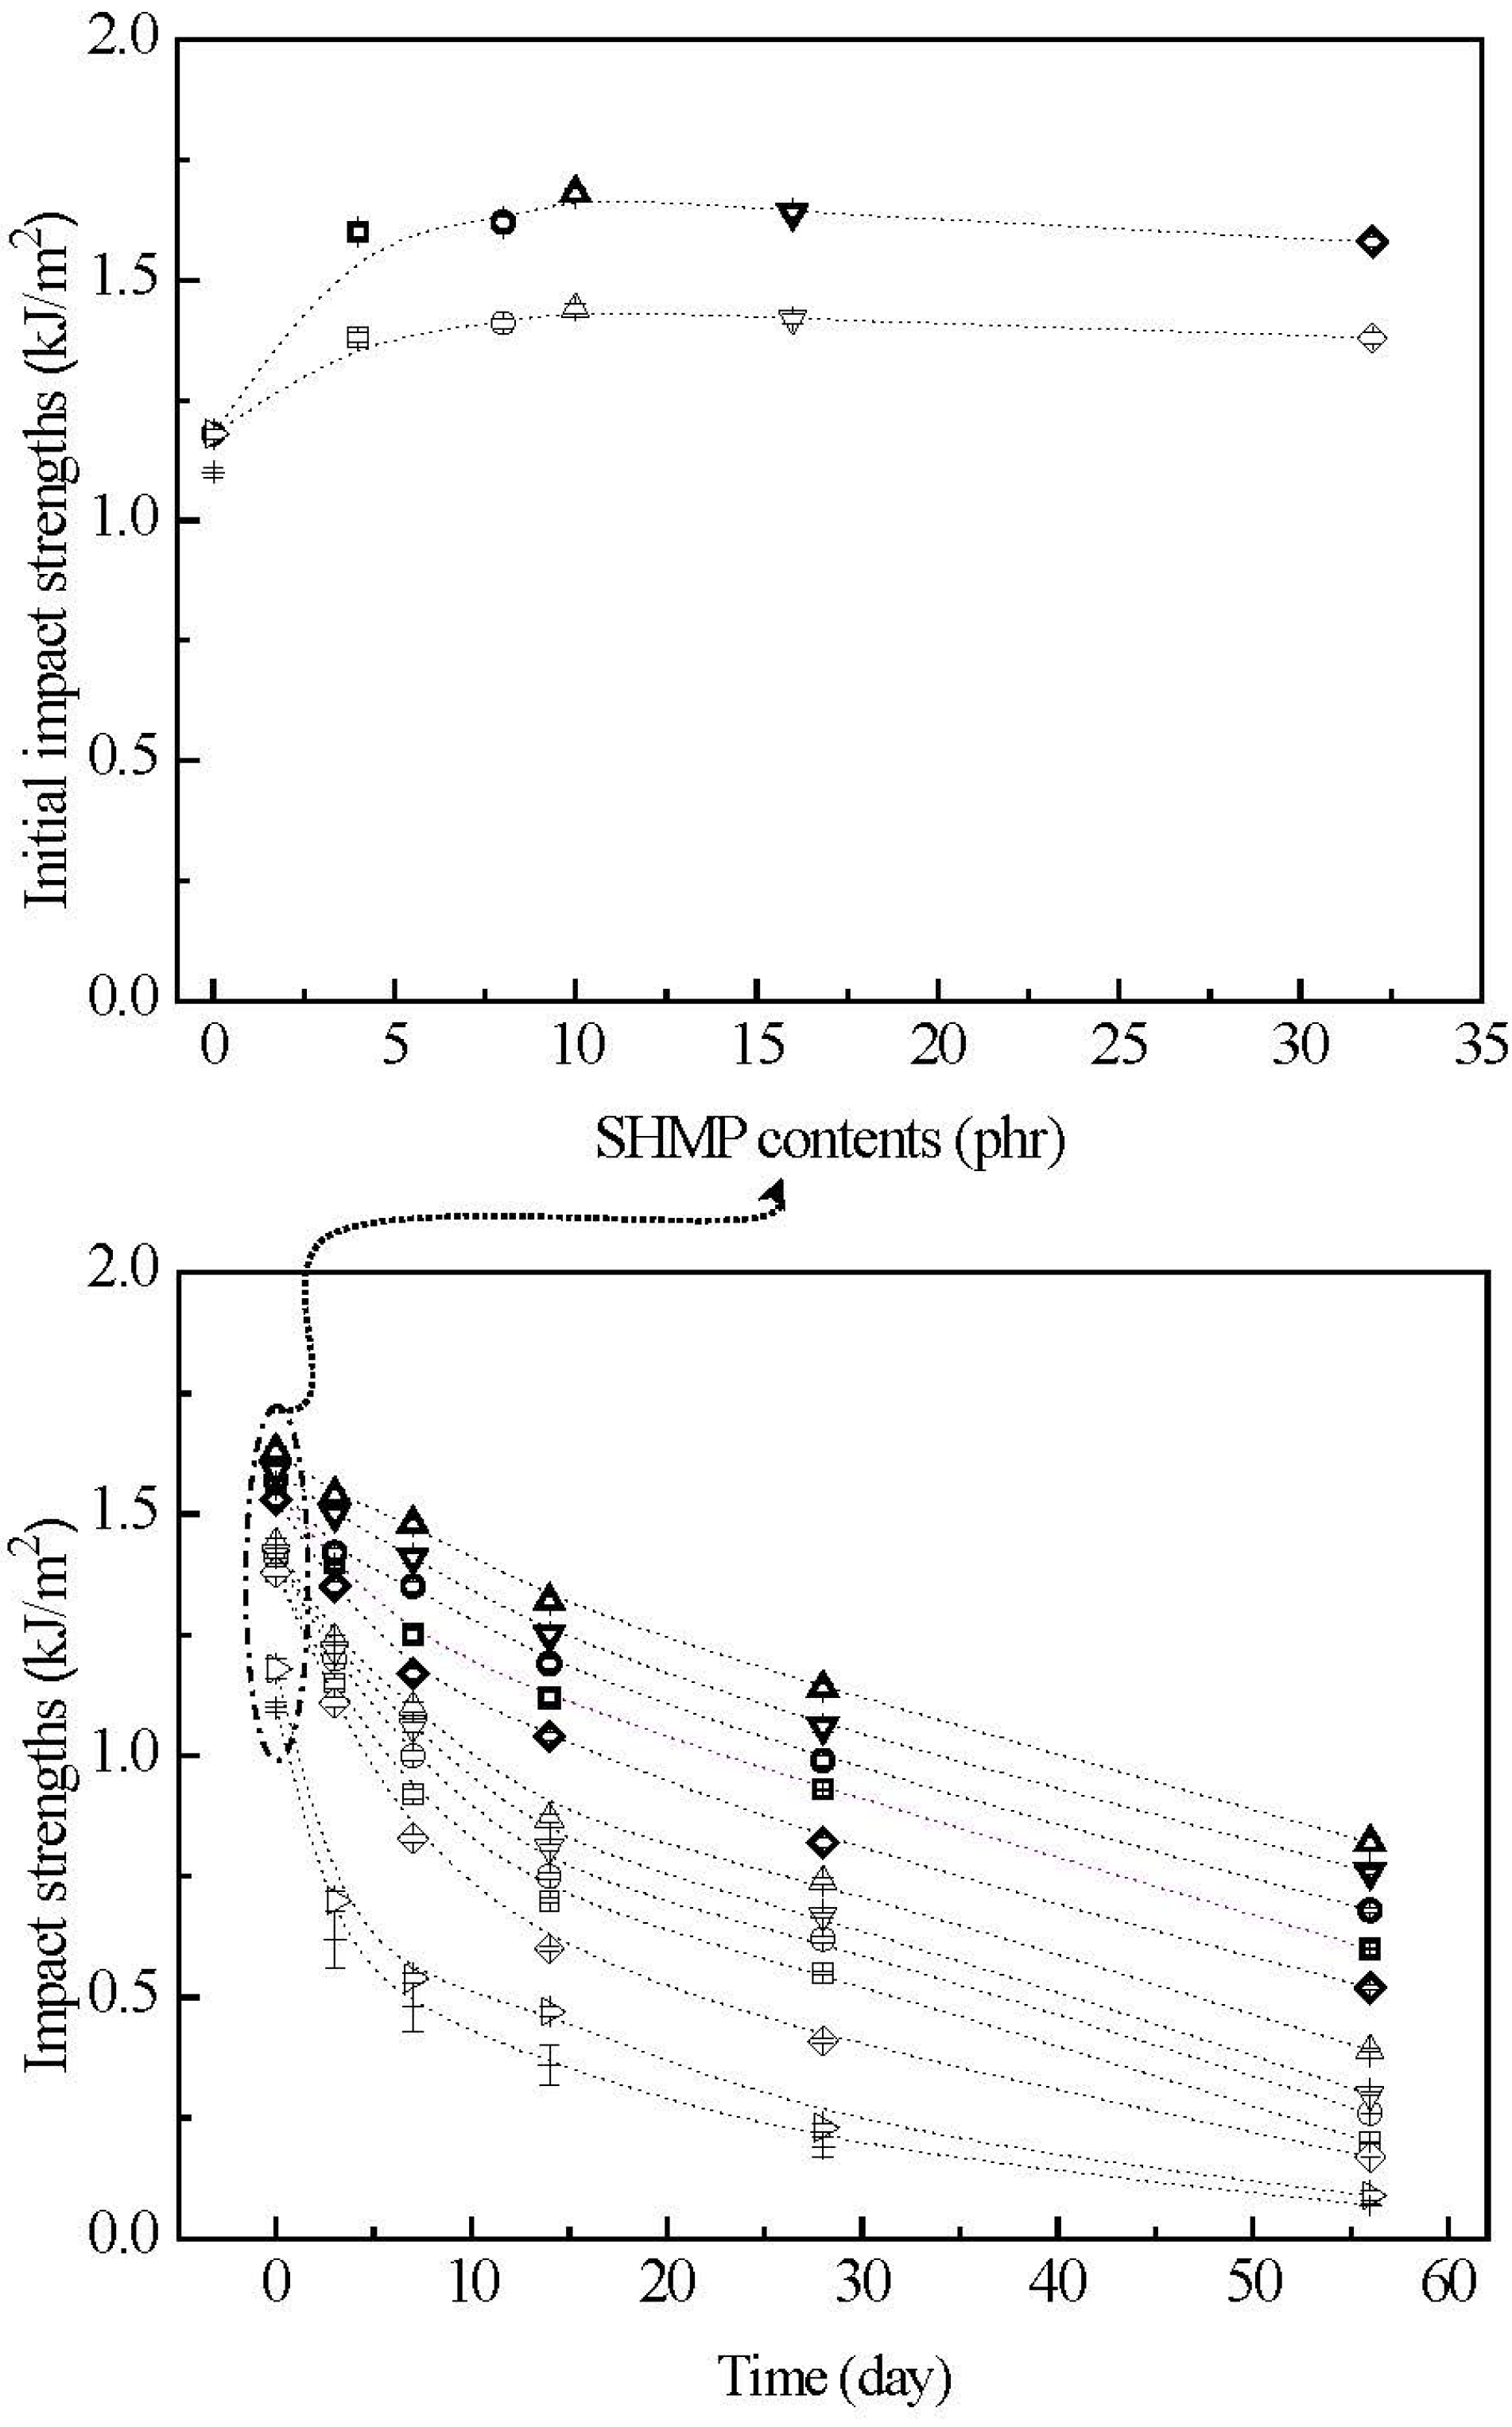
3.7. Initial and Retention Values of Impact Strengths
The initial and retention values of impact strengths (I
s) of TPS, TPS
100BC
0.02, TPS
100BC
0.02SHMP
x and (TPS
100BC
0.02SHMP
x)
75PLA
25 specimens are summarized in
Figure 12. Before conditioning at 20 °C/50% RH, TPS and TPS
100BC
0.02 specimens exhibited relatively low initial I
s values at 1.1 KJ/m
2 and 1.2 KJ/m
2, respectively. After maintaining at 20 °C/50% RH for certain amounts of time, the I
s values of conditioned TPS and TPS
100BC
0.02 specimens reduced rapidly from 1.1 kJ/m
2/1.2 kJ/m
2 to 0.4 kJ/m
2/0.5 kJ/m
2, 0.1 kJ/m
2/0.2 kJ/m
2 and then to 0.07 kJ/m
2/0.09 kJ/m
2, respectively, as the conditioning time increased from 0 to 7, 28 and 56 days. Apparently, initial and TPS
100BC
0.02 specimens with very small amounts of BC nanofibers exhibited significantly higher I
s values than those of corresponding TPS specimens conditioned at 20 °C/50% RH for the same amounts of time.
After modification with varying amounts of SHMP during gelatinization processes of TPS100BC0.02, the initial Is values of TPS100BC0.02SHMPx and (TPS100BC0.02SHMPx)75PLA25 specimens increased to a maximal value, as their SHMP contents reached an optimal value at 10 phr. However, after conditioning at 20 °C/50% RH for certain amounts of time, the Is retention values of all TPS100BC0.02SHMPx and (TPS100BC0.02SHMPx)75PLA25 specimens are significantly higher than those of corresponding conditioned TPS and TPS100BC0.02 specimens. Conditioned (TPS100BC0.02SHMPx)75PLA25 specimens exhibited significantly higher Is retention values than corresponding TPS100BC0.02SHMPx specimens conditioned for the same amounts of time but without blending with 25 wt % of PLA. Moreover, it is noteworthy that conditioned TPS100BC0.02SHMP10 or (TPS100BC0.02SHMP10)75PLA25 specimens showed significantly higher Is retention values than other corresponding conditioned TPS100BC0.02SHMPx or (TPS100BC0.02SHMPx)75PLA25 specimens modified with SHMP contents other than 10 phr, respectively. For instance, after conditioning at 20 °C/50% relative humidity for 56 days, the Is retention value of (TPS100BC0.02SHMP10)75PLA25 specimen remained at 0.8 KJ/m2, which is equivalent to about 50% of its initial Is value and 8.9 times those of TPS100BC0.02 specimen conditioned for the same amounts of time.
The rapid reduction in σf and Is retention values but increase in ɛf retention values of the conditioned TPS and TPS100BC0.02 specimens is apparently due to the excessive amounts of moisture absorbed during their conditioning processes, because the absorbed water molecules can effectively plasticize, soften and recrystallize starch molecules during their conditioning processes. As a consequence, ɛf values of TPS and TPS100BC0.02 specimens increased significantly as the conditioning time increased, while their σf and Is values reduced rapidly with the increase in conditioning time. In contrast, as evidenced by moisture content analyses in the previous section, the waterproof properties of TPS100BC0.02SHMPx and (TPS100BC0.02SHMPx)75PLA25 specimens were significantly improved, because the moisture-absorbing hydroxyl groups of starch molecules were successfully blocked by reacting with proper amounts of phosphate groups of SHMP molecules during their modification processes. However, excess amounts of relatively large SHMP molecules can no longer react with the hydroxyl groups of starch molecules during the modification processes of TPS100BC0.02SHMPx specimens. As a consequence, conditioned TPS100BC0.02SHMPx specimens exhibited higher moisture contents than those of TPS100BC0.02SHMP10 specimen, since the remained SHMP molecules are with strong hygroscopicity. It is, therefore, reasonable to infer that TPS100BC0.02SHMPx and (TPS100BC0.02SHMPx)75PLA25 specimens can exhibit significantly improved σf and Is retention values but reduced ɛf retention values than those of conditioned TPS and/or TPS100BC0.02 specimens. Conditioned TPS100BC0.02SHMP10 and (TPS100BC0.02SHMP10)75PLA25 specimens exhibit the best σf, ɛf and Is retention values compared to those of other corresponding conditioned TPS100BC0.02SHMPx and (TPS100BC0.02SHMPx)75PLA25 specimens modified with SHMP contents other than 10 phr, respectively. In addition, the inherently hydrophobic PLA can further prevent TPS100BC0.02SHMPx from absorbing moisture and hence, improve the waterproof properties of the initial and conditioned (TPS100BC0.02SHMPx)75PLA25 specimens. As a consequence, the conditioned (TPS100BC0.02SHMPx)75PLA25 specimens exhibited significantly higher σf and Is retention but lower ɛf retention values than corresponding TPS100BC0.02SHMPx specimens conditioned for the same amounts of time but without blending with 25 wt % of PLA.
Figure 12.
The impact strengths of initial and conditioned TPS (+), TPS100BC0.02 (▷), TPS100BC0.02SHMP4 (□), TPS100BC0.02 SHMP8 (○), TPS100BC0.02 SHMP10 (△), TPS100BC0.02SHMP16 (▽), TPS100BC0.02SHMP32 (◇), (TPS100BC0.02SHMP4)75PLA25 (□), (TPS100BC0.02SHMP8)75PLA25 (○), (TPS100BC0.02SHMP10)75PLA25 (△), (TPS100BC0.02SHMP16)75PLA25 (▽) and (TPS100BC0.02SHMP32)75PLA25 (◇) specimens conditioned at 20 °C/50% RH for varying amounts of time. (Symbol (Ι) represents the error bar).


