
Factorial Design Approach in Proportioning Prestressed Self-Compacting Concrete


Abstract
:1. Introduction
2. Experimental Program
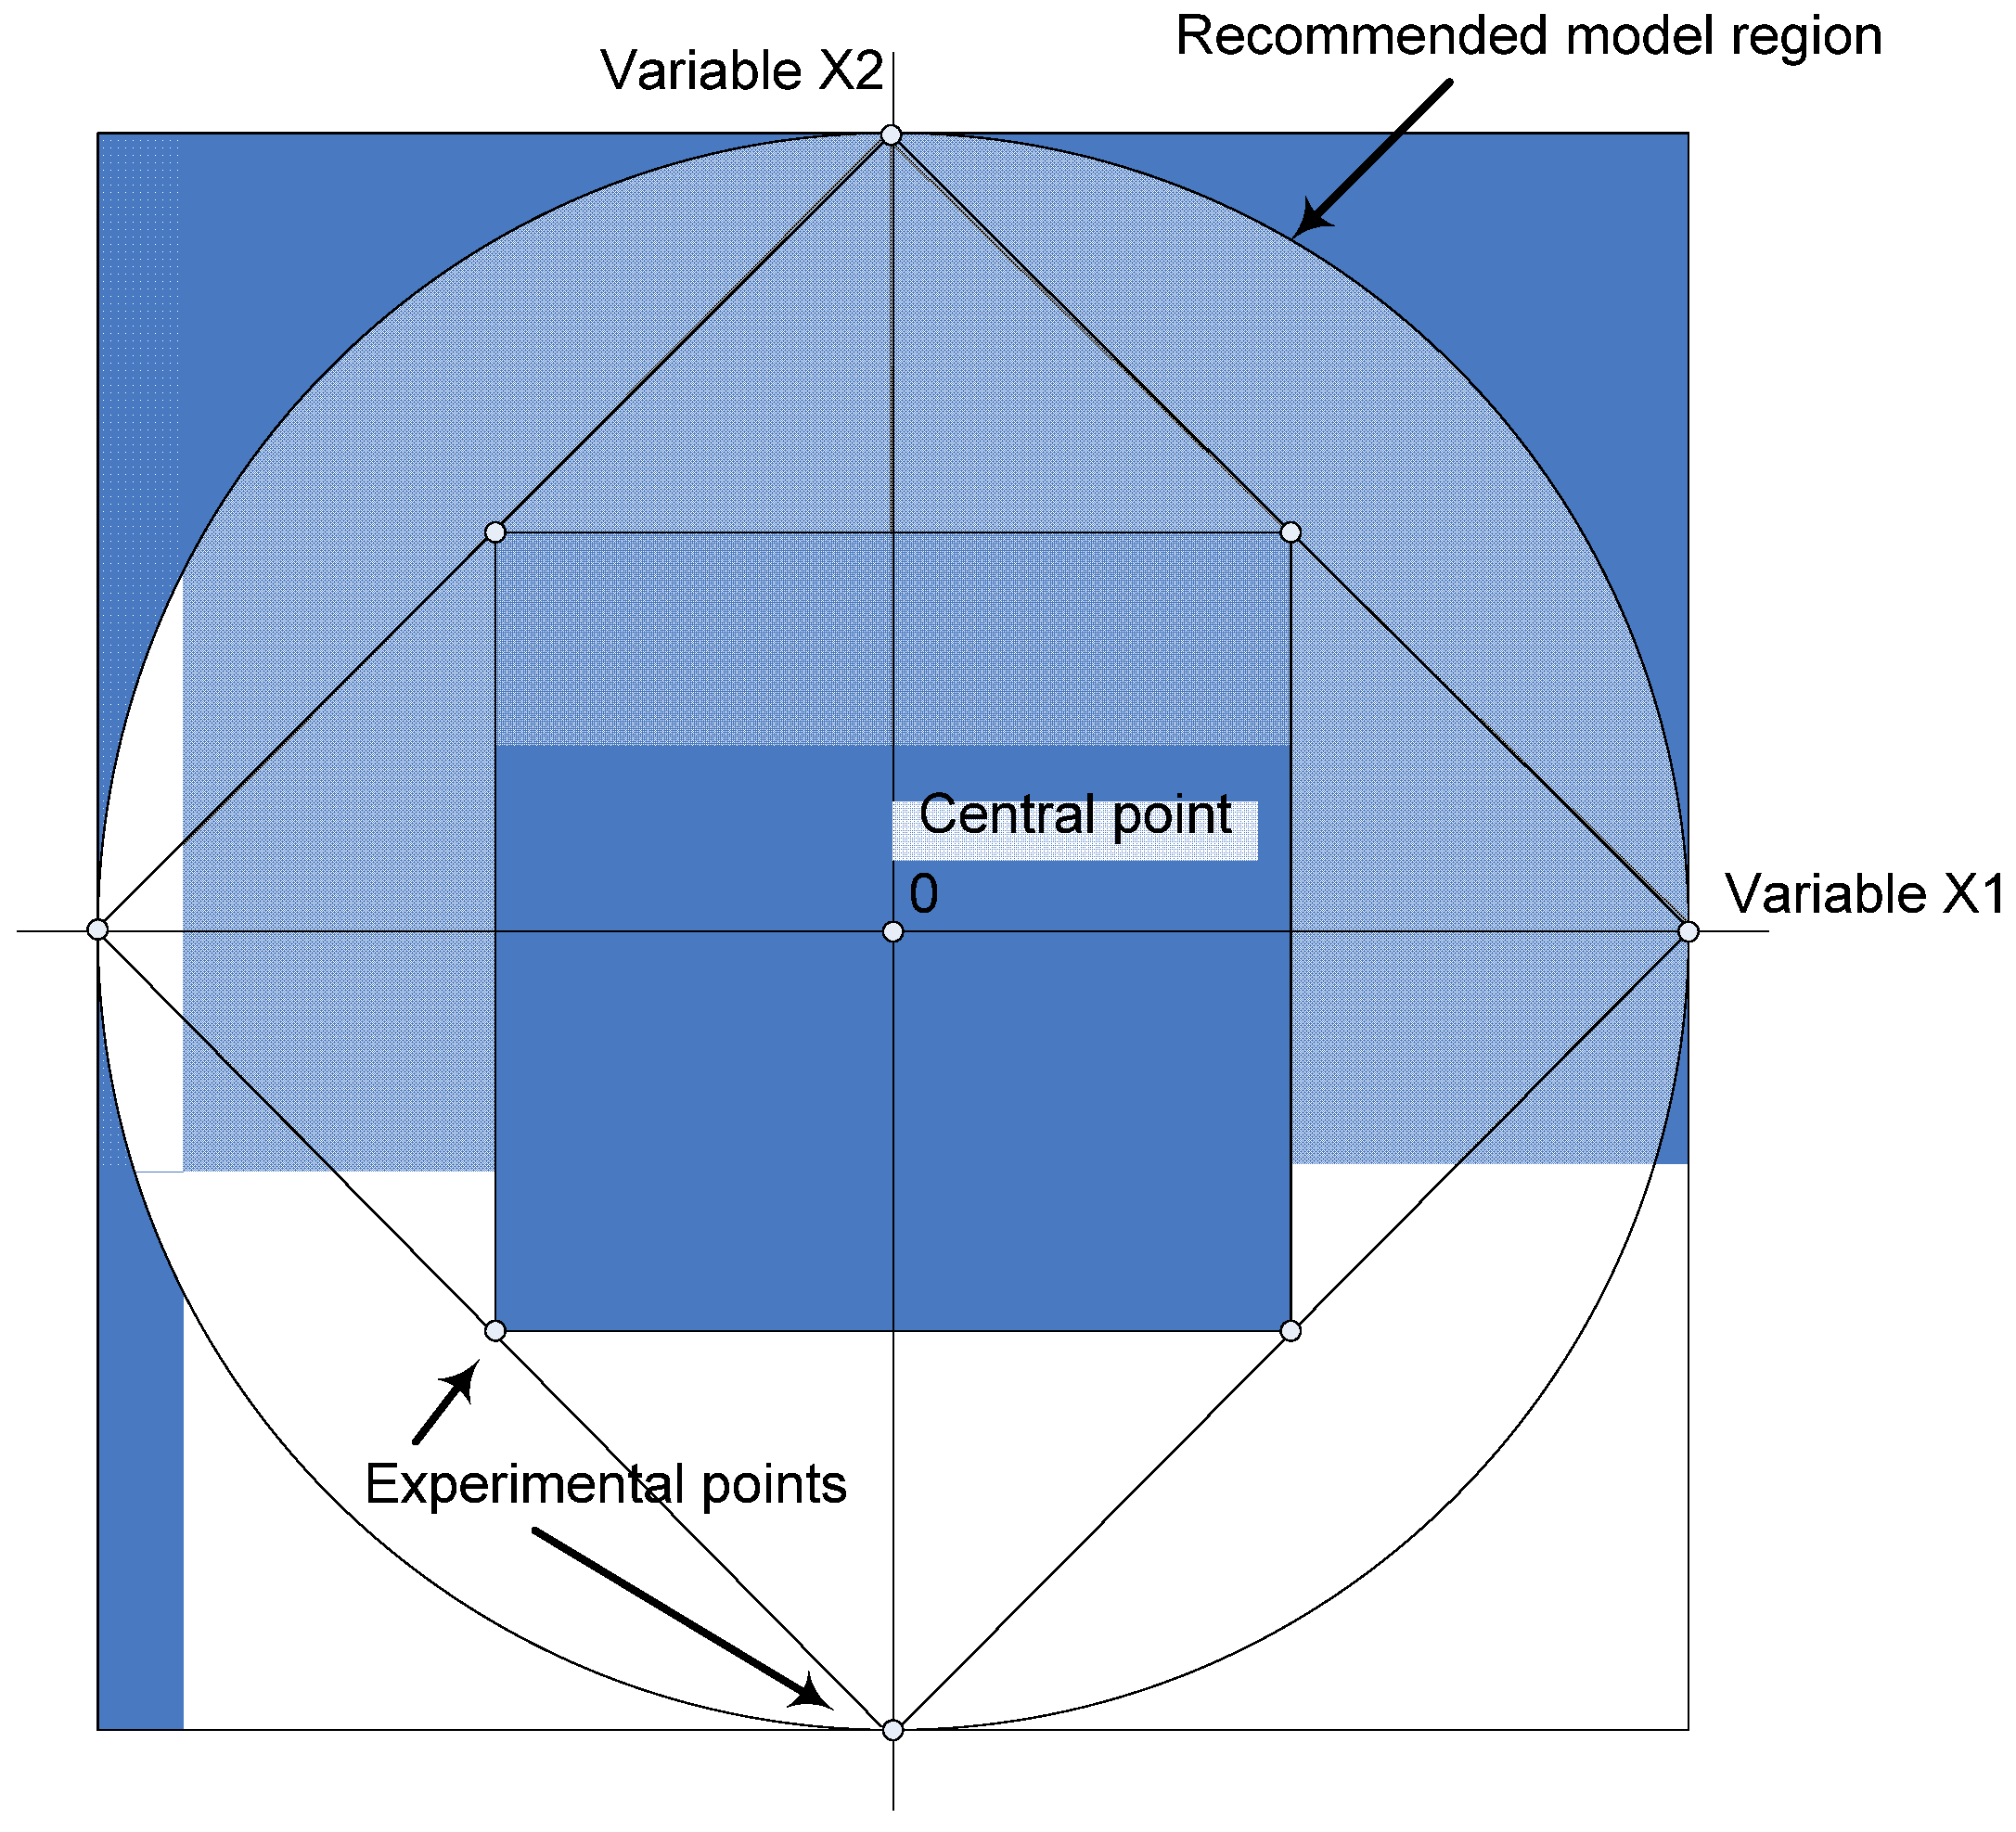
2.1. Fractional Factorial Design

| Type | Mix No. | Coded Values | Absolute Values | |||||||||
|---|---|---|---|---|---|---|---|---|---|---|---|---|
| Binder | w/cm | VMA * | Binder Type | S/A ** | Binder (kg/m3) | w/cm | VMA (mL/100 kg CM) | Binder Type | S/A (%) | |||
| Factorial mixtures | Fractional factorial points | 1 | −1 | −1 | −1 | −1 | 1 | 440 | 0.34 | 0 | MS | 0.54 |
| 2 | −1 | −1 | −1 | 1 | −1 | 440 | 0.34 | 0 | HE *** | 0.46 | ||
| 3 | −1 | −1 | 1 | −1 | −1 | 440 | 0.34 | 100 | MS | 0.46 | ||
| 4 | −1 | −1 | 1 | 1 | 1 | 440 | 0.34 | 100 | HE | 0.54 | ||
| 5 | −1 | 1 | −1 | −1 | −1 | 440 | 0.40 | 0 | MS | 0.46 | ||
| 6 | −1 | 1 | −1 | 1 | 1 | 440 | 0.40 | 0 | HE | 0.54 | ||
| 7 | −1 | 1 | 1 | −1 | 1 | 440 | 0.40 | 100 | MS | 0.54 | ||
| 8 | −1 | 1 | 1 | 1 | −1 | 440 | 0.40 | 100 | HE | 0.46 | ||
| 9 | 1 | −1 | −1 | −1 | −1 | 500 | 0.34 | 0 | MS | 0.46 | ||
| 10 | 1 | −1 | −1 | 1 | 1 | 500 | 0.34 | 0 | HE | 0.54 | ||
| 11 | 1 | −1 | 1 | −1 | 1 | 500 | 0.34 | 100 | MS | 0.54 | ||
| 12 | 1 | −1 | 1 | 1 | −1 | 500 | 0.34 | 100 | HE | 0.46 | ||
| 13 | 1 | 1 | −1 | −1 | 1 | 500 | 0.40 | 0 | MS | 0.54 | ||
| 14 | 1 | 1 | −1 | 1 | −1 | 500 | 0.40 | 0 | HE | 0.46 | ||
| 15 | 1 | 1 | 1 | −1 | −1 | 500 | 0.40 | 100 | MS | 0.46 | ||
| 16 | 1 | 1 | 1 | 1 | 1 | 500 | 0.40 | 100 | HE | 0.54 | ||
| Axial points | A1 | −2 | 0 | 0 | 0 | 0 | 410 | 0.37 | 50 | MS-HE | 0.50 | |
| A2 | 2 | 0 | 0 | 0 | 0 | 530 | 0.37 | 50 | MS-HE | 0.50 | ||
| A3 | 0 | −2 | 0 | 0 | 0 | 470 | 0.31 | 50 | MS-HE | 0.50 | ||
| A4 | 0 | 2 | 0 | 0 | 0 | 470 | 0.43 | 50 | MS-HE | 0.50 | ||
| A5 | 0 | 0 | −2 | 0 | 0 | 470 | 0.37 | 0 | MS-HE | 0.50 | ||
| A6 | 0 | 0 | 2 | 0 | 0 | 470 | 0.37 | 150 | MS-HE | 0.50 | ||
| A7 | 0 | 0 | 0 | 0 | −2 | 470 | 0.37 | 50 | MS-HE | 0.42 | ||
| A8 | 0 | 0 | 0 | 0 | 2 | 470 | 0.37 | 50 | MS-HE | 0.58 | ||
| Central points | C1 | 0 | 0 | 0 | 0 | 0 | 470 | 0.37 | 50 | MS-HE | 0.50 | |
| C2 | 0 | 0 | 0 | 0 | 0 | 470 | 0.37 | 50 | MS-HE | 0.50 | ||
| C3 | 0 | 0 | 0 | 0 | 0 | 470 | 0.37 | 50 | MS-HE | 0.50 | ||
| C4 | 0 | 0 | 0 | 0 | 0 | 470 | 0.37 | 50 | MS-HE | 0.50 | ||
- Coded BC = (absolute BC–470)/30
- Coded w/cm = (absolute w/cm–0.37)/0.03
- Coded VMA = (absolute VMA–50)/50
- Coded S/A = (absolute S/A–0.50)/0.04
2.2. Materials Characteristics
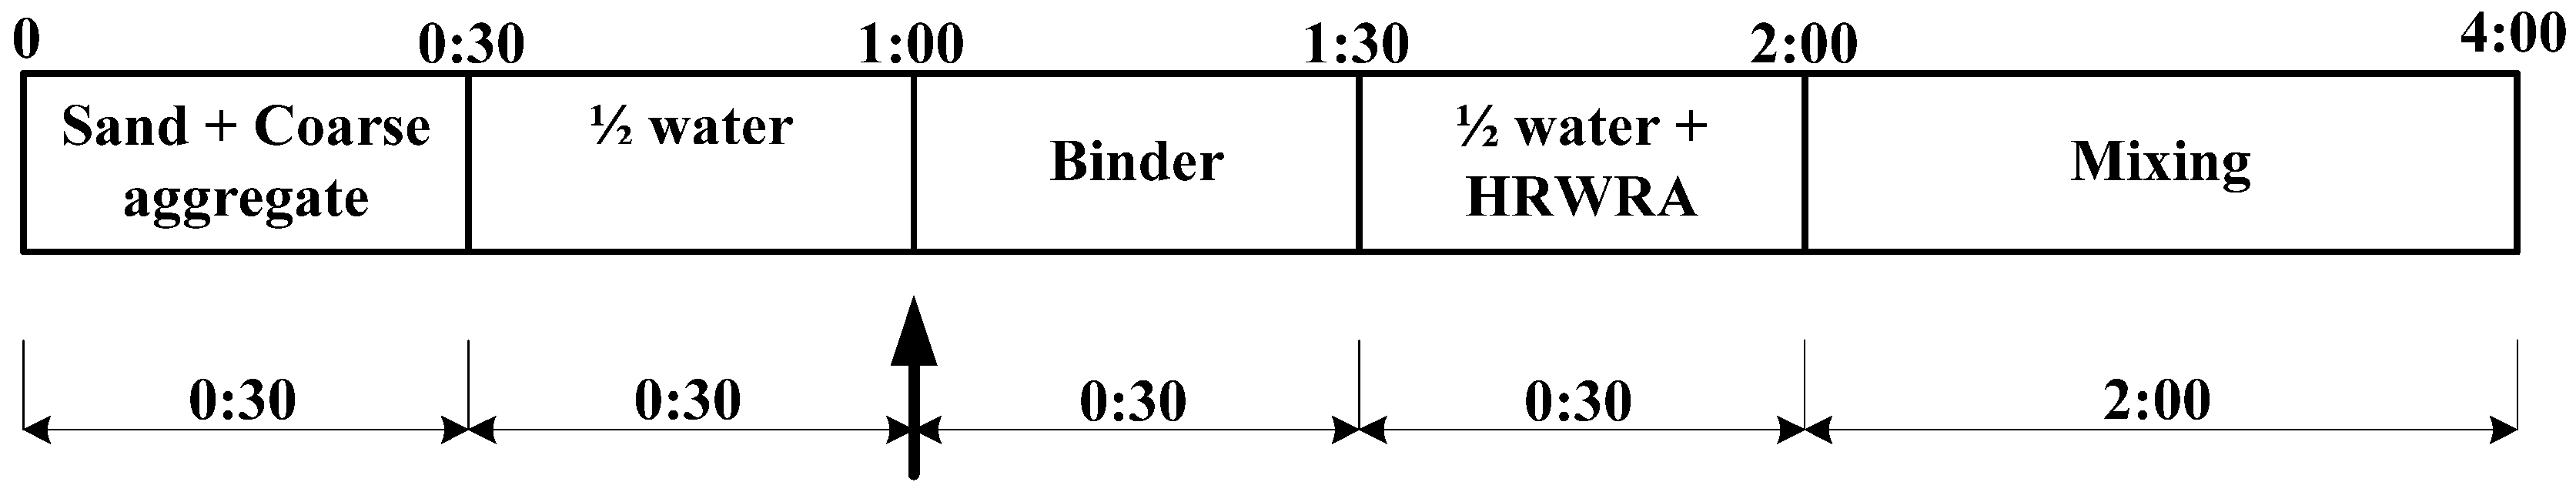
2.3. Mixing Sequence

2.4. Test Methods
| Curing Method | Stage | Detail |
|---|---|---|
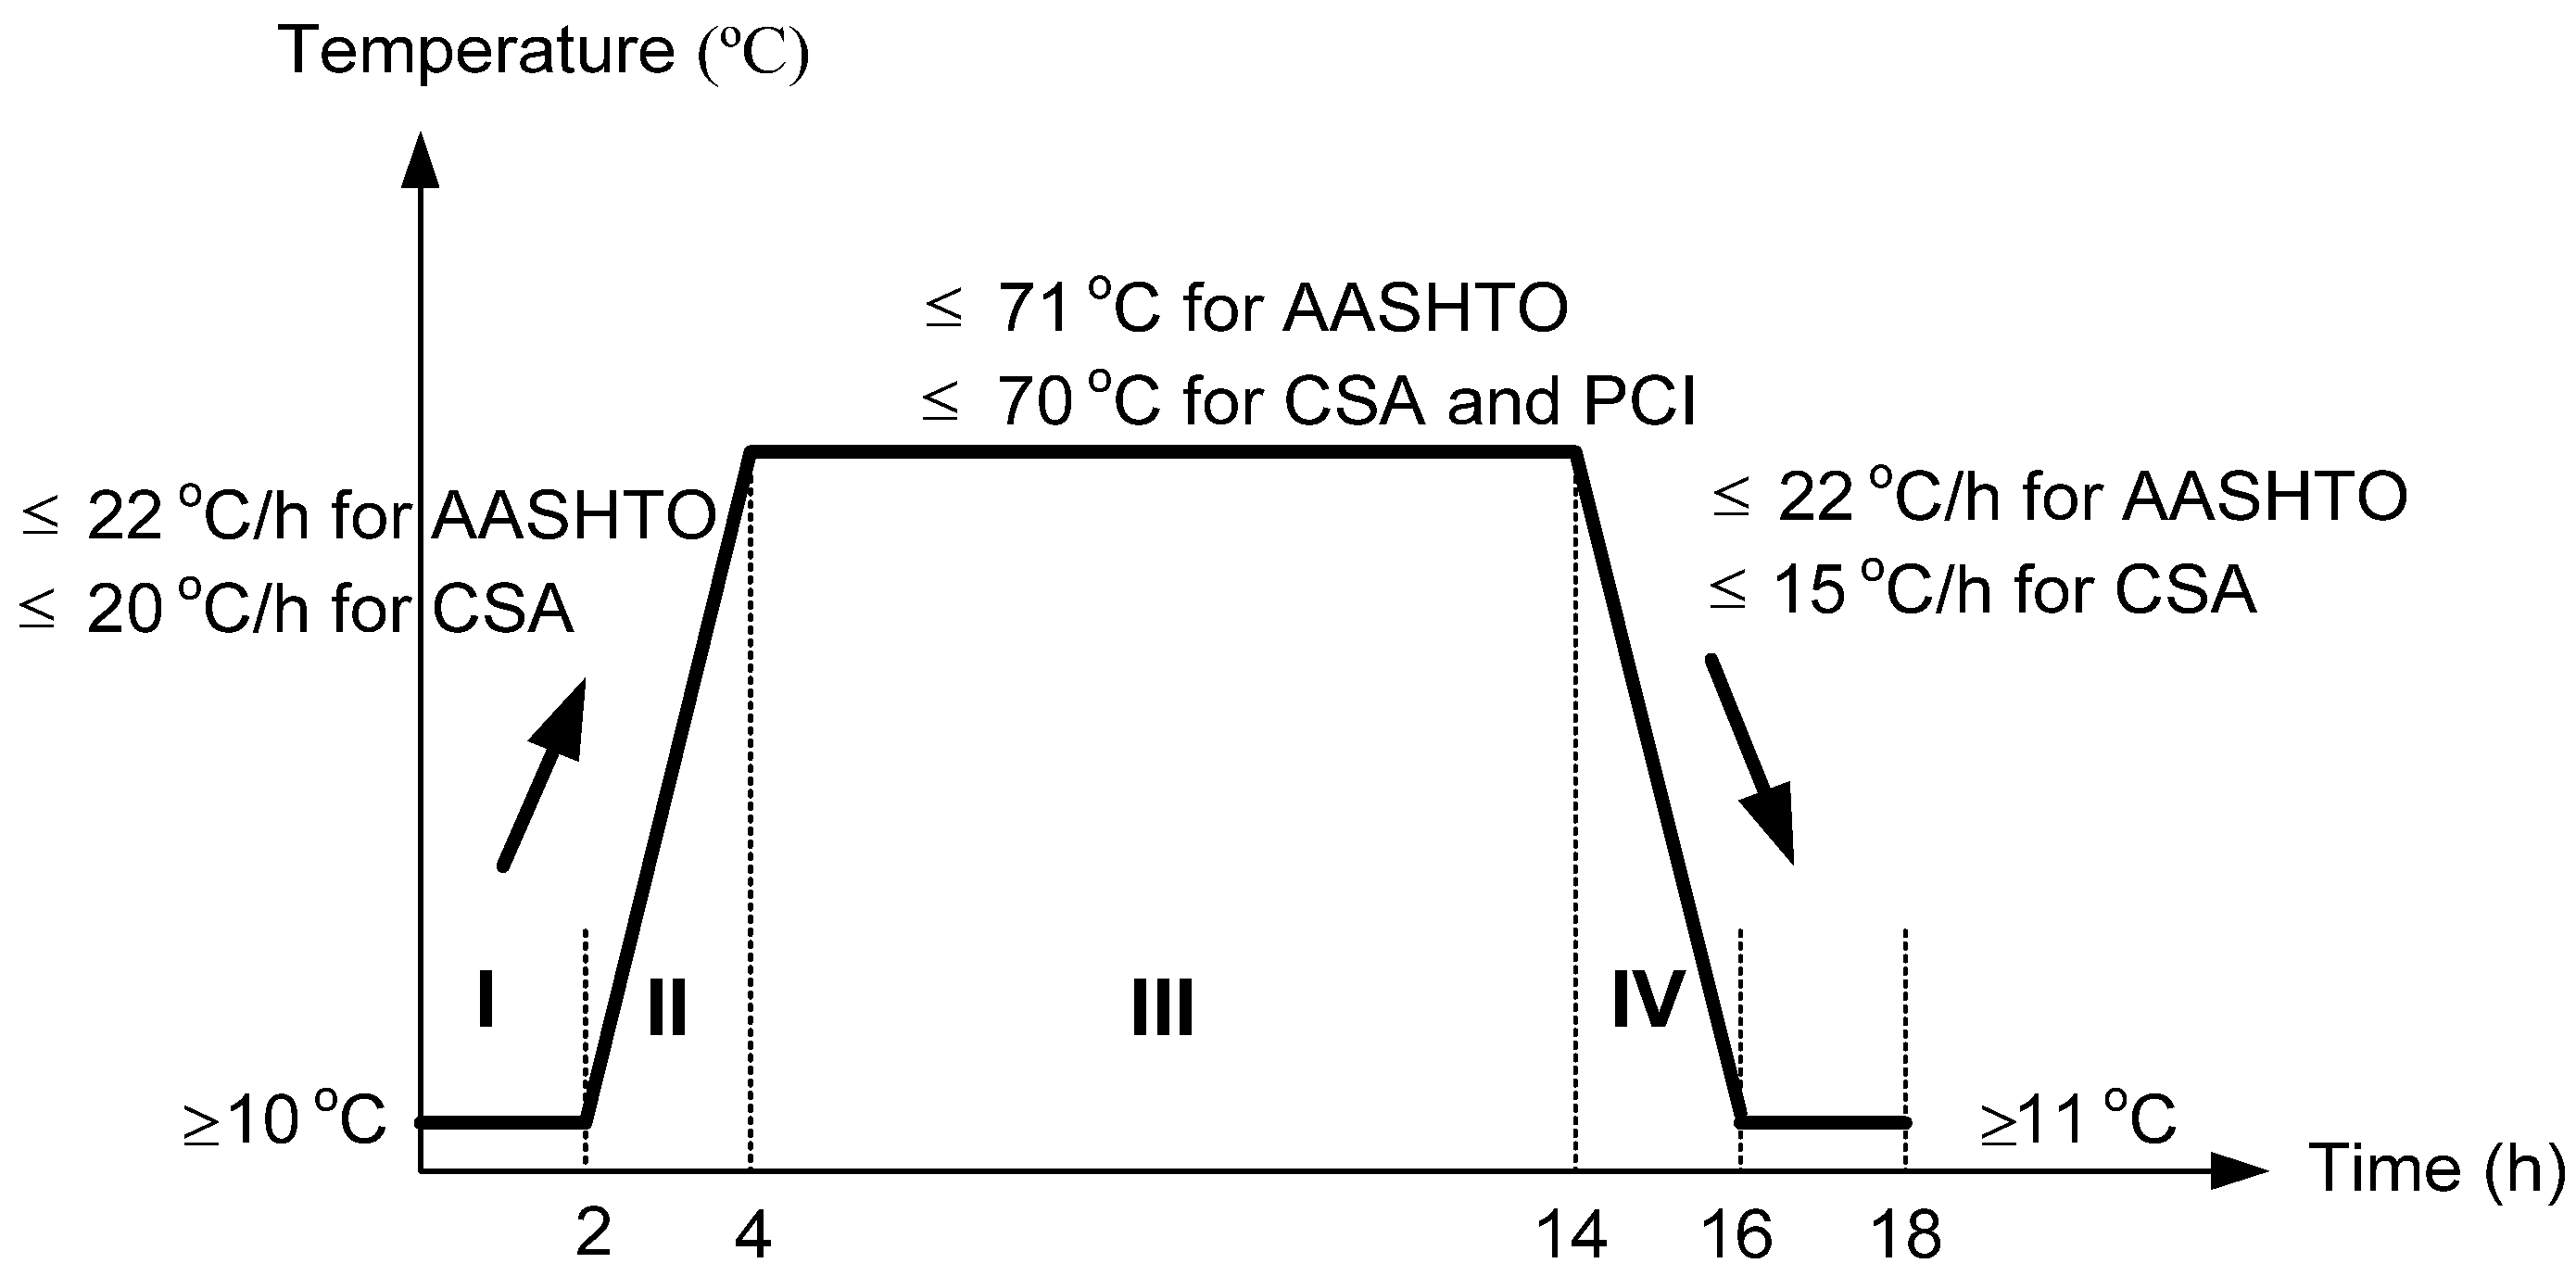
| Steam-curing | I | Ambient temperature for 2 h after water-cement contact |
| II | Temperature raised for 2 h | |
| III | Concrete temperature maintained for 10 h | |
| IV | Temperature decreases over 2 h to ambient temperature | |
| V | Air-curing until age of testing at 18 h | |
| Moist-curing | I | 18 h in molds with wet burlap at 23 ± 2 °C |
| II | Moist-cured at 23 ± 2 °C until testing age | |
| Air-curing | I | 18 h in molds with wet burlap at 23 ± 2 °C |
| II | Air-dried at 23 ± 2 °C until testing age |

| Mix ID | 18 h | 7 Days | 28 Days | 56 Days | |
|---|---|---|---|---|---|
| Steam-Cured | Moist-Cured | ||||
| Fractional factorial points | 1 | 36.8 | 54.2 | 58.8 | 60.7 |
| 2 | 33.0 | 48.0 | 59.2 | 62.5 | |
| 3 | 38.0 | 54.6 | 60.4 | 69.6 | |
| 4 | 31.5 | 51.6 | 60.2 | 65.3 | |
| 5 | 31.9 | 44.6 | 51.2 | 53.2 | |
| 6 | 33.3 | 46.2 | 54.2 | 61.0 | |
| 7 | 28.1 | 41.5 | 49.8 | 55.7 | |
| 8 | 31.8 | 49.6 | 56.3 | 66.9 | |
| 9 | 35.1 | 51.7 | 62.2 | 68.2 | |
| 10 | 33.8 | 55.7 | 64.8 | 78.0 | |
| 11 | 36.6 | 57.5 | 64.5 | 69.1 | |
| 12 | 33.5 | 57.7 | 70.2 | 75.4 | |
| 13 | 31.8 | 44.9 | 51.2 | 58.2 | |
| 14 | 30.9 | 40.4 | 55.2 | 60.9 | |
| 15 | 30.1 | 37.6 | 47.5 | 55.4 | |
| 16 | 28.1 | 39.0 | 47.6 | 53.2 | |
| Axial points | A1 | 30.6 | 55.3 | 66.6 | 70.7 |
| A2 | 37.6 | 50.3 | 59.4 | 65.2 | |
| A3 | 8.5 | 65.9 | 75.8 | 81.5 | |
| A4 | 29.4 | 39.9 | 48.7 | 53.4 | |
| A5 | 30.4 | 53.7 | 63.7 | 69.0 | |
| A6 | 33.0 | 53.9 | 61.1 | 68.8 | |
| A7 | 36.0 | 52.9 | 63.3 | 66.1 | |
| A8 | 35.6 | 49.5 | 60.1 | 63.7 | |
| Central points | C1 | 36.0 | 52.7 | 65.0 | 71.6 |
| C2 | 36.0 | 52.0 | 64.2 | 71.7 | |
| C3 | 36.5 | 54.3 | 63.8 | 69.2 | |
| C4 | 35.1 | 51.1 | 62.1 | 69.1 | |
| Mix ID | 18 h | 28 Days | 56 Days | HRWRA Demand | |
|---|---|---|---|---|---|
| Steam-Cured | Moist-Cured | L/100 kg CM | |||
| GPa | GPa | GPa | |||
| Fractional factorial points | 1 | 33.0 | 37.0 | 39.5 | 2.23 |
| 2 | 31.0 | 39.0 | 41.5 | 2.73 | |
| 3 | 34.0 | 41.0 | 42.5 | 2.39 | |
| 4 | 29.0 | 37.5 | 38.0 | 2.95 | |
| 5 | 30.0 | 34.5 | 36.5 | 0.77 | |
| 6 | 29.5 | 35.5 | 38.0 | 1.20 | |
| 7 | 30.5 | 34.0 | 34.0 | 0.86 | |
| 8 | 31.0 | 37.5 | 39.0 | 1.41 | |
| 9 | 32.5 | 39.5 | 41.0 | 1.80 | |
| 10 | 31.5 | 39.0 | 40.5 | 2.00 | |
| 11 | 33.0 | 38.0 | 39.0 | 2.00 | |
| 12 | 34.5 | 41.0 | 41.5 | 2.00 | |
| 13 | 28.5 | 34.0 | 35.0 | 0.50 | |
| 14 | 27.5 | 37.0 | 38.5 | 1.02 | |
| 15 | 28.0 | 34.0 | 35.0 | 0.70 | |
| 16 | 24.0 | 32.5 | 33.5 | 1.00 | |
| Axial points | A1 | 30.5 | 38.0 | 40.0 | 1.13 |
| A2 | 28.0 | 35.0 | 35.5 | 2.47 | |
| A3 | 18.5 | 40.0 | 41.0 | 3.95 | |
| A4 | 27.0 | 32.5 | 34.5 | 0.70 | |
| A5 | 28.0 | 37.5 | 37.5 | 1.67 | |
| A6 | 30.5 | 35.5 | 38.5 | 1.73 | |
| A7 | 29.5 | 36.0 | 38.5 | 1.43 | |
| A8 | 30.0 | 35.5 | 37.0 | 1.53 | |
| Central points | C1 | 28.5 | 37.0 | 38.5 | 1.73 |
| C2 | 30.0 | 37.5 | 39.5 | 1.73 | |
| C3 | 29.0 | 38.5 | 39.5 | 1.73 | |
| C4 | 30.0 | 38.5 | 38.5 | 1.73 | |
3. Results and Discussion
3.1. Derived Statistical Models for Mechanical Properties
| Mixture ID | Autogenous Shrinkage | Drying Shrinkage | |||||
|---|---|---|---|---|---|---|---|
| 7 Days | 28 Days | 7 Days | 28 Days | 112 Days | 250 Days | ||
| Fractional factorial points | 1 | 75 | 105 | 270 | 465 | 720 | 830 |
| 2 | 250 | 265 | 180 | 310 | 435 | 535 | |
| 3 | 85 | 115 | 160 | 270 | 450 | 565 | |
| 4 | 205 | 260 | 240 | 365 | 615 | 735 | |
| 5 | 35 | 90 | 80 | 130 | 330 | 495 | |
| 6 | 95 | 190 | 130 | 230 | 475 | 545 | |
| 7 | 50 | 100 | 80 | 195 | 440 | 585 | |
| 8 | 130 | 245 | 160 | 270 | 570 | 670 | |
| 9 | 130 | 155 | 290 | 550 | 820 | 975 | |
| 10 | 245 | 315 | 315 | 540 | 765 | 930 | |
| 11 | 150 | 230 | 185 | 255 | 530 | 680 | |
| 12 | 190 | 305 | 235 | 330 | 540 | 635 | |
| 13 | 70 | 110 | 140 | 225 | 540 | 690 | |
| 14 | 70 | 140 | 150 | 280 | 555 | 640 | |
| 15 | 65 | 100 | 100 | 190 | 405 | 545 | |
| 16 | 75 | 170 | 150 | 380 | 620 | 720 | |
| Axial points | A1 | 135 | 220 | 140 | 295 | 420 | 520 |
| A2 | 125 | 230 | 175 | 390 | 550 | 660 | |
| A3 | 180 | 225 | 215 | 355 | 450 | 515 | |
| A4 | 70 | 140 | 165 | 375 | 555 | 675 | |
| A5 | 145 | 220 | 150 | 275 | 430 | 565 | |
| A6 | 120 | 165 | 160 | 330 | 460 | 575 | |
| A7 | 125 | 200 | 215 | 350 | 470 | 565 | |
| A8 | 115 | 190 | 190 | 350 | 490 | 590 | |
| Central points | C1 | 120 | 200 | 190 | 330 | 500 | 615 |
| C2 | 115 | 200 | 230 | 340 | 515 | 620 | |
| C3 | 110 | 200 | 190 | 370 | 520 | 615 | |
| C4 | 120 | 200 | 180 | 345 | 495 | 620 | |
| Property | Mean | Standard Deviation | Relative Error * in 90% Confidence Limit, (%) |
|---|---|---|---|
| 18 h compressive strength, MPa | 35.9 | 0.583 | 1.9 |
| 28 days compressive strength, MPa | 63.8 | 1.223 | 2.3 |
| 56 days compressive strength, MPa | 70.4 | 1.445 | 2.4 |
| 18 h modulus of elasticity, GPa | 29.4 | 0.750 | 3.0 |
| 28 days modulus of elasticity, GPa | 37.9 | 0.750 | 2.3 |
| 56 days modulus of elasticity, GPa | 39.0 | 0.550 | 1.7 |
| Property | 7-Day , MPa R2 = 0.76 | 28-Day , MPa R2 = 0.72 | 56-Day , MPa R2 = 0.79 | |||
| Model Type | Linear Model | Linear Model | Linear Model | |||
| Parameters | Estimates | Prob. > |t| | Estimates | Prob. > |t| | Estimates | Prob. > |t| |
| Intercept | +50.25 | - | +59.62 | - | +65.43 | - |
| Binder content | NS * | NS | NS | NS | NS | NS |
| w/cm | −5.80 | 0.001 | −5.90 | 0.001 | −5.85 | 0.001 |
| VMA | NS | NS | NS | NS | NS | NS |
| Binder type | NS | NS | +1.50 | 0.061 | +2.52 | 0.006 |
| S/A | NS | NS | NS | NS | NS | NS |
| BC·w/cm | −2.13 | 0.017 | −2.08 | 0.035 | −2.60 | 0.018 |
| BC·VMA | NS | NS | NS | NS | −2.02 | 0.062 |
| w/cm·BT | NS | NS | NS | NS | NS | NS |
| Property | 18-h MOE, GPa (Steam-Cured) R2 = 0.73 | 28-Day MOE, GPa R2 = 0.75 | 56-Day MOE, GPa R2 = 0.85 | |||
| Model Type | Linear Model | Linear Model | Linear Model | |||
| Parameters | Estimates | Prob. > |t| | Estimates | Prob. > |t| | Estimates | Prob. > |t| |
| Intercept | +29.92 | - | +36.83 | - | +38.24 | - |
| Binder content | −0.56 | 0.040 | −0.29 | 0.100 | −0.55 | 0.014 |
| w/cm | −1.48 | 0.001 | −2.00 | 0.001 | −1.97 | 0.001 |
| Binder type | −0.40 | 0.100 | +0.50 | 0.051 | +0.57 | 0.012 |
| S/A | NS | NS | −0.71 | 0.008 | −0.89 | 0.001 |
| BC·w/cm | −1.09 | 0.002 | NS | NS | NS | NS |
| w/cm·BT | NS | NS | NS | NS | +0.54 | 0.045 |
| VMA·S/A | −0.78 | 0.020 | NS | NS | −0.52 | 0.055 |
| BT·S/A | −0.66 | 0.050 | NS | NS | NS | NS |
| Property | Age | Derived Equations | R2 |
|---|---|---|---|
| Compressive strength, MPa | 7 days | +50.25 − 5.80 w/cm − 2.13 (BC·w/cm) | 0.76 |
| 28 days | +59.62 − 5.90 w/cm + 1.50 BT − 2.08 (BC·w/cm) | 0.72 | |
| 56 days | +65.43 − 5.85 w/cm + 2.52 BT − 2.60 (BC·w/cm) − 2.02 (BC·VMA) | 0.79 | |
| Modulus of elasticity, GPa | 18 h | +29.92 − 1.48 w/cm − 0.56 BC − 0.40 BT − 1.09 (BC·w/cm) − 0.78 (VMA·S/A) − 0.66 (BT·S/A) | 0.73 |
| 28 day | +36.83 − 2.00 w/cm − 0.71 S/A + 0.50 BT − 0.29 BC | 0.75 | |
| 56 day | +38.24 − 1.97 w/cm − 0.89 S/A + 0.57 BT − 0.55 BC + 0.54 (w/cm·BT) – 0.52 (VMA·S/A) | 0.85 |
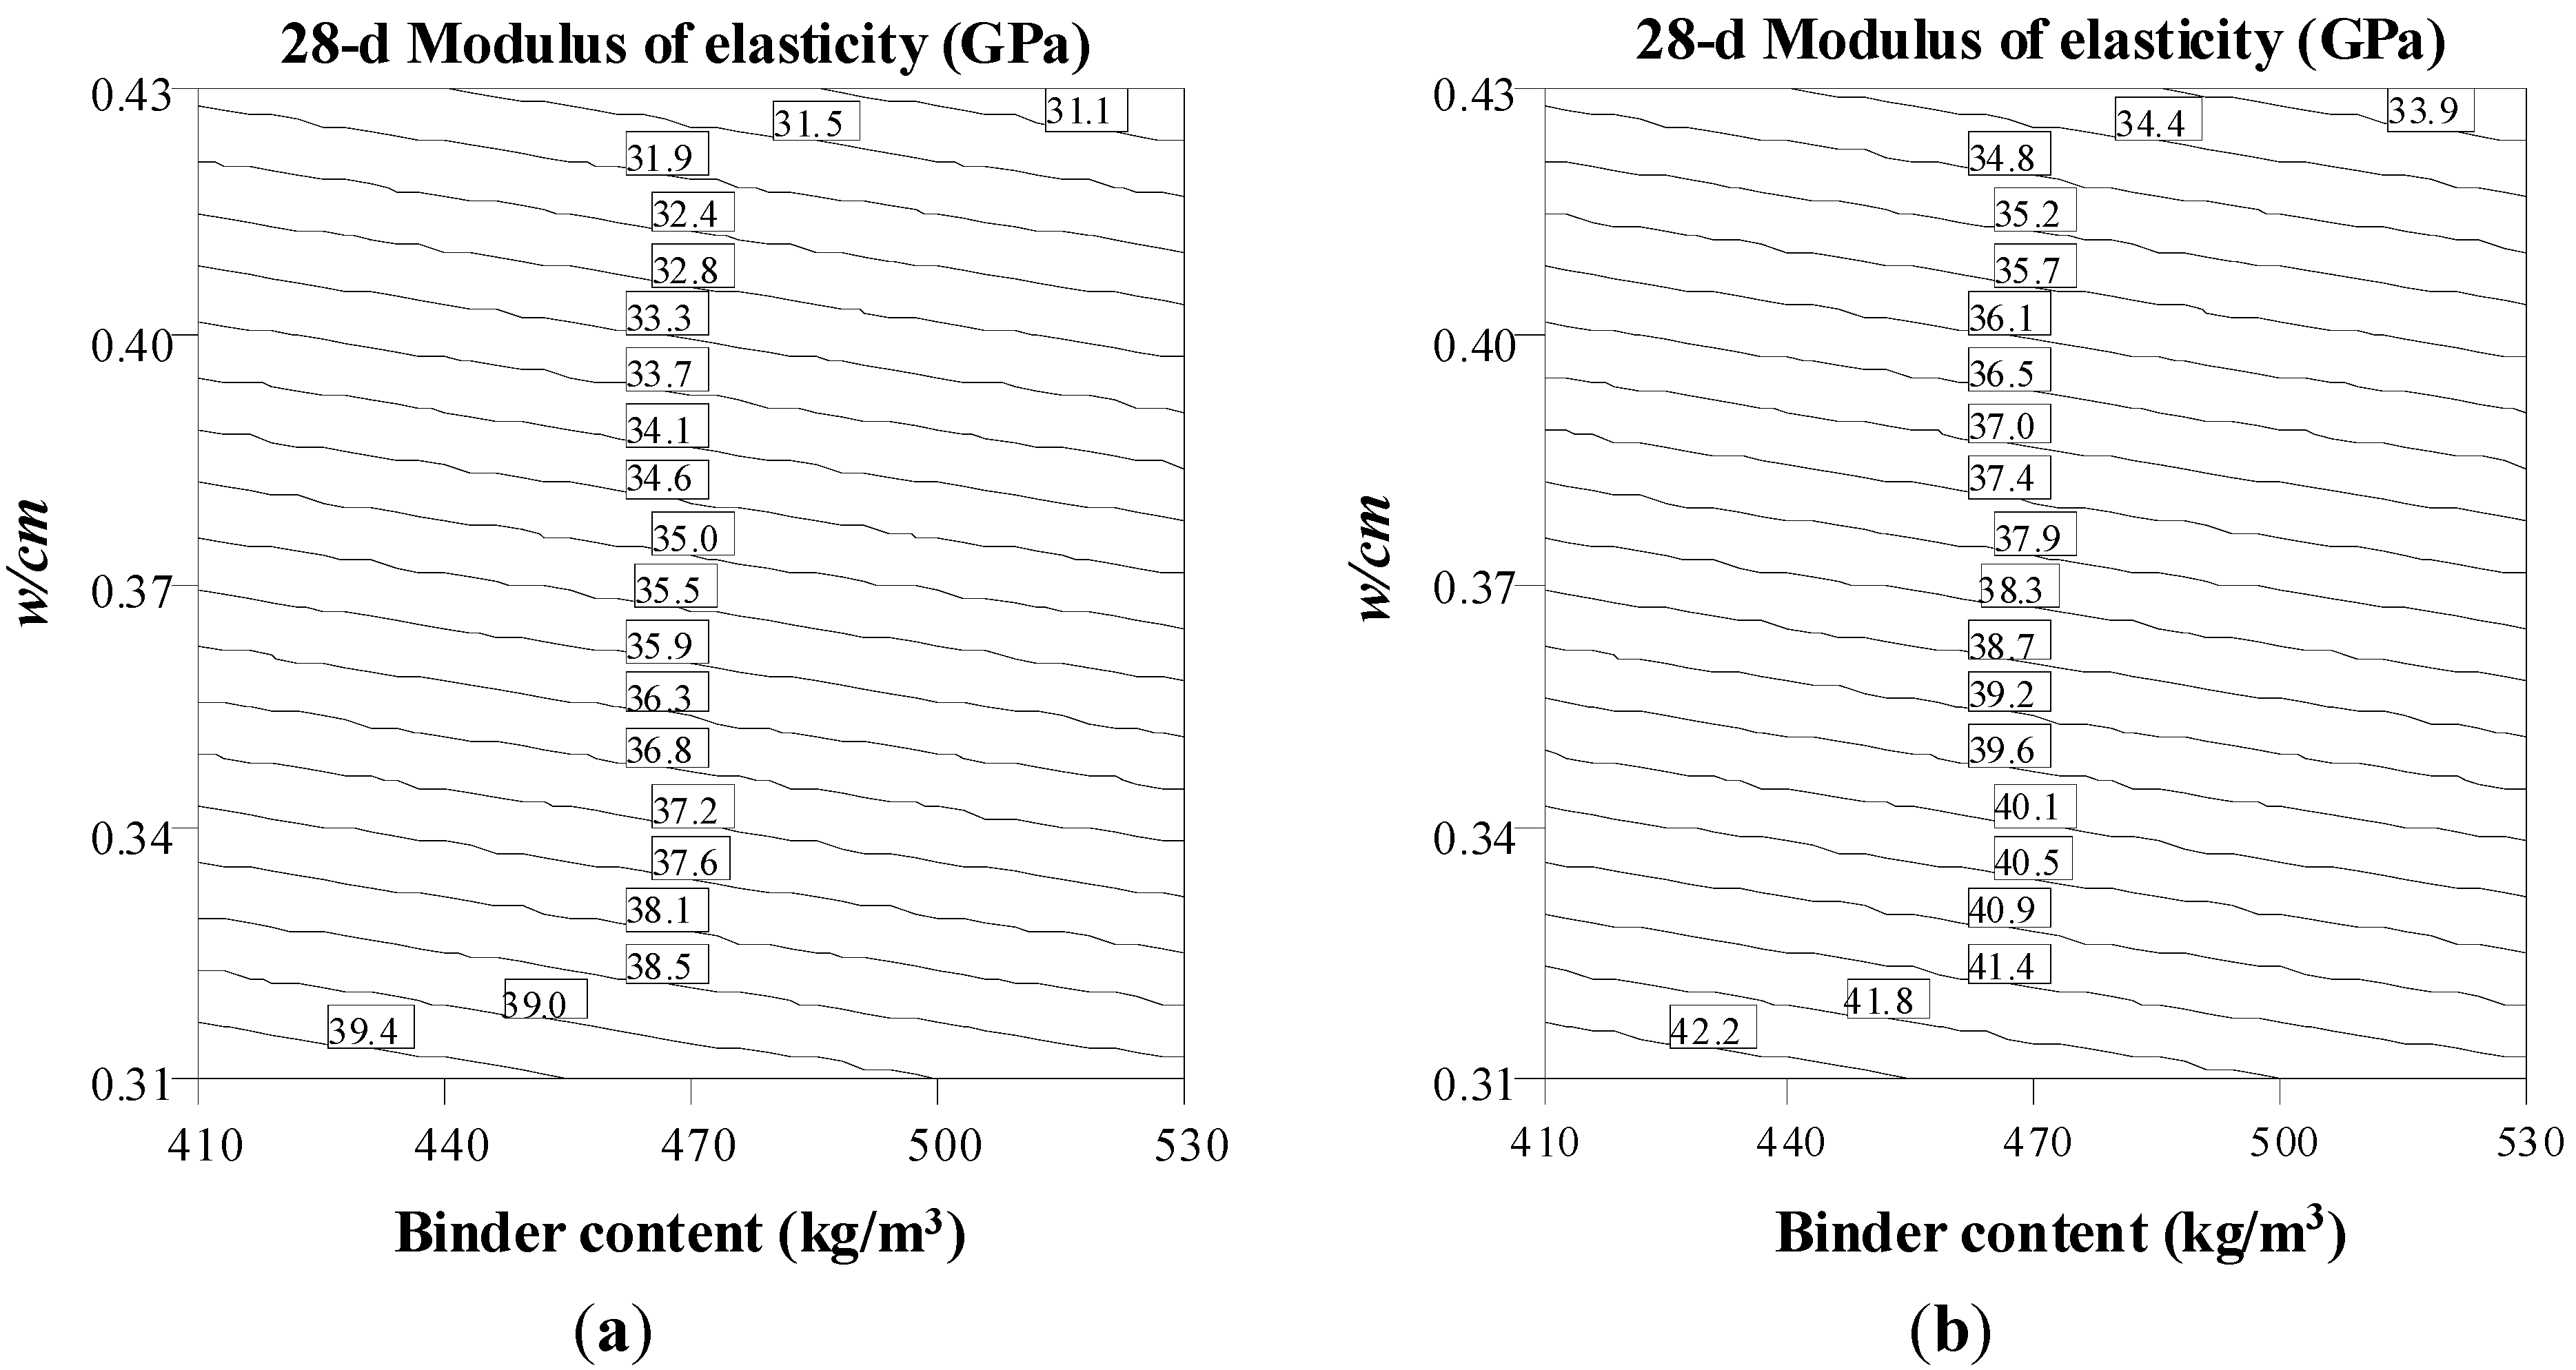
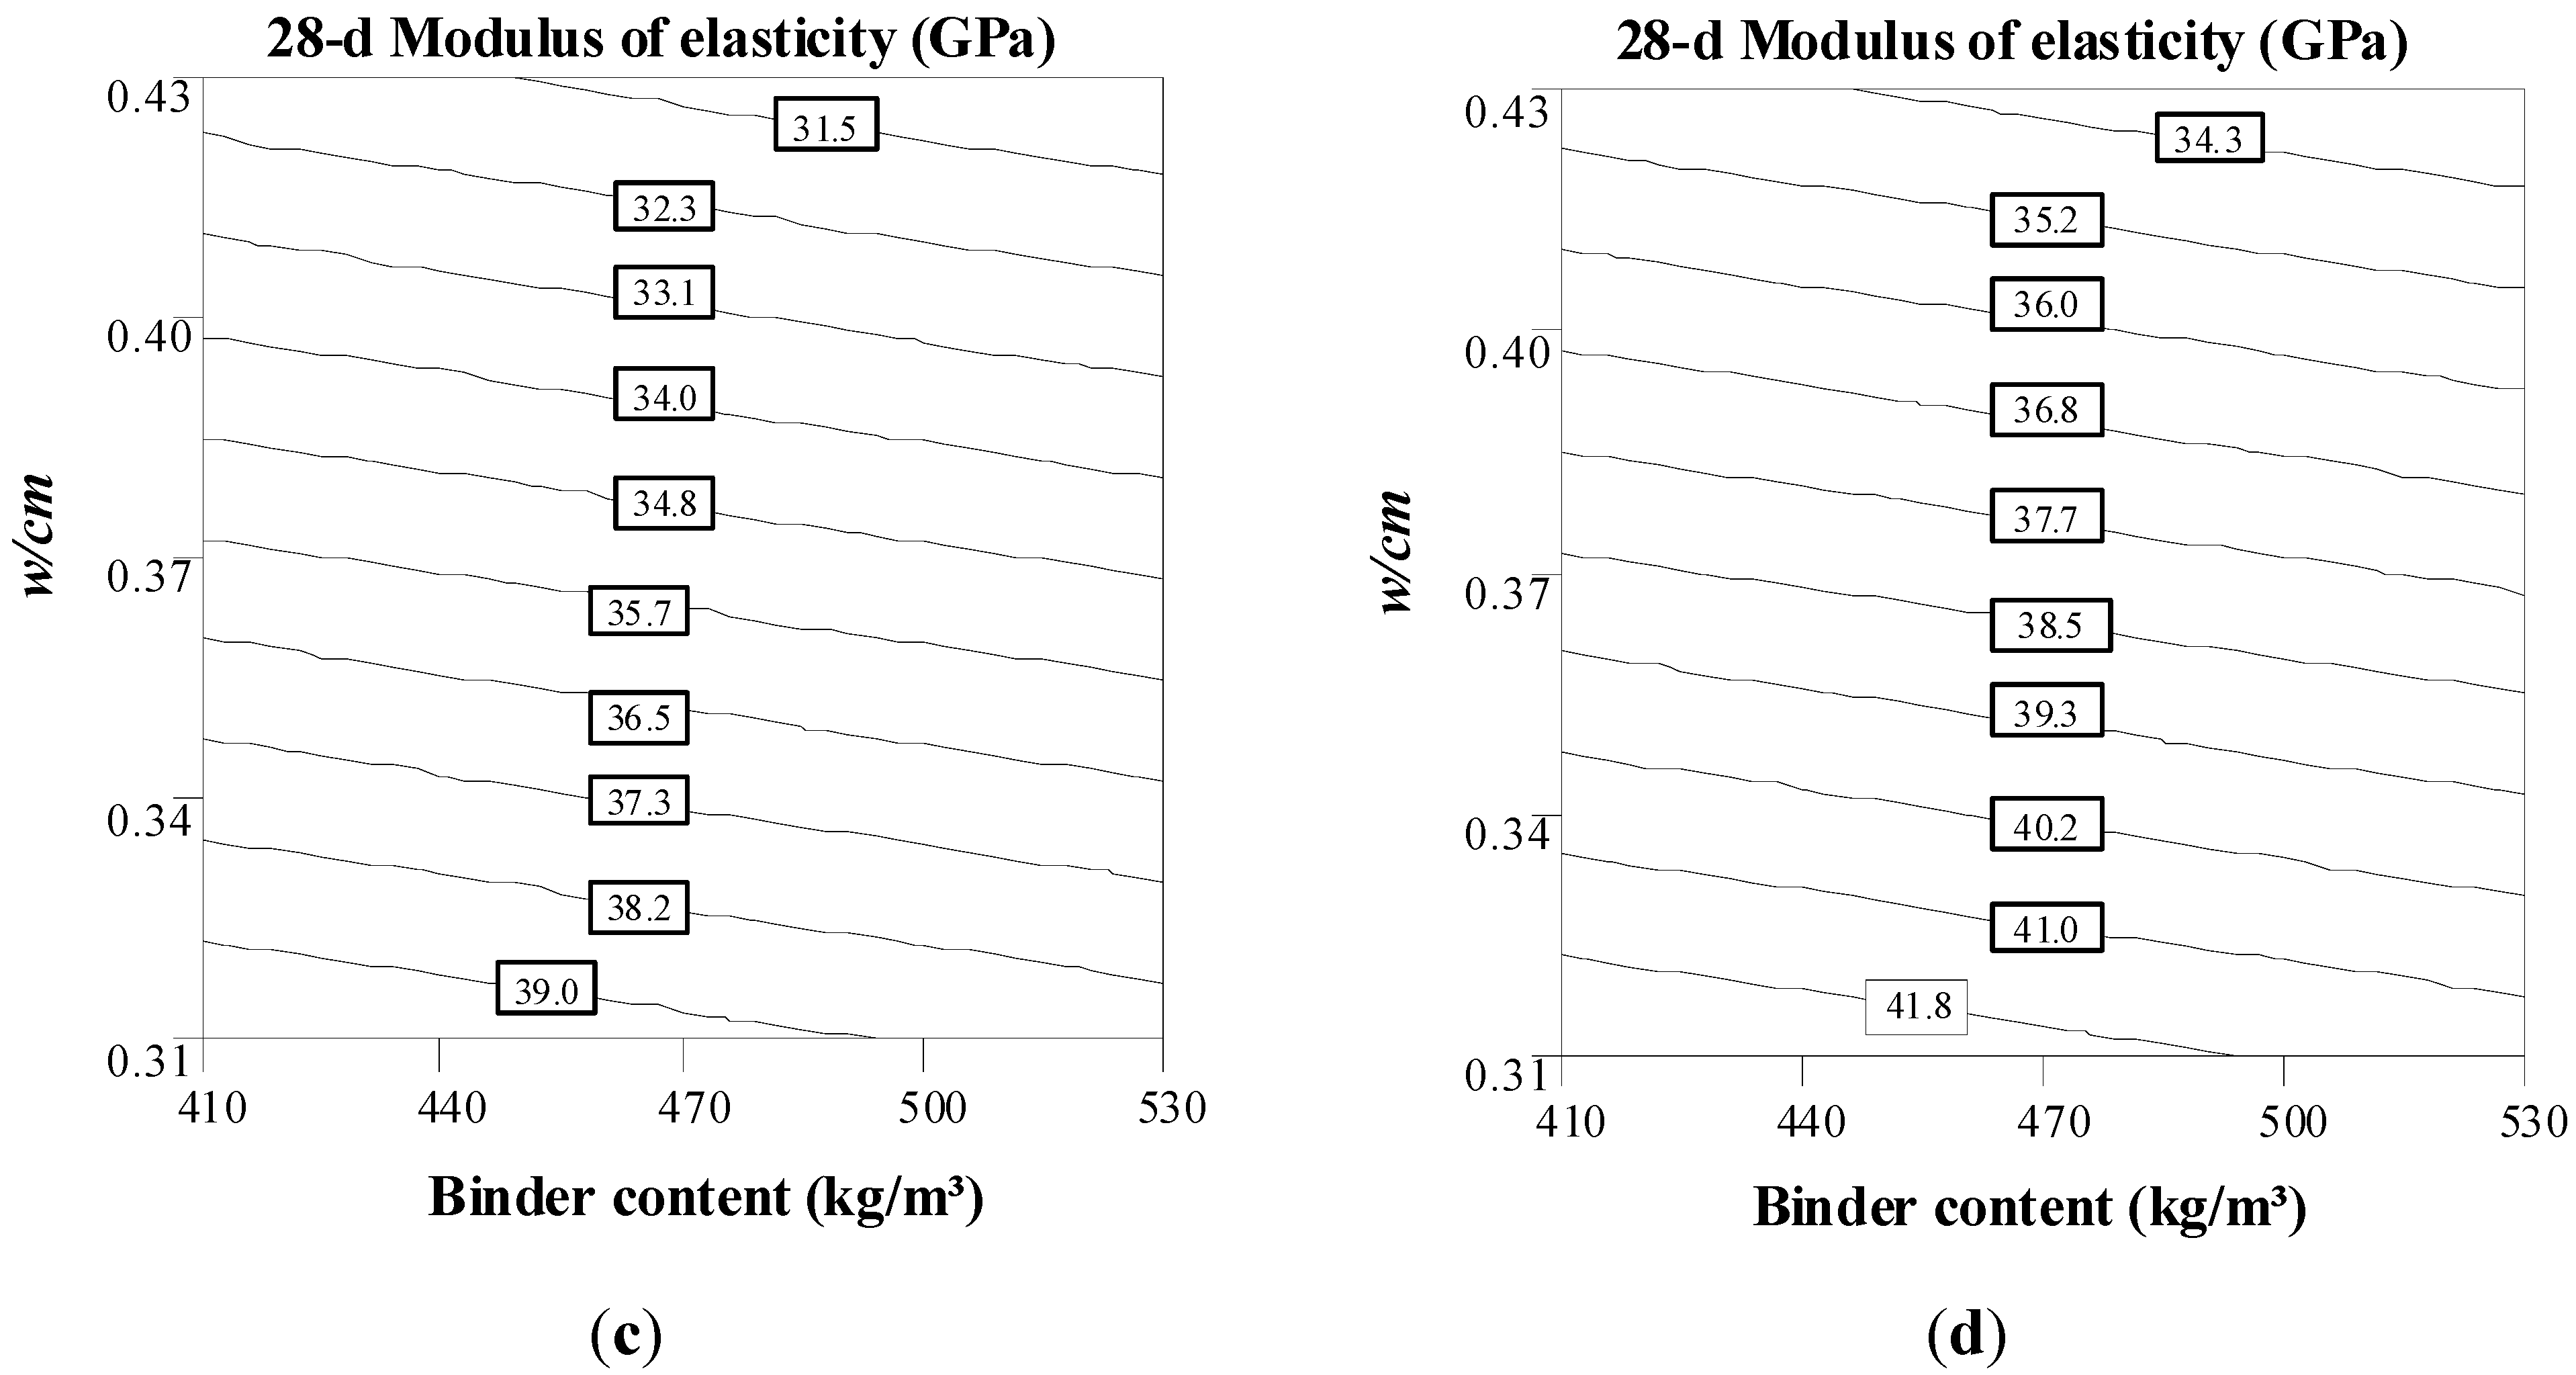
- Compressive strength and MOE are shown, as expected, to increase as the decrease in w/cm; furthermore, the increase in binder content leads to a decrease in MOE.
- The increase in S/A has negative effect on MOE at 28 and 56 days (moist curing).
- Type HE cement and 20% of Class F fly ash exhibit higher compressive strength and MOE at 28 and 56 days but lower mechanical properties at 18 h compared to Type MS cement.
3.2. Evaluation of Statistical Models for Mechanical Properties


3.3. Derived Statistical Models for Autogenous and Drying Shrinkage
| Property | Mean | Standard Deviation | Relative Error * in 90% Confidence Limit, (%) |
|---|---|---|---|
| 7 days autogenous shrinkage, μstrain | 115 | 4.8 | 4.8 |
| 28 days autogenous shrinkage, μstrain | 200 | 2.5 | 1.5 |
| 56 days autogenous shrinkage, μstrain | 230 | 2.9 | 1.5 |
| 28 days drying shrinkage, μstrain | 345 | 17.0 | 5.8 |
| 112 days drying shrinkage, μstrain | 505 | 11.9 | 2.8 |
| 250 days drying shrinkage, μstrain | 600 | 5.8 | 1.1 |
| Property | Autogenous Shrinkage at 7 Days (μstrain) R2 = 0.92 | Autogenous Shrinkage at 56 Days (μstrain) R2 = 0.82 | Drying Shrinkage at 7 Days (μstrain) R2 = 0.70 | |||
| Model Type | Linear Model | Linear Model | Linear Model | |||
| Parameters | Estimates | Prob. > |t| | Estimates | Prob. > |t| | Estimates | Prob. > |t| |
| Intercept | +129.87 | - | +217.0 | - | +173.23 | - |
| Binder content | NS * | NS | +8.33 | 0.100 | +16.21 | 0.068 |
| w/cm | −37.42 | 0.001 | −37.5 | 0.001 | −43.46 | 0.001 |
| Binder type | +30.75 | 0.001 | +54.75 | 0.001 | NS | NS |
| BC·w/cm | −21.63 | 0.001 | −18.75 | 0.033 | NS | NS |
| BC·BT | −15.88 | 0.001 | NS | NS | NS | NS |
| BC·S/A | +9.88 | 0.001 | +17.75 | 0.043 | NS | NS |
| BC·VMA | NS | NS | NS | NS | −18.56 | 0.087 |
| w/cm·VMA | NS | NS | NS | NS | +20.69 | 0.058 |
| w/cm·BT | −20.13 | 0.001 | NS | NS | NS | NS |
| Property | Drying shrinkage at 28 Days (μstrain) R2 = 0.72 | Drying shrinkage at 112 Days (μstrain) R2 = 0.82 | Drying shrinkage at 250 Days (μstrain) R2 = 0.73 | |||
| Model Type | Linear Model | Linear Model | Linear Model | |||
| Parameters | Estimates | Prob. > |t| | Estimates | Prob. > |t| | Estimates | Prob. > |t| |
| Intercept | +323.23 | - | +517.77 | - | +620.00 | - |
| Binder content | +31.54 | 0.024 | +41.33 | 0.009 | +47.50 | 0.006 |
| w/cm | −45.71 | 0.002 | −36.25 | 0.019 | −39.17 | 0.021 |
| S/A | NS | NS | +26.58 | 0.078 | +29.75 | 0.072 |
| BC·VMA | −28.19 | 0.091 | −44.38 | 0.019 | −51.00 | 0.015 |
| w/cm·VMA | +48.44 | 0.006 | +45.13 | 0.018 | +50.75 | 0.015 |
| w/cm·BT | +28.81 | 0.084 | +41.88 | 0.026 | NS | NS |
| VMA·BT | +30.81 | 0.066 | +42.63 | 0.024 | +47.63 | 0.022 |
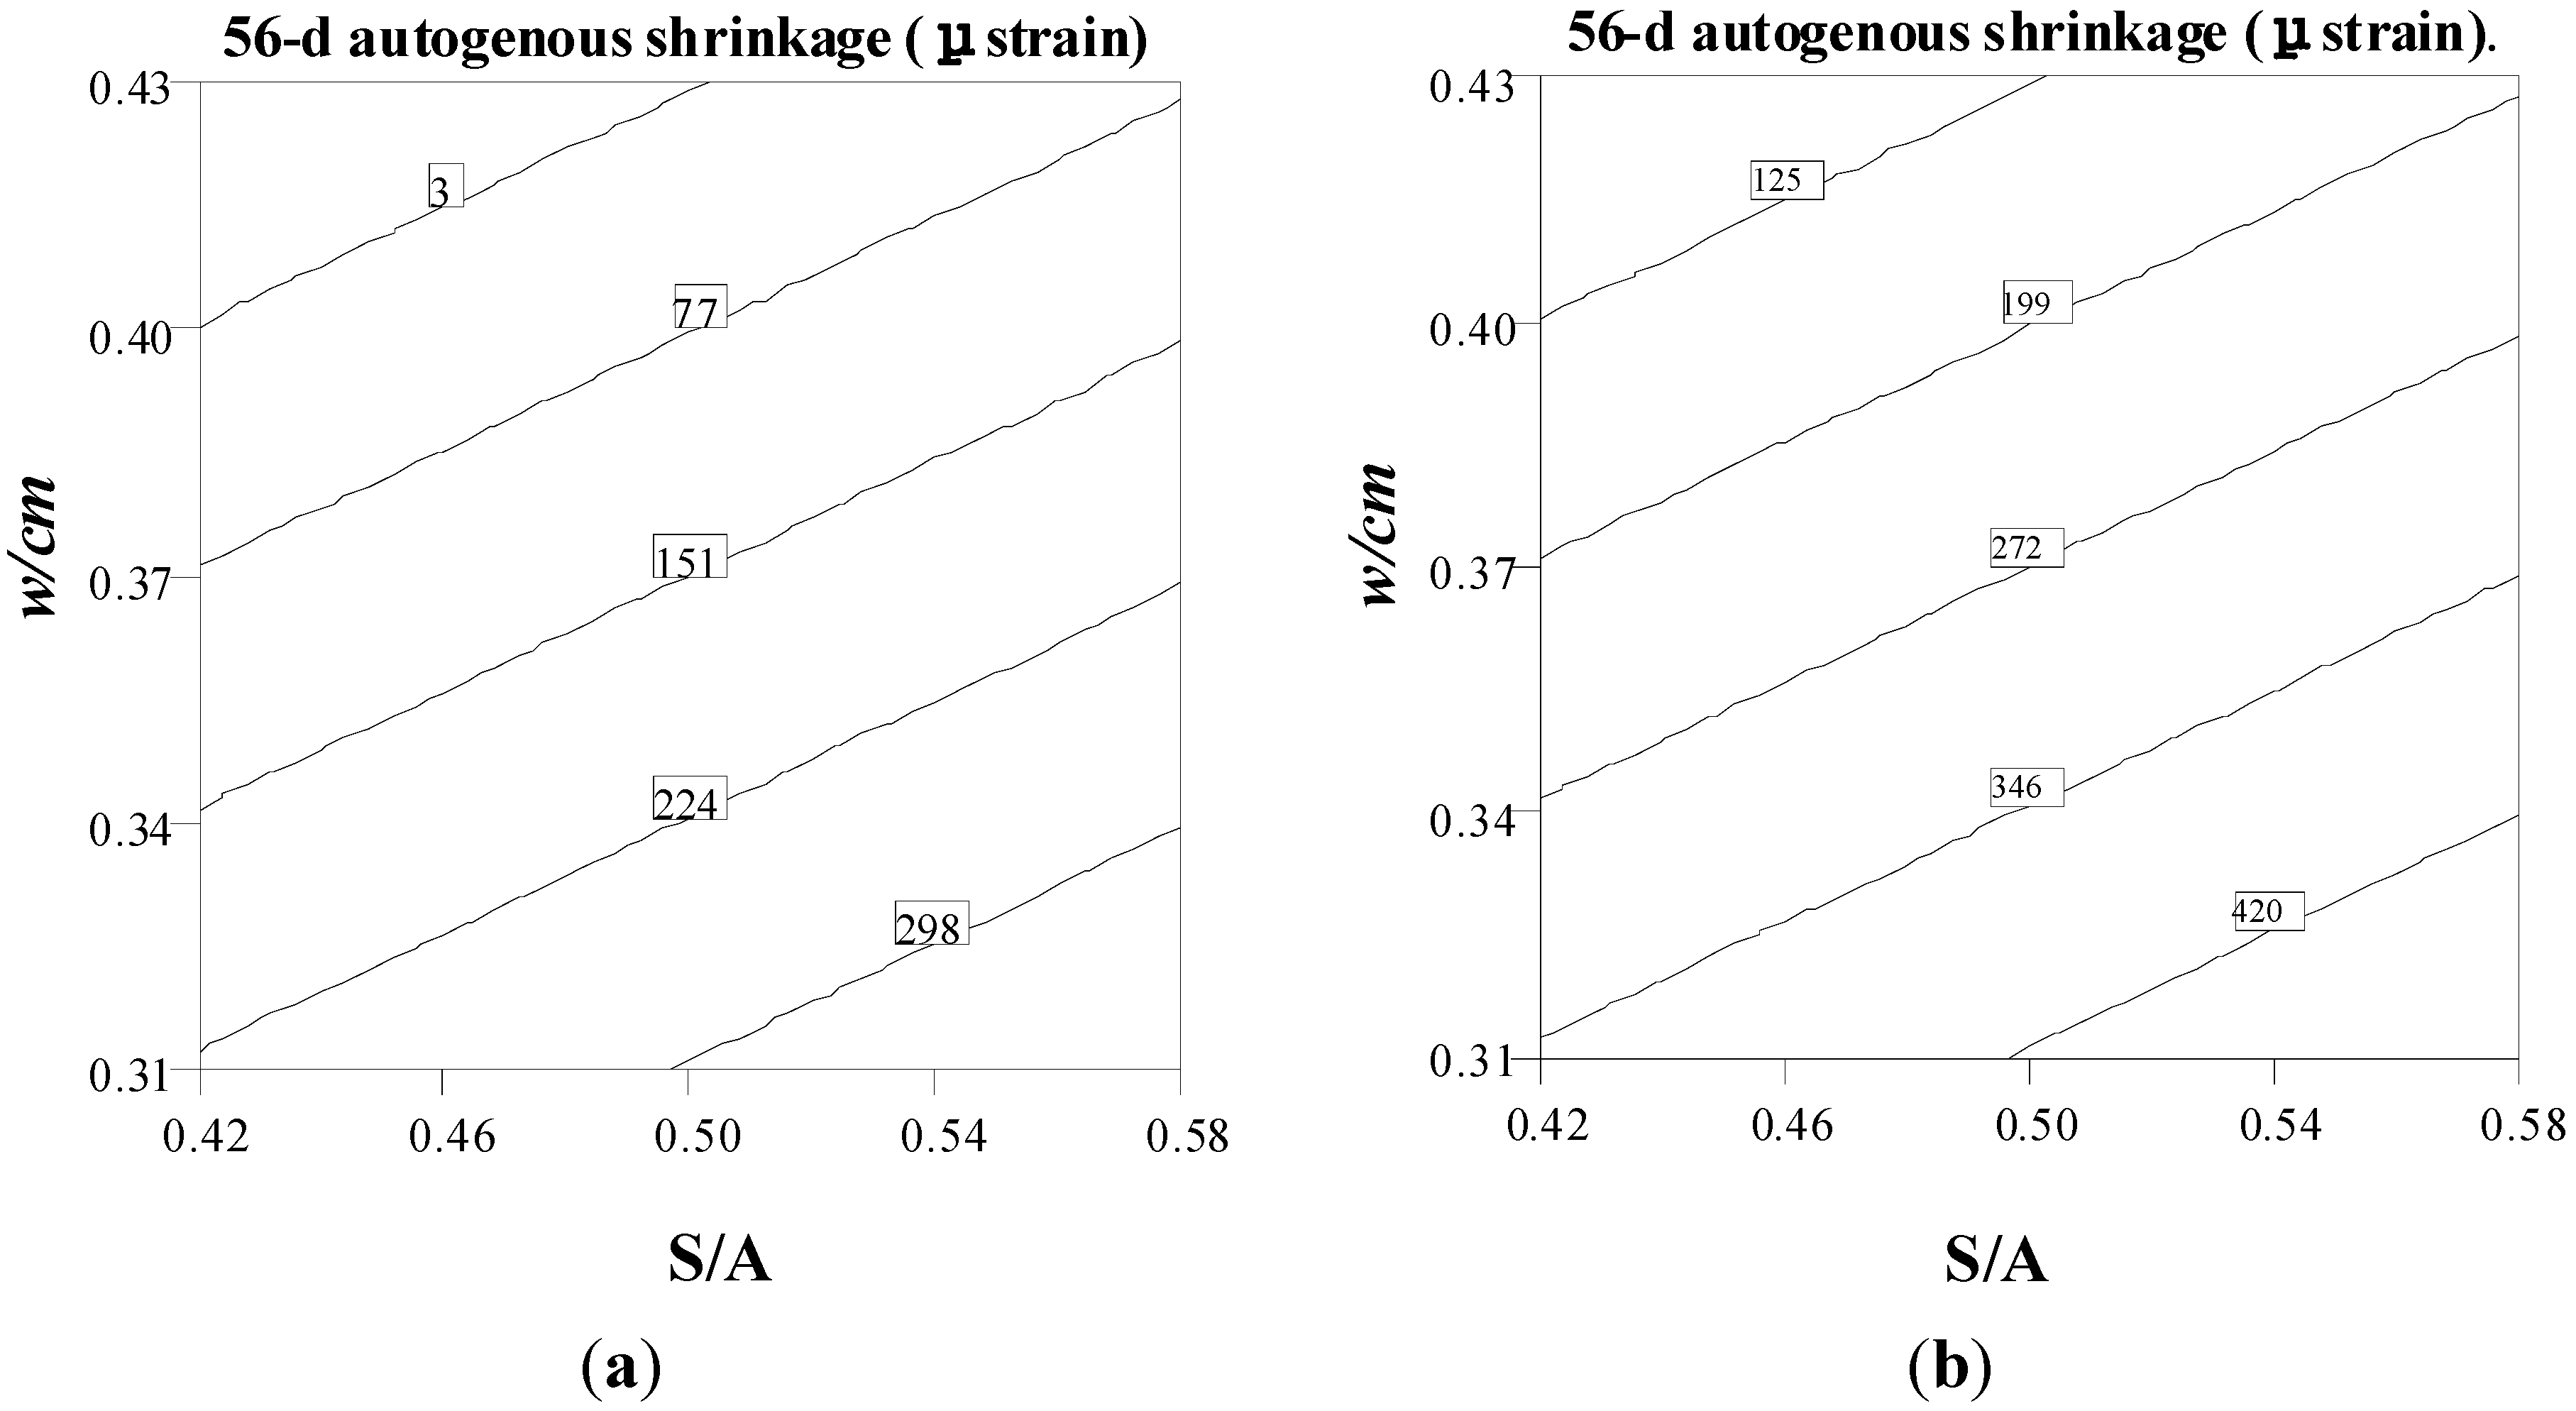
- Autogenous shrinkage of SCC decreases as w/cm increases.
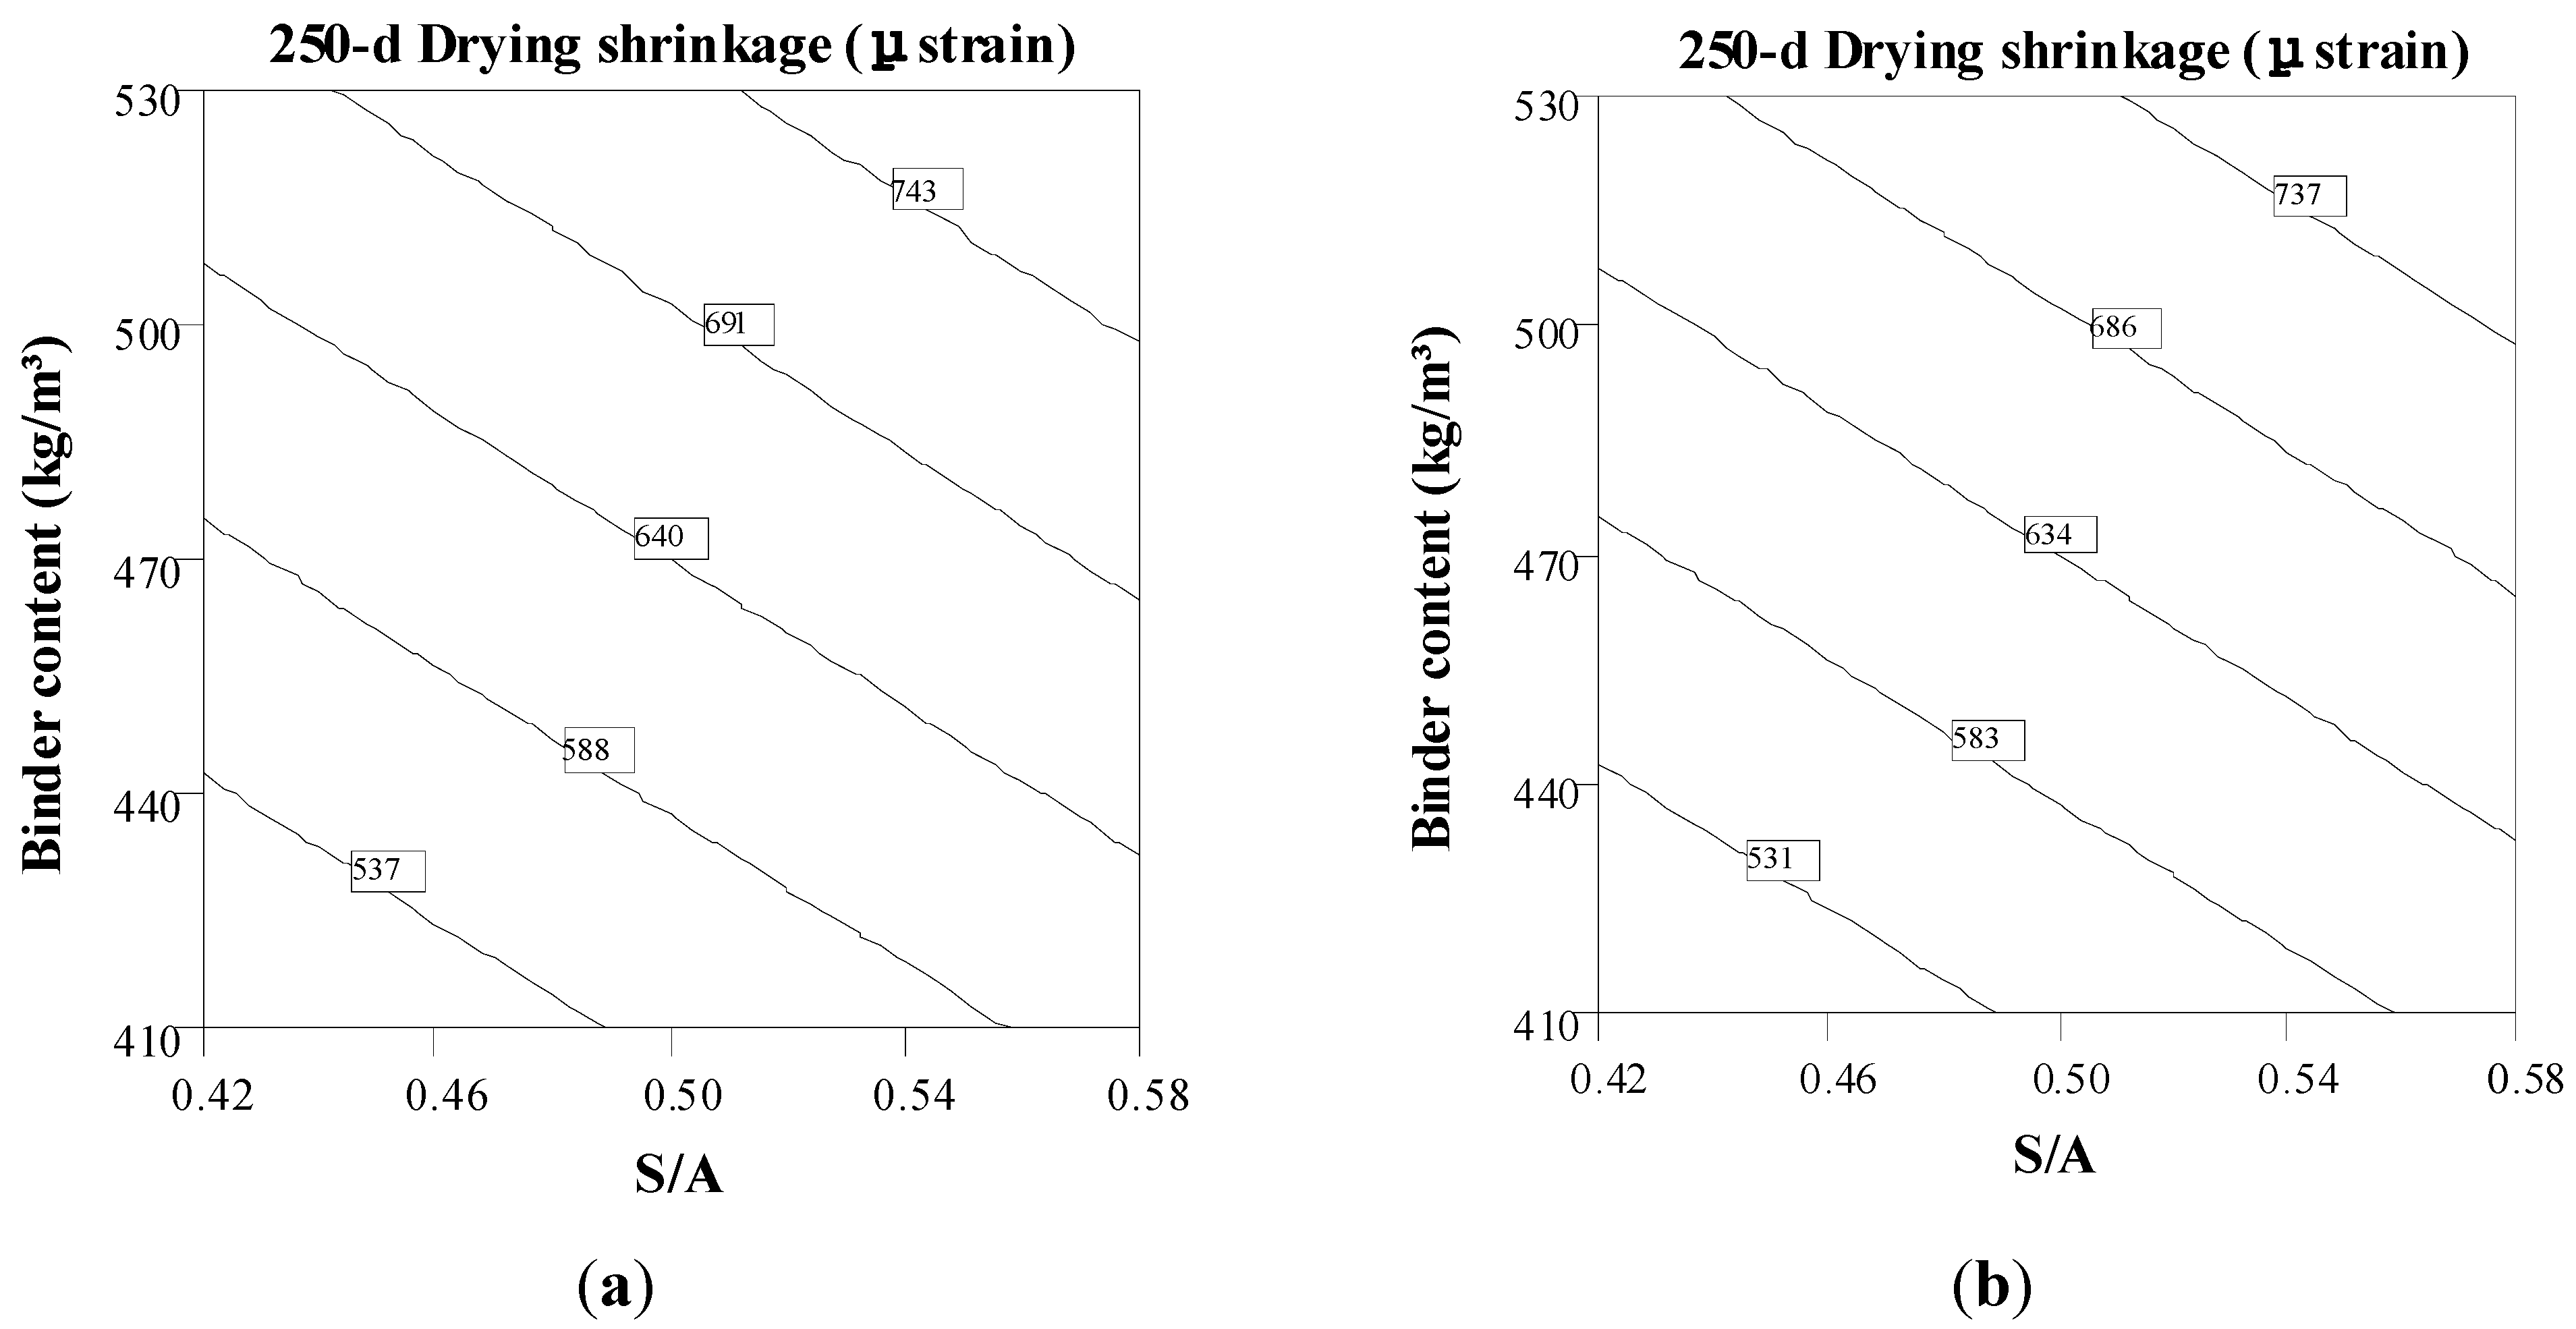
- Increase in binder content leads to an increase in drying shrinkage.
- For a given binder content, drying shrinkage of concrete does not increase with w/cm. This is because the drying shrinkage measurement also includes autogenous shrinkage, which obviously decreases with the increase in w/cm.
- SCC made with Type HE cement and 20% Class F fly ash develops higher autogenous shrinkage compared to concrete prepared with Type MS cement.
- Binder type and thickening-type VMA do not have a significant effect on drying shrinkage.
| Property | Age | Derived Equations | R2 |
|---|---|---|---|
| Autogenous shrinkage, μstrain | 7 days | +129.9 − 37.4 w/cm + 30.8 BT − 21.6 (BC·w/cm) − 20.1 (w/cm·BT) − 15.9 (BC·BT) + 9.9 (BC·S/A) | 0.92 |
| 56 days | +217.0 + 54.8BT − 37.5 w/cm + 8.3 BC − 18.8 (BC·w/cm) + 17.8 (BC·S/A) | 0.82 | |
| Drying shrinkage, μstrain | 7 days | +173.2 − 43.5 w/cm +16.2 BC − 18.6 (BC·VMA) + 20.7 (w/cm·VMA) | 0.70 |
| 28 days | +323.2 − 45.7 w/cm + 31.5 BC + 48.4 (w/cm·VMA) + 28.8 (w/cm·BT) − 28.2 (BC·VMA) + 30.8 (VMA· BT) | 0.72 | |
| 112 days | +517.8 + 41.3 BC − 36.3 w/cm + 26.6 S/A + 45.1 (w/cm·VMA) − 44.4 (BC·VMA) + 42.6 (VMA·BT) + 41.9 (w/cm·BT) | 0.82 | |
| 250 days | +620.0 + 47.5 BC − 39.2 w/cm + 29.8S/A − 51.0 (BC·VMA) + 50.8 (w/cm·VMA) + 47.6 (VMA·BT) | 0.73 |
3.4. Evaluation of Statistical Models for Visco-Elastic Properties

3.5. Extension of the Statistical Models
| Modeled Region | Autogenous Shrinkage | Drying Shrinkage | Compressive Strength | MOE | |||
|---|---|---|---|---|---|---|---|
| 7 Days | 56 Days | 28 Days | 112 Days | 56 Days | 18 h | 56 Days | |
| −1, +1 | 0.96 | 0.93 | 0.78 | 0.96 | 0.87 | 0.89 | 0.87 |
| −2, +2 | 0.92 | 0.82 | 0.72 | 0.82 | 0.79 | 0.73 | 0.85 |
4. Conclusions
- In terms of mechanical properties, w/cm had the highest effect on compressive strength and modulus of elasticity; moreover, the content and type of binder had a considerable effect on mechanical properties. The modulus of elasticity was also affected by the S/A, and VMA content did not show a significant effect on mechanical properties.
- In terms of visco-elastic properties, w/cm was found to be the most significant factor, and the binder type also had a significant effect on autogenous shrinkage. Furthermore, drying shrinkage varied mainly with the binder content; in most cases, the VMA had a minor effect on autogenous and drying shrinkage.
- Based on the results from the derived models that were extended to the −2 to +2 region, no significant difference can be found between the statistical models (−1 to +1) and those extended to −2 to +2. In order to eliminate the outer regions approaching the edges of the modeled region and to minimize the prediction error, the model region can be limited to coded values of −1.5 to +1.5.
Acknowledgments
Author Contributions
Conflicts of Interest
References
- Okamura, H.; Ouchi, M. Self-compacting concrete. J. Adv. Concr. Technol. 2003, 1, 5–15. [Google Scholar] [CrossRef]
- Self-Consolidating Concrete; ACI Committee 237R-07; American Concrete Institute: Farmington Hills, MI, USA, 2007; p. 30.
- European Federation of National Trade Associations (EFNARC). The European Guidelines for Self-Compacting Concrete; EFNARC: Surrey, UK, 2005; p. 63. [Google Scholar]
- Nehdi, M.L. Only tall things cast shadows: Opportunities, challenges and research needs of self-consolidating concrete in super-tall. Constr. Build. Mater. 2013, 48, 80–90. [Google Scholar] [CrossRef]
- Phelan, W.S. Self-consolidating concrete (SCC): Today’s challenge and tomorrow’s prosperity. In Proceedings of the 5th North American Conference on Design and Use of Self-Consolidating Concrete, Chicago, IL, USA, 12–15 May 2013; p. 4.
- Pawlikowski, J.J.; Rankin, D.S.; Young, B.S. SCC in iconic supertall towers: Trump tower, Chicago, USA; Infinity Tower, Dubai, UAE; Burj Khalifa, Dubai, UAE. In Proceedings of the 5th North American Conference on Design and Use of Self-Consolidating Concrete, Chicago, IL, USA, 12–15 May 2013; p. 11.
- Juvas, K. Experiences of working with self-compacting concrete in the precast industry. In Proceedings of the 5th International RILEM Symposium on Self-Compacting Concrete, Ghent, Belgium, 3–5 September 2007; pp. 933–938.
- Camacho, R.; Afif, R.; Corona, G.; Roman, H.; Sanchez, M. Applications of SCC technology for precast/prestressed elements: The Mexican experiences. In Proceedings of the 5th International RILEM Symposium on Self-Compacting Concrete, Ghent, Belgium, 3–5 September 2007; pp. 1071–1078.
- Domone, P.L. Self-compacting concrete: An analysis of 11 years of case studies. Cem. Concr. Comps. 2006, 28, 197–208. [Google Scholar] [CrossRef]
- Naito, C.; Hoover, M. Applicability of self-consolidating concrete for use in precast bridge beam construction. In Proceedings of the Combining the Second North American Conference on the Design and Use of Self-Consolidating Concrete and the Fourth International RILEM Symposium on Self-Compacting Concrete, Chicago, IL, USA, 30 October–2 November 2005.
- Long, W.J.; Khayat, K.H.; Lemieux, G.; Hwang, S.D.; Han, N.X. Performance-based specifications of workability characteristics of prestressed, precast self-consolidating concrete—A North American prospective. Materials 2014, 7, 2474–2489. [Google Scholar] [CrossRef]
- Khayat, K.H. Workability, testing, and performance of self-consolidating concrete. ACI. Mater. J. 1996, 96, 346–353. [Google Scholar]
- Long, W.J.; Khayat, K.H.; Hwang, S.D. Mechanical properties of prestressed self-consolidating concrete. Mater. Struct. 2013, 46, 1473–1487. [Google Scholar] [CrossRef]
- Long, W.J.; Khayat, K.H. Creep of prestressed self-consolidating concrete. ACI. Mater. J. 2011, 108, 476–484. [Google Scholar]
- Long, W.J.; Lemieux, G.; Hwang, S.D.; Khayat, K.H. Statistical models to predict fresh and hardened properties of self-consolidating concrete. Mater. Struct. 2012, 45, 1035–1052. [Google Scholar] [CrossRef]
- Khayat, K.H.; Ghezal, A.; Hadriche, M.S. Utility of statistical models in proportioning self-consolidating concrete. Mater. Struct. J. 2000, 33, 338–344. [Google Scholar] [CrossRef]
- Lotfy, A.; Hossain, K.M.A.; Lachemi, M. Application of statistical models in proportioning lightweight self-consolidating concrete with expanded clay aggregates. Constr. Build. Mater. 2014, 65, 450–469. [Google Scholar] [CrossRef]
- Filho, F.M.A.; Barragán, B.E.; Casas, J.R. Debs ALHCE, Hardened properties of self-compacting concrete-a statistical approach. Constr. Build. Mater. 2010, 24, 1608–1615. [Google Scholar] [CrossRef] [Green Version]
- Kanadasan, J.; Razak, H.A. Mix design for self-compacting palm oil clinker concrete based on particle packing. Mater. Des. 2014, 56, 9–19. [Google Scholar] [CrossRef]
- Khaleel, O.R.; Razak, H.A. Mix design method for self-compacting metakaolin concrete with different properties of coarse aggregate. Mater. Des. 2014, 53, 691–700. [Google Scholar] [CrossRef]
- Dinakar, P.; Manu, S.N. Concrete mix design for high strength self-compacting concrete using metakaolin. Mater. Des. 2014, 60, 661–668. [Google Scholar] [CrossRef]
- Sonebi, M.; Bassuoni, M.T. Investigating the effect of mixture design parameters on pervious concrete by statistical modeling. Constr. Build. Mater. 2013, 38, 147–154. [Google Scholar] [CrossRef]
- Sonebi, M.; Cevik, A. Prediction of fresh and hardened properties of self-consolidating concrete using neurofuzzy approach. J. Mater. Civ. Eng. 2009, 21, 672–679. [Google Scholar] [CrossRef]
- Sonebi, M. Applications of statistical models in proportioning medium-strength self-consolidating concrete. ACI. Mater. J. 2004, 101, 339–346. [Google Scholar]
- Nunes, S.; Milheiro-Oliveira, P.; Coutinho, J.S.; Figueiras, J. Robust SCC mixes through mix design. J. Mater. Civ. Eng. 2013, 25, 183–193. [Google Scholar] [CrossRef]
- Bassuoni, M.T.; Nehdi, M.L. Neuro-fuzzy based prediction of the durability of self-consolidating concrete to various sodium sulfate exposure regimes. Comput. Concr. 2008, 5, 573–597. [Google Scholar] [CrossRef]
- Montgomery, D.C. Design and Analysis of Experimental, 8th ed.; Wiley: Hoboken, NJ, USA, 2007; p. 752. [Google Scholar]
- Standard Method of Test for Sieve Analysis of Fine and Coarse Aggregates; AASHTO T-27; American Association of State Highway Transportation Officials (AASHTO): Washington, DC, USA, 2011; p. 8.
- Standard Specification for Chemical Admixtures for Concrete; ASTM C494/C494M-13; American Society for Testing and Materials: West Conshohocken, PA, USA, 2013.
- Standard Practice for Making and Curing Concrete Test Specimens in the Laboratory; ASTM C192–14/C192M-14; American Society for Testing and Materials: West Conshohocken, PA, USA, 2014.
- Standard Test Method for Compressive Strength of Cylindrical Concrete Specimens; ASTM C39/C39M-14a; American Society for Testing and Materials: West Conshohocken, PA, USA, 2014.
- Standard Test Method for Static Modulus of Elasticity and Poisson’s Ratio of Concrete in Compression; ASTM C469/C469M-14; American Society for Testing and Materials: West Conshohocken, PA, USA, 2014.
- Standard Test Method for Length Change of Hardened Hydraulic-Cement Mortar and Concrete; ASTM C157/C157M–08; American Society for Testing and Materials: West Conshohocken, PA, USA, 2008.
- LRFD Bridge Design Specifications, 4th ed.; American Association of State and Highway Officials: Washington, DC, USA, 2007; p. 1518.
- Design of Concrete Structures; CAN/CSA-A23.3–04(R2010); Canadian Standards Association (CSA): Rexdale, ON, USA, 2004; p. 258.
- Interim Guidelines for the Use of Self-Consolidating Concrete in PCI Member Plants; Precast/Prestressed Concrete Institute: Chicago, IL, USA, 2003; p. 148.
© 2015 by the authors; licensee MDPI, Basel, Switzerland. This article is an open access article distributed under the terms and conditions of the Creative Commons Attribution license (http://creativecommons.org/licenses/by/4.0/).
Share and Cite
Long, W.-J.; Khayat, K.H.; Lemieux, G.; Xing, F.; Wang, W.-L. Factorial Design Approach in Proportioning Prestressed Self-Compacting Concrete. Materials 2015, 8, 1089-1107. https://doi.org/10.3390/ma8031089
Long W-J, Khayat KH, Lemieux G, Xing F, Wang W-L. Factorial Design Approach in Proportioning Prestressed Self-Compacting Concrete. Materials. 2015; 8(3):1089-1107. https://doi.org/10.3390/ma8031089
Chicago/Turabian StyleLong, Wu-Jian, Kamal Henri Khayat, Guillaume Lemieux, Feng Xing, and Wei-Lun Wang. 2015. "Factorial Design Approach in Proportioning Prestressed Self-Compacting Concrete" Materials 8, no. 3: 1089-1107. https://doi.org/10.3390/ma8031089