The noncentrosymmetric α-KNaNbOF
5 belongs to the orthorhombic system with the space group Pna2
1, while the centrosymmetric β-KNaNbOF
5 is a tetragonal system with a space group of P4/nmm. The lattice parameters in [
10,
12] are:
a = 11.8653(11) Å,
b = 5.8826(6) Å,
c = 8.1258(8) Å for α-KNaNbOF
5;
a = 5.9352(2) Å,
c = 8.5487(5) Å for β-KNaNbOF
5, respectively. Starting from these experimental parameters, the structures in our calculations are obtained by minimizing the total energy.
3.1. Atomic Structure and Bonding Properties
Orthorhombic (α-) and tetragonal (β-) KNaNbOF
5 are investigated both within the local density approximation (LDA) and the generalized gradient approximation (GGA-PBE). Our estimations of the lattice parameters are listed in
Table 1, with LDA, PBE, and experimental results listed for comparison. It is well known that LDA lever calculations usually underestimate and GGA-lever calculations overestimate the lattice constants, which also occurs in our calculations. Since the PBE lattice constants of the β phase are closer to the experimental values (the error is around 1.47%–1.77%), the PBE function is used for further calculations.
Table 1.
The calculated lattice constants and the unit-cell volume in α- and β-KNaNbOF5. Δa, Δb and Δc are the relative errors of the calculated lattice constants compared to the experimental values. LDA = Local density approximation; PBE = Perdew, Burke, and Ernzerhof approximation; Exp. = Experimental values.
| Phase | Method | a (Å) | b (Å) | c (Å) | Volume (Å3) | Δa (%) | Δb (%) | Δc (%) |
|---|
| α-phase | Exp. [12] | 11.865 | 5.883 | 8.126 | 567.171 | - | - | - |
| LDA | 11.643 | 5.779 | 7.994 | 537.880 | −1.87 | −1.76 | −1.63 |
| PBE | 12.098 | 5.982 | 8.300 | 600.777 | +1.96 | +1.70 | +2.15 |
| β-phase | Exp. [10] | 5.935 | 5.935 | 8.549 | 301.142 | - | - | - |
| LDA | 5.816 | 5.816 | 8.385 | 283.629 | −2.01 | −2.01 | −1.91 |
| PBE | 6.040 | 6.040 | 8.674 | 316.502 | +1.77 | +1.77 | +1.47 |
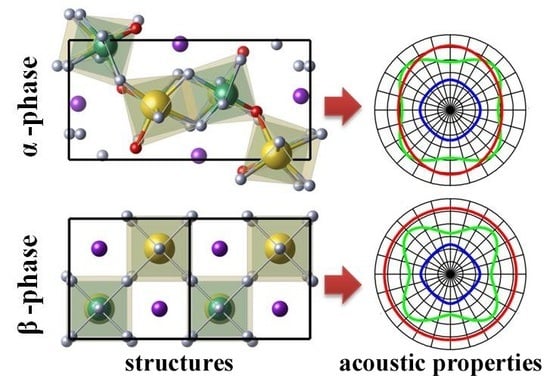
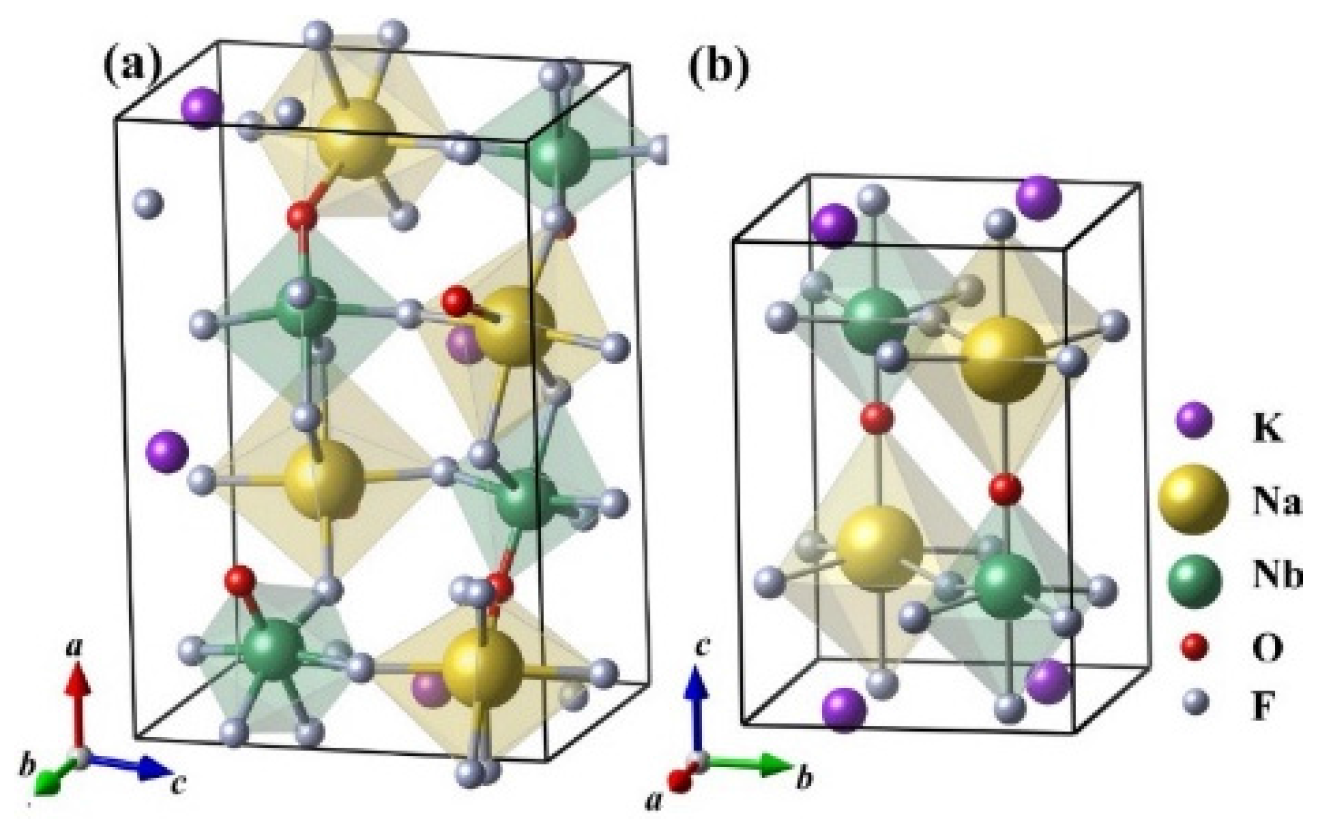
It can be found that α- and β-KNaNbOF
5 are very similar to each other, as shown in
Figure 1. Both crystal structures consist of [NbOF
5] and [NaOF
5] octahedron sharing vertices to form three-dimensional networks, with the K atoms occupying the interstitial sites. In the framework of [NaOF
5] and [NbOF
5], the Na and Nb atoms are coordinated by five F and one O atoms in a distorted octahedral arrangement. There are also obvious differences between them in crystal structure. Firstly, in α-KNaNbOF
5, the alternating NbOF
5 octahedra share both vertices and F-F edges, while in β-KNaNbOF
5, all the NbOF
5 octahedra share only vertices. Secondly, the K atoms are coordinated by six F atoms and one O atom in α-KNaNbOF
5, while the K atoms are coordinated by 8 F atoms in the β phase, without any surrounding O atoms in β-KNaNbOF
5. Thirdly, in α-KNaNbOF
5, all the atoms occupy the Wyckoff positions 4a, while in β-KNaNbOF
5, the K atoms occupy the Wyckoff position 2a; the Na, Nb and O atoms occupy positions 2c; and the remaining inequivalent fluorides occupy two kinds of Wyckoff positions (2c and 8j).
In order to make a detailed analysis, the Baur’s distortion index
D, the quadratic elongation <λ>, and the bond angle variance σ
2 can be used to evaluate the distortion of the structure, which are listed in
Table 2. The effective charge for each atom (charge difference after bonding) is determined using Bader charge analysis [
22,
23], which is given in
Table 3 with the corresponding calculated atomic positions. It can be found that the calculated values agree well with the experimental data. From these values, several conclusions can be made: (1) The Na-O and Na-F bond lengths are larger than that of Nb-O and Nb-F. Thus, the [NaOF
5] occupies a larger volume than [NbOF
5]; (2) The bond angle variances, σ
2, are larger in [NaOF
5] than [NbOF
5] octahedra, both in α- and β-KNaNbOF
5; (3) The Nb-O bond length in the α-phase (1.776 Å) is noticeably longer than that in the β-phase (1.757 Å); (4) The ionic formula of both α- and β-KNaNbOF
5 can be defined as K
+0.90Na
+0.90[NbOF]
5−1.80; (5) The effective charges on fluorides are different due to their different surroundings (−0.791–−0.698 for α-phase, and −0.813–−0.708 for β-phase).
To analyze the electronic structure of KNaNbOF
5, the electronic density of states (DOS), is illustrated in
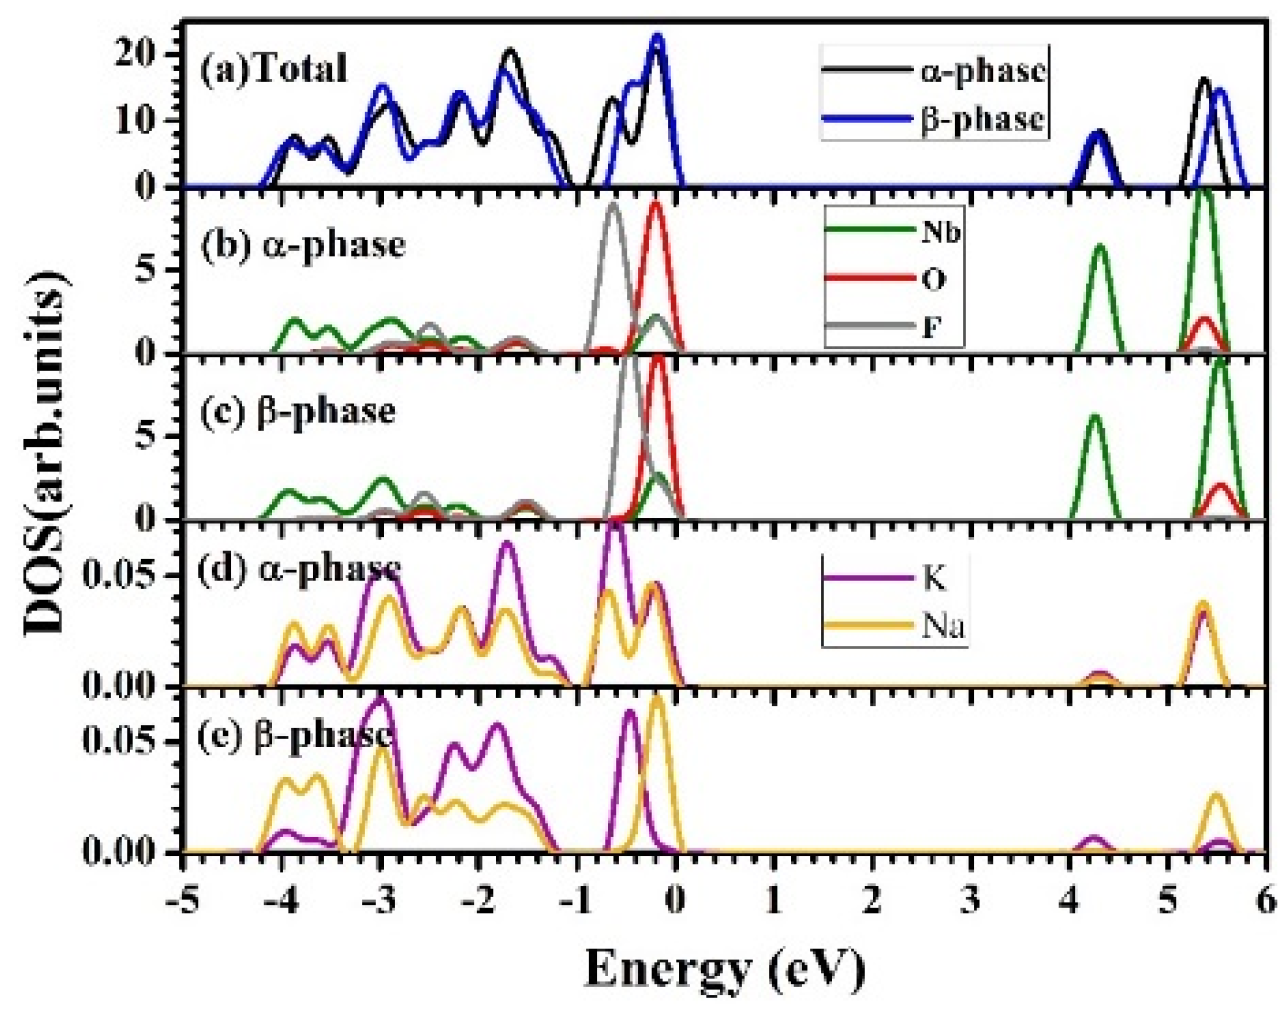
Figure 2. Although there are many differences in the structures between α- and β-KNaNbOF
5, their density of states is similar to each other, indicating that their bonding characters are similar. The projected density of states (PDOS) of F, O and Nb are localized, indicating their ionic characteristics. Both α- and β-KNaNbOF
5 are insulators with band gaps of about 4 eV. Although the band gap error is generally not definite due to the PBE approximation, the calculation method usually underestimates the value in most cases. Thus, it is very probable that the actual band gap is greater than 4 eV. Further experimental investigations might be necessary to confirm this result. From the PDOS, we find the peak near the Fermi surface (the top of the valence band) mainly consists of O-
2p, F-
2p and Nb-
4d states. The −0.4 eV peak is mainly contributed by the F-
2p state. Compared with the PDOS of F, O, and Nb, the PDOS of Na and K are negligible between −5 and 6 eV, as shown in
Figure 2d,e. The bottom of the conduction band is mainly contributed by the Nb-
4d states, which splits into two sub-bands. The peaks at 5.4 eV for the α-phase and at 5.5 eV for the β-phase should be the anti-bonding states contributed by O-
2p and Nb-
4d. This reflects a little covalent characteristic in the O-Nb interaction.
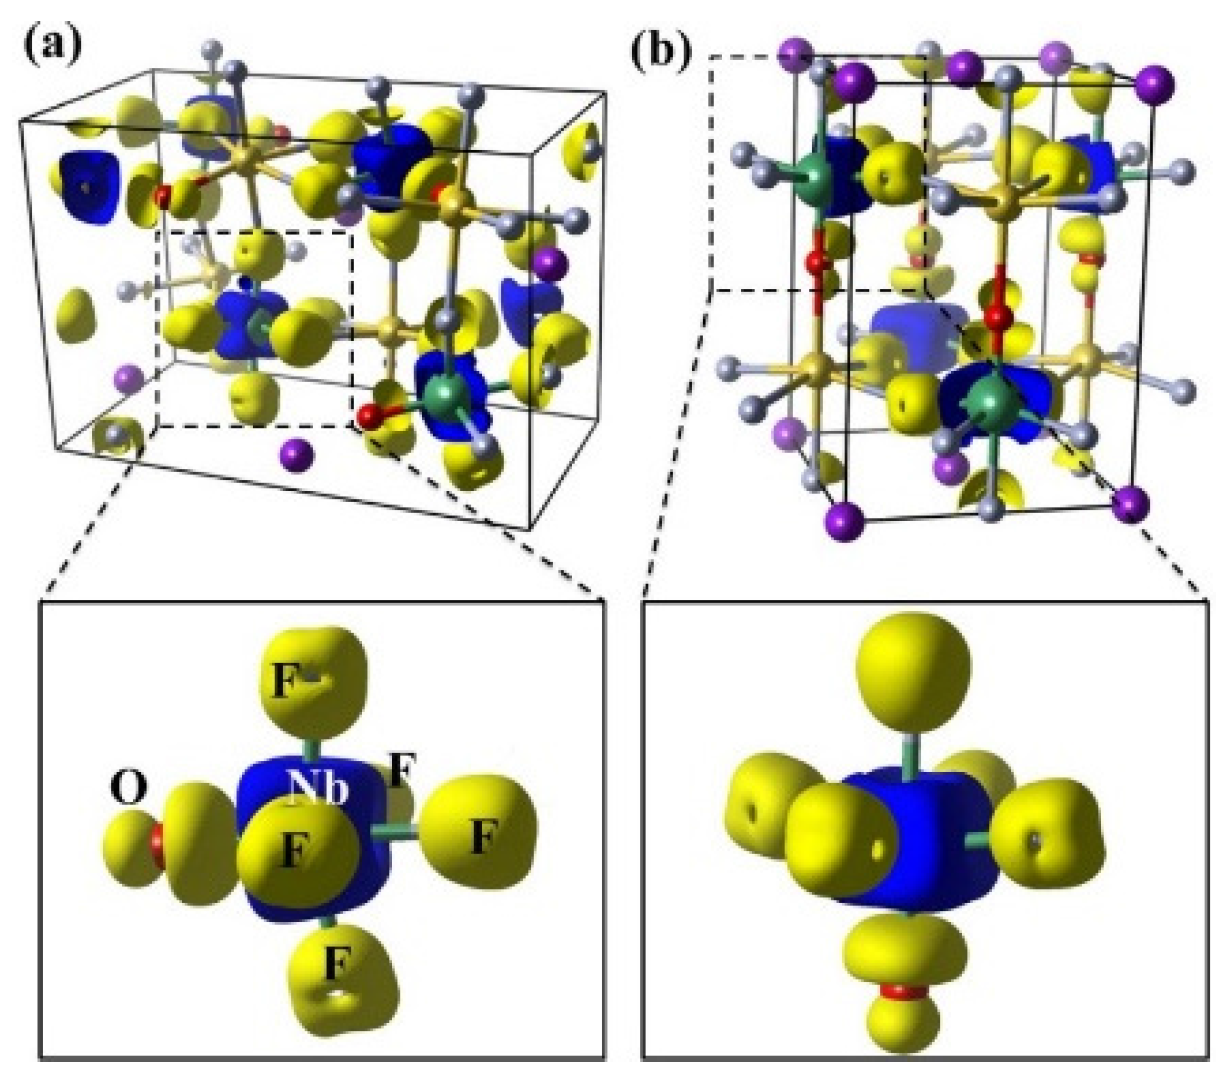
In order to further reveal the bonding properties of KNaNbOF
5, the charge differences between the crystal charge and the atomic charge are depicted in
Figure 3. The positive values mainly locate on the F and the O atoms, while the negative values mainly locate on the Nb atoms. This charge transfer indicates that the crystal is held together mainly by the ionic interactions between the Nb cations and the F/O anions. Moreover, the distribution of electrons gained by O-
2p is obviously asymmetric. The electron charge densities on the O-Nb bond are higher, illustrating a little covalent bonding characteristic between the Nb and the O. All these results are consistent with our previous DOS analysis.
Figure 1.
The crystal structures of KNaNbOF5 in different phases. The purple, golden, green, red and white spheres are K, Na, Nb, O and F atoms, respectively. The Na- and Nb-centered octahedra are also shown. (a) The orthorhombic noncentrosymmetric phase of KNaNbOF5 (α-phase, space group Pna21); (b) The tetragonal centrosymmetric phase of KNaNbOF5 (β-phase, space group P4/nmm). The crystal axes are also shown for clarity.
Figure 2.
The calculated Density of States (DOS) of α- and β-KNaNbOF
5 are plotted in (
a), while the Projected Density of States (PDOSs) of Nb, O and F are plotted in (
b,
c). The negligible PDOSs of K and Na are also shown in (
d,
e) for comparison. The Fermi level is set to zero. The PDOSs of different atoms are plotted by the same colors as in
Figure 1.
Figure 3.
Deformation charge density (difference between the crystal charge and the atomic charge distribution) of KNaNbOF5 in (a) the α-phase; and (b) the β-phase. The yellow and blue isosurfaces (1.5 × 10⁻² electrons/Bohr3) correspond to the electron increase and the depletion zone, respectively.
Figure 3.
Deformation charge density (difference between the crystal charge and the atomic charge distribution) of KNaNbOF5 in (a) the α-phase; and (b) the β-phase. The yellow and blue isosurfaces (1.5 × 10⁻² electrons/Bohr3) correspond to the electron increase and the depletion zone, respectively.
Table 2.
The geometric properties of the [NbOF
5] and [NaOF
5] octahedra of α-NaNbOF
5 and β-NaNbOF
5, including the average bond length
lav (in Å), the polyhedral volume
V (in Å
3), the distortion index
D, the quadratic elongation
<λ
>, and the bond angle variance σ
2 (in degree
2). The values calculated from experimental data in [
10,
12] are listed in brackets.
Table 2.
The geometric properties of the [NbOF5] and [NaOF5] octahedra of α-NaNbOF5 and β-NaNbOF5, including the average bond length lav (in Å), the polyhedral volume V (in Å3), the distortion index D, the quadratic elongation <λ>, and the bond angle variance σ2 (in degree2). The values calculated from experimental data in [10,12] are listed in brackets.
| Phase | Octahedra | lav | V | D | <λ> | σ2 |
|---|
| α-phase | [NbOF5] | 1.985 | 10.215 | 0.036 | 1.017 | 48.784 |
| (1.942) | (9.592) | (0.034) | (1.016) | (44.311) |
| [NaOF5] | 2.342 | 16.700 | 0.020 | 1.018 | 58.982 |
| (2.300) | (15.786) | (0.027) | (1.019) | (63.760) |
| β-phase | [NbOF5] | 1.990 | 10.230 | 0.039 | 1.023 | 65.121 |
| (1.944) | (9.546) | (0.040) | (1.022) | (63.543) |
| [NaOF5] | 2.337 | 16.663 | 0.010 | 1.015 | 51.677 |
| (2.310) | (16.118) | (0.011) | (1.014) | (48.468) |
Table 3.
The calculated atomic positions for KNaNbOF
5 with Pna2
1 symmetry for the α-phase and P4/nmm for the β-phase, respectively. The calculated lattice parameters are listed in
Table 1. WP refers to Wyckoff position, MP refers to multiplicity, and
Q refers to the atomic effective charge. The experimental data in [
10,
12] are listed in brackets.
Table 3.
The calculated atomic positions for KNaNbOF5 with Pna21 symmetry for the α-phase and P4/nmm for the β-phase, respectively. The calculated lattice parameters are listed in Table 1. WP refers to Wyckoff position, MP refers to multiplicity, and Q refers to the atomic effective charge. The experimental data in [10,12] are listed in brackets.
| Phase | Atom | WP | MP | x | y | z | Q (e) |
|---|
| α-phase | K | a | 4 | 0.0398(0.0385) | 0.4685(0.4680) | 0.0955(0.0927) | 0.903 |
| Na | a | 4 | 0.1373(0.1389) | 0.9509(0.9533) | 0.3401(0.3414) | 0.896 |
| Nb | a | 4 | 0.8480(0.8492) | 0.0407(0.0420) | 0.3328(0.3334) | 2.796 |
| O | a | 4 | 0.7219(0.7225) | 0.8998(0.9016) | 0.2919(0.2940) | −0.977 |
| F1 | a | 4 | 0.0023(0.0029) | 0.2167(0.2169) | 0.3701(0.3700) | −0.791 |
| F2 | a | 4 | 0.8731(0.8725) | 0.1485(0.1472) | 0.1093(0.1090) | −0.702 |
| F3 | a | 4 | 0.9529(0.9527) | 0.7849(0.7853) | 0.2979(0.2976) | −0.720 |
| F4 | a | 4 | 0.8595(0.8609) | 0.9625(0.9650) | 0.5655(0.5650) | −0.708 |
| F5 | a | 4 | 0.7874(0.7879) | 0.3353(0.3356) | 0.3956(0.3956) | −0.698 |
| β-phase | K | a | 2 | 0.5000(0.5000) | 0.5000(0.5000) | 0.0000(0.0000) | 0.903 |
| Na | c | 2 | 0.0000(0.0000) | 0.5000(0.5000) | 0.2668(0.2660) | 0.891 |
| Nb | c | 2 | 0.0000(0.0000) | 0.5000(0.5000) | 0.7348(0.7351) | 2.768 |
| O | c | 2 | 0.0000(0.0000) | 0.5000(0.5000) | 0.5322(0.5351) | −0.915 |
| F1 | c | 2 | 0.0000(0.0000) | 0.5000(0.5000) | 0.9891(0.9865) | −0.813 |
| F2 | j | 8 | 0.2304(0.2295) | 0.2696(0.2705) | 0.7723(0.7719) | −0.708 |
3.2. Piezoelectricity and Acoustic Properties
The crystallographic symmetry of materials plays an important role in the piezoelectric phenomena. According to the definition of the piezoelectric effect, the piezoelectric tensor of α-KNaNbOF
5 is:
The calculated piezoelectric components of α-KNaNbOF
5 are listed in
Table 4, in which the data of ZnO are also listed. It is well known that ZnO has good piezoelectric properties, and has been widely used in filters for incoming television signals [
24,
25]. ZnO ceramics are also widely used as varistors for surge protection [
26]. Compared with ZnO, the piezoelectric constants of α-KNaNbOF
5 are much lower. In order to make a comparison to the experimental piezoelectric response measurement reported in [
9], the calculated piezoelectric stress matrix [
e] is converted into the piezoelectric strain matrix [
d] by the relationship [
e] = [
c][
d], where [
c] is the elastic matrix. Based on
Table 4 and
Table 5, the calculated
dz3 is 1.5 pC/N, which is lower than the experimental value 6.7 pC/N [
9]. Since our calculated lattice parameters, atomic positions, and relative permittivity agree well with experiments, the errors in the calculated
dz3 may originate from three aspects: (1) The experiment was carried out at room temperature—since finite temperatures are not included in the calculation, the calculated value of
dz3 is smaller than that observed in experiments; (2) The value of
dz3 is sensitive to the crystal structure—the calculated lattice constants deviate from the experimental values by ~1%, which affects the evaluation of
dz3; (3) Compared to other commonly used piezoelectric materials, such as BaTiO
3 (~190 pC/N) and K
0.5Na
0.5NbO
3 (~160 pC/N) [
9], the
dz3 value of KNaNbOF
5 is much lower. Thus, although the relative error of the calculated
dz3 is large, the absolute error is only 4.8 pC/N. From these values, we can conclude that the piezoelectricity of α-KNaNbOF
5 is not very strong. This is consistent with the fact that the piezoelectricity of α-KNaNbOF
5 arises from the competition between primary and secondary distortions [
11,
12]. In the centrosymmetric structure of β-KNaNbOF
5, the calculated piezoelectric components are all zero as expected from the symmetry of the crystal.
Table 4.
The calculated piezoelectric tensor elements eij of α-KNaNbOF5. The data of ZnO are listed for comparison. The piezoelectric components of β-KNaNbOF5 are all zero.
Table 4.
The calculated piezoelectric tensor elements eij of α-KNaNbOF5. The data of ZnO are listed for comparison. The piezoelectric components of β-KNaNbOF5 are all zero.
| eij (C/m2) | ex5 | ey4 | ez1 | ez2 | ez3 |
|---|
| α-KNaNbOF5 | 0.11 | 0.12 | −0.07 | −0.08 | 0.05 |
| ZnO [27] | - | −0.59 | −0.61 | 1.14 | - |
Table 5.
The calculated elastic constants of the two phases of KNaNbOF5 (in GPa).
Table 5.
The calculated elastic constants of the two phases of KNaNbOF5 (in GPa).
| Phase | C11 | C12 | C13 | C22 | C23 | C33 | C44 | C55 | C66 |
|---|
| α-phase | 50.9 | 26.8 | 13.8 | 51.2 | 19.7 | 64.2 | 11.0 | 17.1 | 20.2 |
| β-phase | 51.1 | 25.6 | 22.5 | - | - | 63.0 | 10.3 | - | 26.7 |
In experiments, the ultrasonic wave velocities of certain directions can be measured to obtain the elastic constant by the Christoffel equation [
27,
28]. The Christoffel equation for β-KNaNbOF
5 is written as:
where
CKL is the elastic constant (from
Table 5),
l is the propagation matrix, δ
jk is the Kronercker sign, ϱ is the density of crystal, α
j is the eigenvector, and
V is the velocity of acoustic wave.
Since α-KNaNbOF
5 has piezoelectric property, the quasistatic approximation is used to transform the conventional Christoffel equation to the stiffened Christoffel equation. In this approximation, the effect of the quasistatic electric field is saved. The stiffened Christoffel equation is written as:
where
CKL is the elastic constant (from
Table 5),
SIJ corresponds to the components of the elastic compliance matrix, ϱ is the density of crystal (from
Table 1), ω is the phase velocity of the acoustic wave, α is the eigenvector,
e is the piezoelectric stress tensor (from
Table 4), ε is the dielectric constant (from
Table 6), and
l is the propagation matrix. All of these values are obtained from the first-principles calculations.
Table 6.
Values of electronic and ionic contributions and total value of the relative dielectric permittivity (εij) for α- and β-KNaNbOF5.
Table 6.
Values of electronic and ionic contributions and total value of the relative dielectric permittivity (εij) for α- and β-KNaNbOF5.
| Phase | εij | Electronic | Ionic | Total |
|---|
| α-phase | εxx | 4.05 | 2.24 | 6.29 |
| εyy | 3.70 | 2.16 | 5.86 |
| εzz | 3.68 | 2.13 | 5.81 |
| β-phase | εxx | 4.74 | 2.03 | 6.77 |
| εyy | 4.74 | 2.03 | 6.77 |
| εzz | 2.51 | 2.19 | 4.70 |
The elastic stiffness (
CKL) defines the resistance of the material to undergo strain under the action of a mechanical stress within the elastic regime. The orthorhombic (α-KNaNbOF
5) and the tetragonal crystal (β-KNaNbOF
5) have nine and six independent elastic constants, respectively. The calculated elastic constants are listed in
Table 5. The relative dielectric permittivities for α-KNaNbOF
5 are ε
xx = 6.29, ε
yy = 5.86 and ε
zz = 5.81. For the β phase, they are ε
xx = ε
yy = 6.77 and ε
zz = 4.70, as shown in
Table 6. These calculated results are close to the experimental measured relative permittivity (ε = 7.1) for α-KNaNbOF
5 [
9].
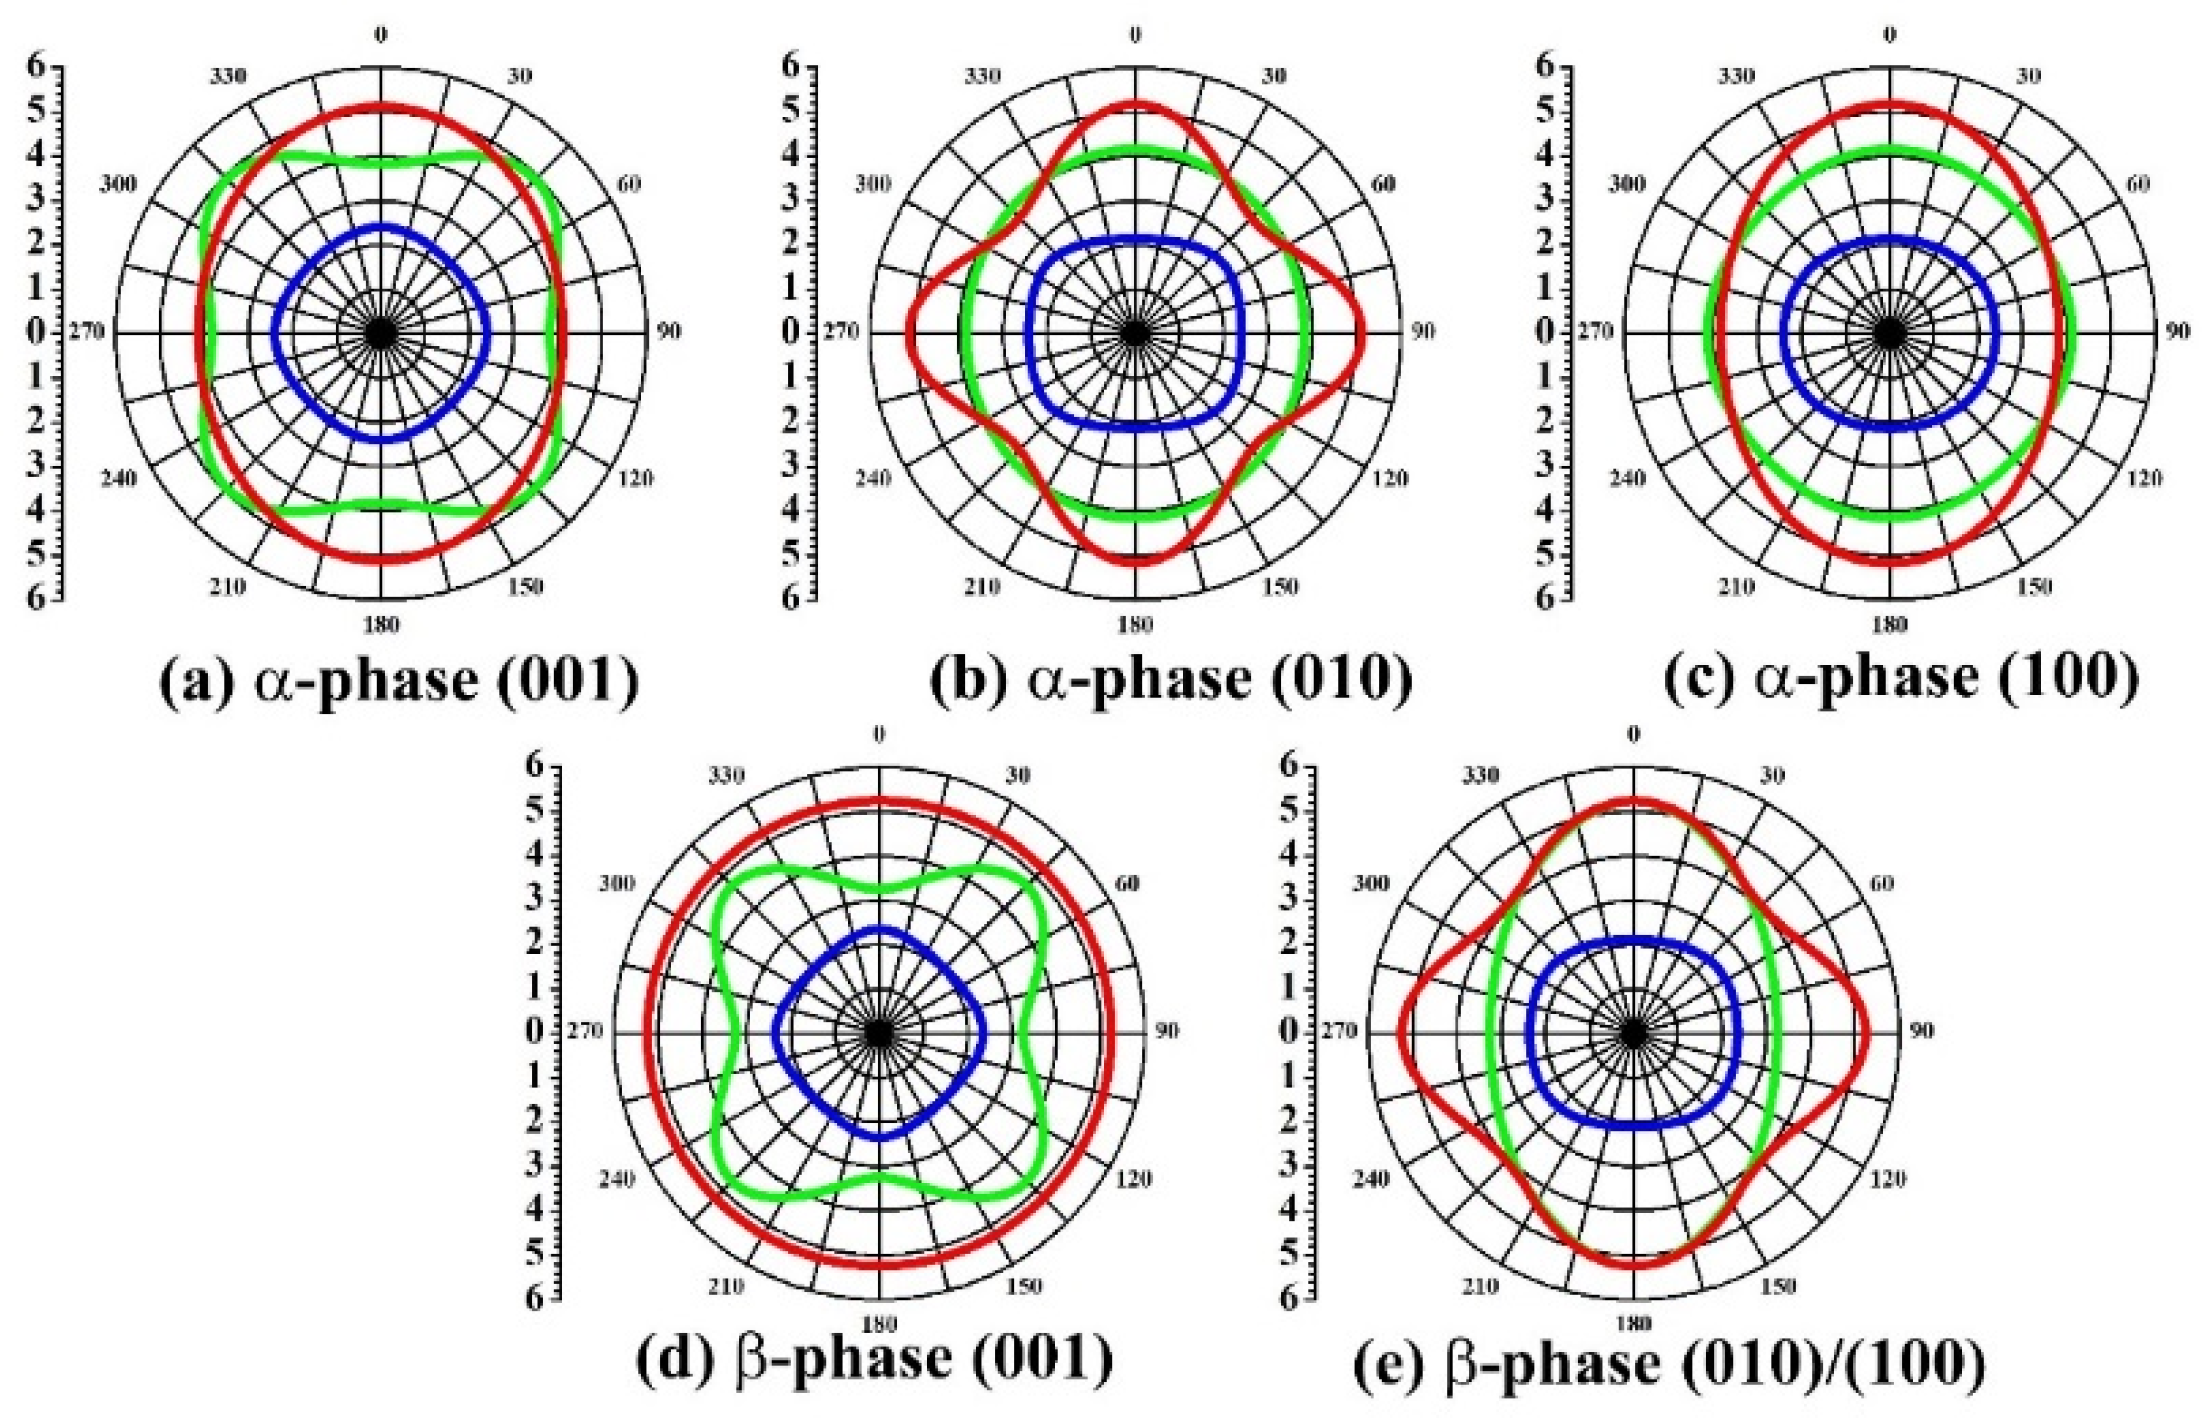
For a given direction, three velocities are determined by solving the Christoffel and the stiffened Christoffel equation. By changing the propagation direction, we obtain the velocity as a function of propagation direction. Usually, in practice, it is more convenient to use the slowness surface (the inverse of the velocity). We calculate the slowness curves of KNaNbOF
5 for both the α- and β-phases and illustrate them in
Figure 4 (for the tetragonal phase, the (010) plane is the same as the (001) plane). It is clear that there are three acoustic waves in each direction: one quasi-longitudinal mode and two quasi-transverse modes. The velocities of quasi-longitudinal modes are much larger than those of the other two in both phases of KNaNbOF
5. These acoustic properties of KNaNbOF
5 significantly change when a phase transition occurs: (1) For α-KNaNbOF
5, the largest velocity is the quasi-longitudinal mode along the (001) direction, indicating that the velocity reaches maximum along this direction, while for β-KNaNbOF
5, the velocity is at a maximum along (110) and (001); (2) For α-KNaNbOF
5, the maximum values of the slowness surface are along (100) and (001), while for β-KNaNbOF
5, all the directions in the (001) plane have the same maximum values of slowness; (3) All the acoustic waves of α-KNaNbOF
5 are anisotropic, however, in the (001) plane of β-KNaNbOF
5, the propagation of the outer acoustic wave is obviously isotropic. This mode is a pure transverse mode, in which the polarization is normal to the direction of propagation. (4) The slowness curves are very different on the (100) plane between α- and β-phases.
Figure 4.
Slowness curves of acoustic waves for α- and β-KNaNbOF5. The slowness curves of α-KNaNbOF5 in (001), (010) and (100) planes are (a), (b) and (c), while those of β-KNaNbOF5 in (001) and (010)/(100) planes are (d) and (e), respectively. The inner blue circle represents the quasi-longitudinal wave and the middle green and outer red circles represent the other two quasi-transverse waves. The units of the slowness values are 10−4 s/m.
3.3. Mechanical Properties
From the elastic constants (
CKL) listed in
Table 5, more elastic-relevant properties can be obtained. The mechanical stability of KNaNbOF
5 can be determined by the Born-Huang criterion [
29]. For the α-phase, they are:
And for the β-phase, they are:
The calculated elastic constants listed in
Table 5 satisfy the mechanical stability criterion. Using the calculated elastic constants, we further calculate the bulk modulus, shear modulus, Young’s modulus, and Poisson ratio to obtain a complete description of the mechanical behavior. The Voigt and the Reuss approximations [
30] are used to estimate the bulk modulus and the shear modulus.
Since α-KNaNbOF
5 belongs to the orthorhombic structure, the bulk and the shear moduli (
B and
G) for orthorhombic structures can be obtained from the general expression of the bulk and the shear modulus in Voigt-Reuss-Hill approximation. For the Voigt approximation, they are:
While by the Reuss approximation, they are:
where
B and
G are the bulk and the shear moduli obtained by Voigt or Reuss approximations, respectively (with subscripts
V or
R).
The β-KNaNbOF
5 belongs to the tetragonal structure. Therefore, the formulas become:
Within the Voigt-Reuss-Hill approximation [
30], the bulk modulus
B and the shear modulus
G are the average of the values by Voigt and Reuss approximations. The Young’s modulus (
E)
, the Poisson ratio (
v), the velocity of the transverse (
Vt), the longitudinal (
Vl) acoustic wave, the average velocity (
Va), and the Debye temperature (Θ
D) can be obtained by:
where
h is the Planck constant,
kB is the Boltzmann constant,
n is the number of atoms in the formula unit,
NA is the Avogadro number, ϱ is the density of the crystal, and
M is the molecular weight. The constants describing the mechanical behavior of KNaNbOF
5 in the elastic regime are given in
Table 7.
The bulk modulus
B of a material determines the resistance to compression under a given hydrostatic pressure [
31]. The shear modulus
G describes the resistance of a material to deform under a shear stress. The calculated bulk modulus of KNaNbOF
5 is only 31.9–34.0 GPa, which is much lower than steel (approximately 160 GPa) and comparable to glass (35–55 GPa) [
32]. Therefore, neither α- nor β-KNaNbOF
5 are hard materials. The bulk modulus
B is twice the shear modulus, indicating that the parameter limiting the material’s stability is the shear modulus.
For the application of KNaNbOF
5, the brittle or ductile behavior is of great importance. The ratio of bulk modulus to shear modulus (
B/G) is frequently used to discriminate the brittle properties of materials [
33]. According to the criterion given by Pugh [
34], a material is brittle if the
B/G ratio is less than 1.75. Otherwise, it behaves in a ductile manner. In the case of KNaNbOF
5, the B/G ratio is 1.99–2.31, indicating that KNaNbOF
5 is predominantly ductile. Since the B/G ratio of the β-phase is larger than that of the α-phase, we predict that β-KNaNbOF
5 is more ductile.
Table 7.
The calculated elasticity-relevant properties of three different phases of KNaNbOF5. The bulk modulus B and the shear modulus G within the Voigt and Reuss approximation (with subscripts V and R, respectively) are listed. Based on B and G, the Young’s modulus E, the Poisson ration v, the acoustic wave velocities (Vl, Vt, Va), and the Debye temperature ΘD are calculated (referring to Equations (9)–(21)).
| Property | α-Phase | β-Phase |
|---|
| BV GPa) | 31.9 | 34.0 |
| BR (GPa) | 31.8 | 33.8 |
| B (GPa) | 31.8 | 33.9 |
| GV (GPa) | 16.7 | 15.7 |
| GR (GPa) | 15.4 | 13.7 |
| G (GPa) | 16.0 | 14.7 |
| E (GPa) | 41.2 | 38.6 |
| v | 0.284 | 0.310 |
| Vl (m/s) | 4253.1 | 4381.4 |
| Vt (m/s) | 2335.5 | 2297.3 |
| Va (m/s) | 2603.3 | 2569.3 |
| ΘD (K) | 303.3 | 294.2 |
At low temperatures, the vibrational excitations arise solely from the acoustic modes of the phonon spectrum. Hence, the Debye temperature calculated using the elastic constants can be compared to the experimentally measured values. From
Table 7, we find that the α-phase has a higher velocity of the longitudinal acoustic wave and a lower velocity of the transverse acoustic wave compared to the β-phase. The calculated velocity of the longitudinal acoustic wave is 4253–4381 m/s and the transverse acoustic wave is 2297–2336 m/s. The calculated velocities using the classic Debye model compare well with the velocities calculated from the Christoffel equation discussed above. The Debye temperature from the calculated acoustic velocities is 303 K for α-KNaNbOF
5 and 294 K for β-KNaNbOF
5. If the Debye temperature is low, the thermal conductivity is also low for insulators in general [
31]. Heat is transported by two mechanisms in solids: lattice vibrations (phonons) and free electrons. Since KNaNbOF
5 is an insulator, the scattering becomes quite large above the Debye temperature, making the solid a poor thermal conductor. The Debye temperature of KNaNbOF
5 (294–303 K) is much lower than that of diamond (approximately 2230 K), indicating a poor thermal conductivity of the material.


 ,
, 
