1. Introduction
The knowledge of the fatigue damage state of structures made of composite material such as carbon fiber reinforced polymer (CFRP) is essential to make the next step in the optimization of composite structures in the aeronautic industry and in general industrial applications. Nowadays, fatigue damage is not an essential point in maintenance of aeronautic CFRP structures because these are normally loaded far below their fatigue resistance. However, but for future highly optimized structures, estimating the fatigue damage will become an important issue.
Conventional techniques to evaluate the fatigue state of an aircraft structure are based on measurements of structural loads throughout the service life by electric strain gauge sensors, which present some difficulties. One of them is that these sensors are affected by the extreme environmental flight conditions and by the fatigue loads, in such a way that they have an elevated probability to fail and require an exhaustive maintenance program. A second disadvantage is that the stiffness degradation of the composite materials due to the accumulated damage could lead to non-realistic stress-strain relation of the strain gauge sensors. A third disadvantage is that the accumulated fatigue damage determined by a load history is conventionally calculated by linear damage accumulation models (such as Palmgren-Miner) [
1]. Experimental studies show that this rule leads to inaccurate and non-conservative predictions for composite materials under realistic variable amplitude loads [
2,
3,
4].
There are models developed for fatigue damage accumulation of composite materials, including strength and stiffness degradation. These models are based on fitting experimental values [
2], but, due to the complexity of the damage mechanisms, they are only applicable for explicit conditions of loads and materials.
The most classic fatigue damage metric is the strength degradation of the material, commonly known as residual strength [
2]. When the residual strength becomes equal or lower than the maximum stress applied during cycling, the structure is prone to fail. Although the residual strength is the best metric to determine the damage state of a structure, in actual structures it cannot be measured by non-destructive evaluations.
Other classic fatigue damage metric of CFRP, and an alternative to the residual strength, is the stiffness degradation. Several authors have studied stiffness degradation and its relation with residual strength [
5,
6,
7]. The advantage is that the stiffness can be measured with non-destructive methods, but in general it requires the application of a specific load to the structure with a dedicated test setup that is complicated to achieve in aircraft structures.
These difficulties have created the need to assess phenomenological methods [
1] such as acoustic emissions [
8], digital image correlation [
9,
10], thermography [
10,
11], X ray tomography [
12], electrical resistance [
13], and analysis of the surface [
14,
15,
16], among others.
Previous studies by the authors have shown that changes in the surface topography of CFRP, quantified by the roughness magnitude, could be an indicator of the accumulated fatigue damage [
14,
15,
16]. Other authors have studied techniques for evaluating the fatigue damage by means of the surface assessment in metal structures, which undergo a surface transition related to metallurgical effects of their crystal structure [
17,
18]. For CFRP, the change of the surface starts at the beginning of the life of the structure with matrix micro-cracks parallel to the reinforcing carbon fibers. With increasing fatigue cycles, the cracks become bigger and tend to produce local delaminations in sub-surface layers changing the surface topography significantly. Results of previous works by the authors with specimens cycled with constant amplitude loads (CAL) show that the changes of the surface roughness are correlated with the stiffness degradation [
14,
15], which is a classical metric of fatigue damage. A further study by the authors, which was focused on the evaluation of the methodology with realistic variable amplitude loads (VAL), shows that the agreement between surface roughness magnitude and stiffness degradation is independent of the type of load applied [
16]. As mentioned by Sonsino [
19], due to the absence of effective cumulative damage, models that predict the life of components under VAL using CAL test data or variable amplitude load tests (VAL) are useful and necessary to understand the behavior of the material under real in-service conditions.
The present work evaluates a different approach to assess the changes on the surface topography as a consequence of fatigue damage. The assessment is done in the frequency domain by determining the Power Spectral Density (PSD) of the topography profile, by evaluating the Irregularity Factor (
I). This factor was first introduced by Rice [
20,
21] and is commonly employed to estimate the fatigue life of structures taking into account the PSD of the load history [
19,
22].
Surface Irregularity Factor
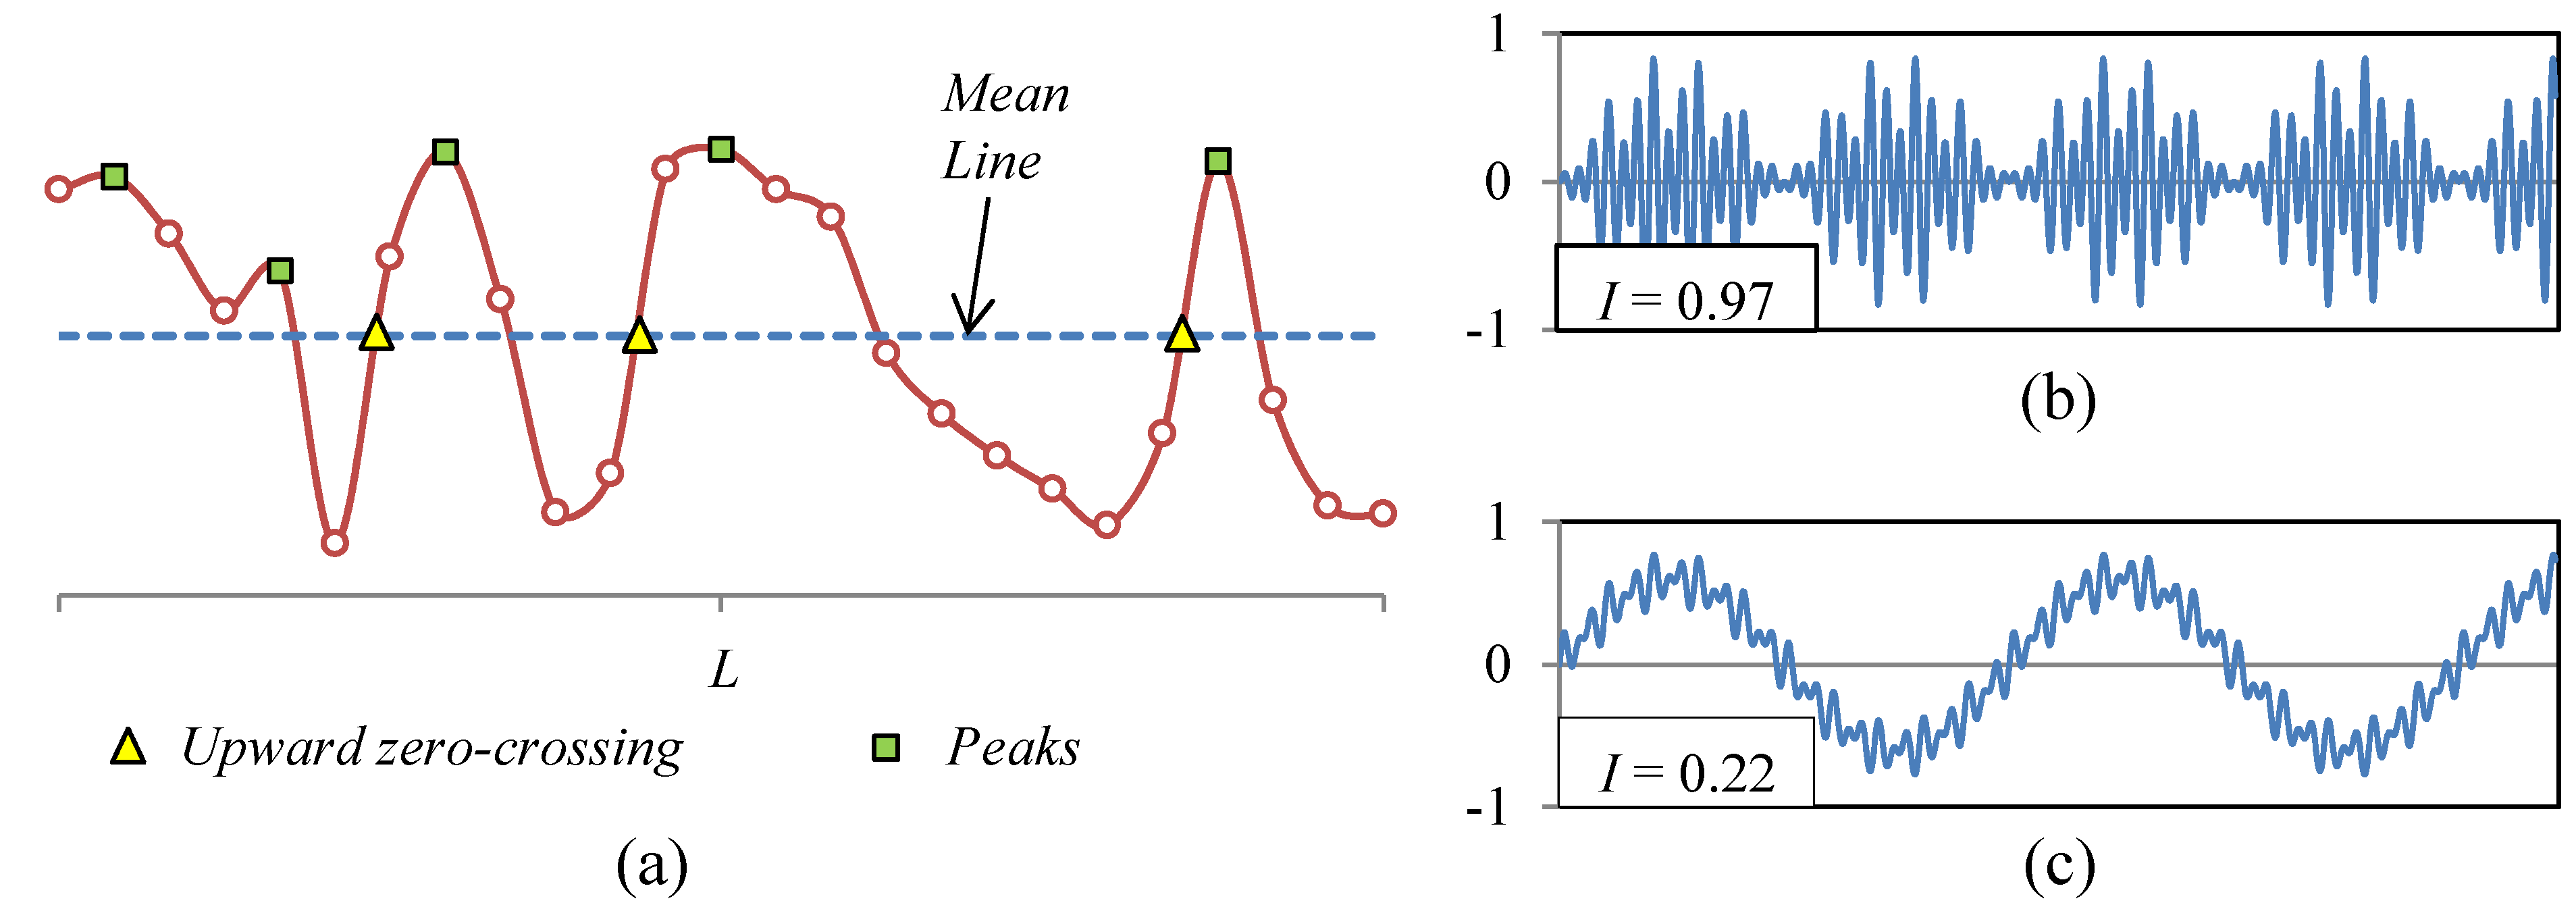
The irregularity factor estimates statistically the relation between the numbers of peaks in the profile and the number of upward zero-crossings (see
Figure 1a). The
I-Factor provides information of the shape of the surface. The mathematical procedure to determine the
I-Factor starts with the fast Fourier transform algorithm (FFT). The topographic profile is defined by the discrete function
Z(
xj) that defines the height of the point
xj respect to the mean line. The discrete function of the profile into the frequency domain is
Z(ξ
k), which is given by the Equation (1):
where
L is the length of the topographic profile,
P is the number of pixels, Δ
x= L/
P is the spatial resolution,
i is the complex number and
j and
k are the discrete indices. The spectral density function
S(ξ
k) is computed by the Equation (2):
The irregularity factor is calculated from the area moments of
S(ξ
k) when ξ
k > 0. The area moments are obtained by the Equation (3), where Δξ
= L−1 is the spatial frequency resolution. Finally, the Irregularity Factor (
I) is determined by the Equation (4):
A surface with an
I-Factor close to one has a shape similar to the profile depicted in
Figure 1b. The perturbations of the surface are within a narrow frequency band and oscillate respect to the mean plane of the surface. A surface with an
I-Factor close to zero has a shape similar to the profile shown in
Figure 1c. The frequency band is broad, and the amplitude of the perturbations of low spatial frequency is much larger than the perturbations of high spatial frequency.
Figure 1.
(a) Topographic profile with the theoretical points for calculating the irregularity factor; (b) Surface with a narrow band, I = 0.97; (c) Surface with a broad band, I = 0.22.
Figure 1.
(a) Topographic profile with the theoretical points for calculating the irregularity factor; (b) Surface with a narrow band, I = 0.97; (c) Surface with a broad band, I = 0.22.
2. Methodology
2.1. Materials and Equipment
The used composite material is a CFRP type MTM-45-1/IM7 from Cytec Industries Inc. (Heanor, UK), which is a relatively new composite material used for aeronautic structures with the ability to be processed in and out of autoclave. Panels of 2 mm thickness in a quasi-isotropic stacking sequence of ((45,90,−45,0)
s)
2, have been autoclave cured at 6 bars and 130 °C for 2.5 h. The ultimate tensile strength (
Sut) of the material is 938 MPa and was determined statistically in a previous study [
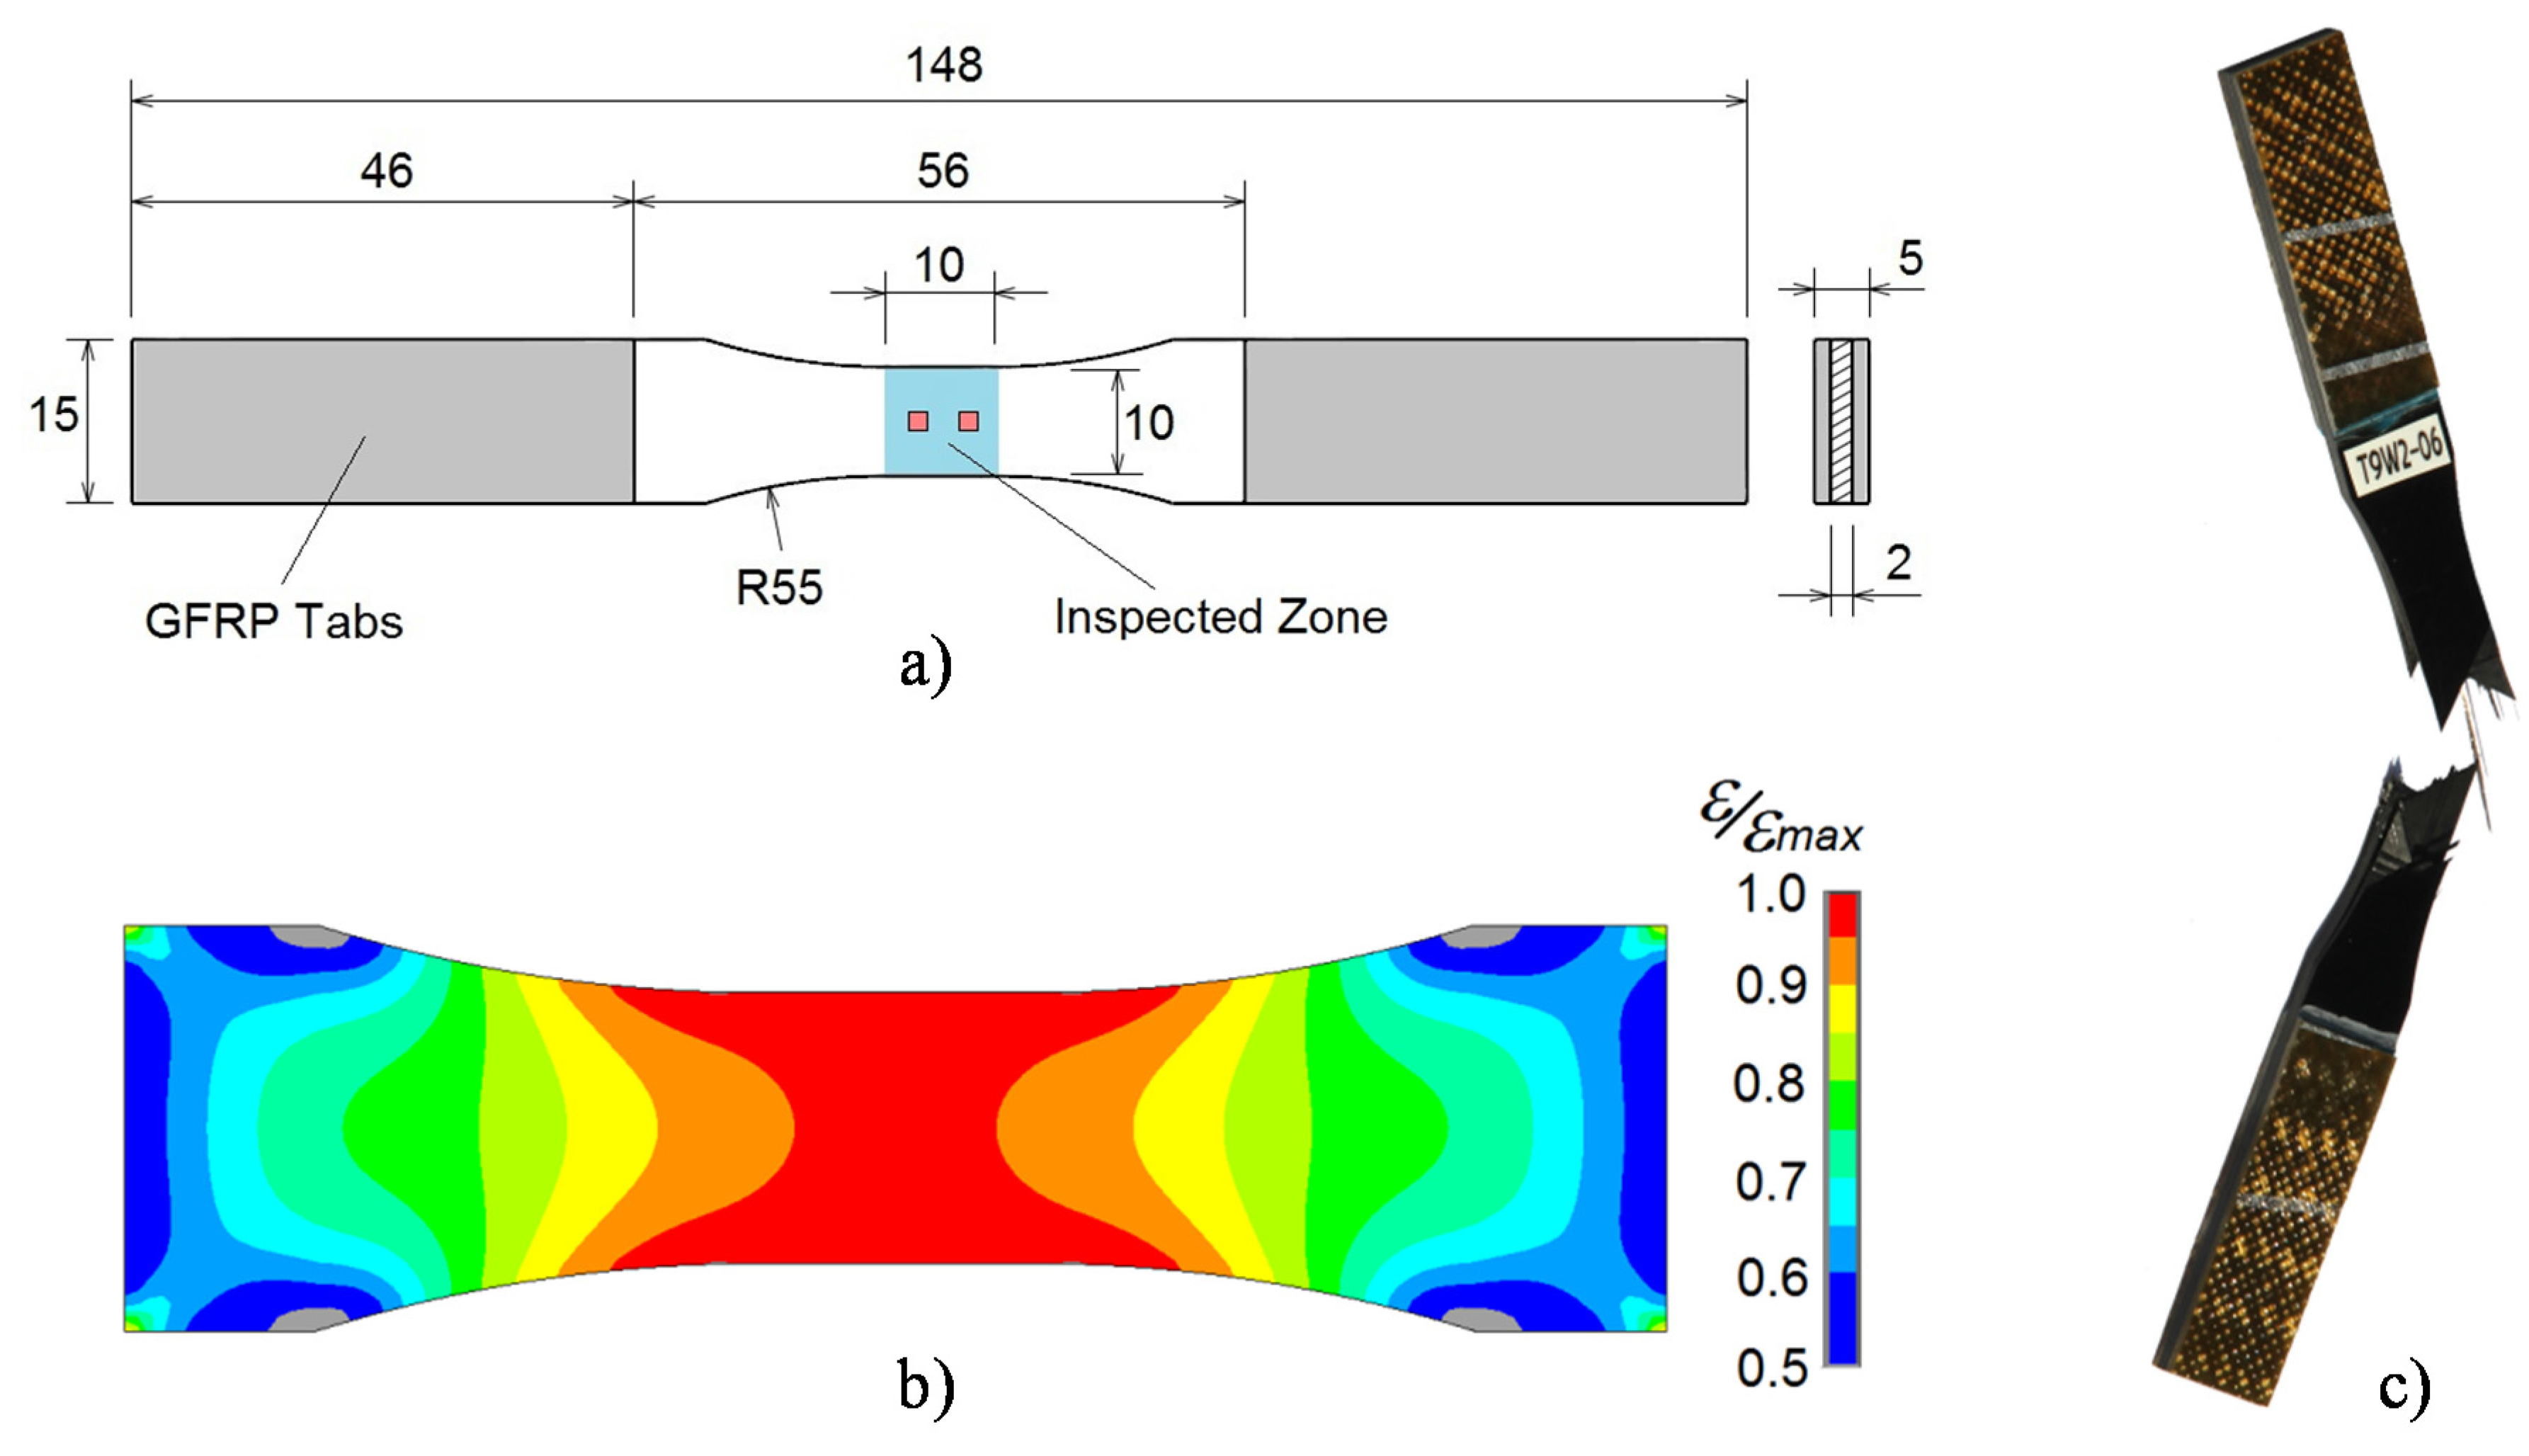
14]. Coupons with “dog bone” design, shown in
Figure 2, were cut from the panels in order to guarantee the highest level of stress at the inspected zone. In order to obtain a better load introduction and to protect the coupons against the gripping forces of the test machine clamps, glass fibre reinforced polymer (GFRP) tabs were bonded at both extremes with film adhesive MTA240 from Cytec Industries Inc.
The fatigue tests were performed with a MTS 810 hydraulic test machine (MTS Systems Co., Eden Prairie, MN, USA) from MTS operated at room temperature under load controlled condition. The stiffness of the specimen was extracted from the test machine during the fatigue cycles. The surface topography was measured by a confocal microscope (PLμ 2300 Confocal Imaging Profiler, from Sensofar (Barcelona, Spain), with an objective zoom of 50×, and a resolution of 5 nm.
2.2. Fatigue Tests and Stiffness Measurements
In this work, to study the proposed methodology under different load conditions, three types of fatigue loads were applied. Cycling loads with constant amplitude (CAL), with an
R = 0.1 which means that the maximum stress (
Smax) is 10 times the minimum stress (
Smin). Variable amplitude loads (VAL), representative of fighter aircrafts using the standard Falstaff, and VAL representative of transport aircraft using the standard MiniTwist were applied. The quantity of coupons for each type of load and their identification number are summarized in
Table 1.
Figure 2.
(a) Coupon geometry and principal dimensions (mm); (b) Normalized strain distribution in the direction of the tensile load by finite element analysis, showing less than 5% of strain gradient in the optical measurement zone; (c) Typical failure of a coupon under tensile fatigue loads.
Figure 2.
(a) Coupon geometry and principal dimensions (mm); (b) Normalized strain distribution in the direction of the tensile load by finite element analysis, showing less than 5% of strain gradient in the optical measurement zone; (c) Typical failure of a coupon under tensile fatigue loads.
Table 1.
Quantity of specimens and type of load used for the fatigue test.
Table 1.
Quantity of specimens and type of load used for the fatigue test.
| Type of Sequence | Number of Coupons | Coupons Id | Tensile Load Ratio R |
|---|
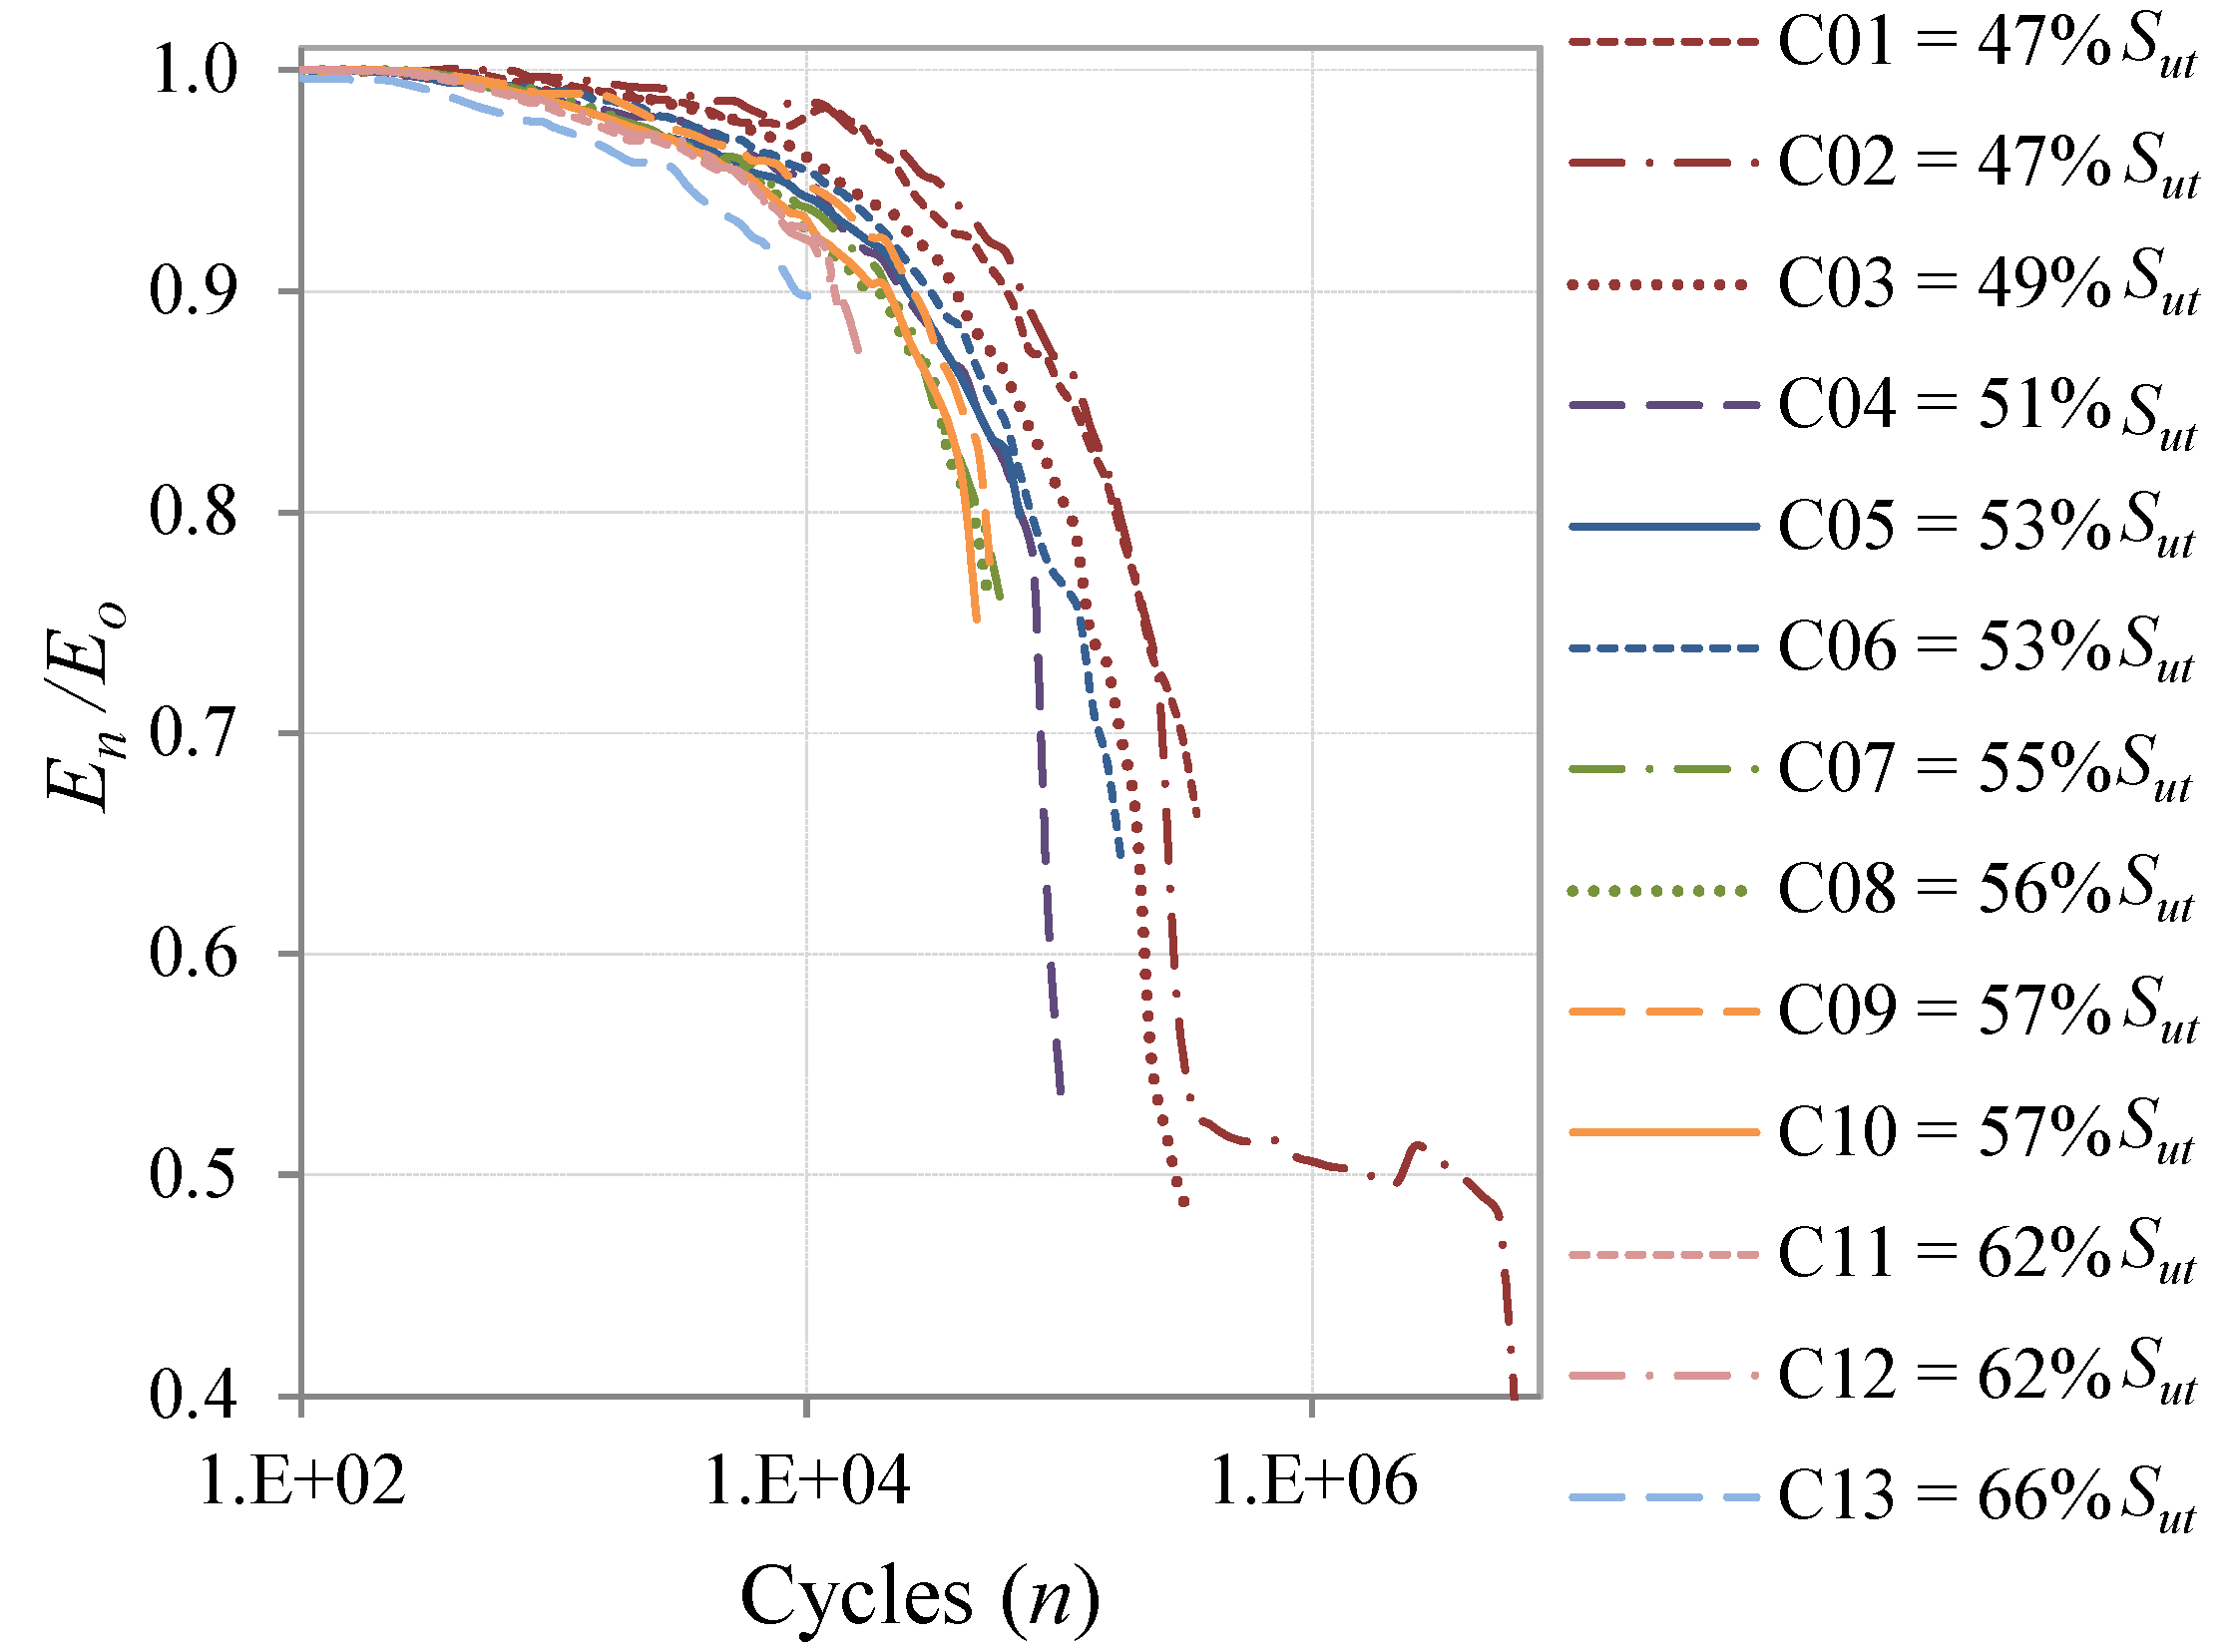
| Constant Amplitude Load | 13 | C01 to C13 | 0.1 |
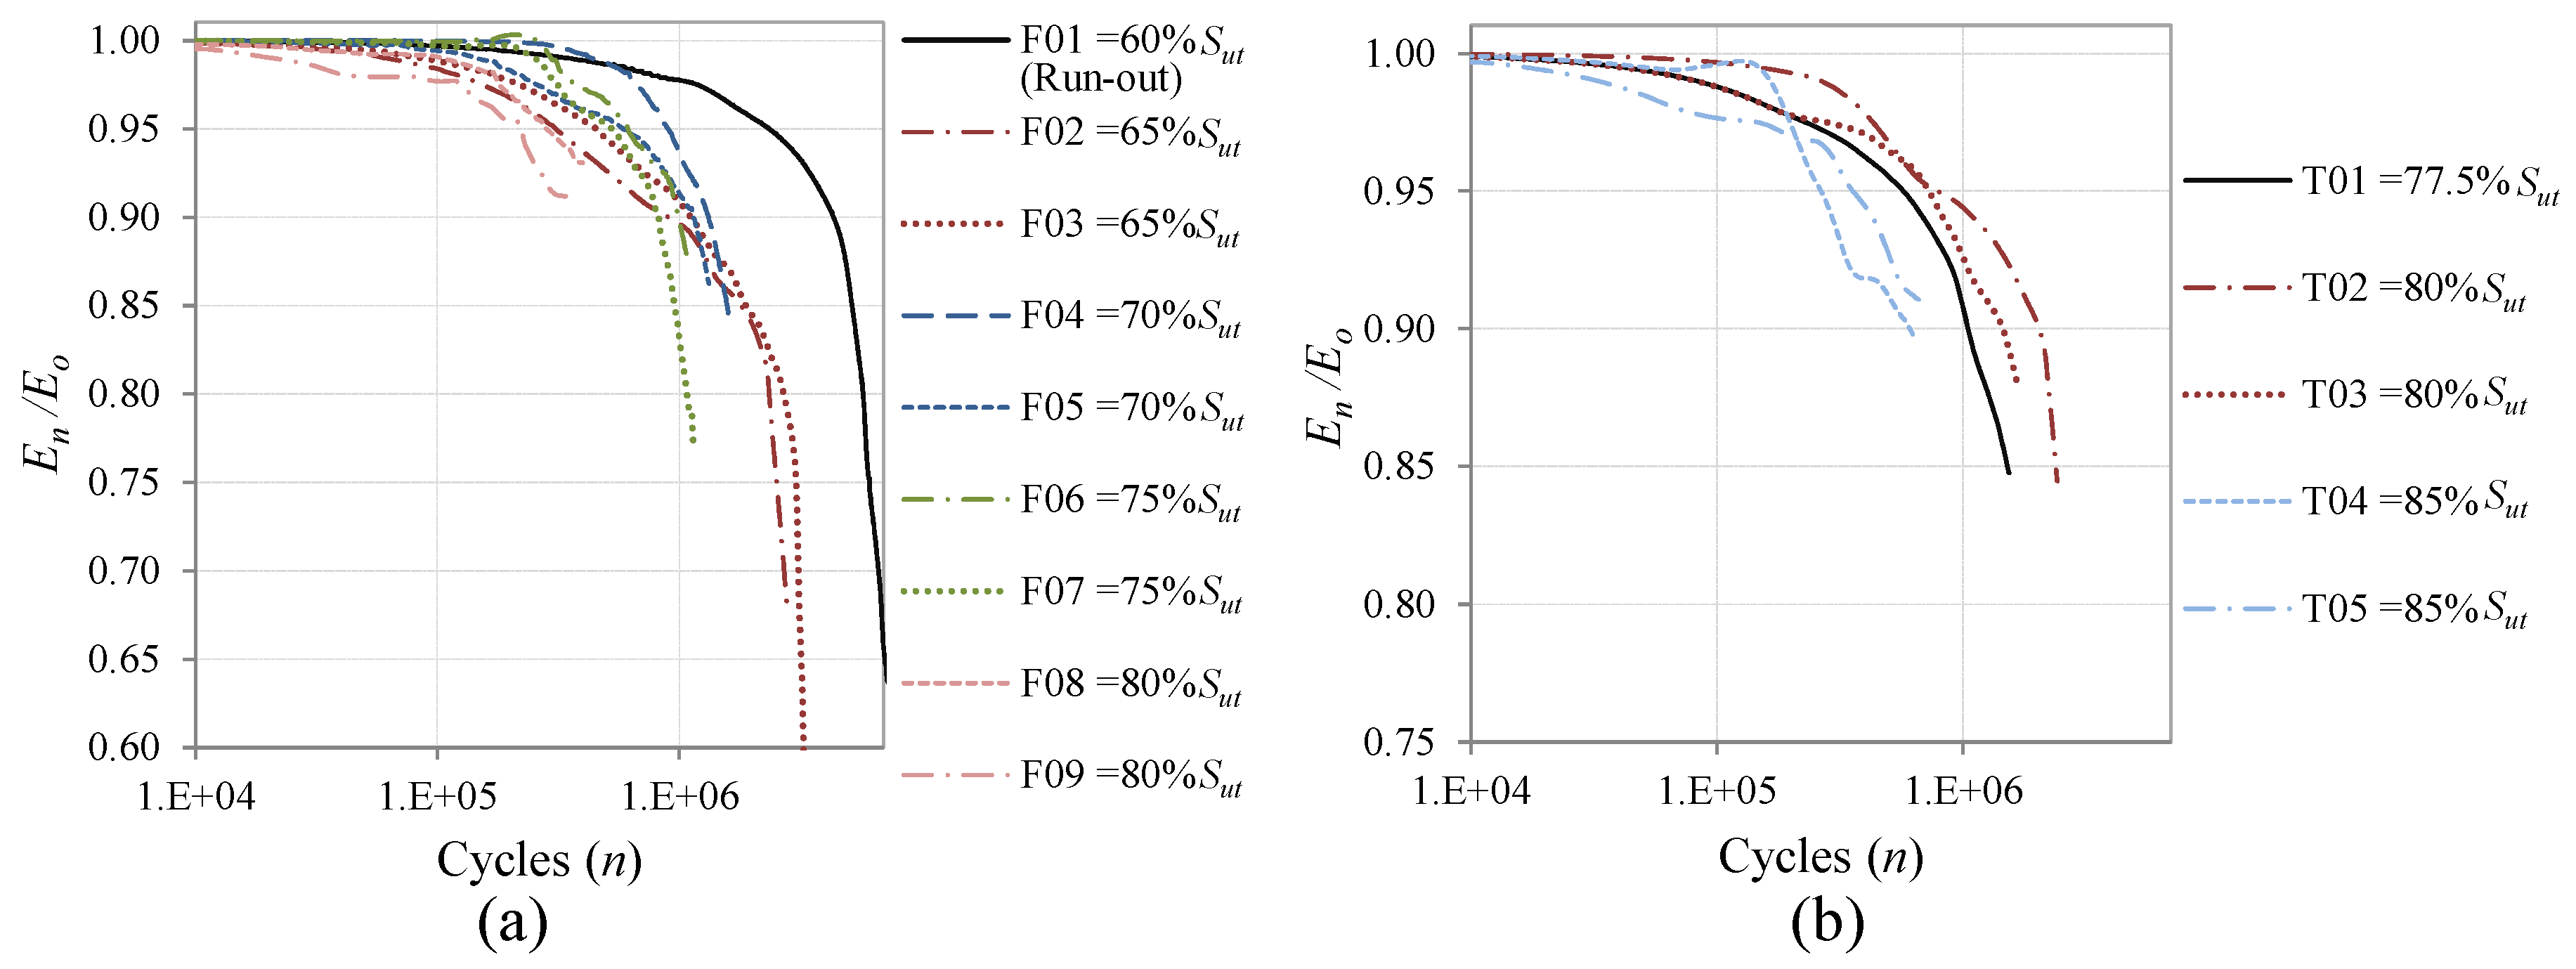
| Falstaff | 9 | F01 to F09 | Spectrum * |
| MiniTwist | 5 | T01 to T05 | Spectrum * |
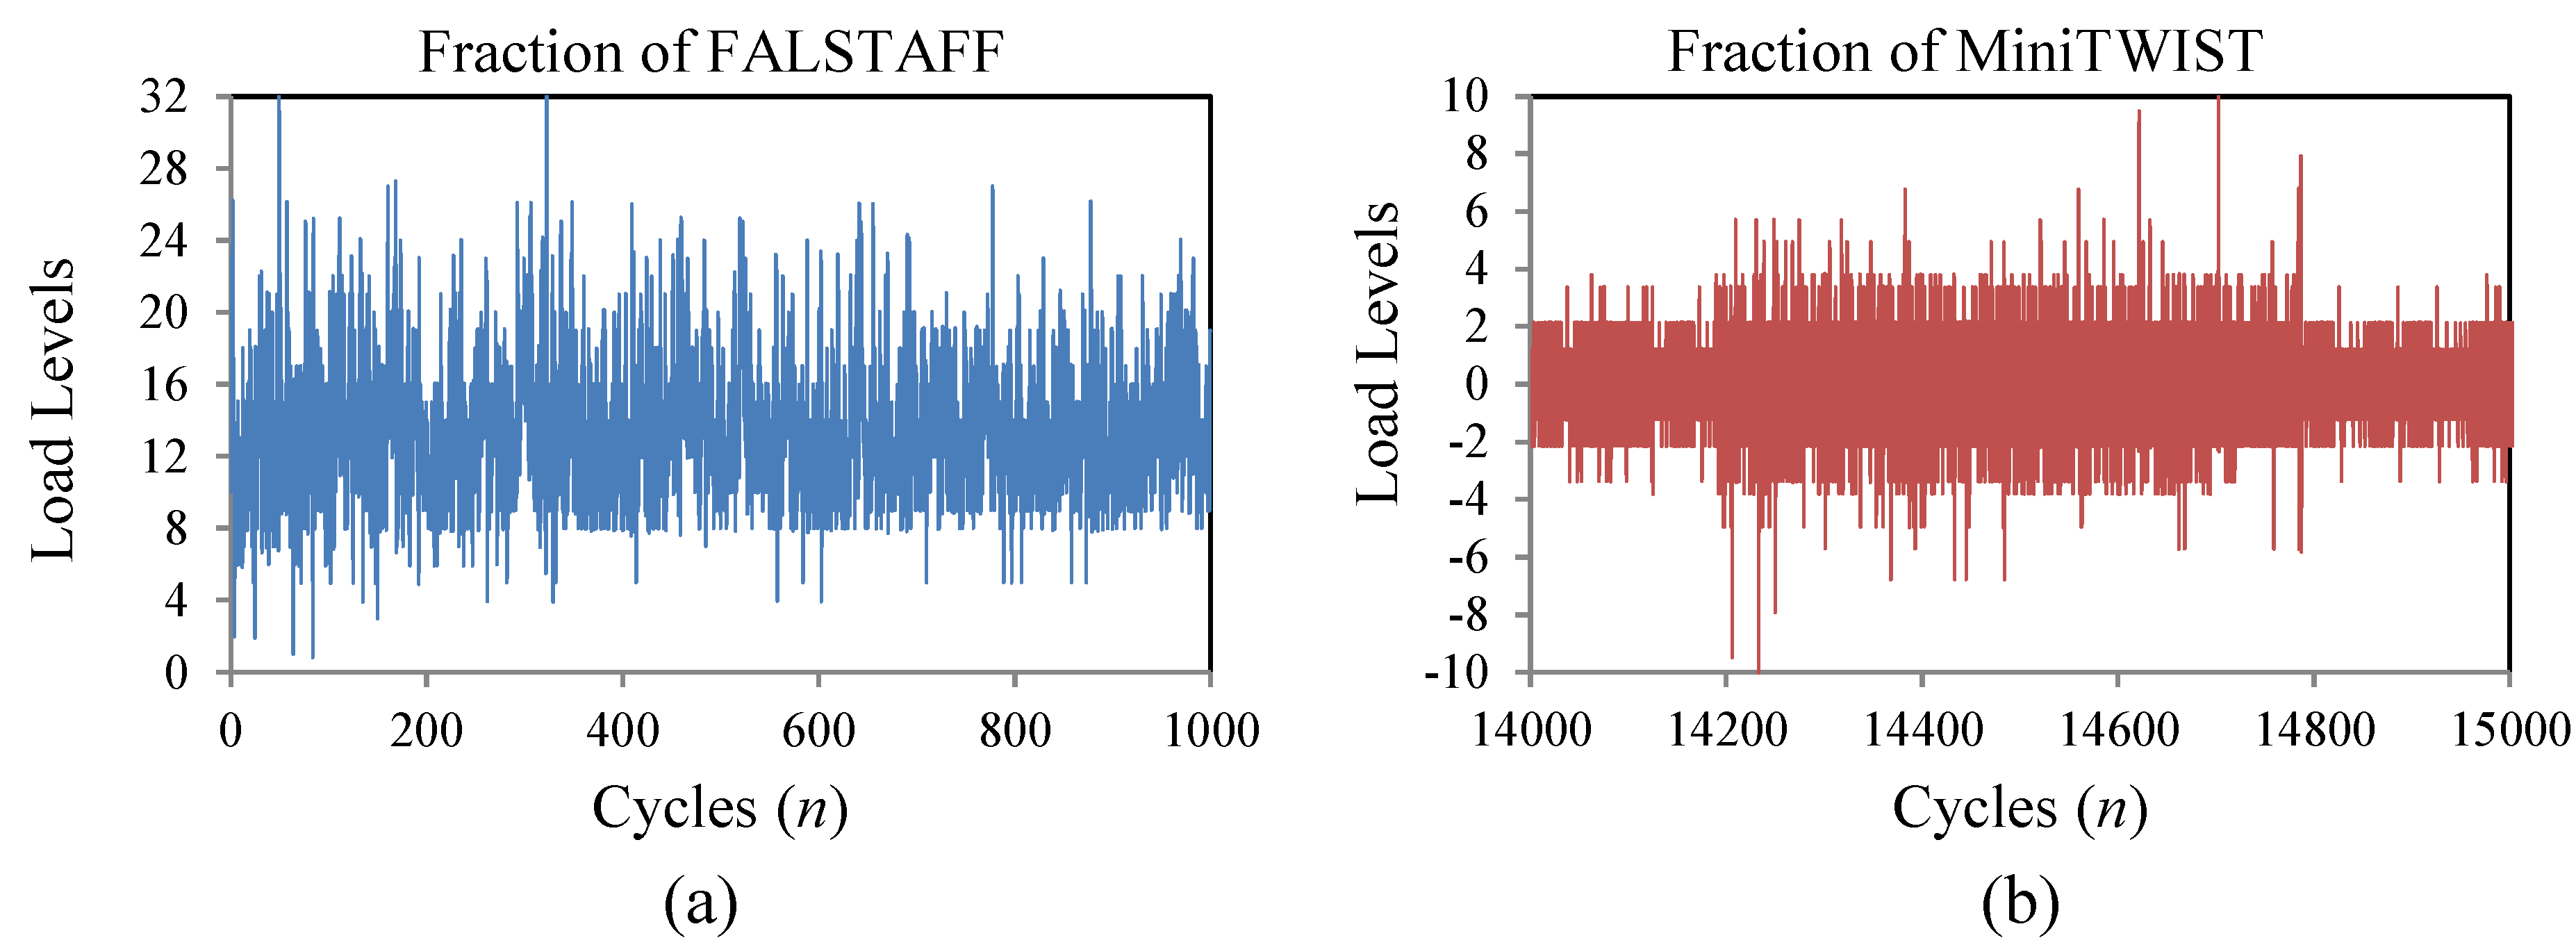
The Falstaff sequence is a standardized representation of the loads supported in the wing roots of fighter aircrafts, under the combinations of different types of missions and maneuvers [
23,
24]. The complete Falstaff consists of approximately 10
6 cycles of 32 different load levels which represents 200 flights (one year of typical usage).
Figure 3a shows a fraction of the load sequence.
The MiniTwist is a shortened version of the standard Twist (Transport Wing Standard), where minor gust loads were omitted to shorten the tests whilst maintaining the reliability of the results [
23,
24]. The MiniTwist represents the entire life time fatigue loads in the wing root of transport aircrafts of about 4000 flights and is composed of 580 × 10
3 cycles discretized in 20 load levels.
Figure 3b shows a fraction of the load sequence.
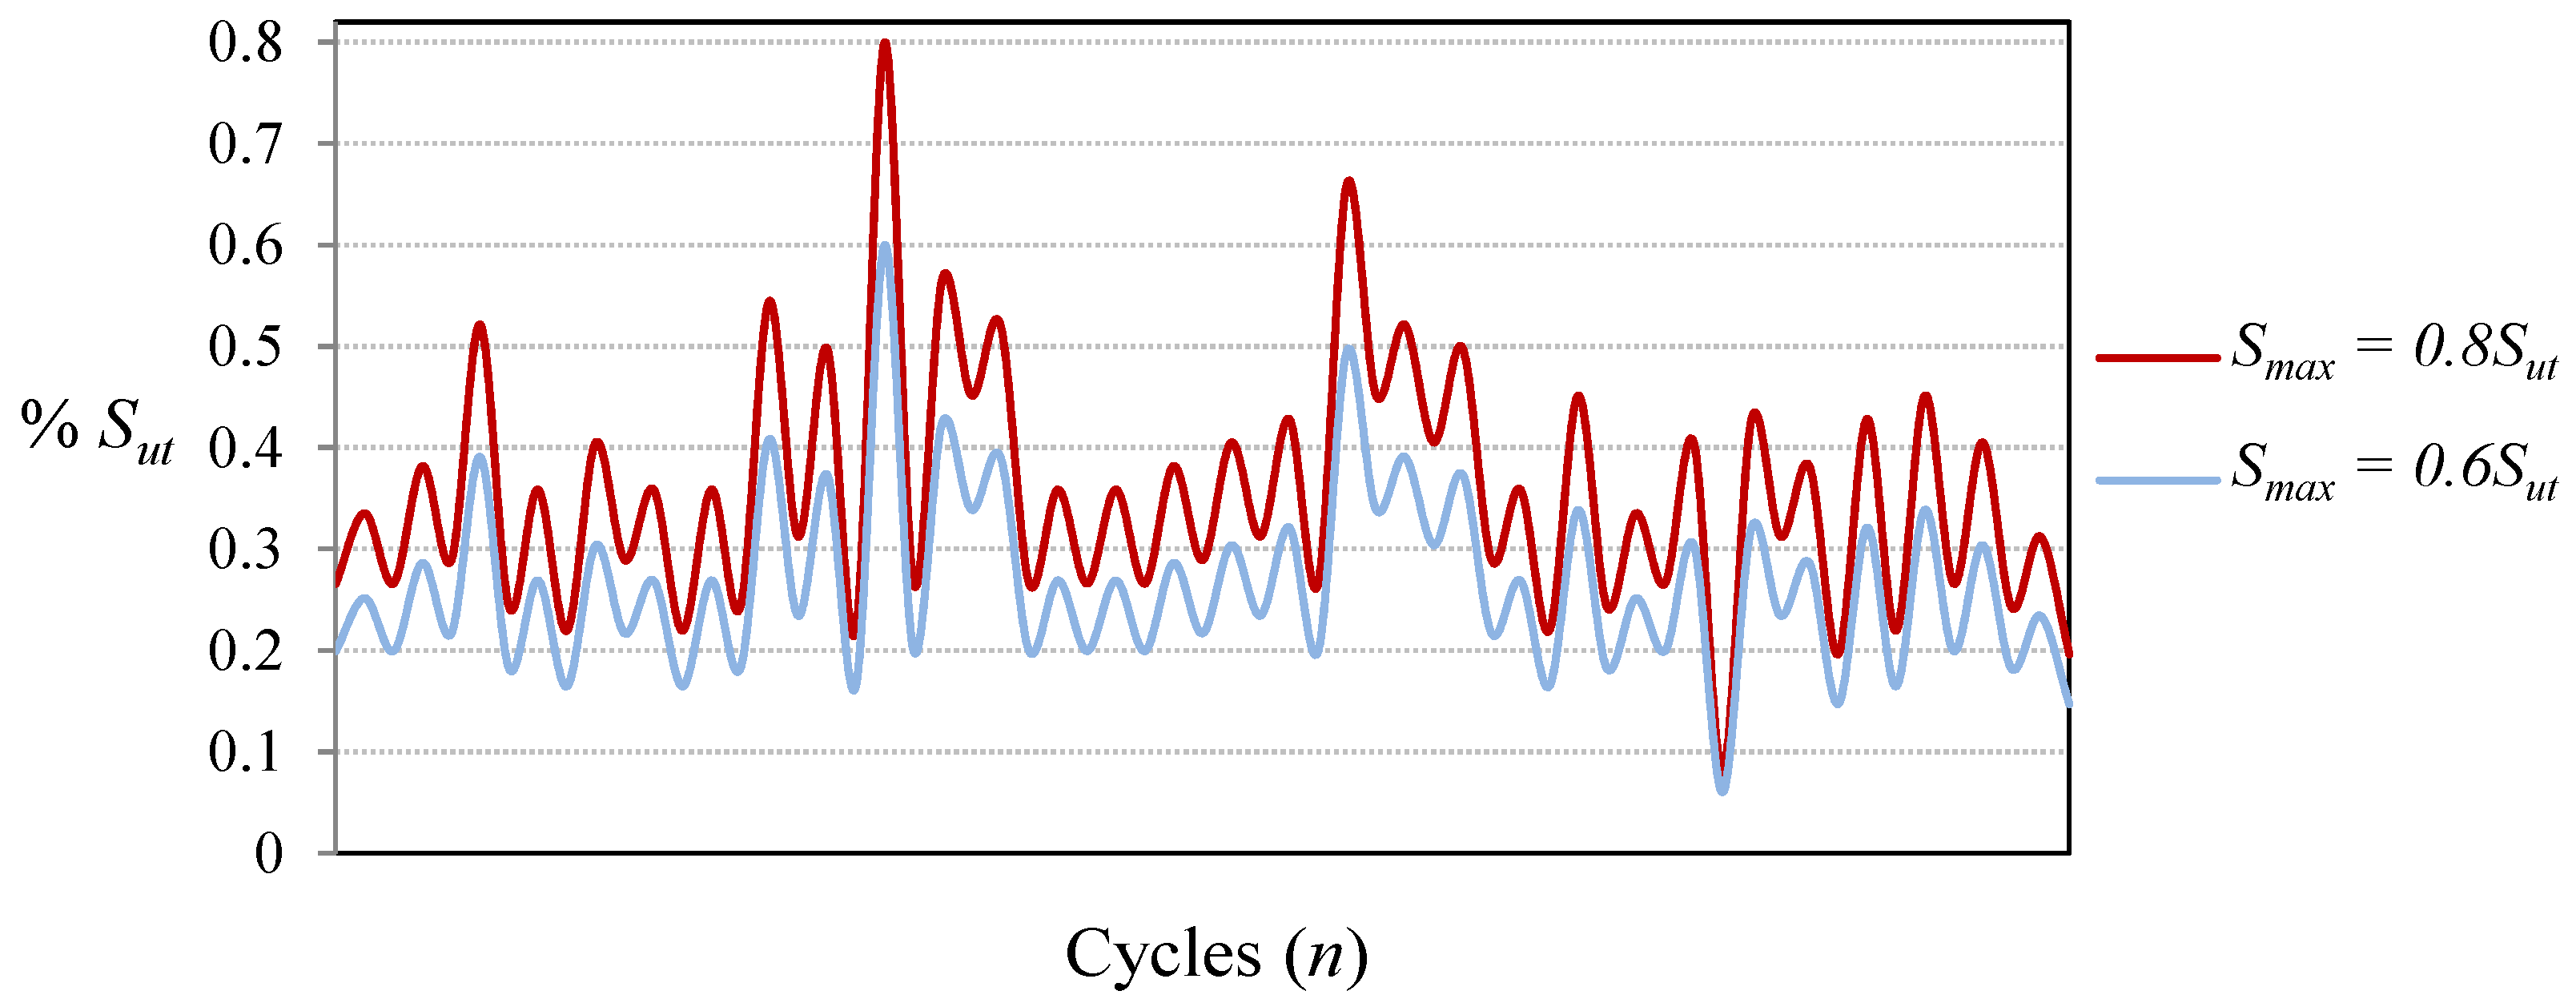
In order to evaluate the proposed methodology with fatigue cycles of different severity, CALs and VALs with different levels of maximum load have been applied. In the case of Falstaff and MiniTwist, the maximum load is the highest peak in the whole sequence and the minimum load is the lowest valley (in the present study the ratio between the minimum valley and the maximum peak is 0.1). With the aim of obtaining VALs of different severities, the sequences have been scaled to several levels of maximum peak load, as shown in
Figure 4.
Figure 3.
Fraction of the load sequences; (a) Fighter Aircraft—Falstaff; (b) Transport Aircraft—MiniTwist.
Figure 3.
Fraction of the load sequences; (a) Fighter Aircraft—Falstaff; (b) Transport Aircraft—MiniTwist.
Figure 4.
Fraction of Falstaff showing load sequences of different severity, with maximum peak loads of 0.8Sut and 0.6Sut.
Figure 4.
Fraction of Falstaff showing load sequences of different severity, with maximum peak loads of 0.8Sut and 0.6Sut.
If a coupon did not fail in whiting one pass of the standard sequences, the load history was repeated until failure with a limit of 107 cycles. In all the cases, the fatigue tests have been interrupted periodically before failure in order to perform the measurements of the surface topography.
The stiffness degradation has been measured during the fatigue cycles using the cross head extension and load data from the testing machine. The stiffness measurements have been normalized to enable them to be quantified in terms of percentage of the initial stiffness.
2.3. Measurement of the Surface Irregularity Factor
Measurements of the surface topography have been performed during tests on both coupon sides at an arbitrary location within the center zone of the specimen. Each measurement area is 1.55 × 1.49 mm2 with a resolution of the confocal microscope of about 21 megapixels. One value per coupon and per life stage has been obtained by averaging the results of the measured points.
Initial reference topographies were taken previous to the fatigue cycling for each area of measurement, just after the specimen manufacturing. Afterwards, the surface degradation is measured after each fatigue cycling block. Cycling blocks are of arbitrary length and depend on the expected fatigue life of the specimen.
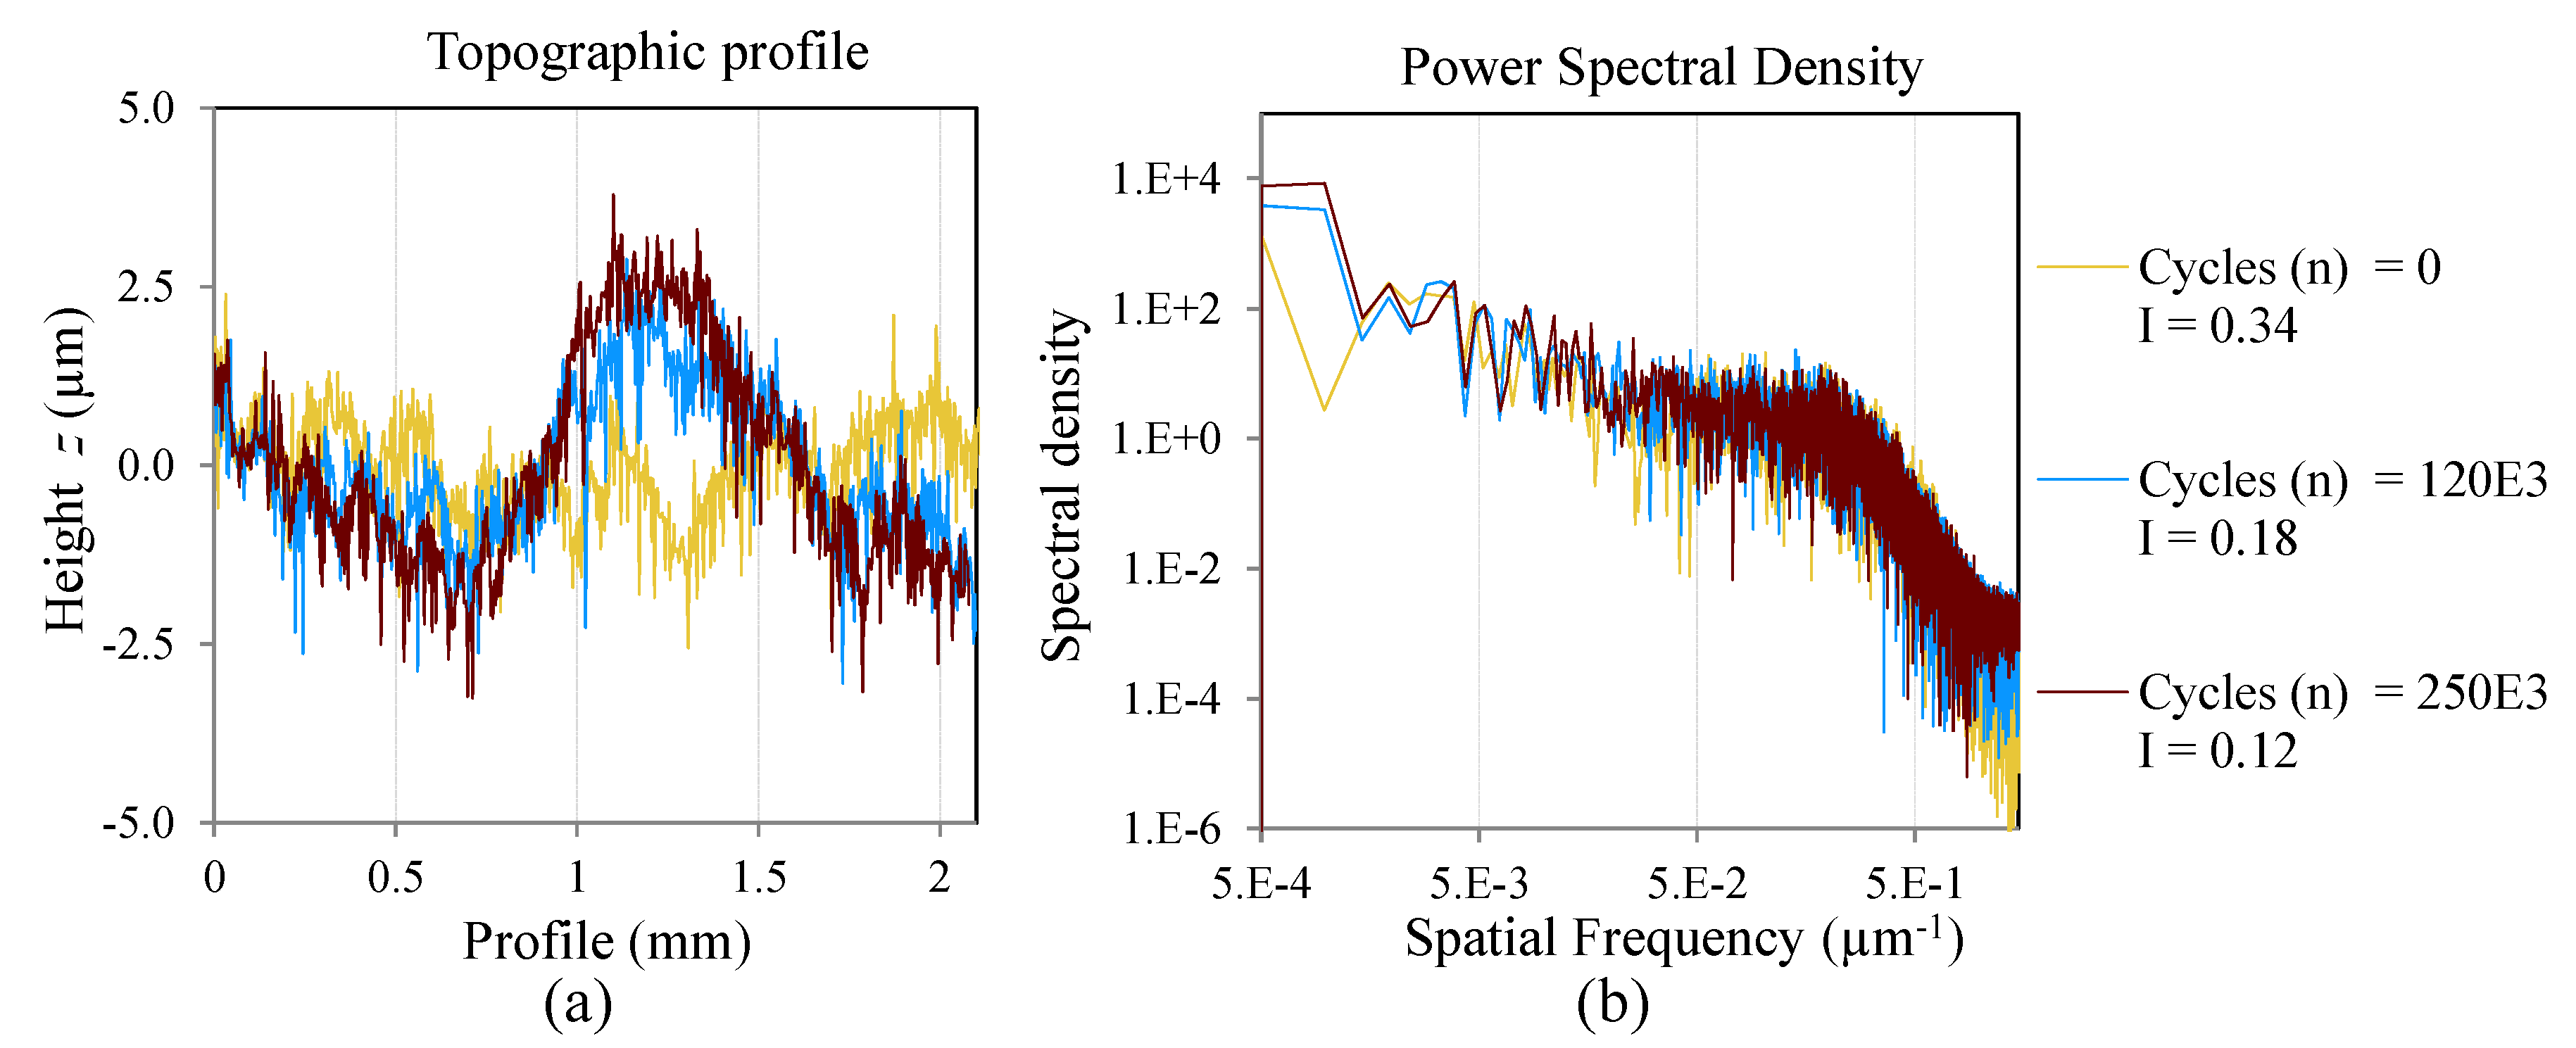
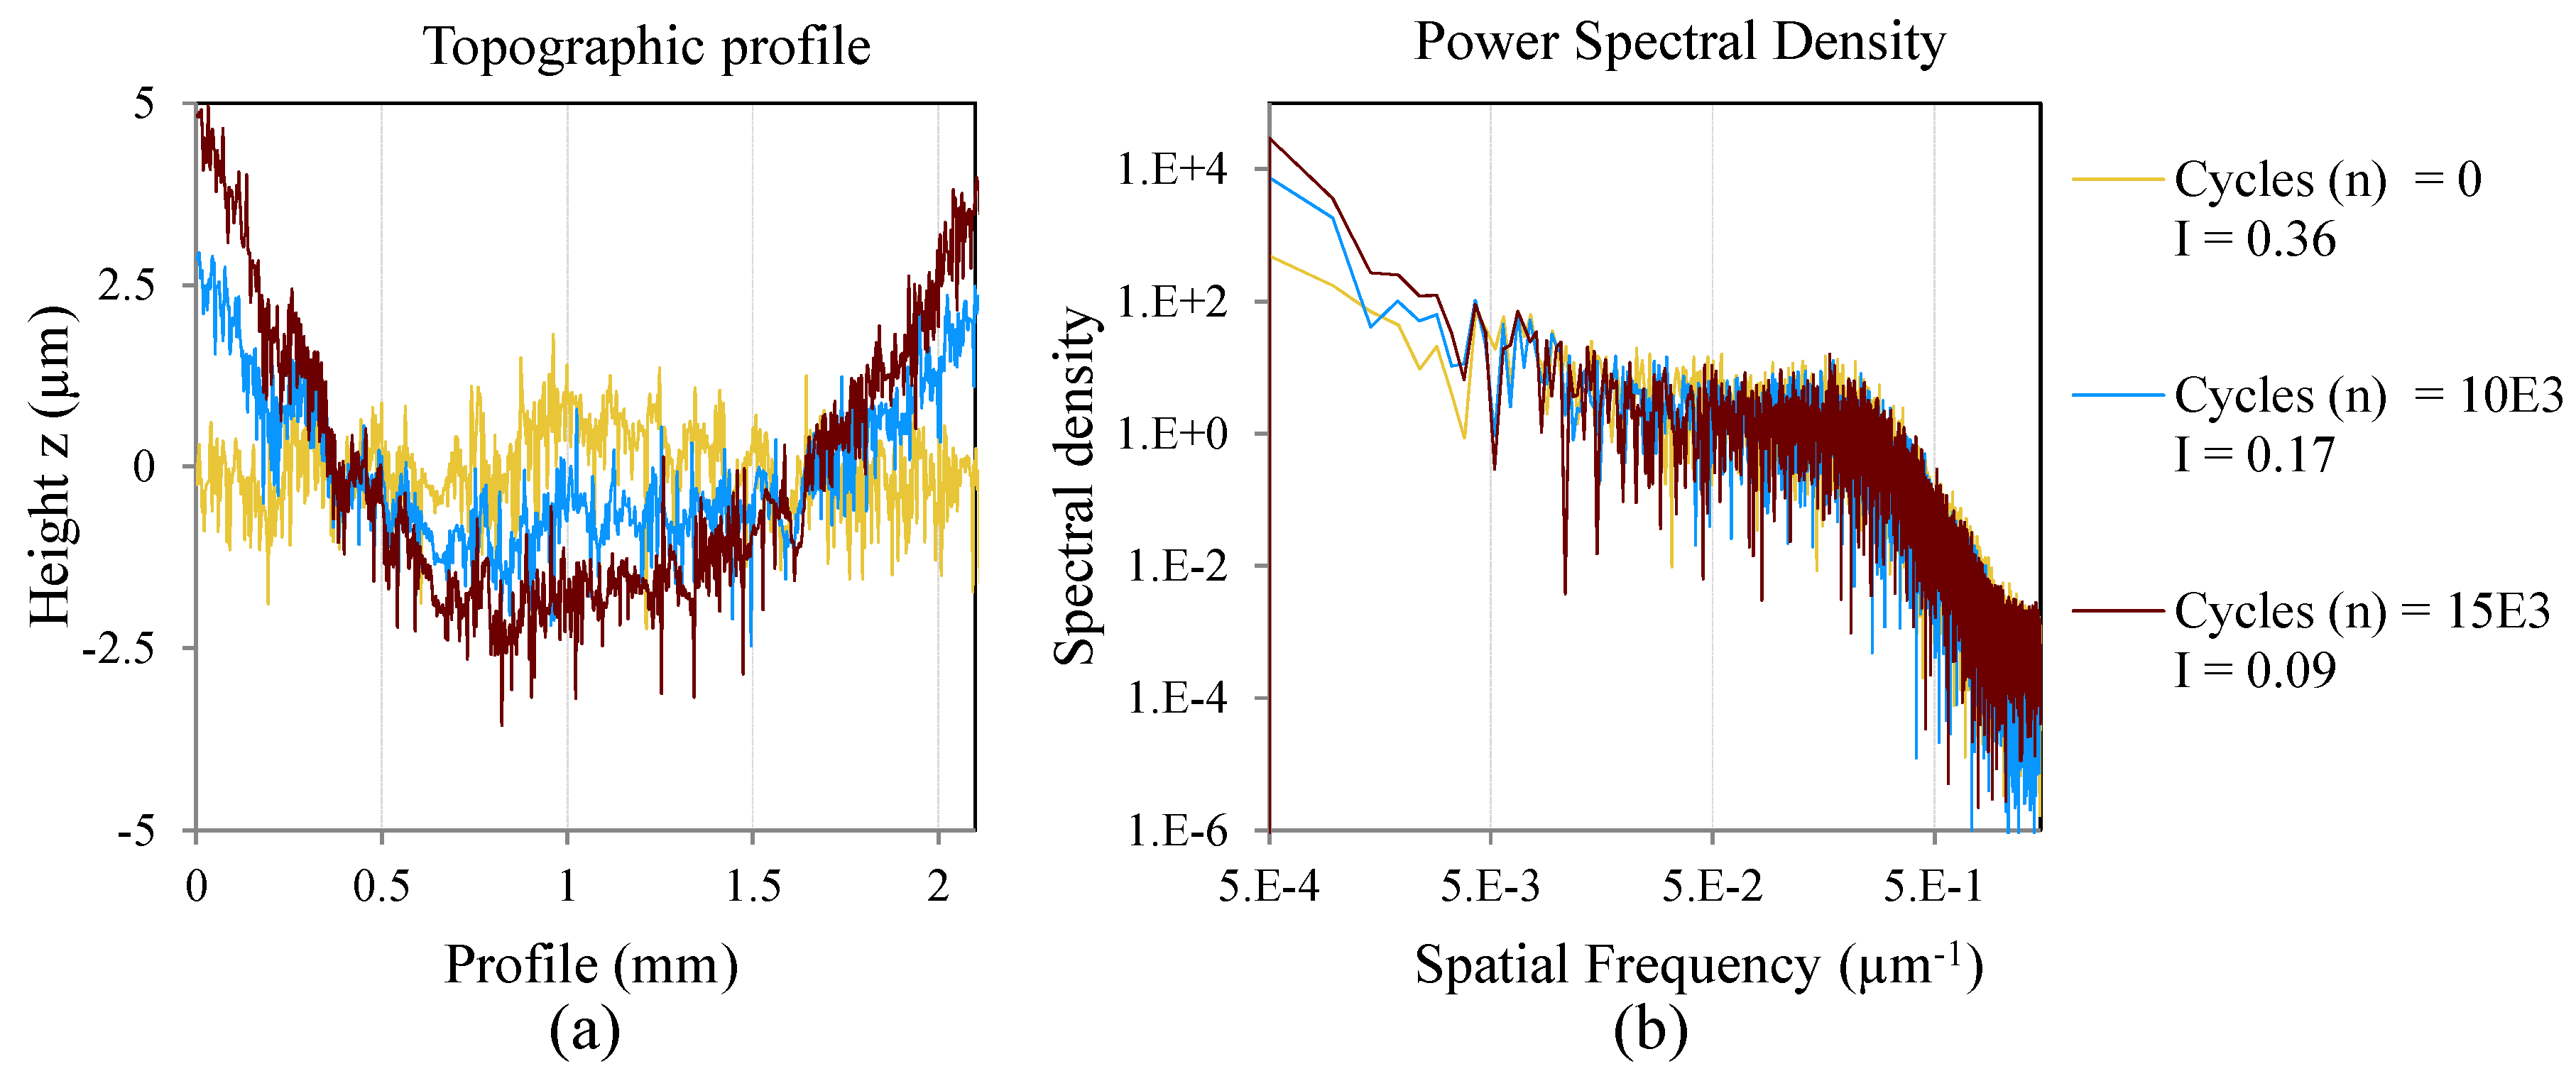
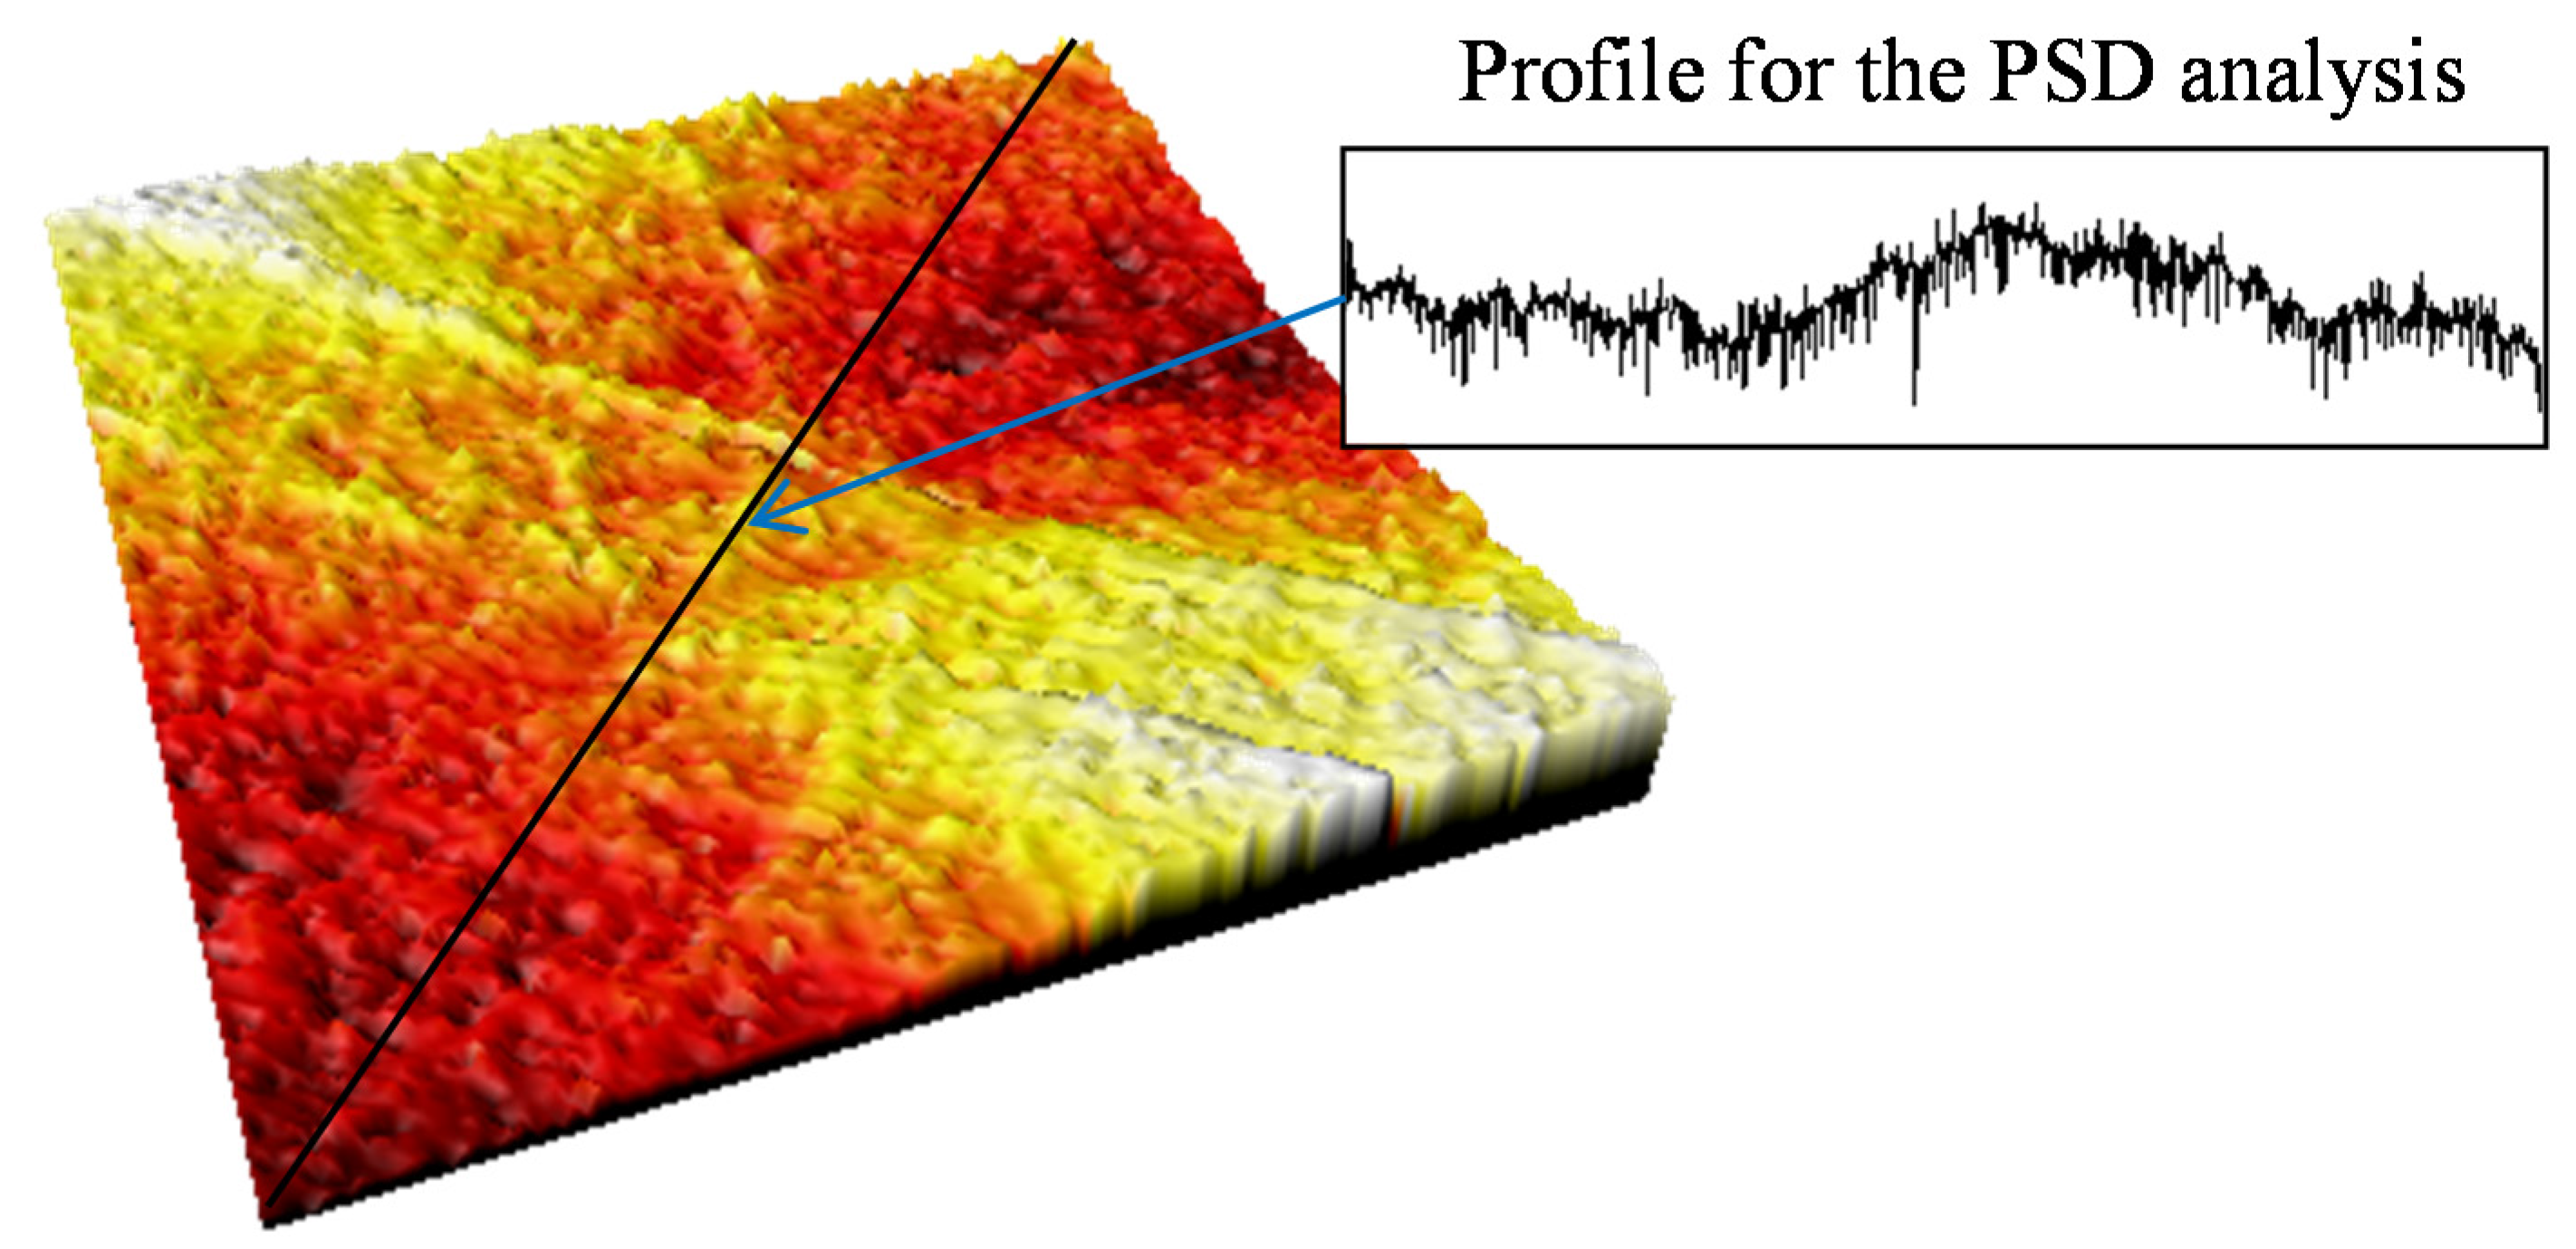
The PSD of each measurement is calculated from a profile extracted from the confocal topography, by sectioning the surface in a plane perpendicular to the reinforcing carbon fibers of the composite material, as shown in
Figure 5. The PSD and the surface irregularity factor for each point of measurement are calculated by the Equations (1)–(4).
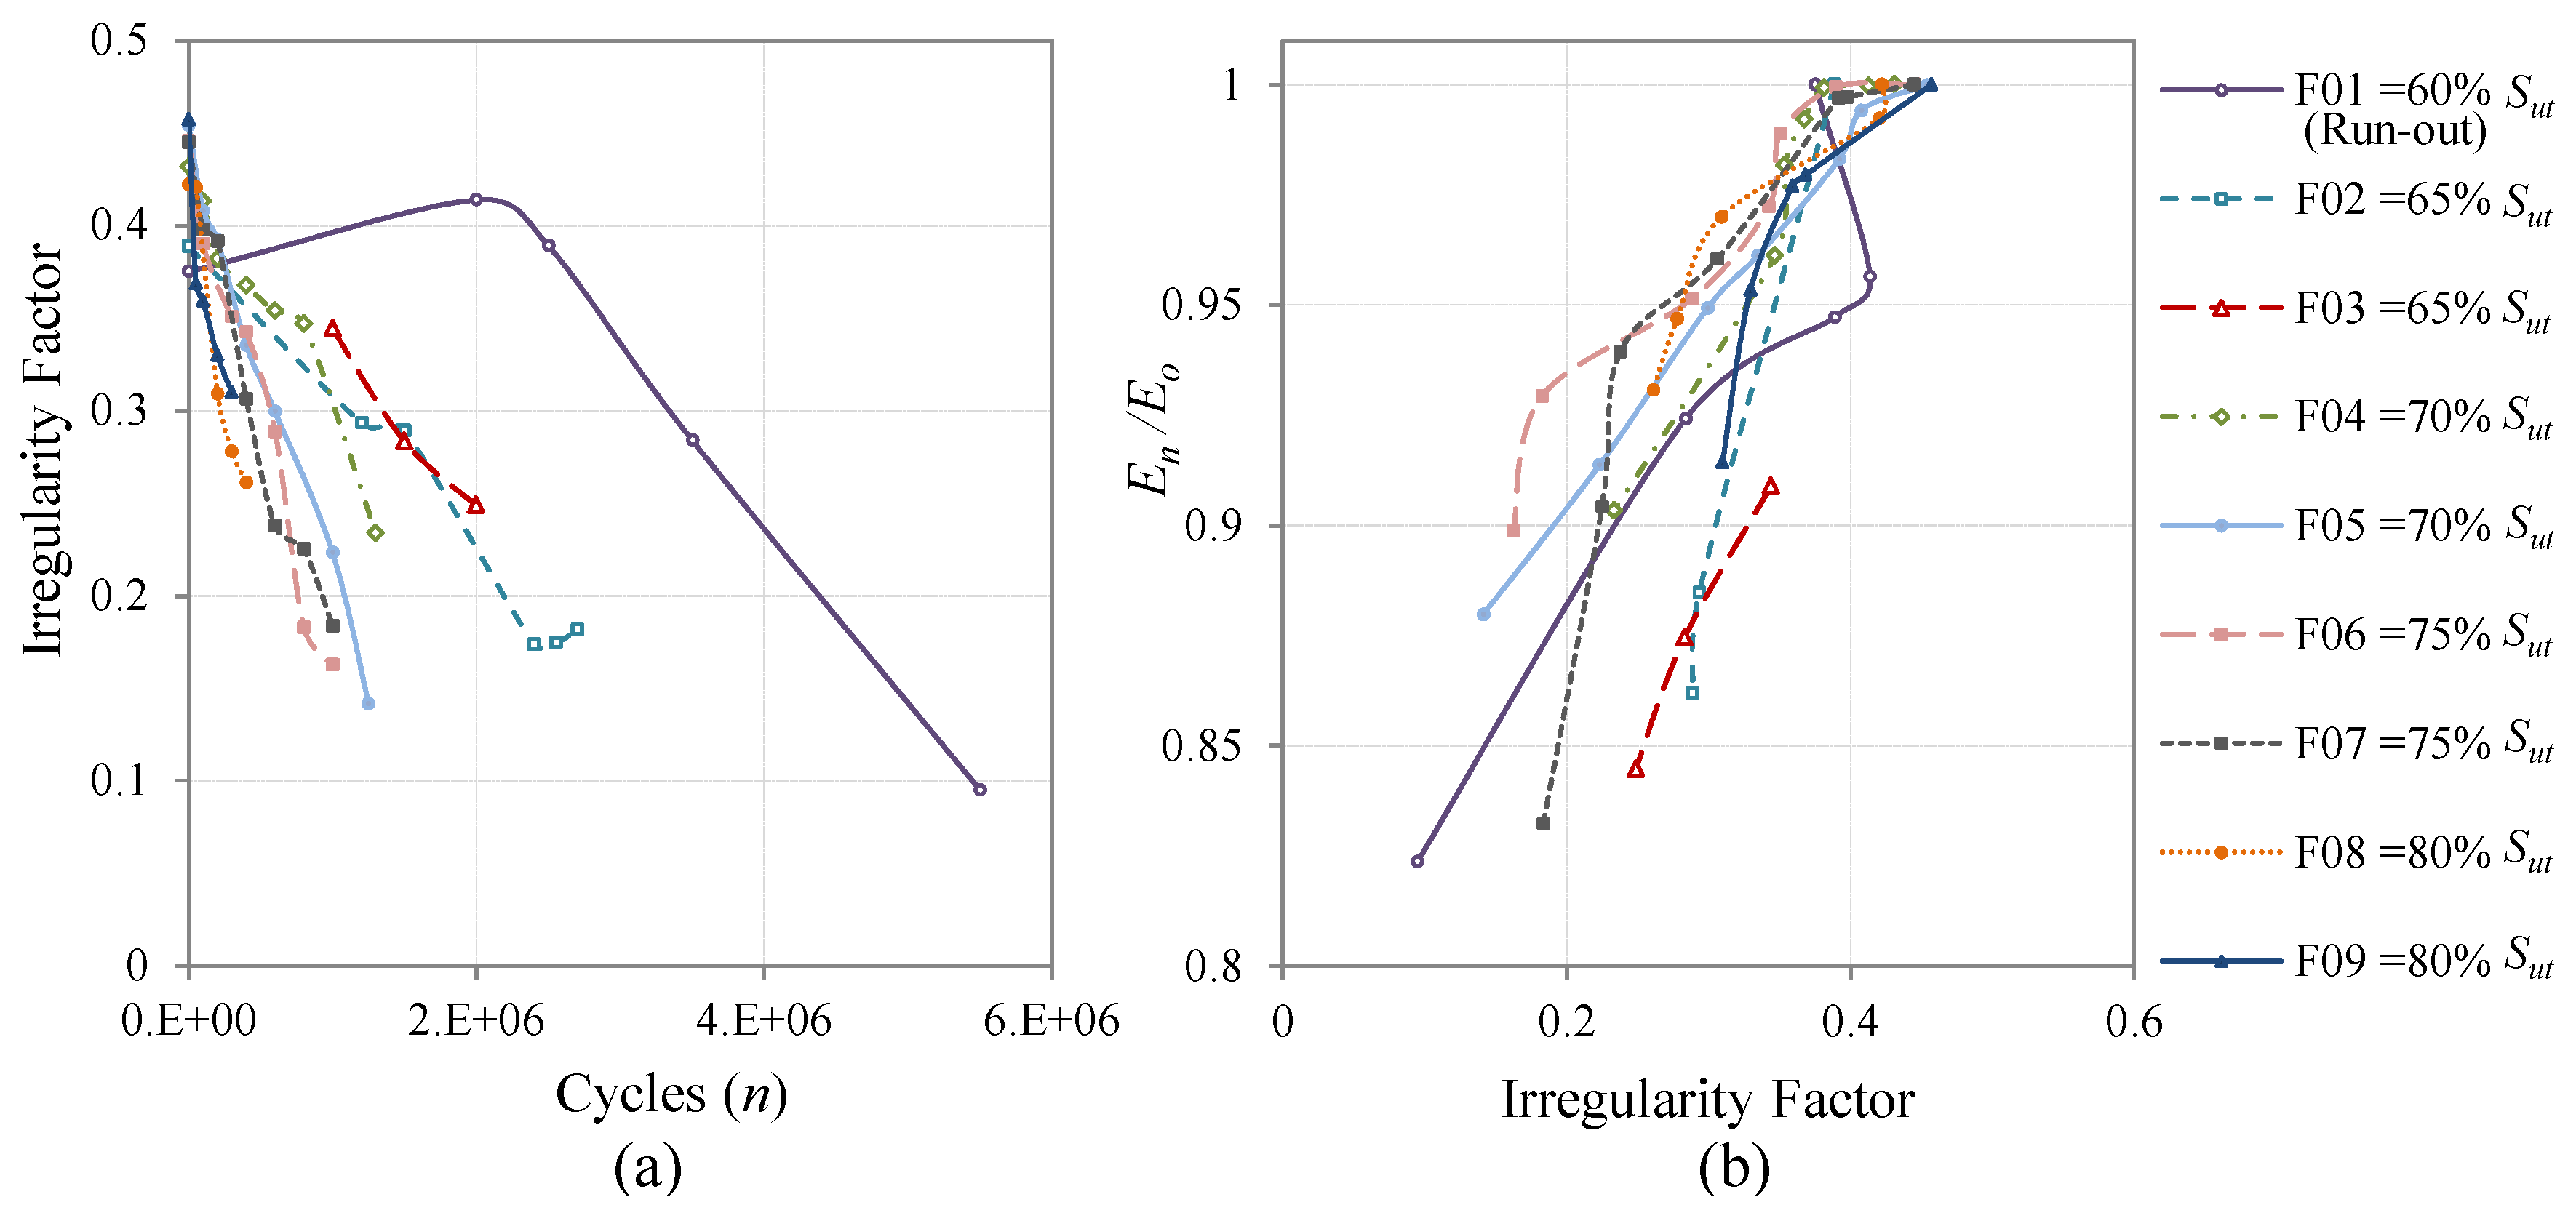
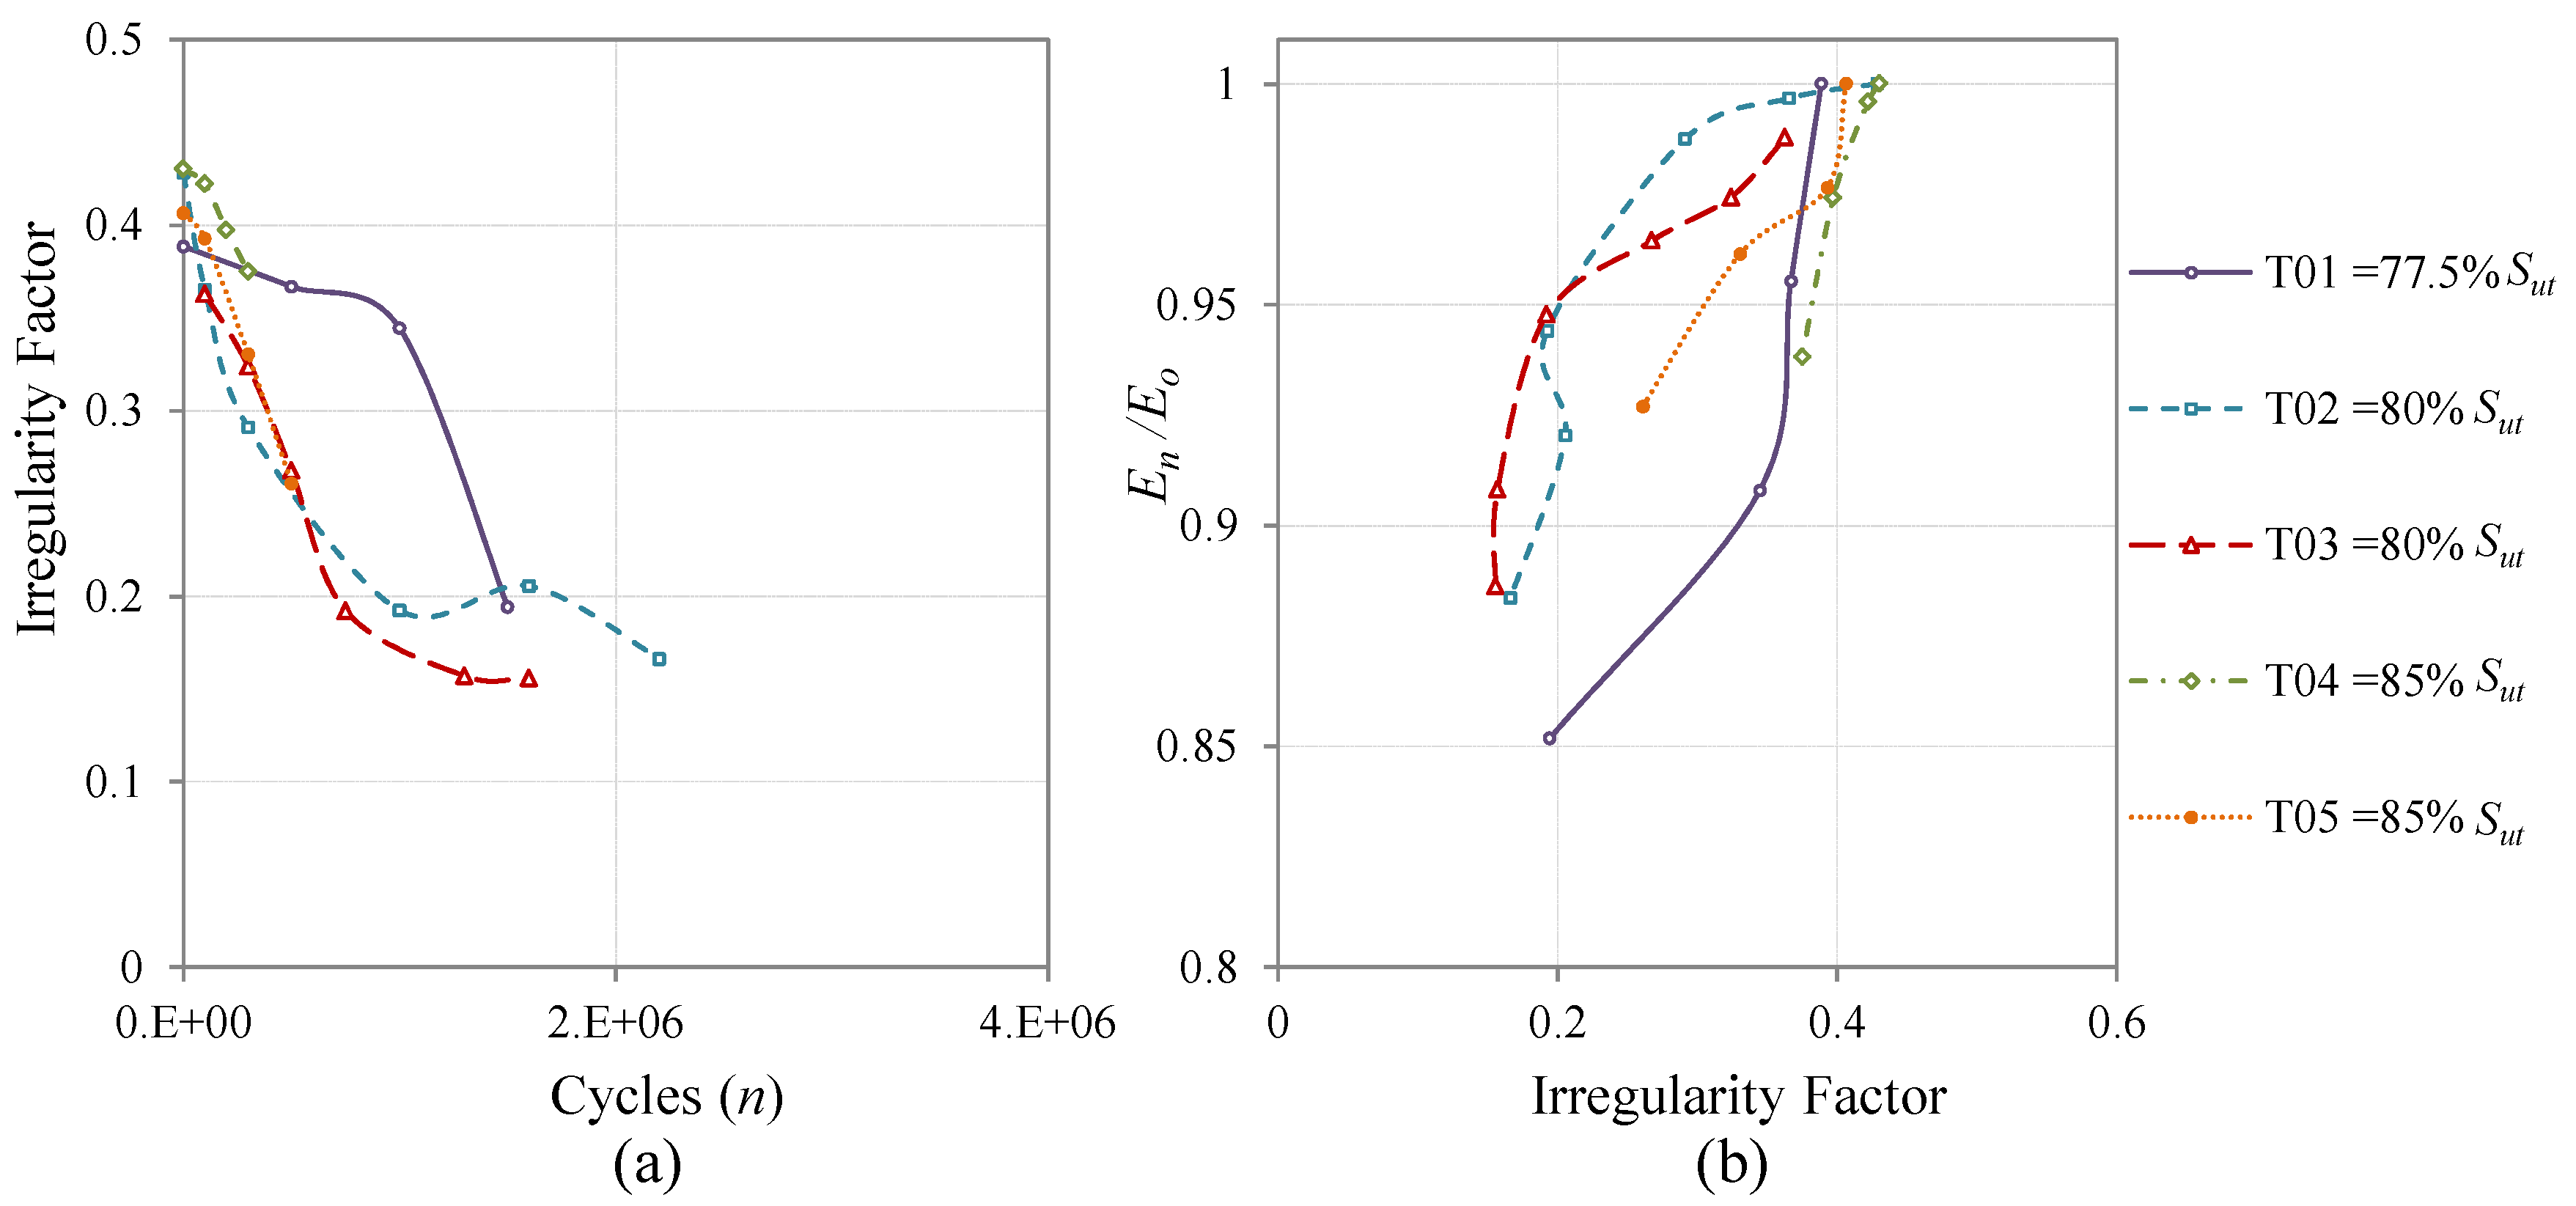
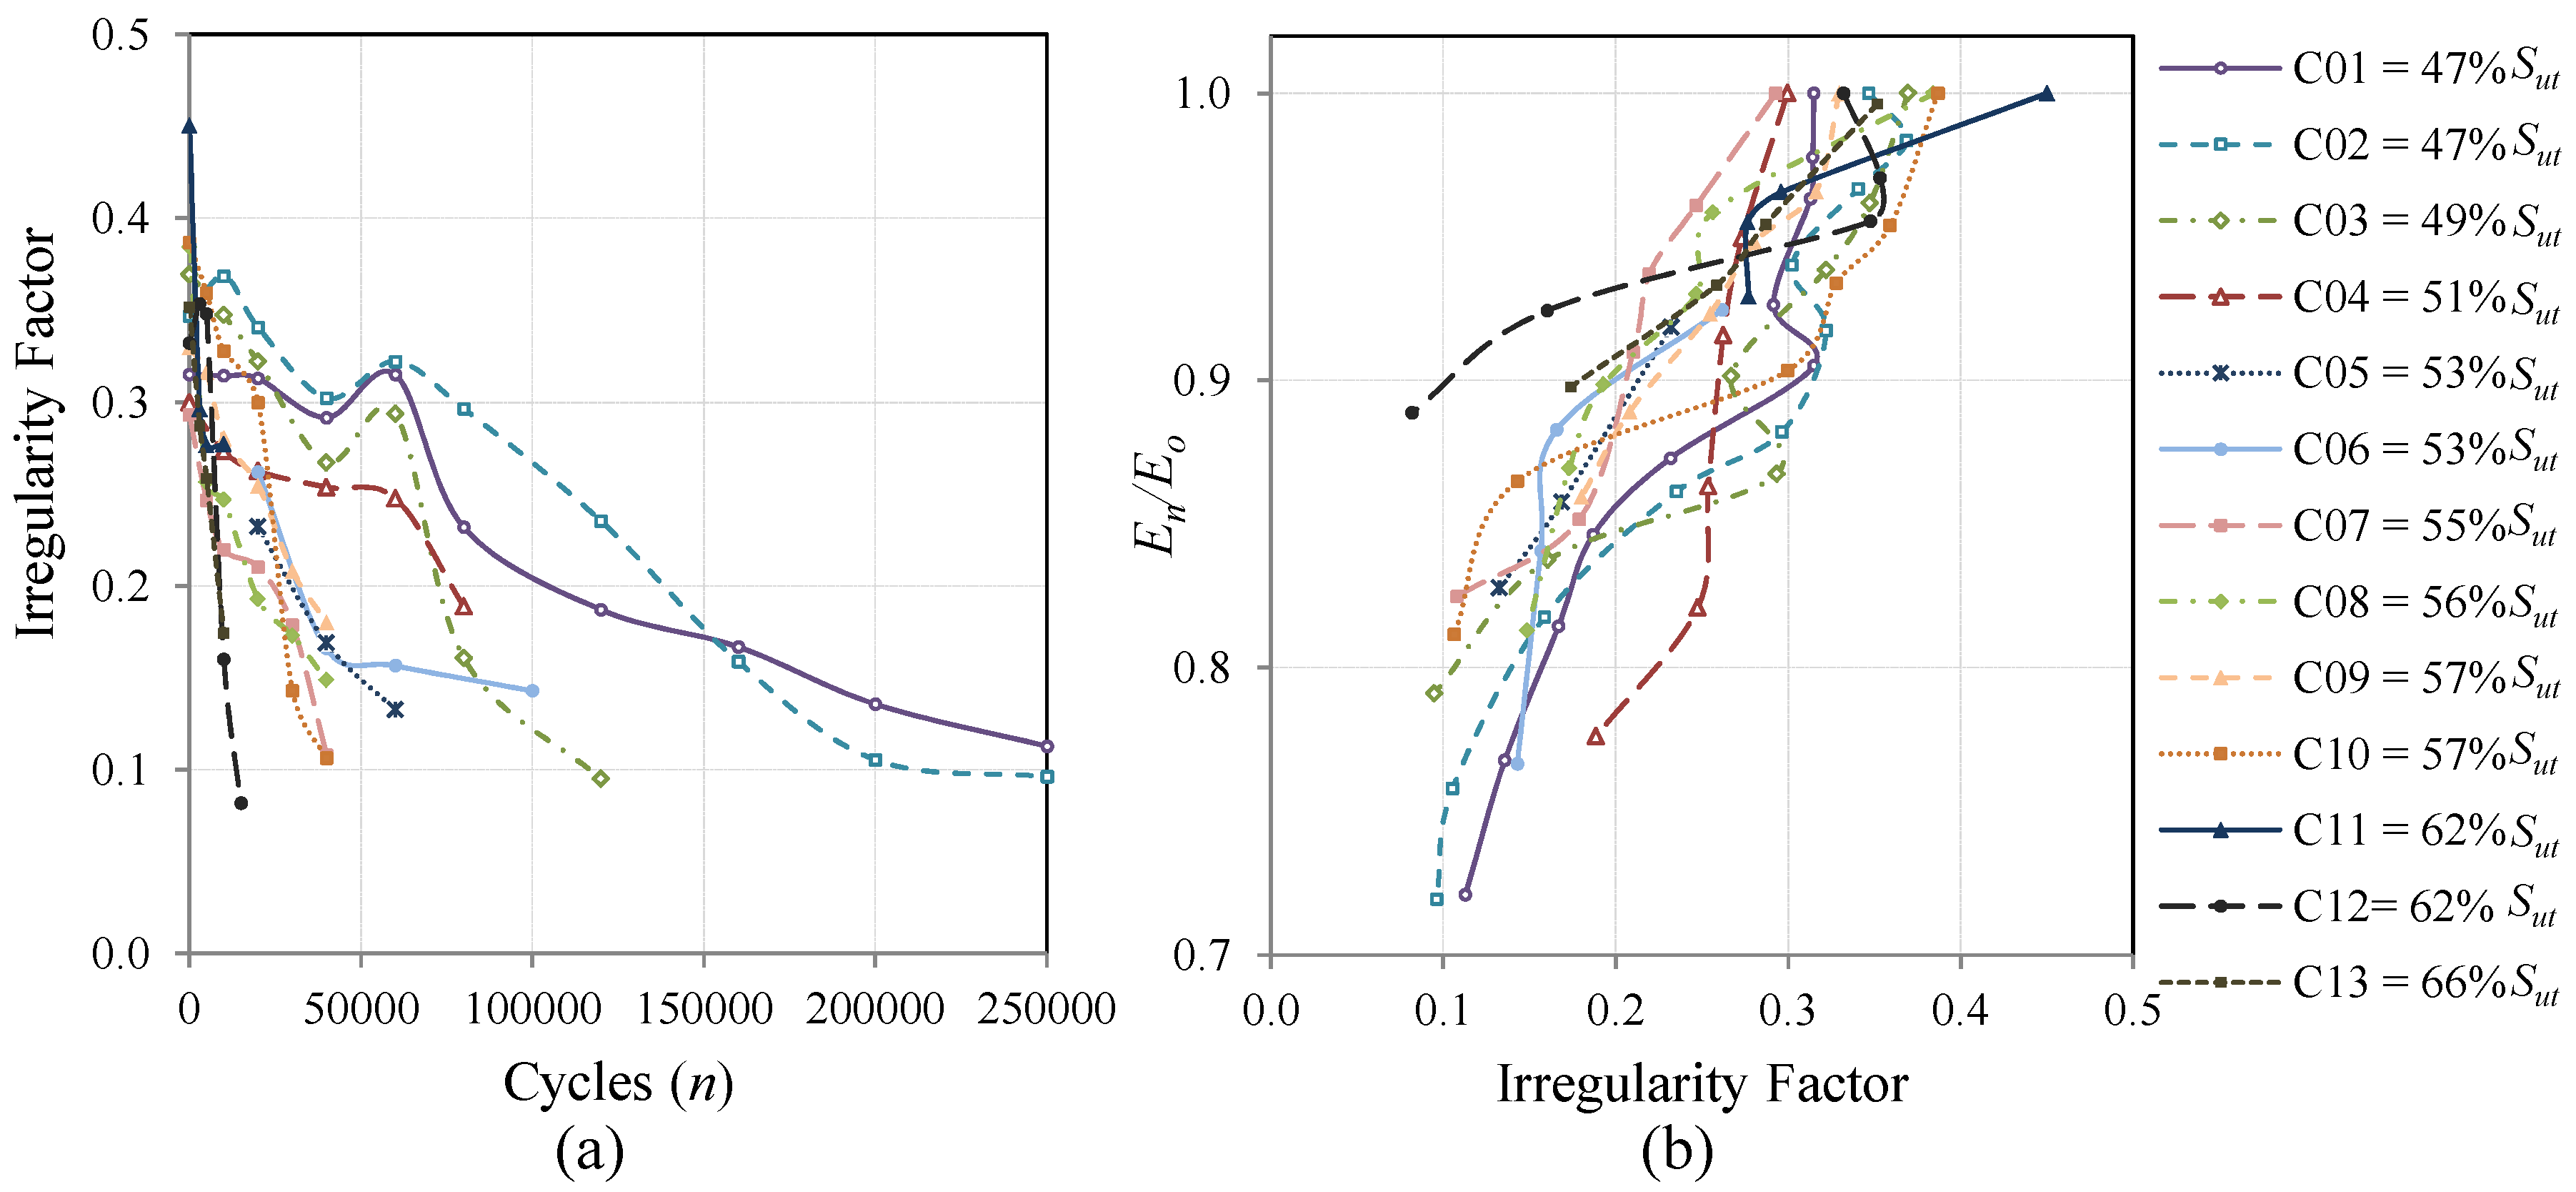
The evolution of the irregularity factor is evaluated and analyzed in relation to the number of cycles applied and is finally compared with a classical metric of fatigue damage for composite materials, which is the stiffness degradation [
5].
Figure 5.
Surface topography in one of the measurement areas and the section profile used to calculate the irregularity factor.
Figure 5.
Surface topography in one of the measurement areas and the section profile used to calculate the irregularity factor.
4. Conclusions
A new inspection technique for the evaluation of the damage state of composite material structures has been presented. It has been demonstrated that the method is applicable for a wide range of fatigue loads, from constant amplitude load cases to complex spectrum loads of fighter and transport aircraft, normalized in Falstaff and MiniTwist standards, respectively. The stiffness degradation and with it, the internal structural damage provoked by fatigue cycles, can be estimated by analyzing and measuring the surface topography using confocal microscopy. Hand held equipment for structural inspections of this type is already on the market. Examples of commercial portable perfilometers from the same manufacturer, and with the same technology and precision as the confocal microscope employed to obtain the results of the present work, are the models PLμ 1300 and Smart, both from Sensofar.
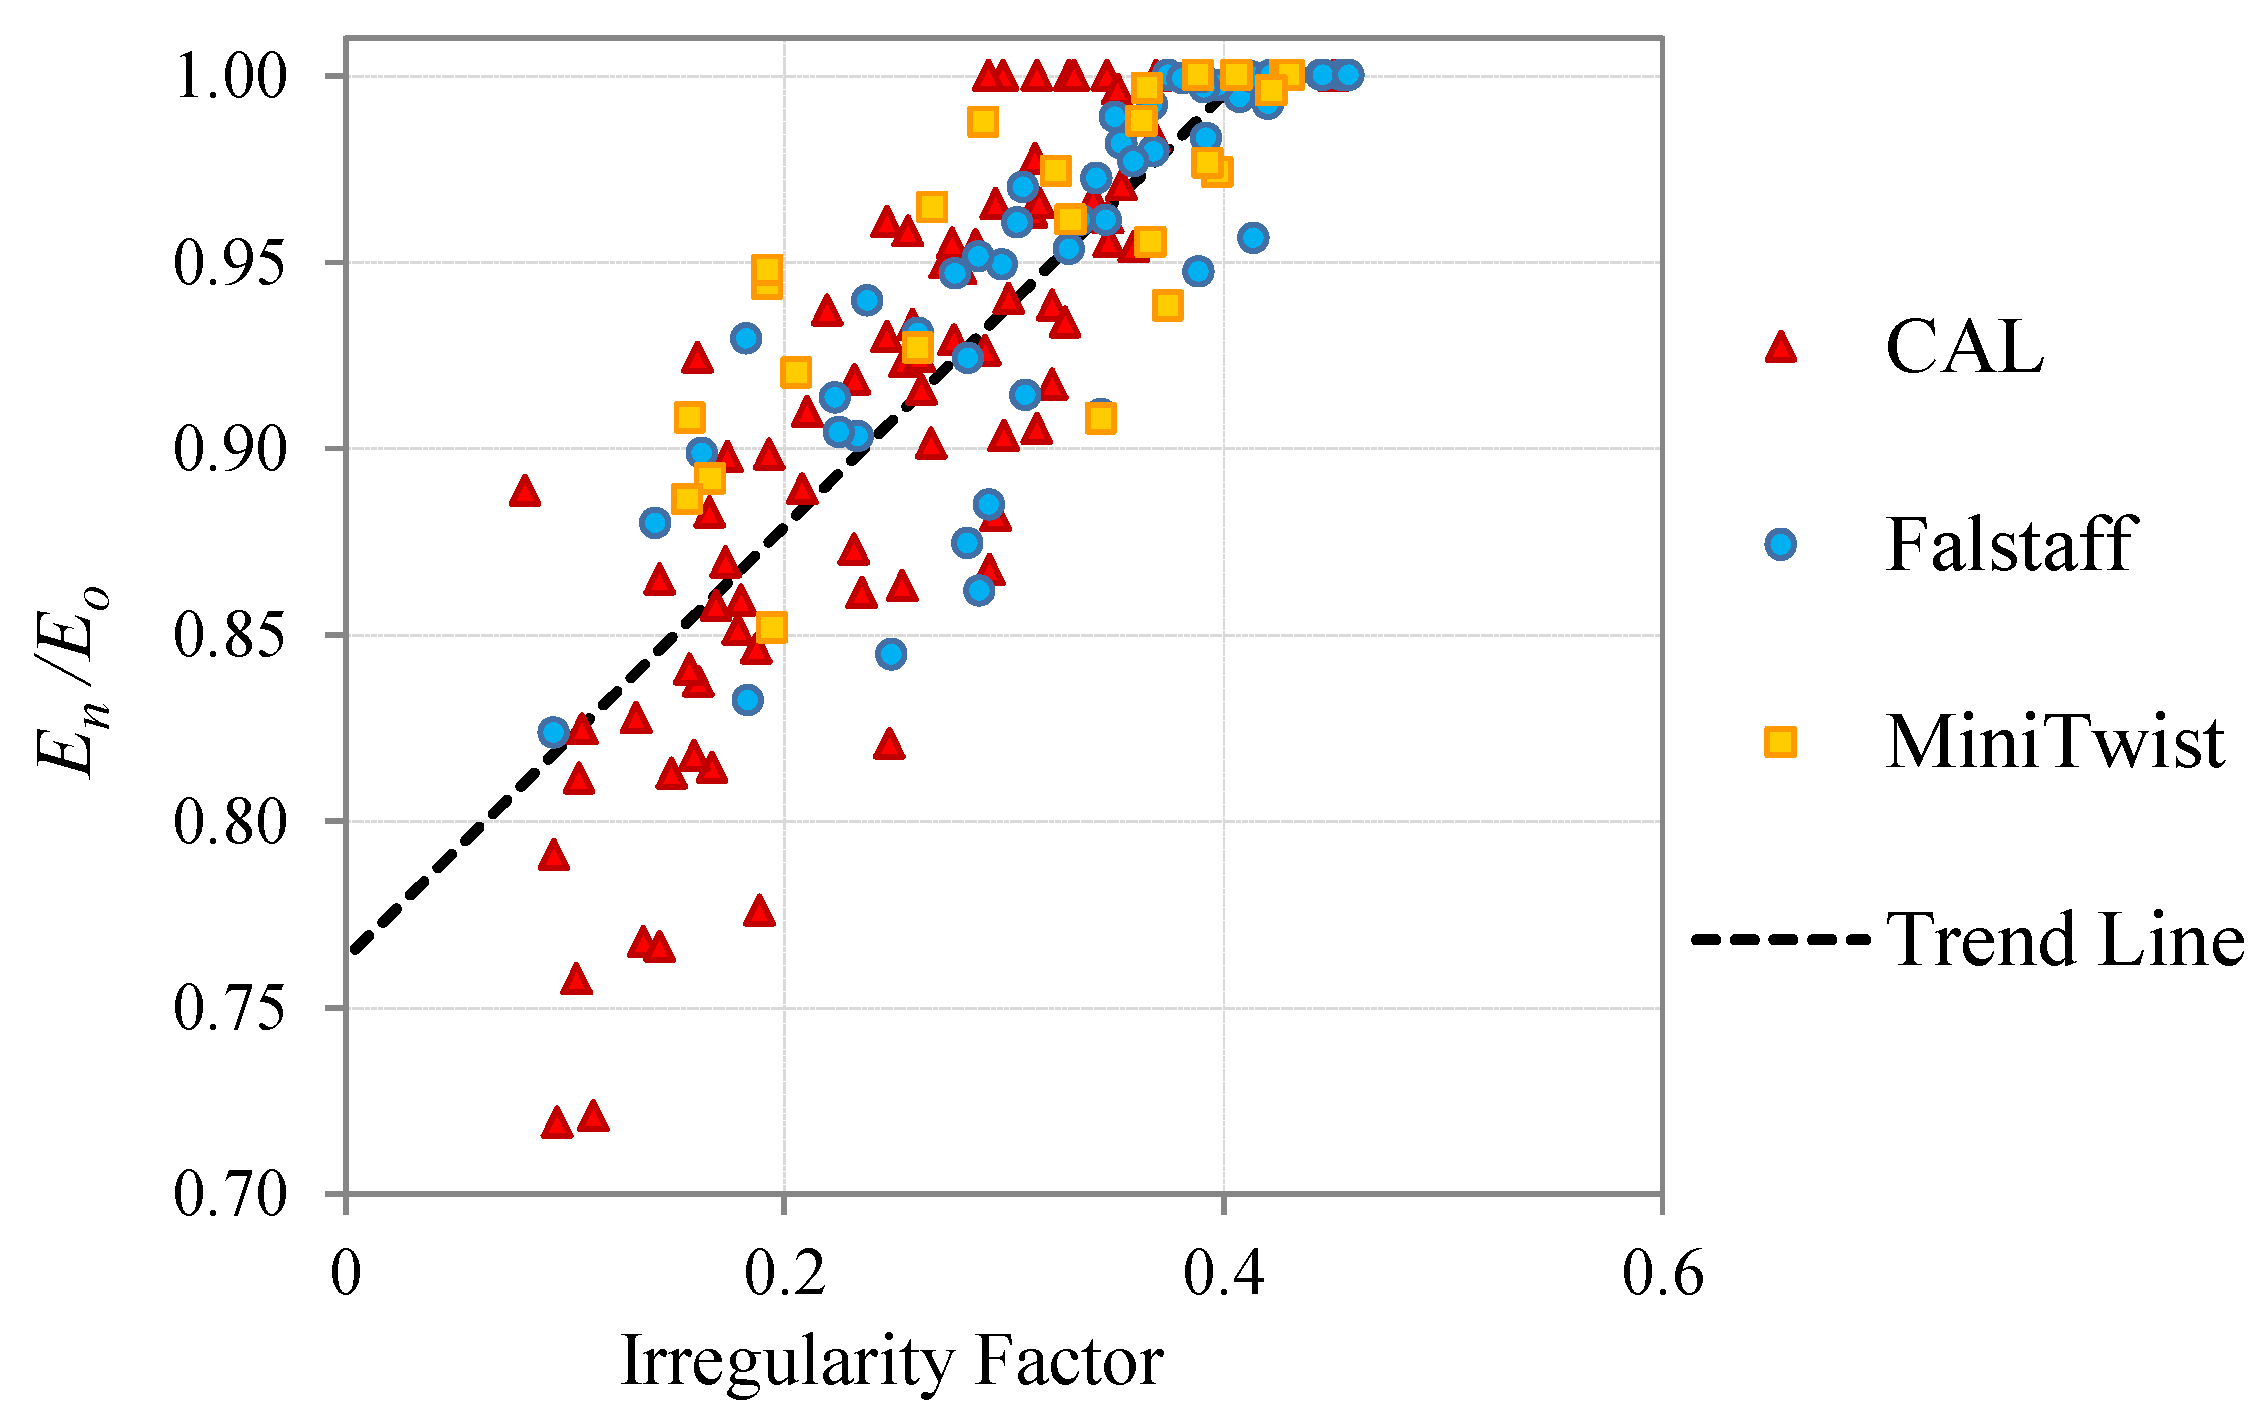
The surface irregularity factor, as a parameter to measure the damage state of a carbon fiber component, shows a good agreement with a classical damage metric such as the stiffness degradation. To consider the Pearson correlation of 0.84 as good, we should take into account that fatigue processes are a stochastic phenomenon with high variability.
Analysis in the spatial frequency domain could reveal surface changes due to fatigue damage that are hidden in an analysis of the surface roughness magnitude [
15,
16]. Internal delaminations are revealed by low spatial frequency components and cracks and micro-cracks increase the high spatial frequency content.
The results obtained with the present methodology are independent of the load type applied and can be used for a wide range of applications where the in-service loads are known and controlled (such as pressure vessels) and where the loads are of random or variable nature (wings, automotive components, etc.).


