
Microstructural Evolution at Micro/Meso-Scale in an Ultrafine-Grained Pure Aluminum Processed by Equal-Channel Angular Pressing with Subsequent Annealing Treatment

Abstract
:1. Introduction
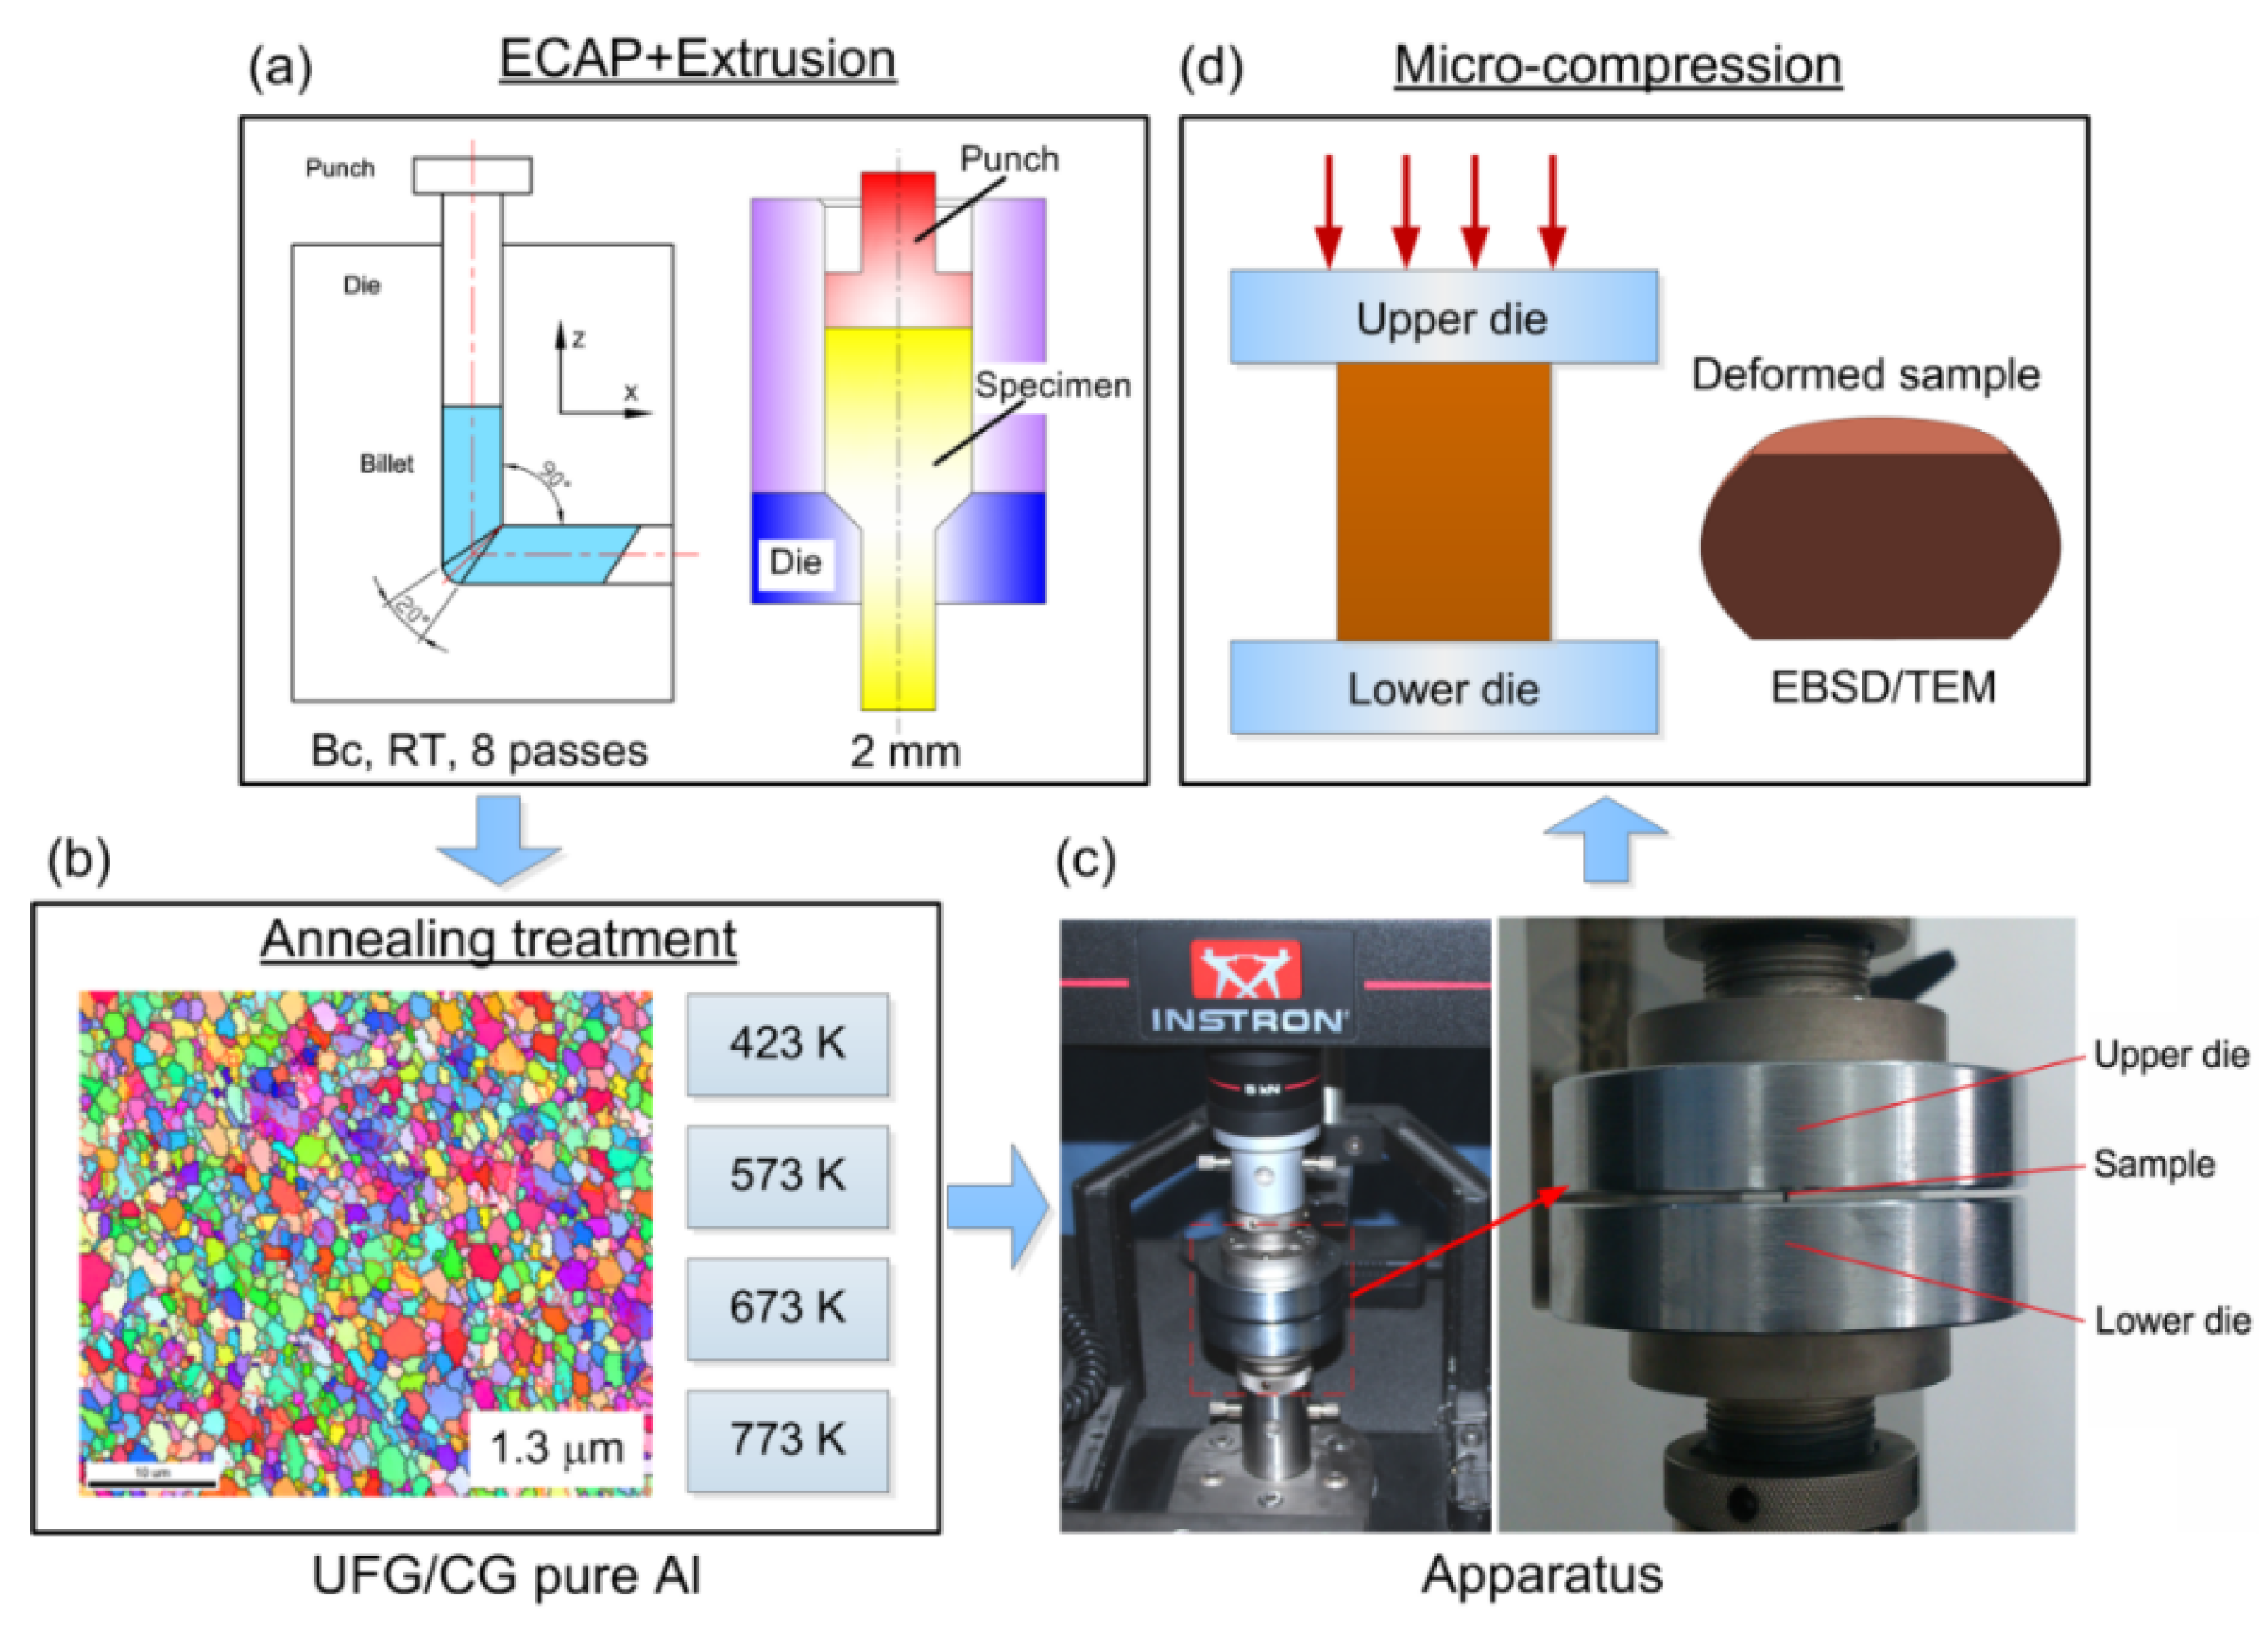
2. Experimental Materials and Procedures

| Conditions | After ECAP + Extrusion | 423 K, 1 h | 573 K, 1 h | 673 K, 1 h | 773 K, 1 h |
|---|---|---|---|---|---|
| Grain size (μm) | ~1.3 | ~1.5 | ~4.0 | ~25 | ~150 |
3. Experimental Results and Discussion
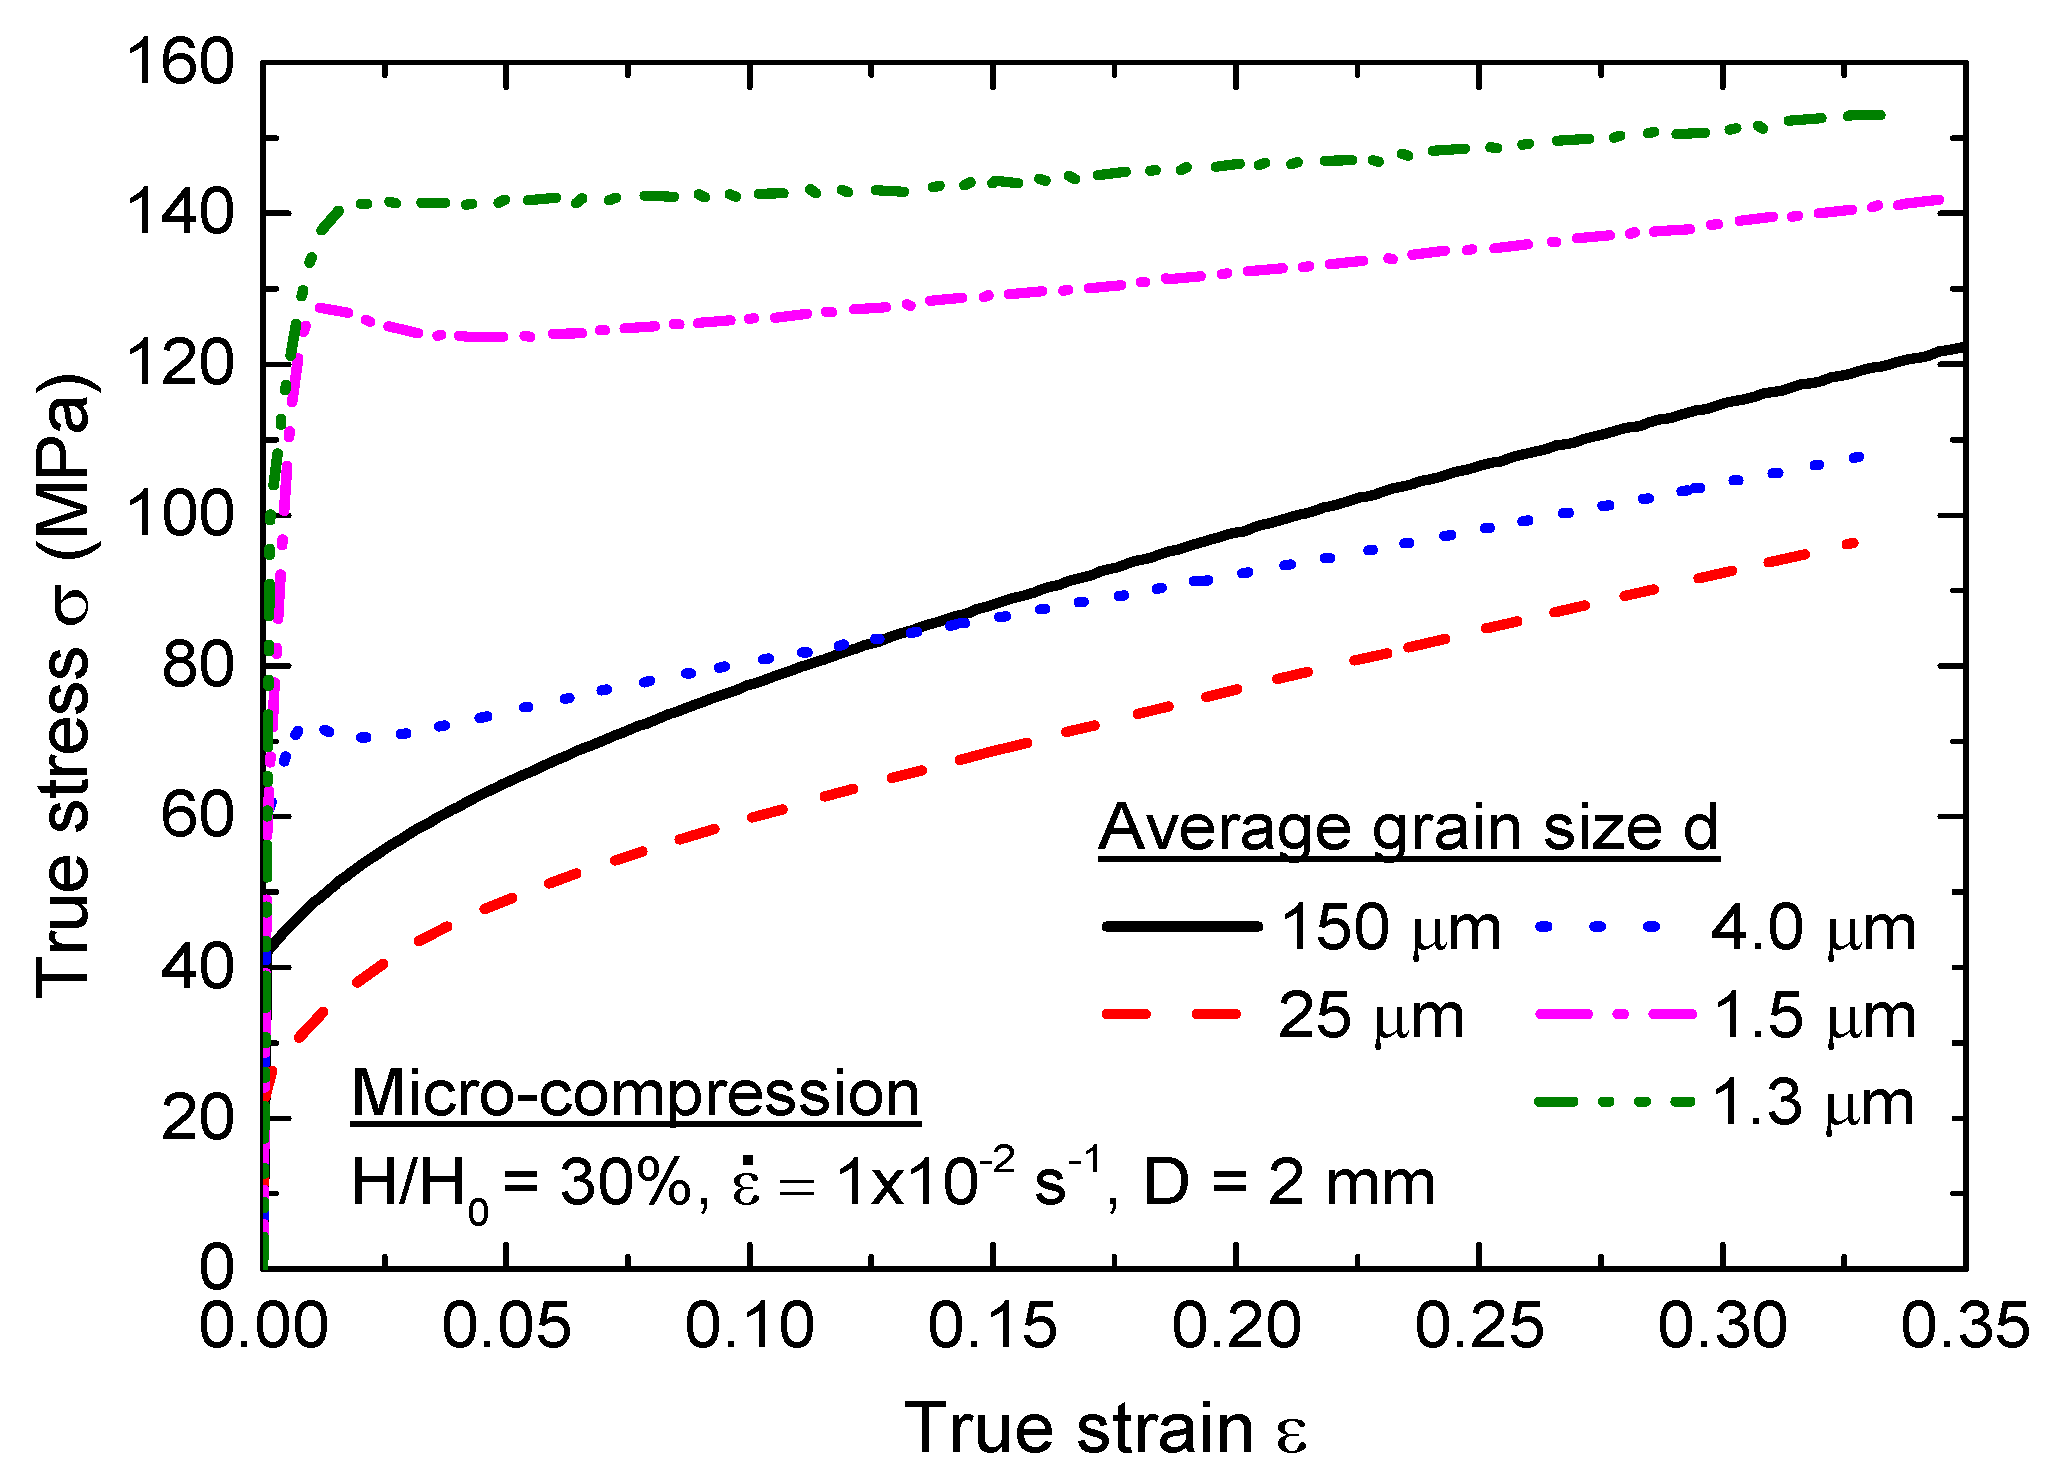
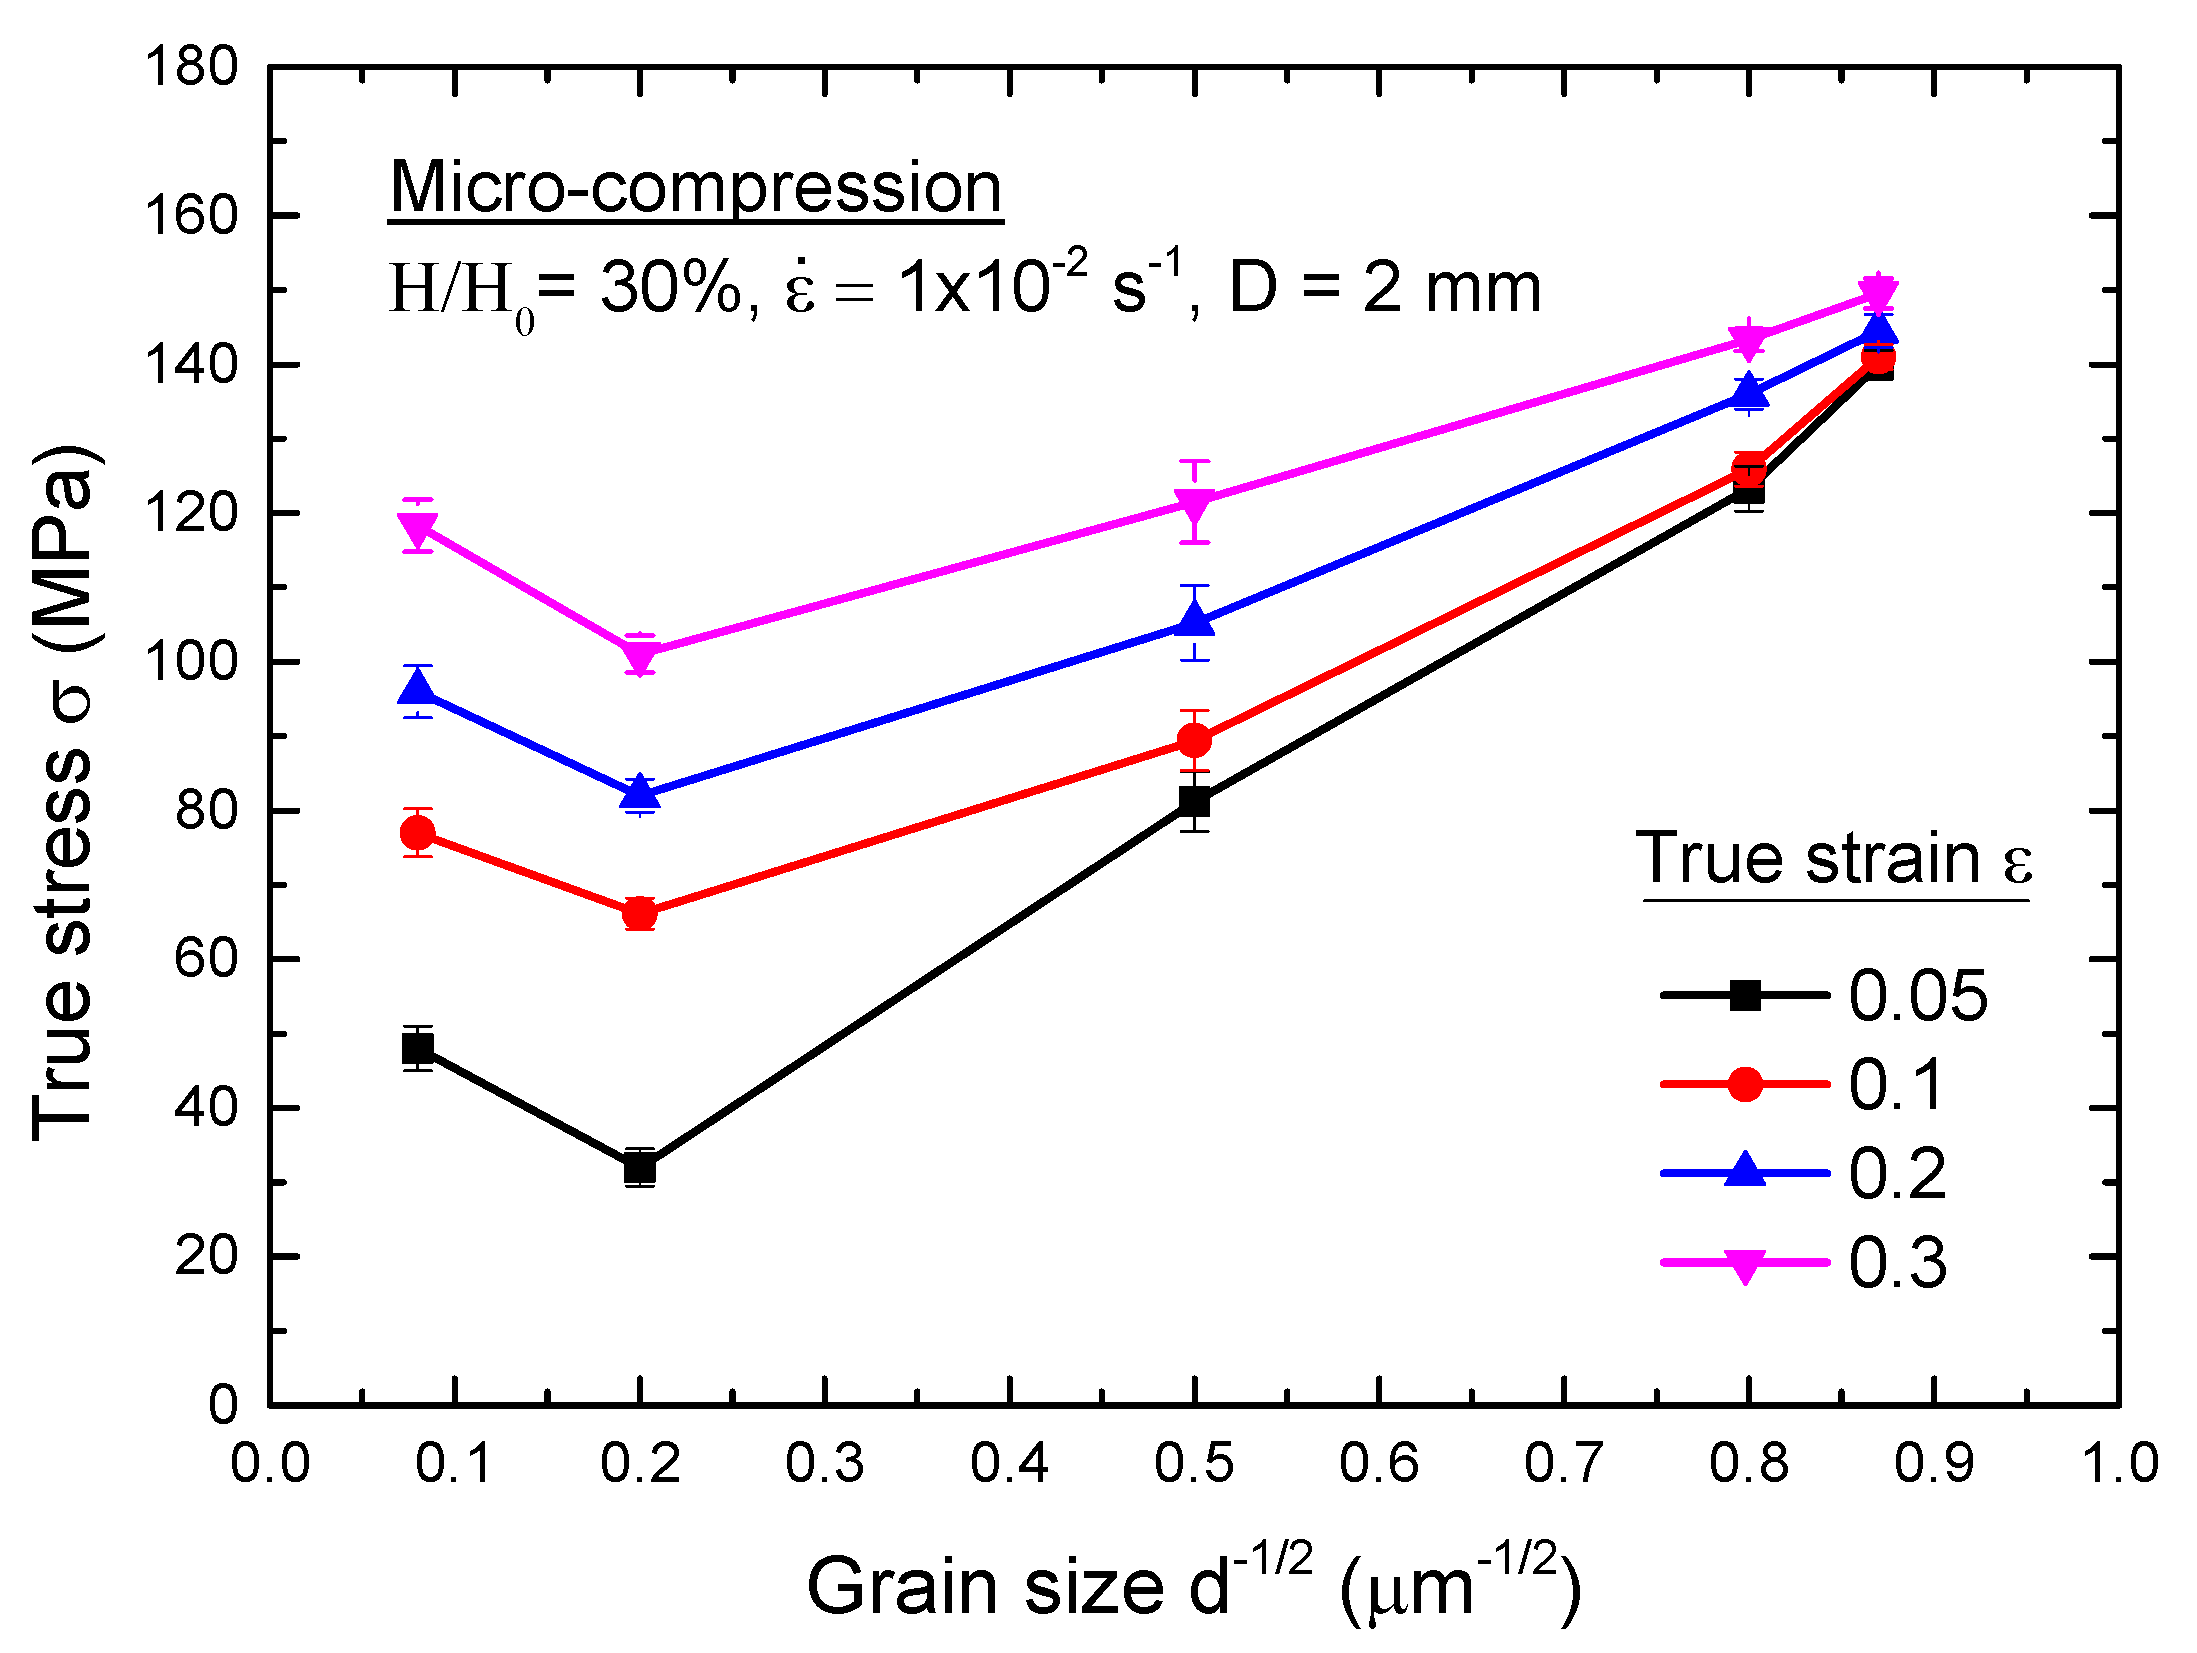
3.1. Flow Stress Behavior of Micro-Compression in Pure Al


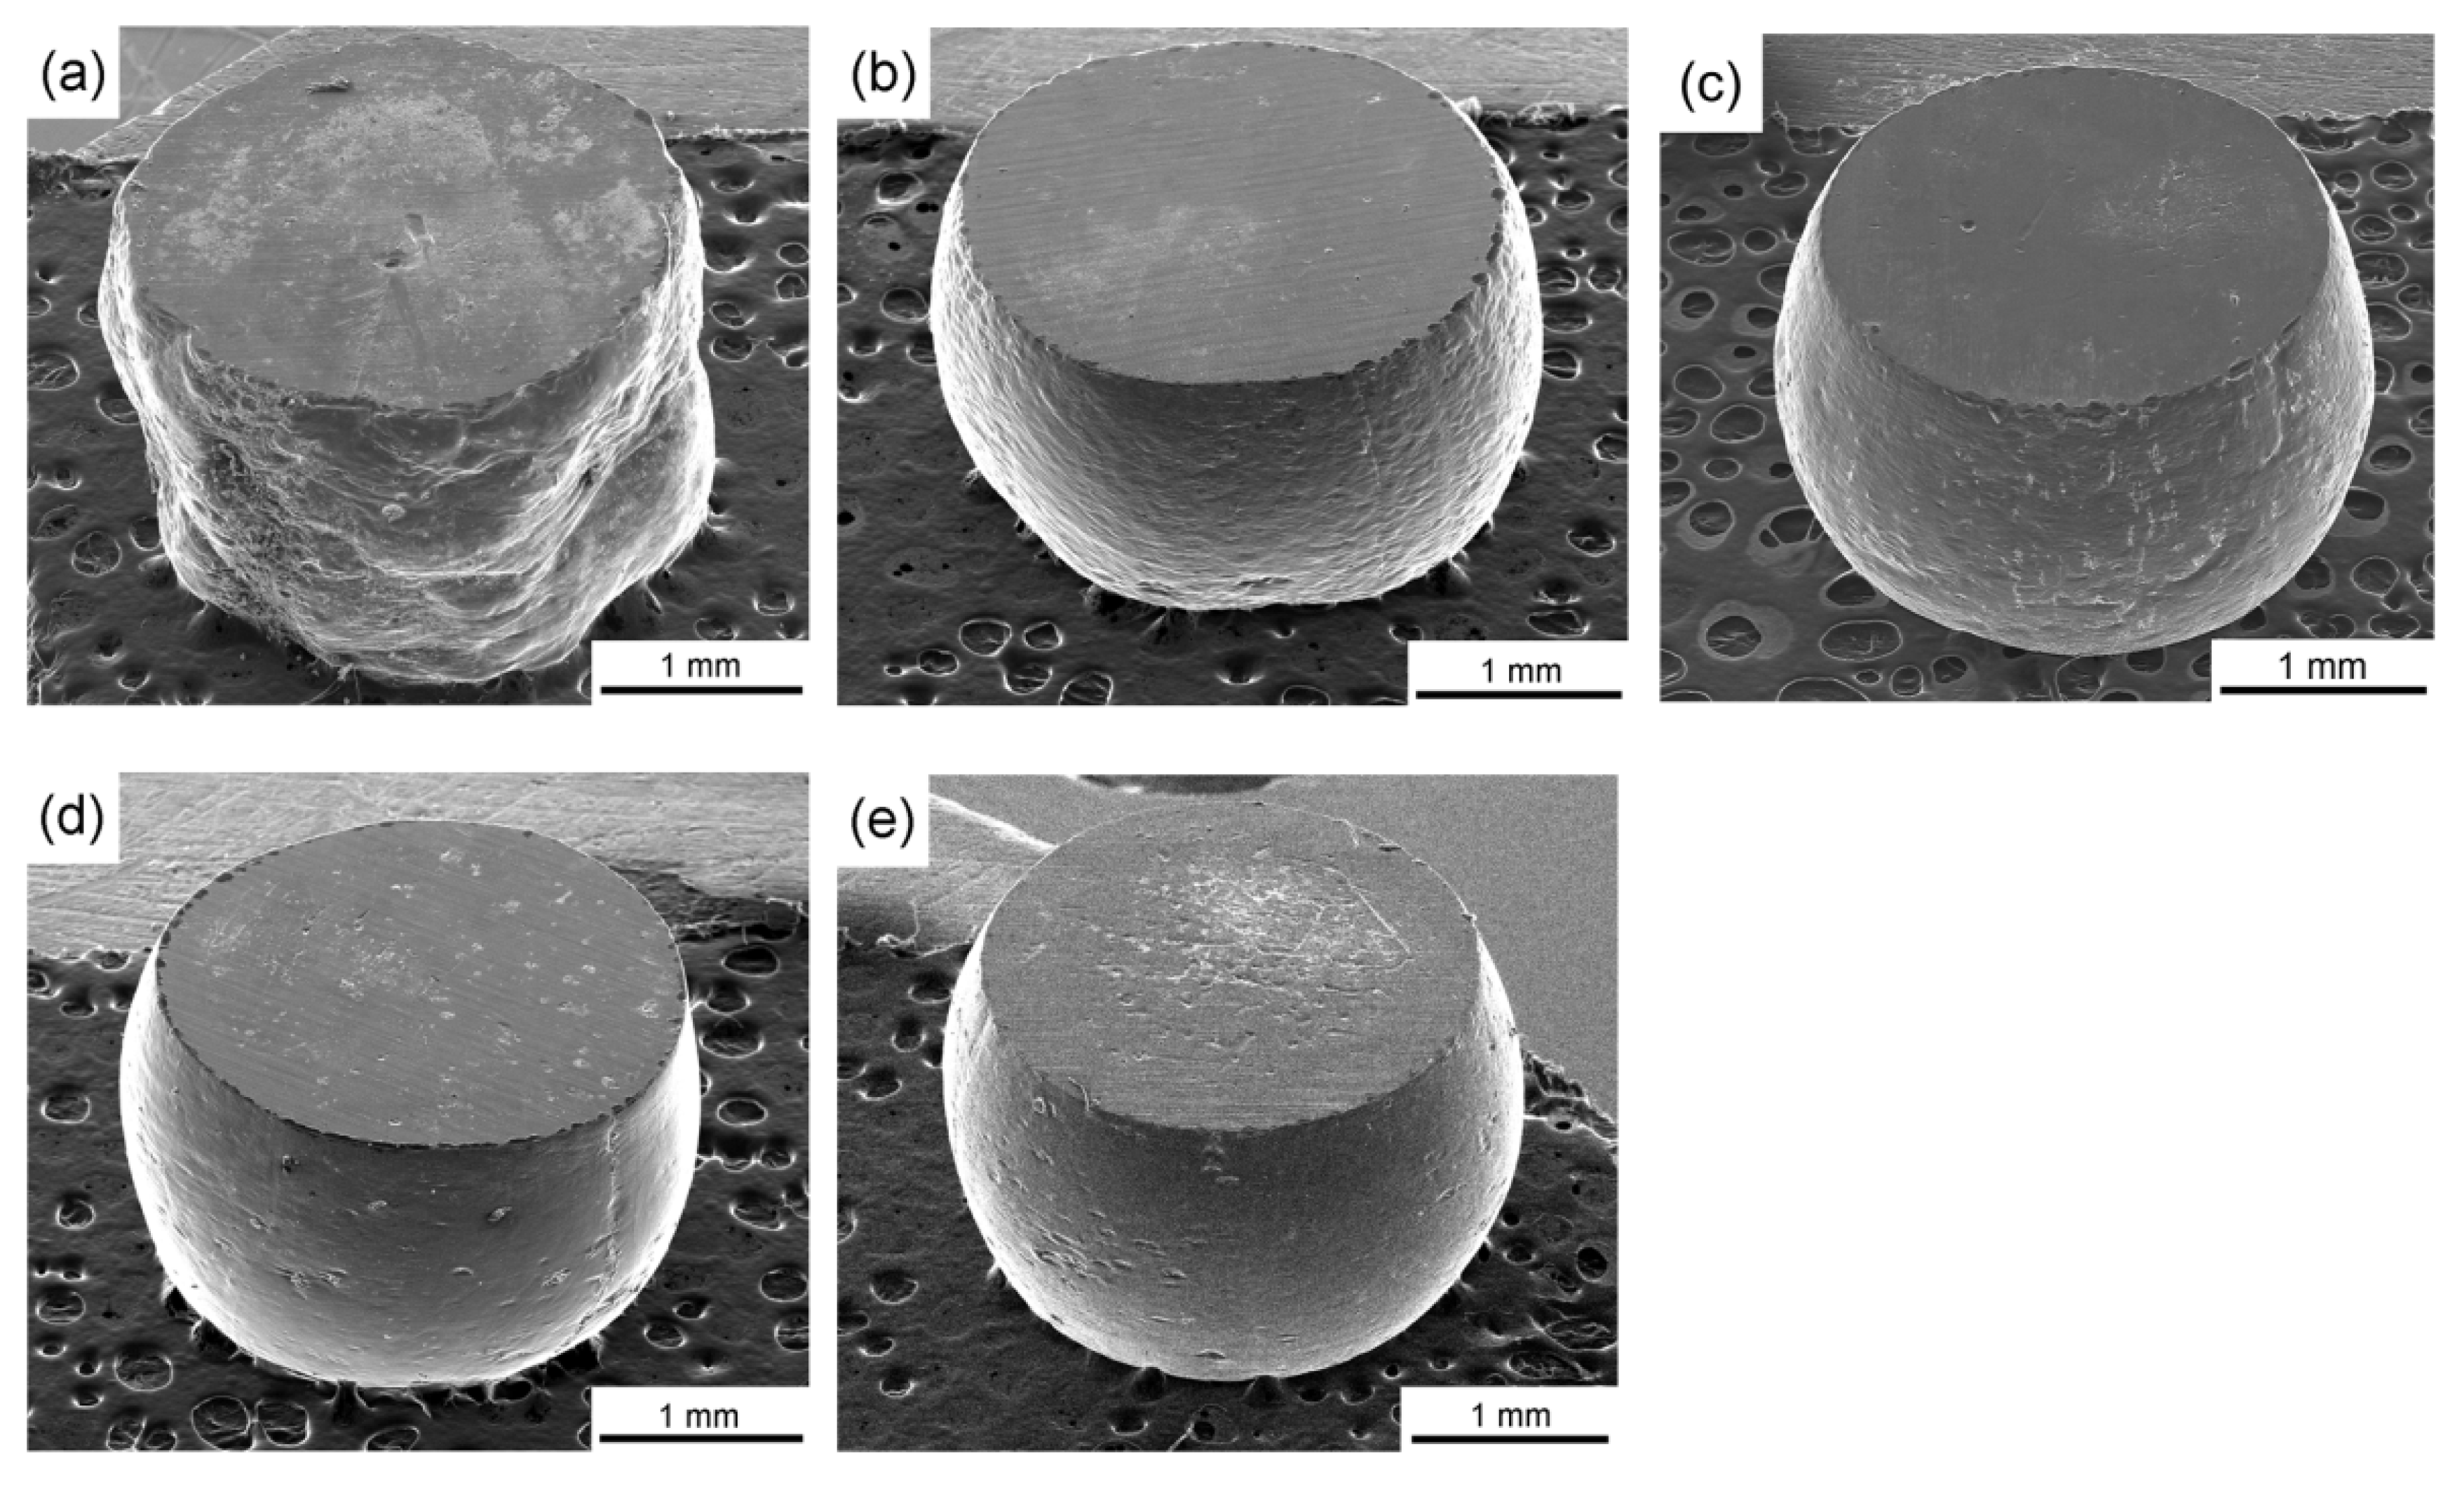
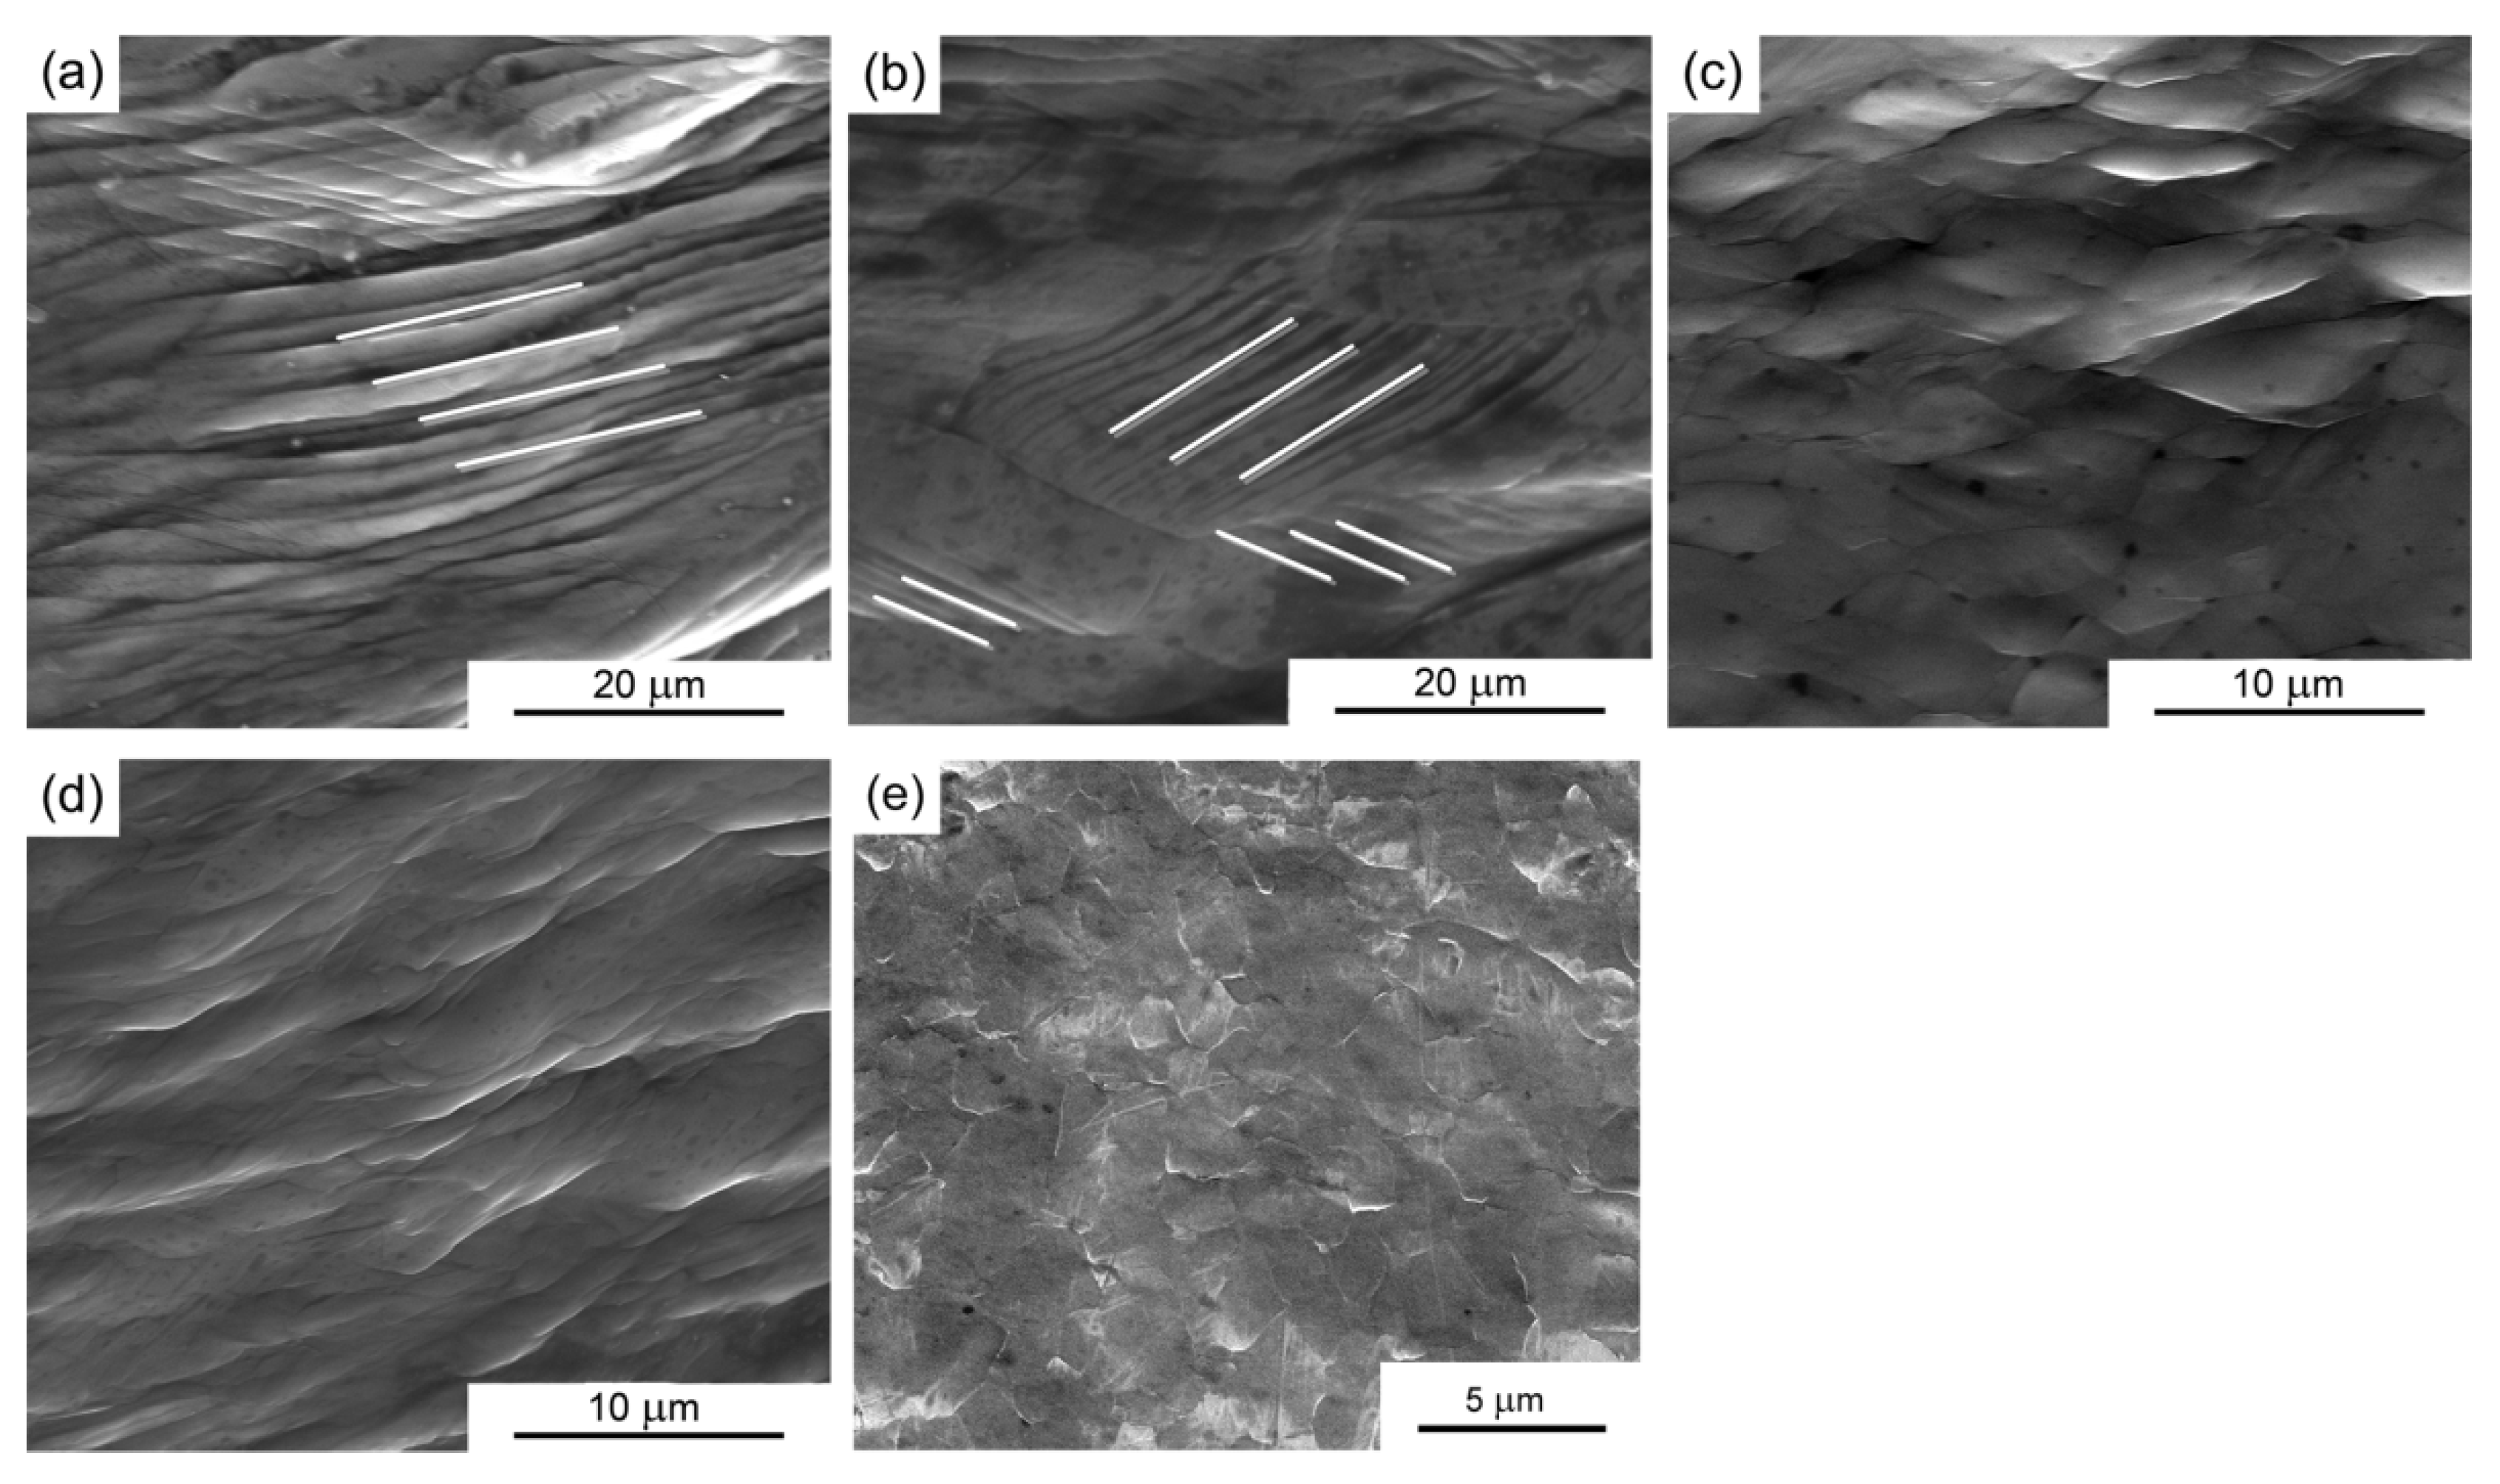
3.2. Surface Topography after Micro-Compression in Pure Al

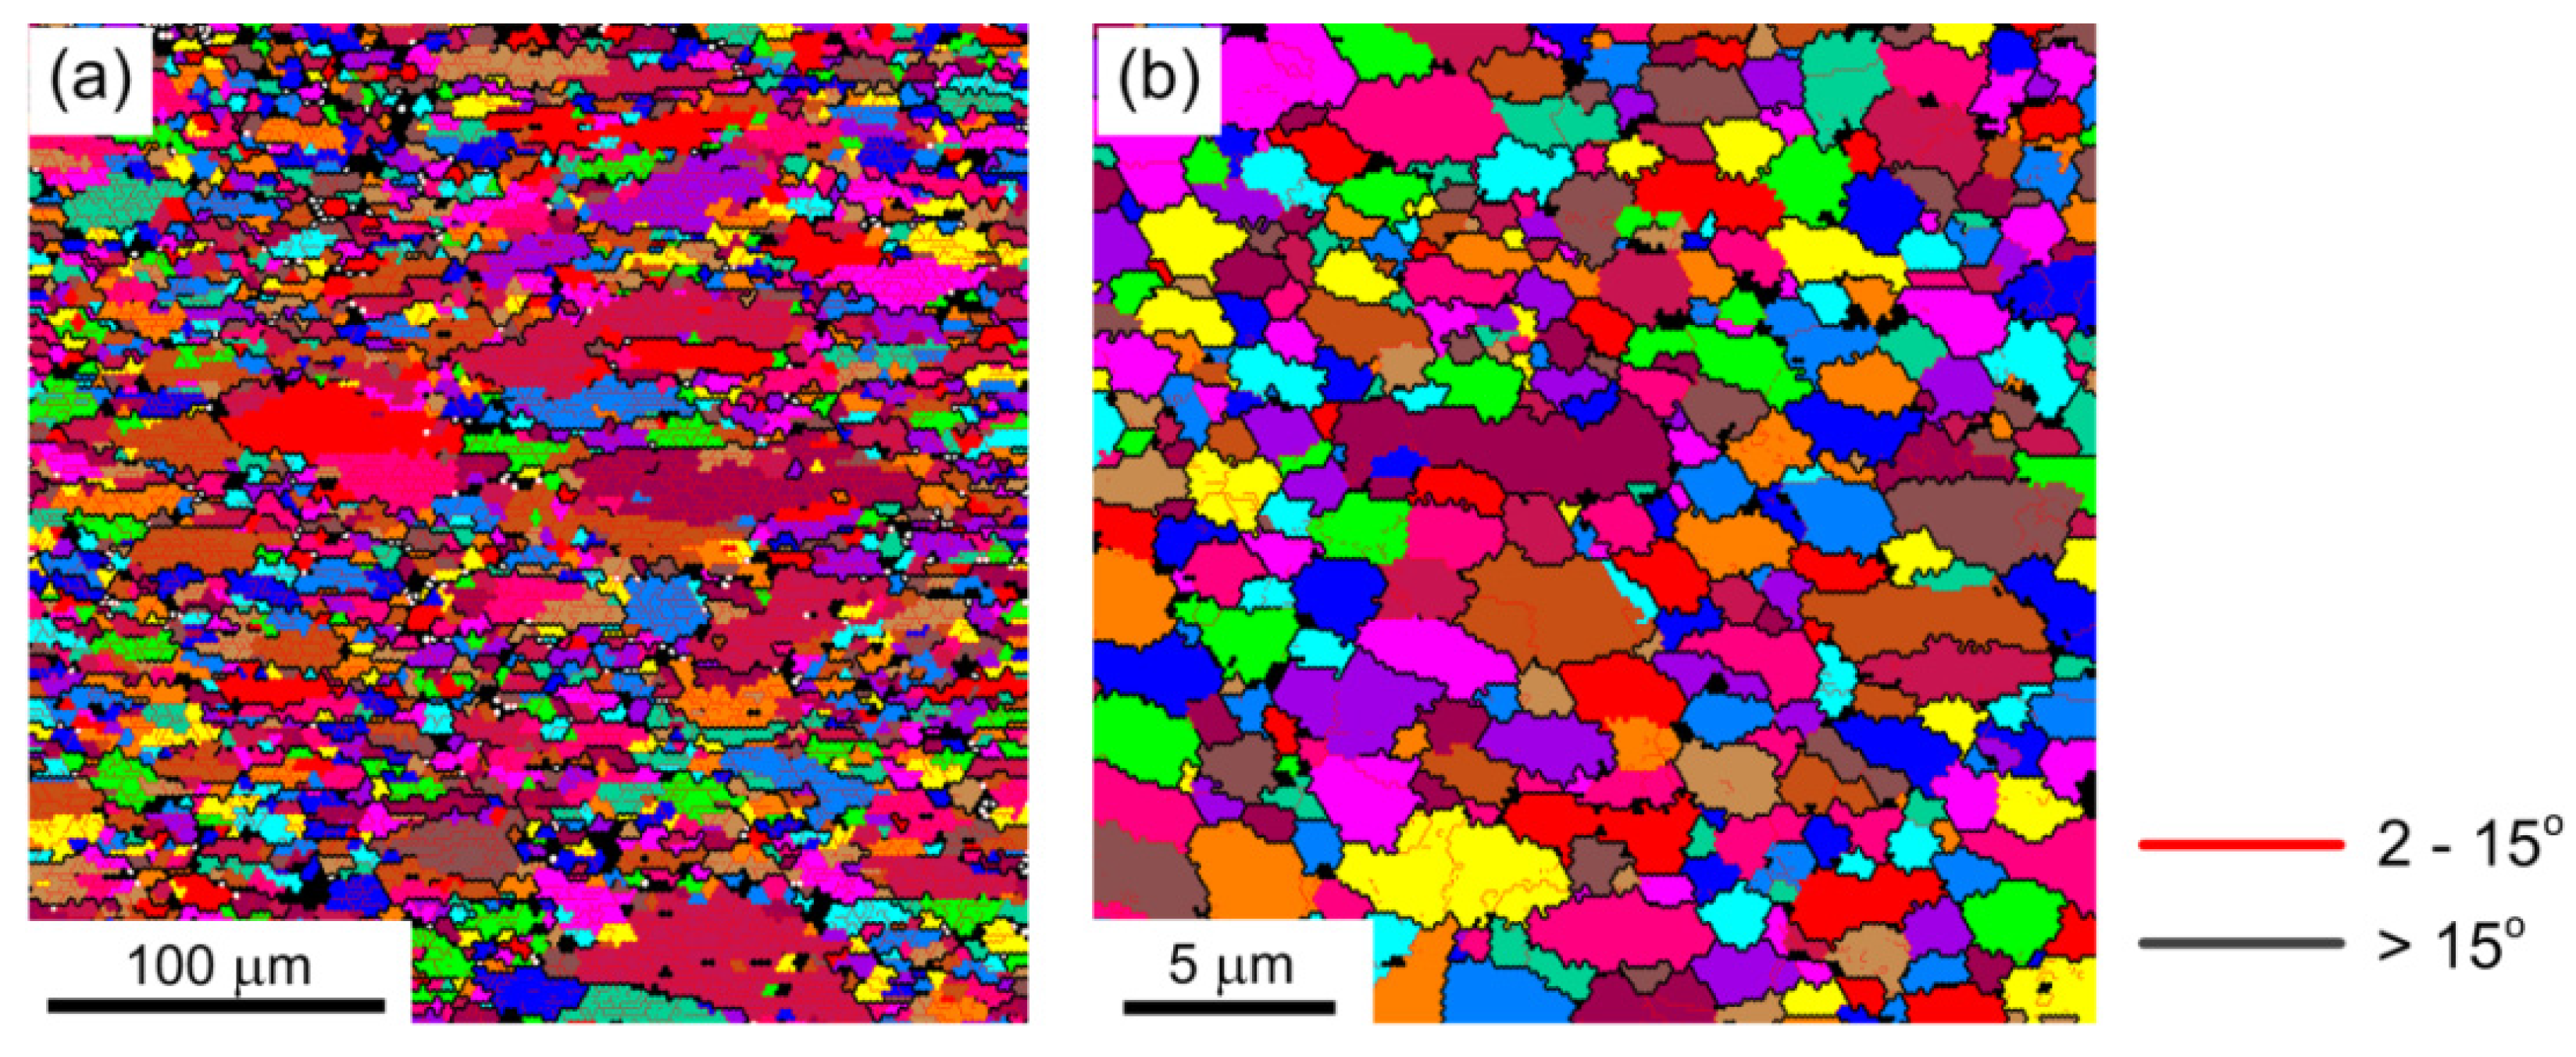
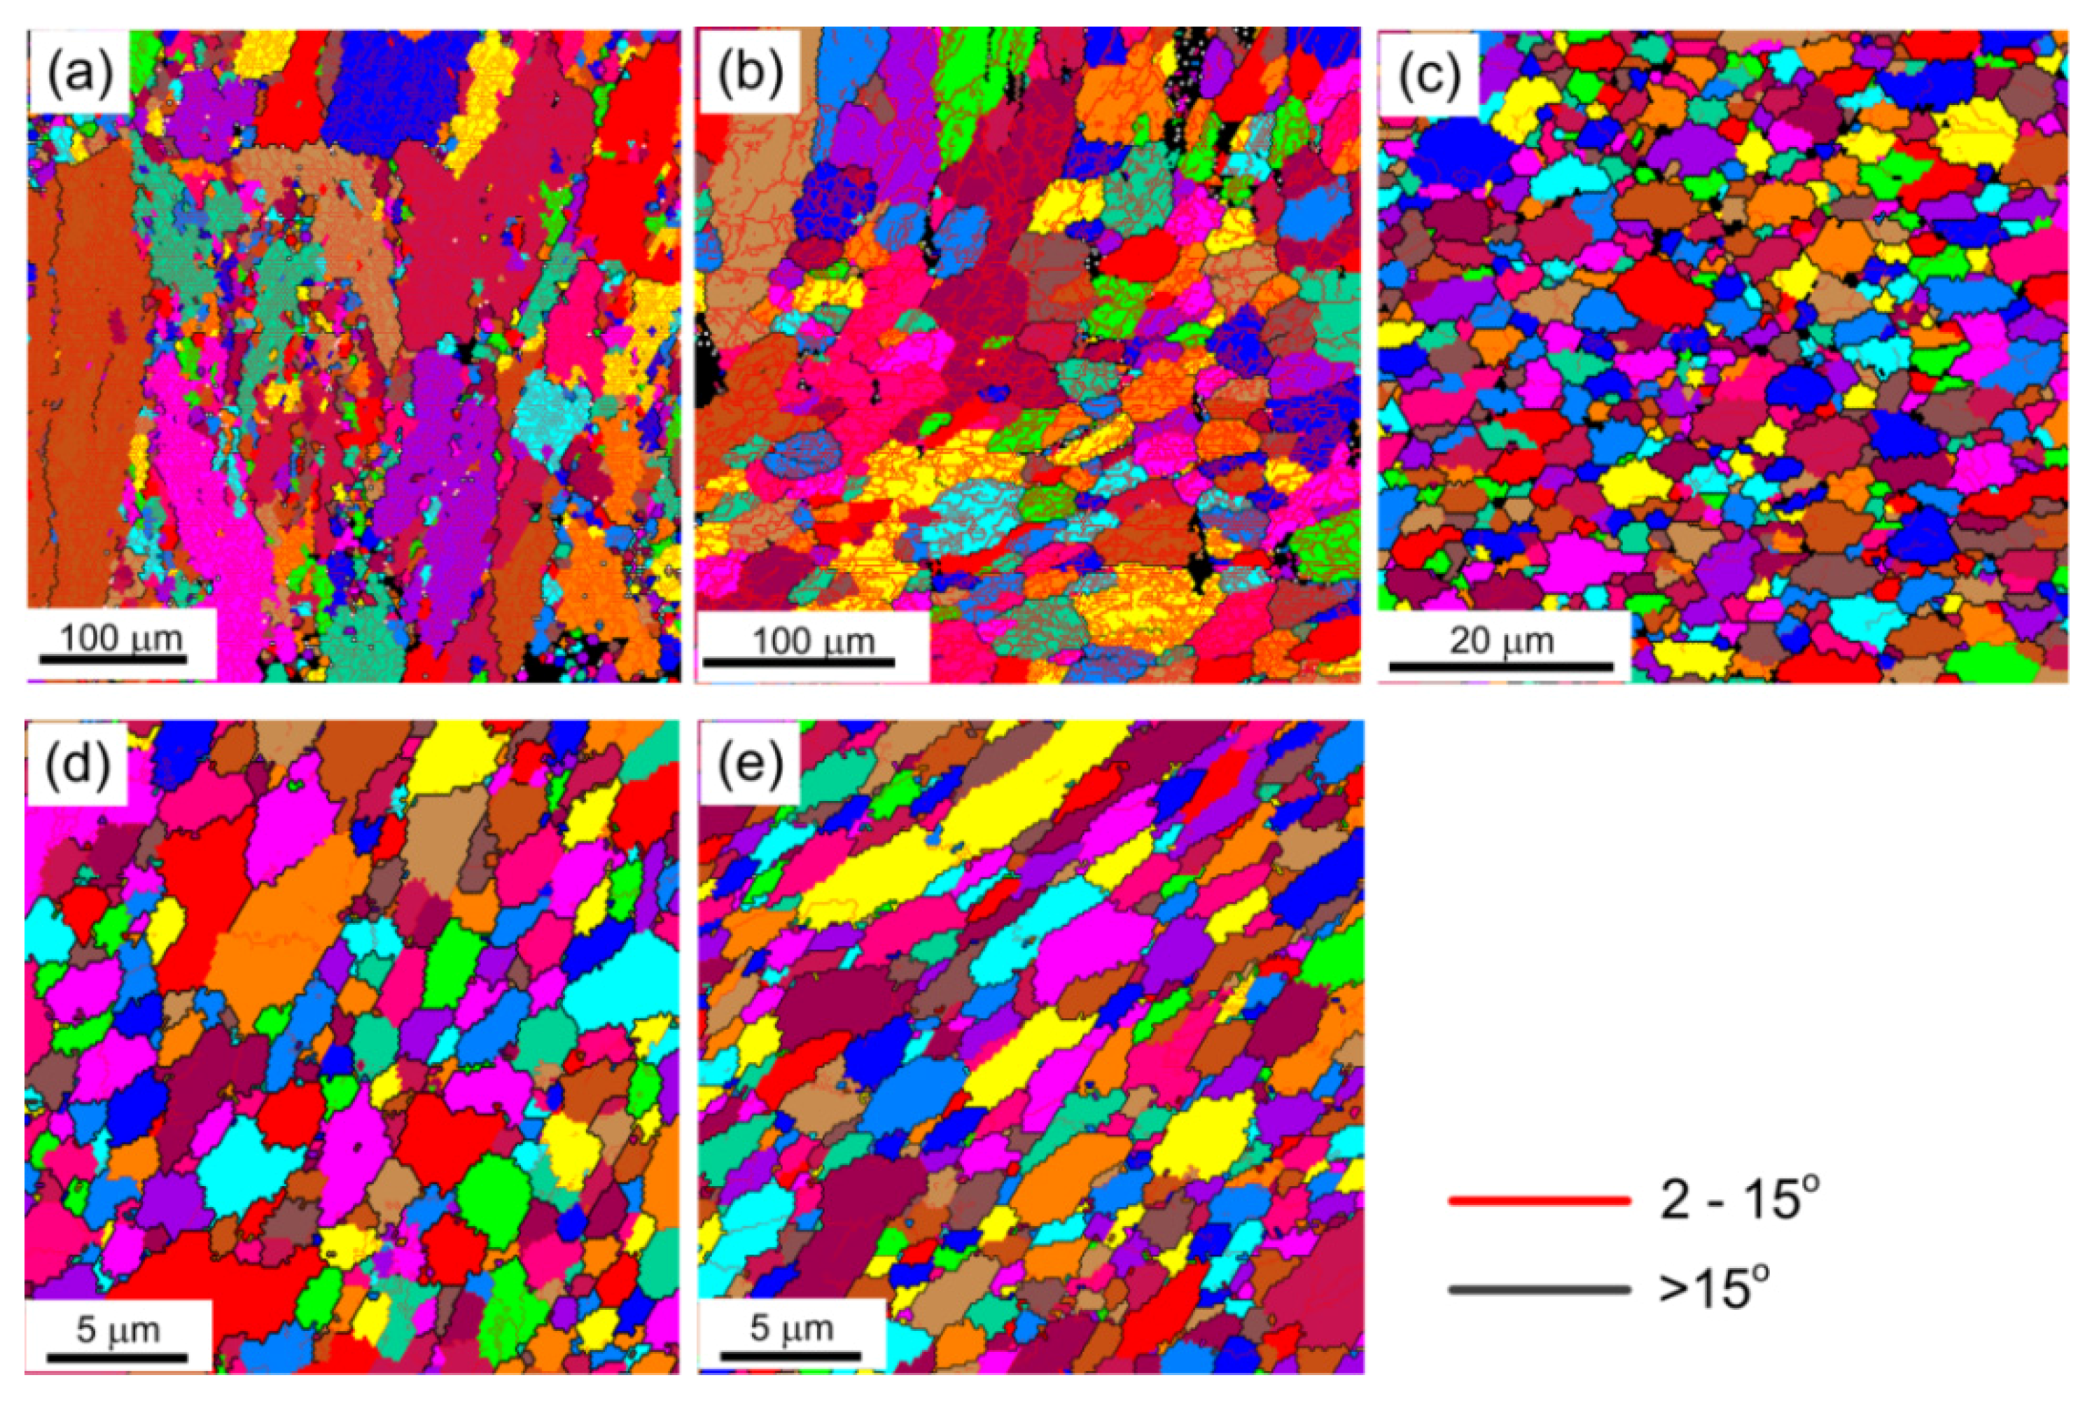
3.3. EBSD Evaluation of Microstructure after Micro-Compression in Pure Al
3.3.1. Grain Size
| Grain Size (µm) | Fraction of LAGBs (%) | Fraction of HAGBs (%) | ||
|---|---|---|---|---|
| Original Sample | After Compression | Original Sample | After Compression | |
| ~150 | 29.0 | 83.2 | 71.0 | 16.8 |
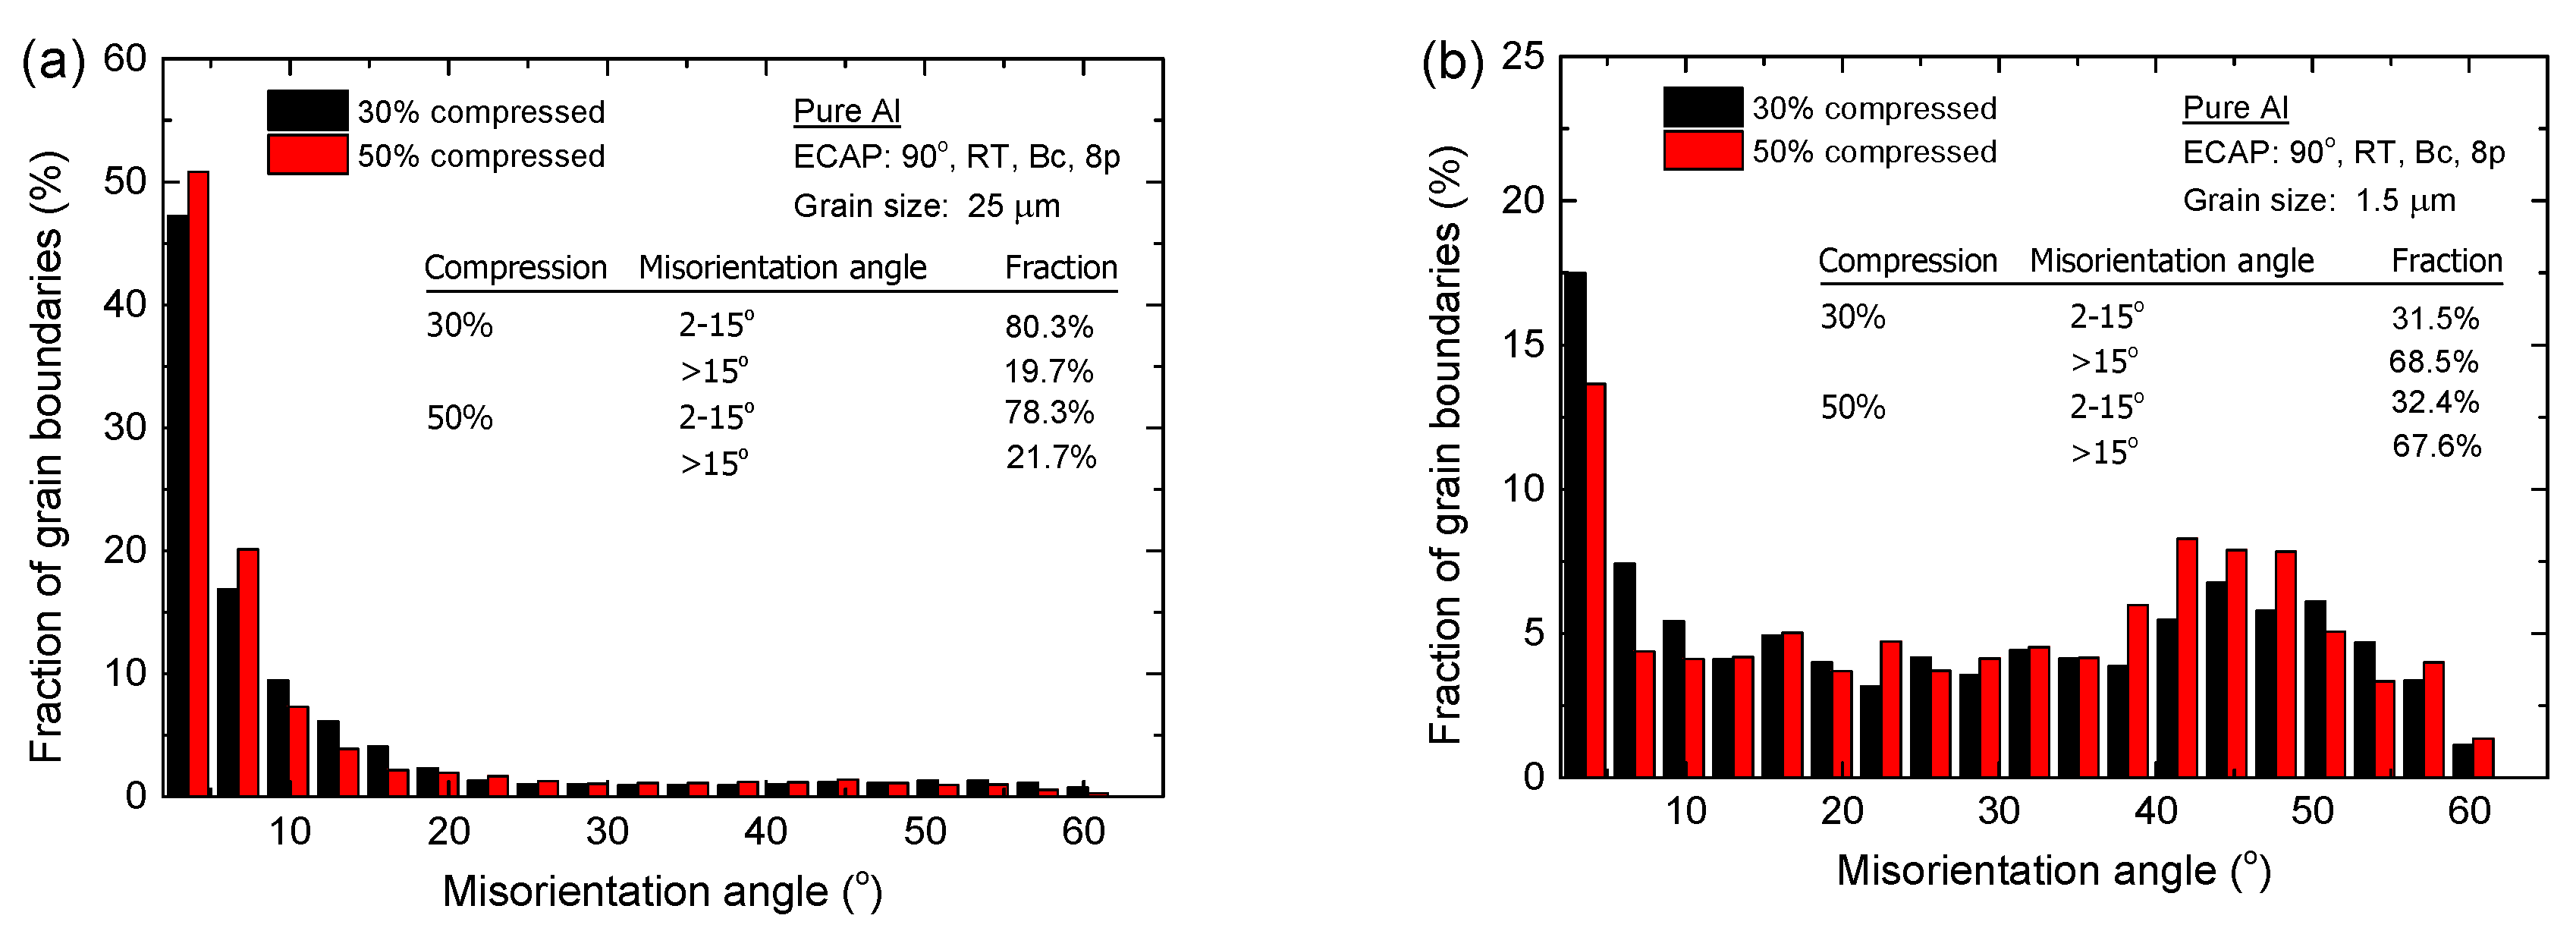
| ~25 | 52.0 | 80.3 | 48.0 | 19.7 |
| ~4.0 | 31.7 | 38.1 | 68.3 | 61.9 |
| ~1.5 | 28.2 | 31.5 | 71.8 | 68.5 |
| ~1.3 | 29.2 | 25.1 | 70.8 | 74.9 |
3.3.2. Compression Amount


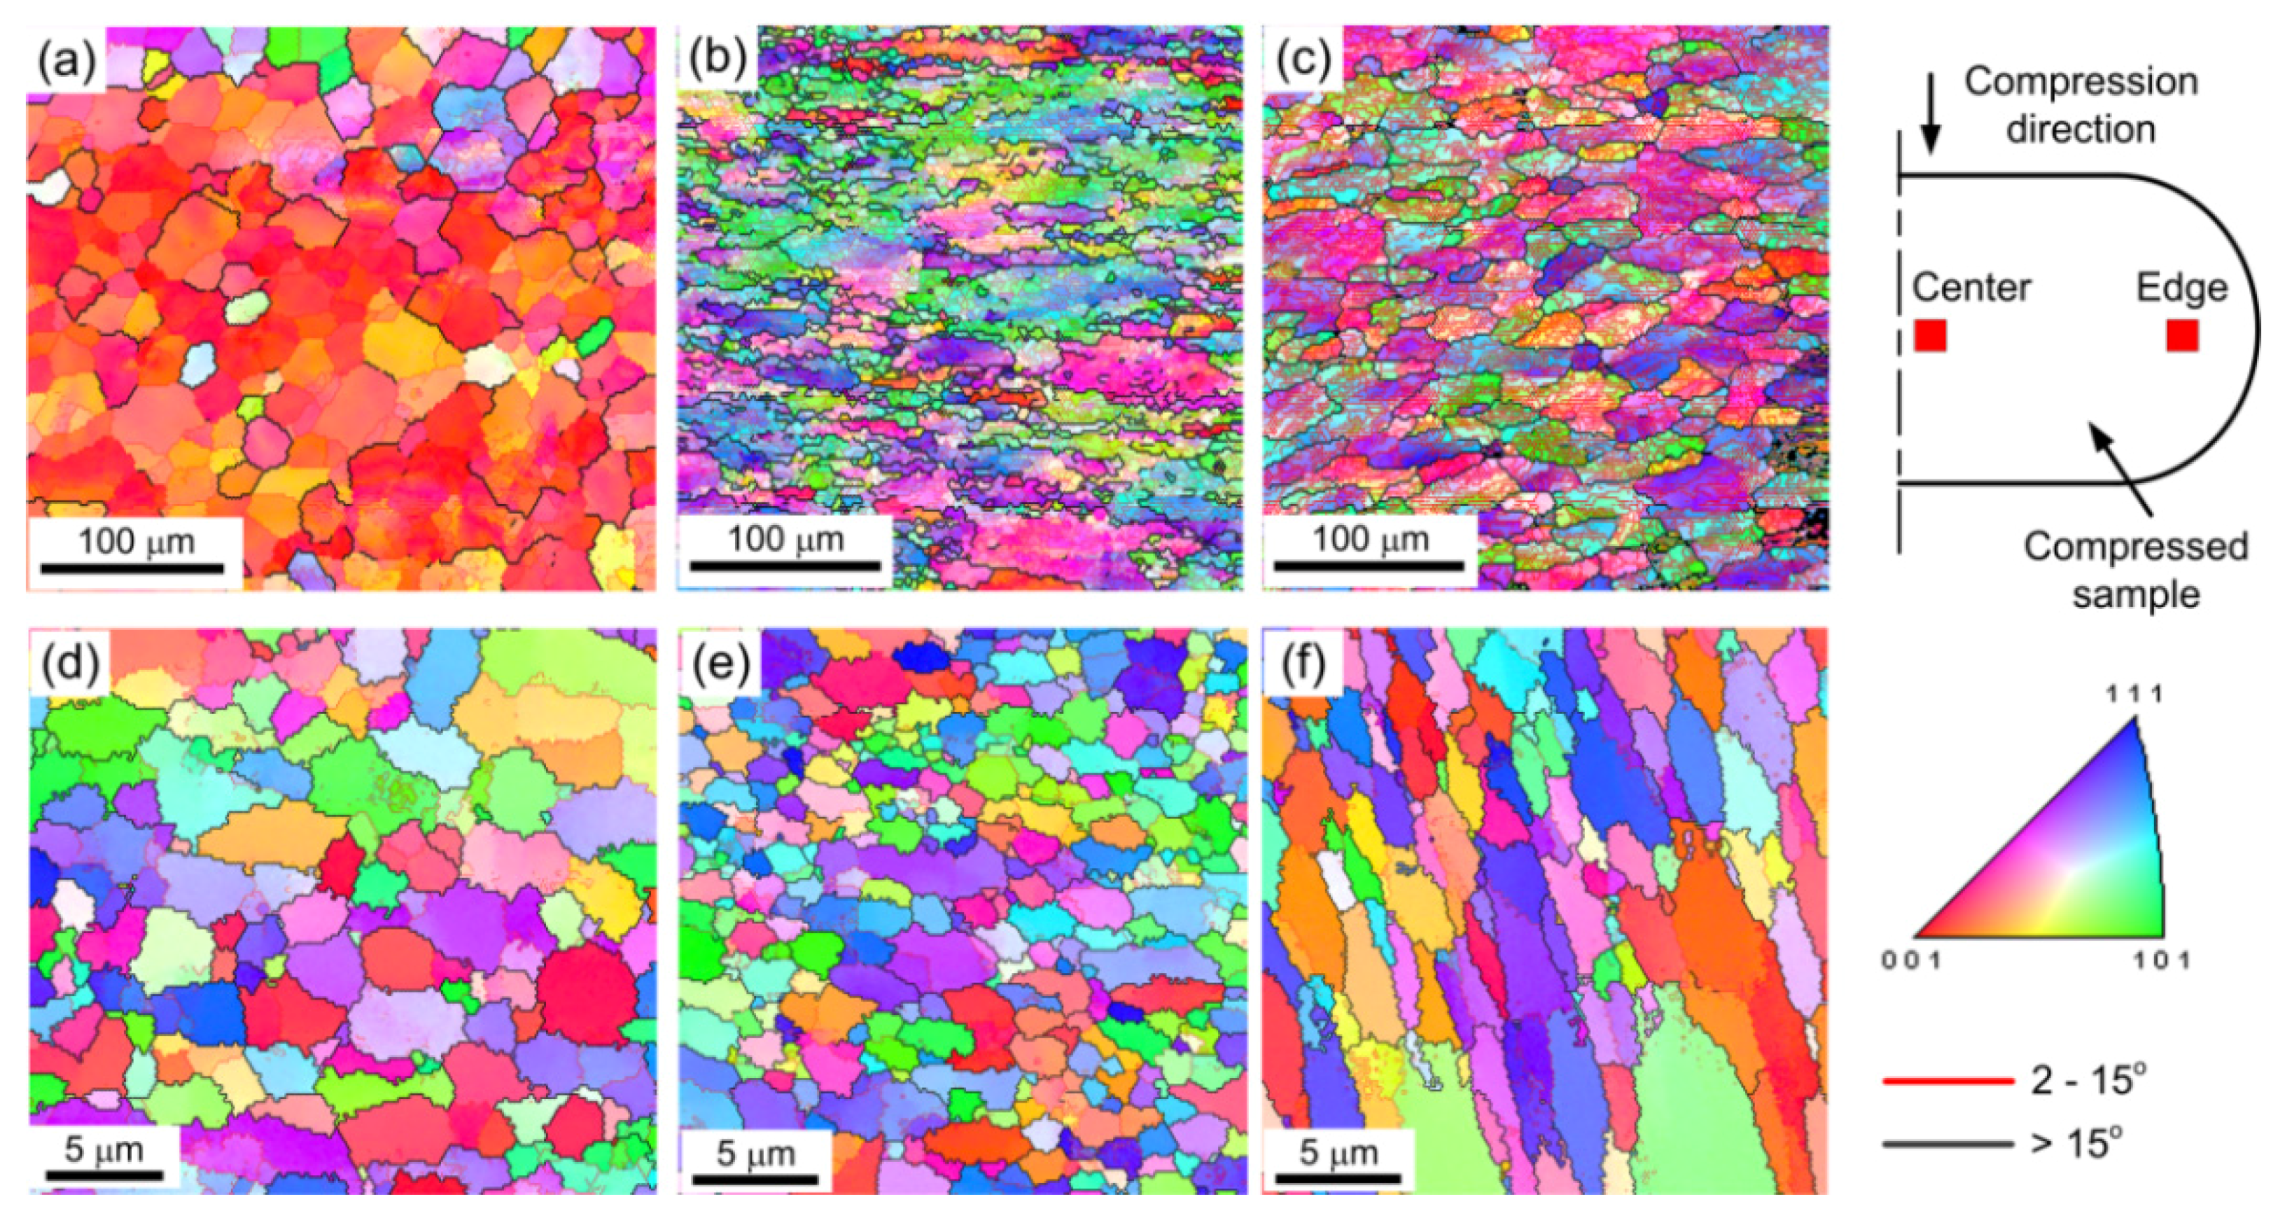
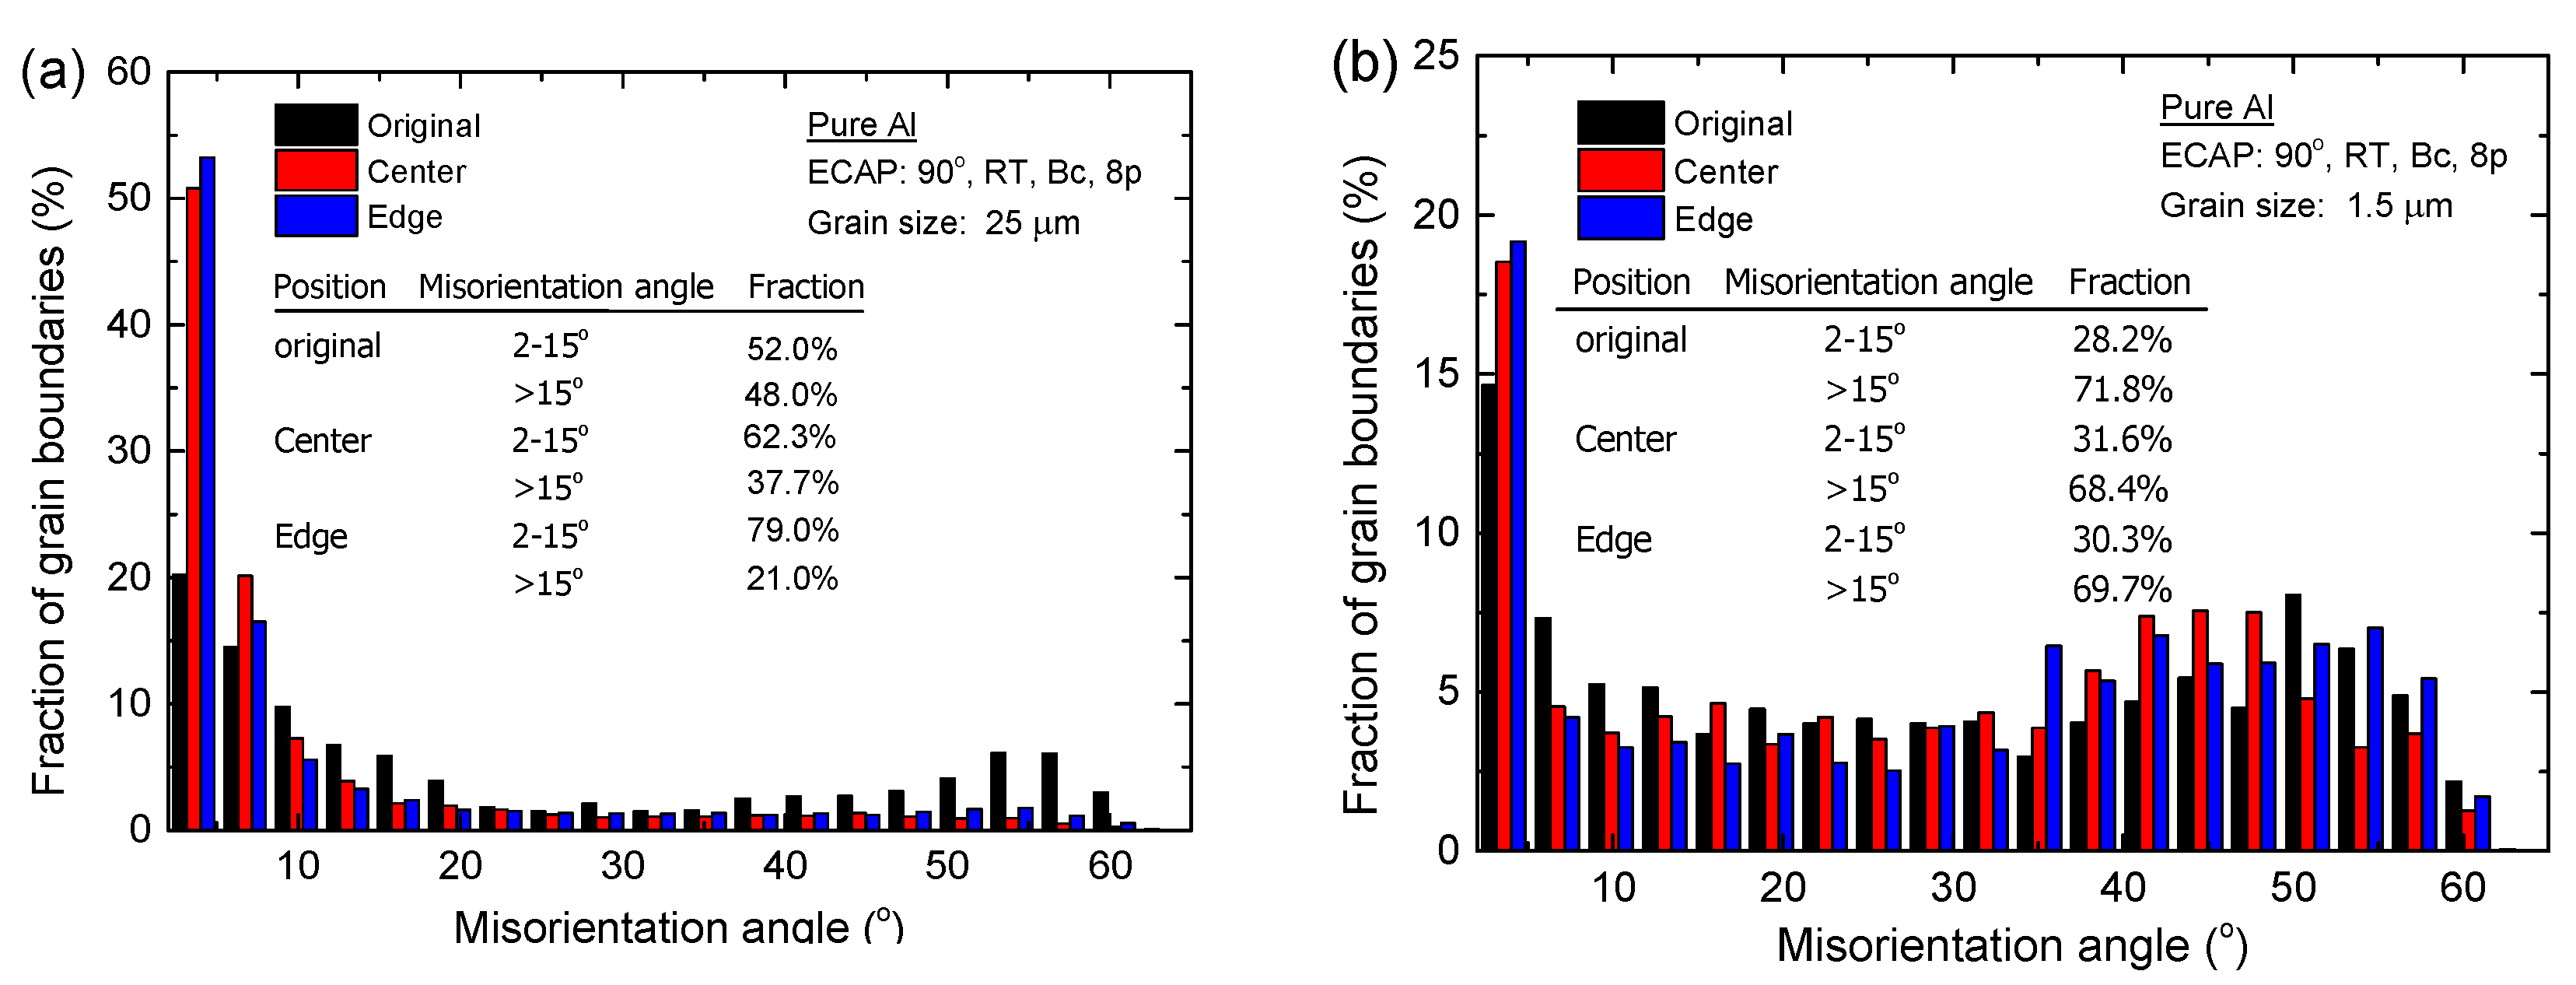
3.3.3. Deformed Region


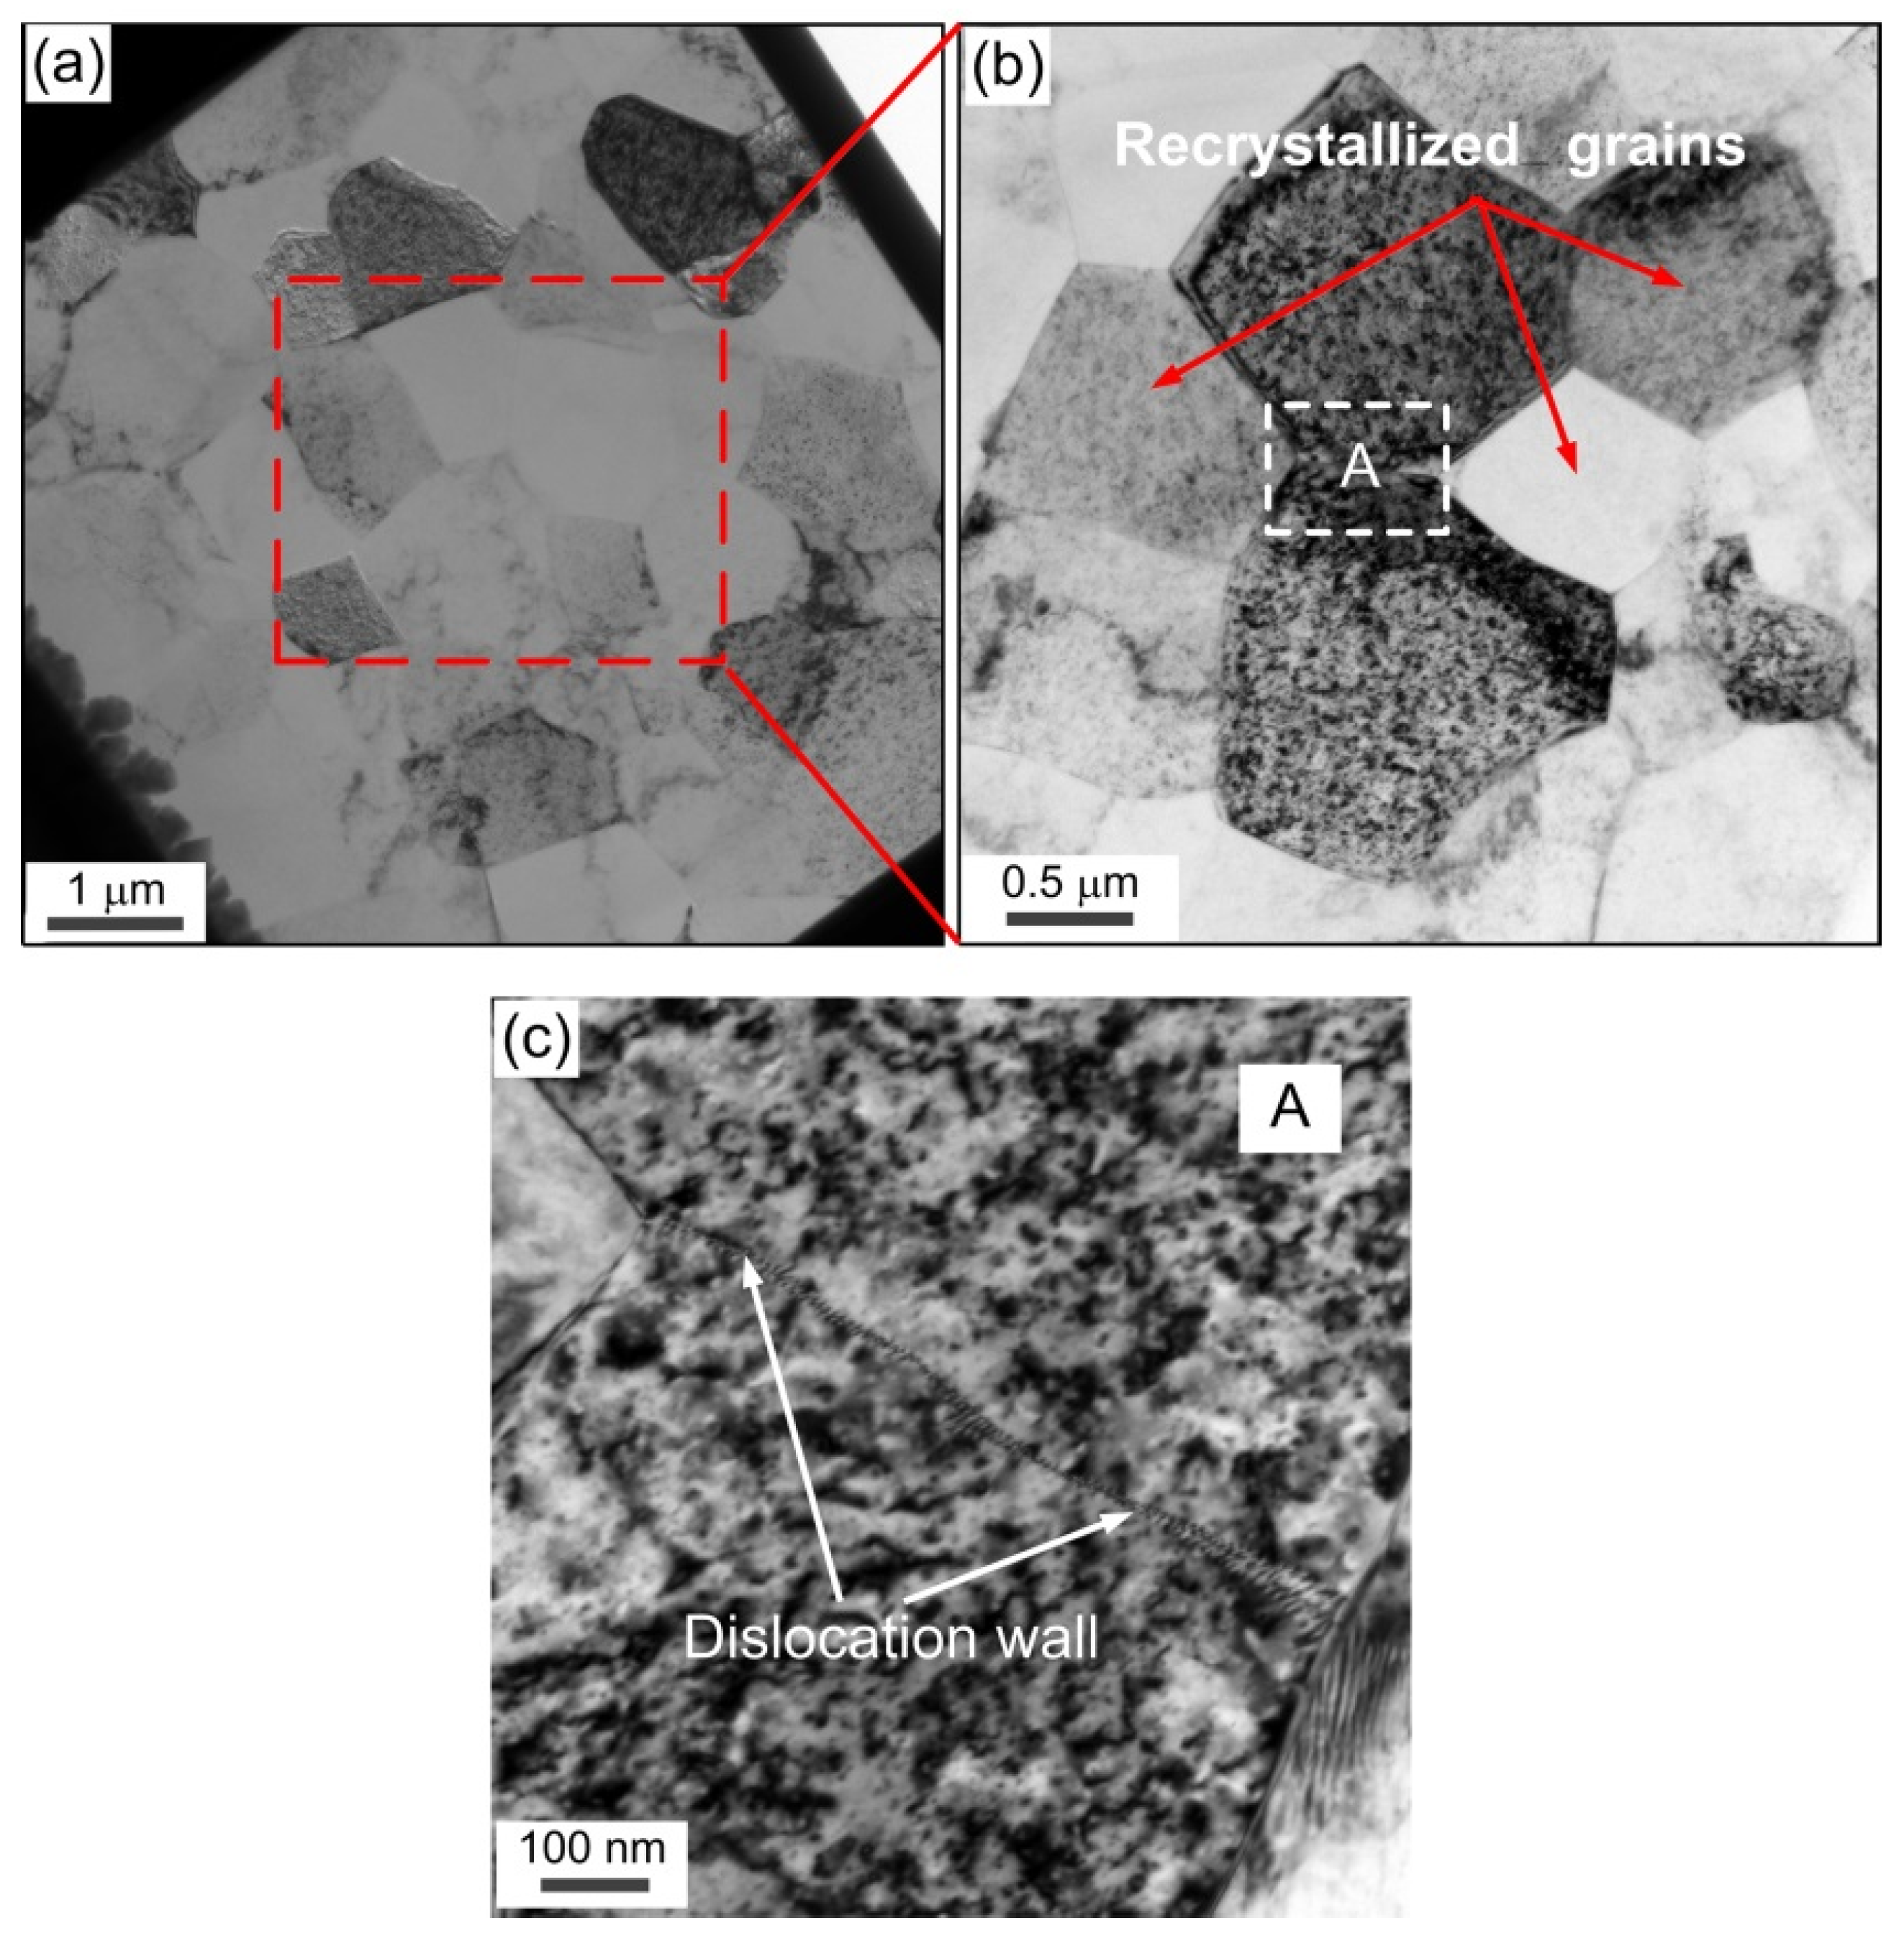
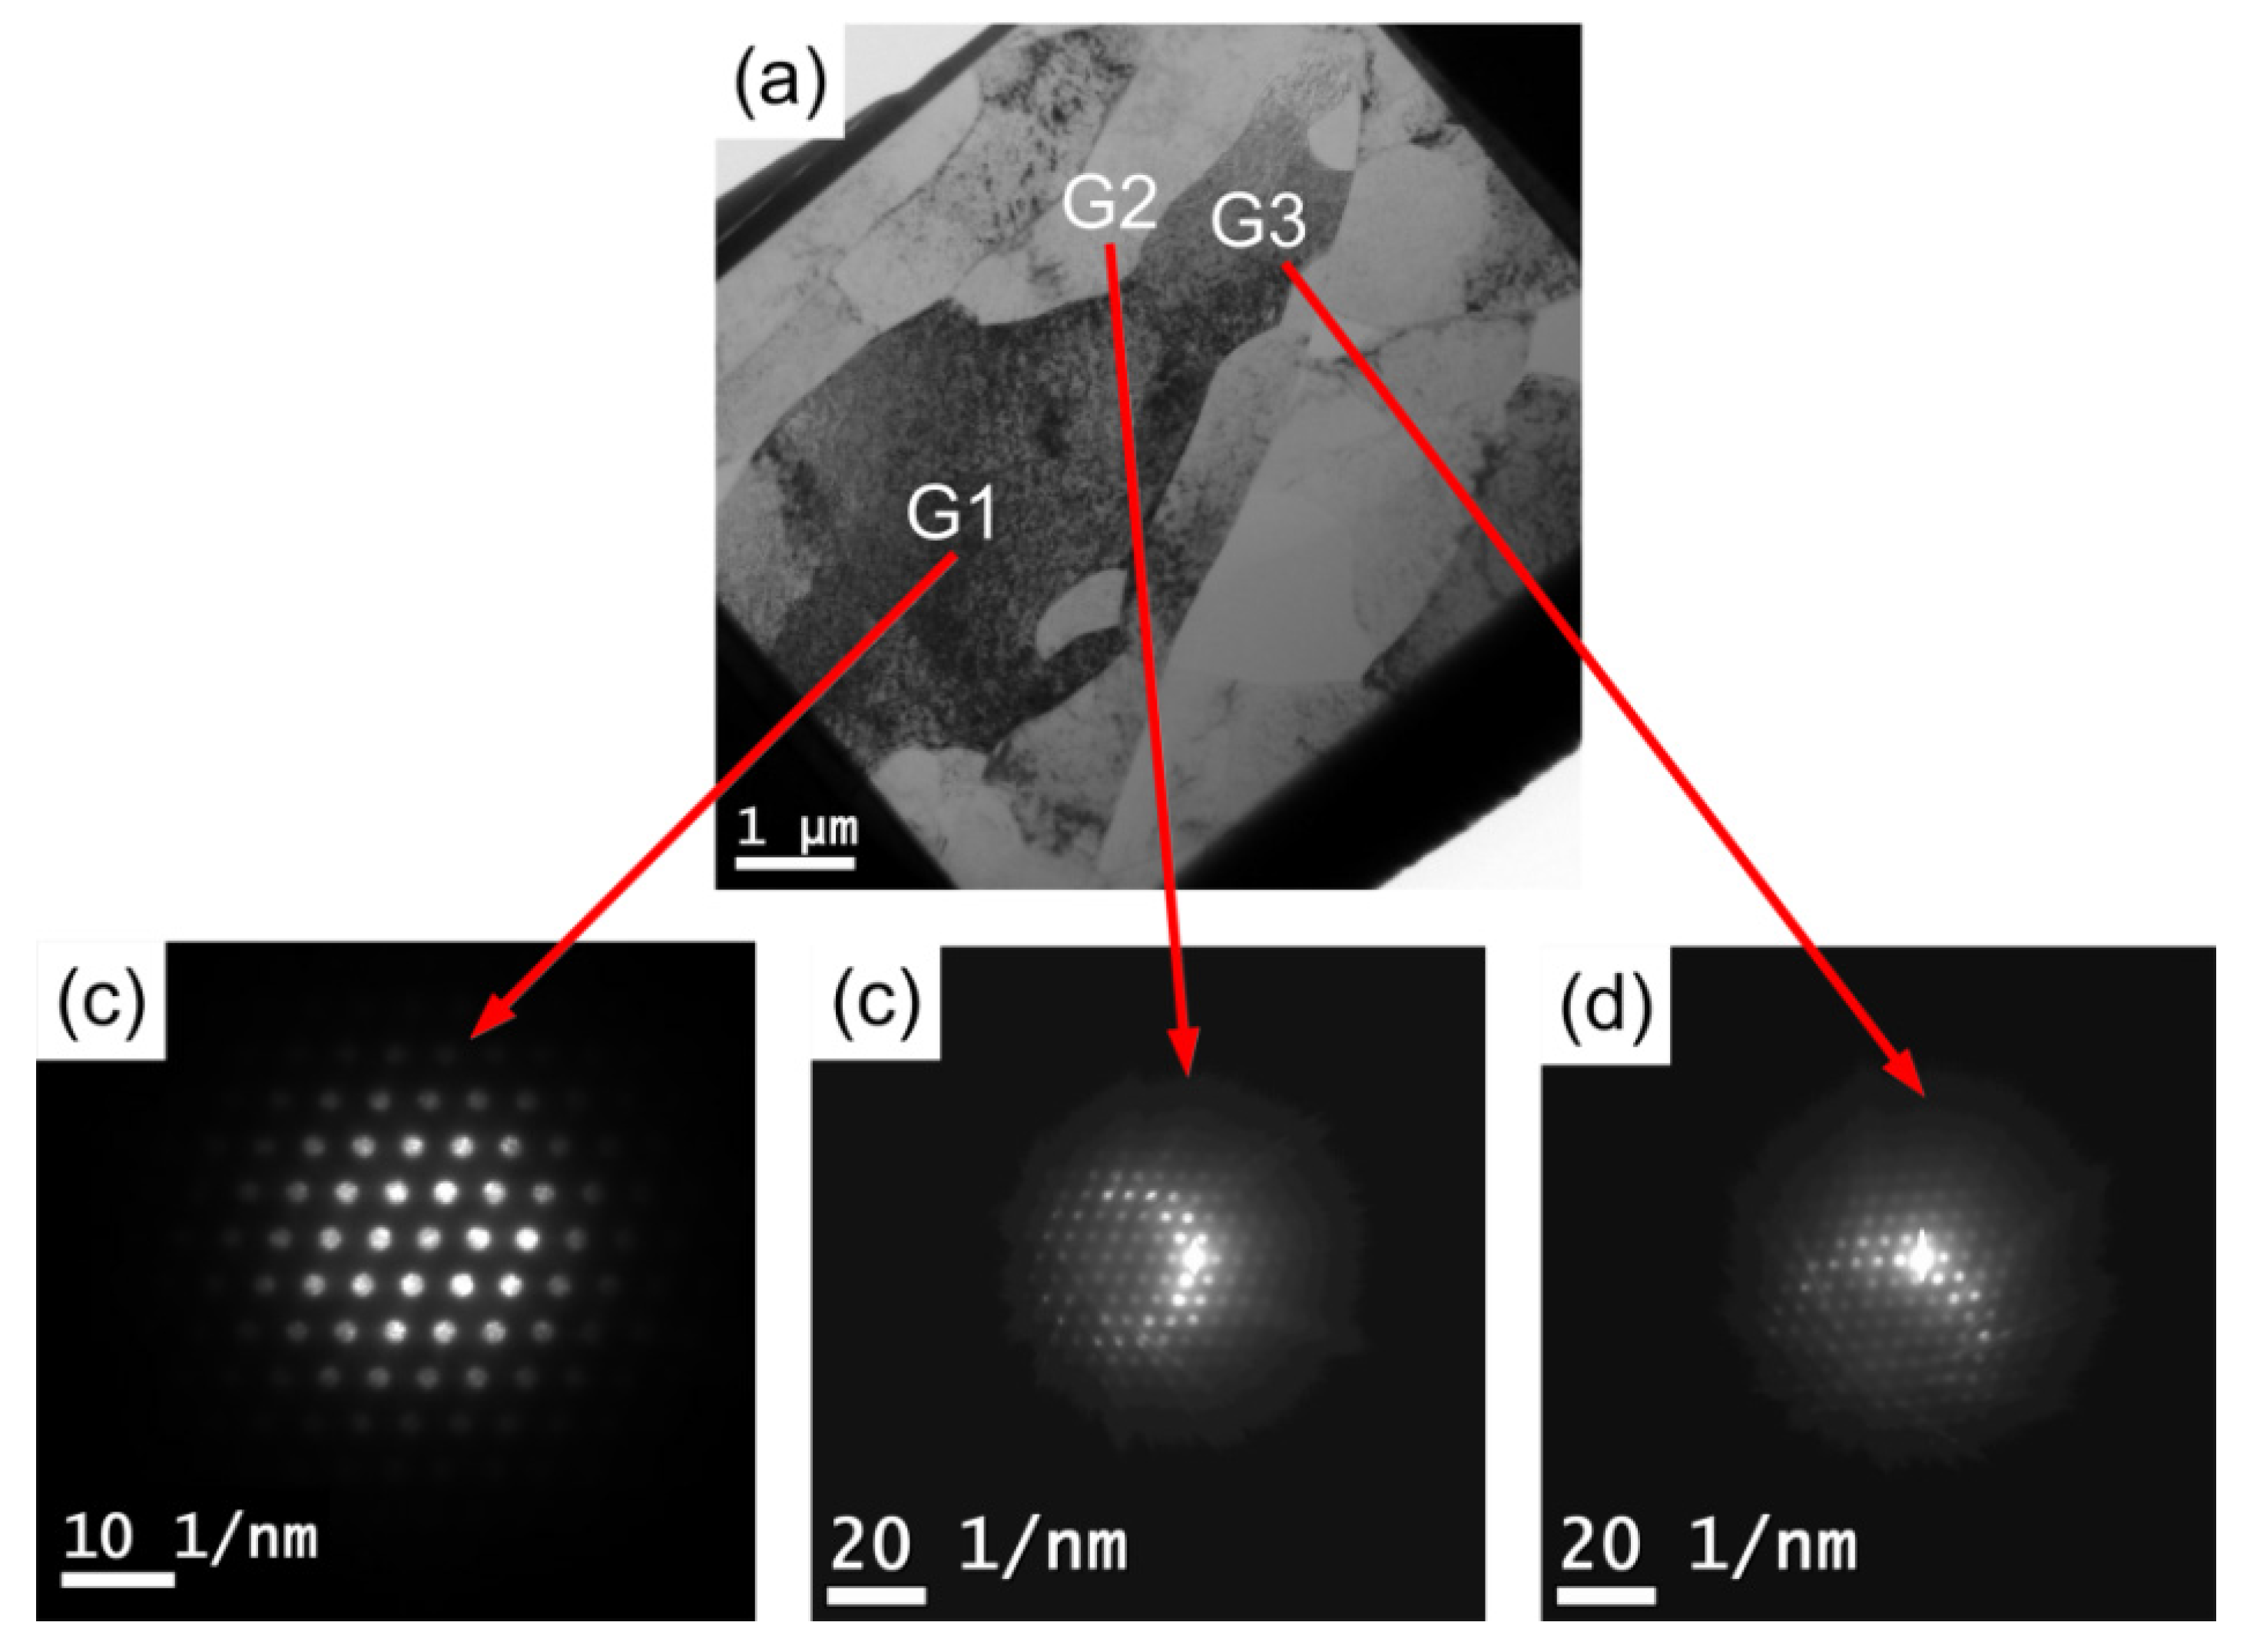
3.4. TEM Observation of Microstructure after Micro-Compression in Pure Al

4. Conclusions
Acknowledgments
Author Contributions
Conflicts of Interest
References
- Engel, U.; Eckstein, R. Microforming-from basic research to its realization. J. Mater. Process. Tech. 2002, 125–126, 35–44. [Google Scholar] [CrossRef]
- Zhang, Y.; Kong, X.Y.; Gao, L.; Tian, Y.; Wen, L.; Jiang, L. Fabrication of nanochannels. Materials 2015, 8, 6277–6308. [Google Scholar] [CrossRef]
- Fu, M.W.; Chan, W.L. A review on the state-of-the-art microforming technologies. Int. J. Adv. Manuf. Tech. 2013, 67, 2411–2437. [Google Scholar] [CrossRef]
- Xu, J.; Guo, B.; Shan, D.; Wang, C.; Li, J.; Liu, Y.; Qu, D. Development of a micro-forming system for micro-punching process of micro-hole arrays in brass foil. J. Mater. Process. Tech. 2012, 212, 2238–2246. [Google Scholar] [CrossRef]
- Wang, X.; Zhang, D.; Gu, C.; Shen, Z.; Liu, H. Research on the micro sheet stamping process using plasticine as soft punch. Materials 2014, 7, 4118–4131. [Google Scholar] [CrossRef]
- Geiger, M.; Kleiner, M.; Eckstein, R.; Tiesler, N.; Engel, U. Microforming. CIRP Ann. Manuf. Technol. 2001, 50, 445–462. [Google Scholar] [CrossRef]
- Vollertsen, F.; Biermann, D.; Hansen, H.N.; Jawahir, I.S.; Kuzman, K. Size effects in manufacturing of metallic components. CIRP Ann. Manuf. Technol. 2009, 58, 566–587. [Google Scholar] [CrossRef]
- Chan, W.L.; Fu, M.W.; Lu, J.; Liu, J.G. Modeling of grain size effect on micro deformation behavior in micro-forming of pure copper. Mater. Sci. Eng. A 2010, 527, 6638–6648. [Google Scholar] [CrossRef]
- Fu, M.W.; Chan, W.L. Geometry and grain size effects on the fracture behavior of sheet metal in micro-scale plastic deformation. Mater. Des. 2011, 32, 4738–4746. [Google Scholar] [CrossRef]
- Keller, C.; Hug, E.; Feaugas, X. Microstructural size effects on mechanical properties of high purity nickel. Int. J. Plast. 2011, 27, 635–654. [Google Scholar] [CrossRef]
- Ghassemali, E.; Tan, M.J.; Wah, C.B.; Lim, S.C.V.; Jarfors, A.E.W. Effect of cold-work on the Hall–Petch breakdown in copper based micro-components. Mech. Mater. 2015, 80, 124–135. [Google Scholar] [CrossRef]
- Wang, C.; Wang, C.; Xu, J.; Zhang, P.; Shan, D.; Guo, B. Plastic deformation size effects in micro-compression of pure nickel with a few grains across diameter. Mater. Sci. Eng. A 2015, 636, 352–360. [Google Scholar] [CrossRef]
- Zhang, H.; Dong, X. Physically based crystal plasticity FEM including geometrically necessary dislocations: numerical implementation and applications in micro-forming. Comput. Mater. Sci. 2015, 110, 308–320. [Google Scholar] [CrossRef]
- Ran, J.Q.; Fu, M.W.; Chan, W.L. The influence of size effect on the ductile fracture in micro-scaled plastic deformation. Int. J. Plast. 2013, 41, 65–81. [Google Scholar] [CrossRef]
- Ran, J.Q.; Fu, M.W. A hybrid model for analysis of ductile fracture in micro-scaled plastic deformation of multiphase alloys. Int. J. Plast. 2014, 61, 1–16. [Google Scholar] [CrossRef]
- Valiev, R.Z.; Langdon, T.G. Principles of equal-channel angular pressing as a processing tool for grain refinement. Prog. Mater. Sci. 2006, 51, 881–981. [Google Scholar] [CrossRef]
- Zhilyaev, A.P.; Langdon, T.G. Using high-pressure torsion for metal processing: Fundamentals and applications. Prog. Mater. Sci. 2008, 53, 893–979. [Google Scholar] [CrossRef]
- Kwan, C.C.F.; Wang, Z. Cyclic deformation of ultra-fine grained commercial purity aluminum processed by accumulative roll-bonding. Materials 2013, 6, 3469–3481. [Google Scholar] [CrossRef]
- Kim, W.J.; Sa, Y.K. Micro-extrusion of ECAP processed magnesium alloy for production of high strength magnesium micro-gears. Scripta Mater. 2006, 54, 1391–1395. [Google Scholar] [CrossRef]
- Ma, X.; Lapovok, R.; Gu, C.; Molotnikov, A.; Estrin, Y.; Pereloma, E.V.; Davies, C.H.J.; Hodgson, P.D. Deep drawing behaviour of ultrafine grained copper: modelling and experiment. J. Mater. Sci. 2009, 44, 3807–3812. [Google Scholar] [CrossRef]
- Xu, J.; Zhu, X.; Shi, L.; Shan, D.; Guo, B.; Langdon, T.G. Micro-forming using ultrafine-grained aluminum processed by equal-channel angular pressing. Adv. Eng. Mater. 2015, 17, 1022–1033. [Google Scholar] [CrossRef]
- Xu, J.; Shi, L.; Wang, C.; Shan, D.; Guo, B. Micro hot embossing of micro-array channels in ultrafine-grained pure aluminum using a silicon die. J. Mater. Process. Technol. 2015, 225, 375–384. [Google Scholar] [CrossRef]
- Yu, C.Y.; Sun, P.L.; Kao, P.W.; Chang, C.P. Mechanical properties of submicron-grained aluminum. Scripta Mater. 2005, 52, 359–363. [Google Scholar] [CrossRef]
- Le, G.M.; Godfrey, A.; Hansen, N.; Liu, W.; Winther, G.; Huang, X. Influence of grain size in the near-micrometre regime on the deformation microstructure in aluminium. Acta Mater. 2013, 61, 7072–7086. [Google Scholar] [CrossRef]
- Sabirov, I.; Barnett, M.R.; Estrin, Y.; Hodgson, P.D. The effect of strain rate on the deformation mechanisms and the strain rate sensitivity of an ultra-fine-grained Al alloy. Scripta Mater. 2009, 61, 181–184. [Google Scholar] [CrossRef]
- Wang, M.; Shan, A. Effect of strain rate on the tensile behavior of ultra-fine grained pure aluminum. J. Alloy. Compd. 2008, 455, L10–L14. [Google Scholar] [CrossRef]
- Xu, J.; Zhu, X.; Shan, D.; Guo, B.; Langdon, T.G. Effect of grain size and specimen dimensions on micro-forming of high purity aluminum. Mater. Sci. Eng. A 2015, 646, 207–217. [Google Scholar] [CrossRef]
- Okamoto, N.L.; Kashioka, D.; Hirato, T.; Inui, H. Specimen- and grain-size dependence of compression deformation behavior in nanocrystalline copper. Int. J. Plast. 2014, 56, 173–183. [Google Scholar] [CrossRef] [Green Version]
- Xu, J.; Wang, C.; Shan, D.; Guo, B.; Langdon, T.G. Micro-deformation behavior in micro-compression with high-purity aluminum processed by ECAP. Manuf. Rev. 2015, 2, 1–7. [Google Scholar] [CrossRef]
- Guo, B.; Gong, F.; Wang, C.; Shan, D. Flow stress and tribology size effects in scaled down cylinder compression. Trans. Nonferr. Metal. Soc. 2009, 19, 516–520. [Google Scholar] [CrossRef]
- Chan, W.L.; Fu, M.W.; Yang, B. Experimental studies of the size effect affected microscale plastic deformation in micro upsetting process. Mater. Sci. Eng. A 2012, 534, 374–383. [Google Scholar] [CrossRef]
- Hansen, N. Hall–Petch relation and boundary strengthening. Scripta Mater. 2004, 51, 801–806. [Google Scholar] [CrossRef]
- Meng, B.; Fu, M.W. Size effect on deformation behavior and ductile fracture in microforming of pure copper sheets considering free surface roughening. Mater. Des. 2015, 83, 400–412. [Google Scholar] [CrossRef]
- Inoue, T.; Horita, Z.; Somekawa, H.; Ogawa, K. Effect of initial grain sizes on hardness variation and strain distribution of pure aluminum severely deformed by compression tests. Acta Mater. 2008, 56, 6291–6303. [Google Scholar] [CrossRef]
© 2015 by the authors; licensee MDPI, Basel, Switzerland. This article is an open access article distributed under the terms and conditions of the Creative Commons by Attribution (CC-BY) license (http://creativecommons.org/licenses/by/4.0/).
Share and Cite
Xu, J.; Li, J.; Zhu, X.; Fan, G.; Shan, D.; Guo, B. Microstructural Evolution at Micro/Meso-Scale in an Ultrafine-Grained Pure Aluminum Processed by Equal-Channel Angular Pressing with Subsequent Annealing Treatment. Materials 2015, 8, 7447-7460. https://doi.org/10.3390/ma8115391
Xu J, Li J, Zhu X, Fan G, Shan D, Guo B. Microstructural Evolution at Micro/Meso-Scale in an Ultrafine-Grained Pure Aluminum Processed by Equal-Channel Angular Pressing with Subsequent Annealing Treatment. Materials. 2015; 8(11):7447-7460. https://doi.org/10.3390/ma8115391
Chicago/Turabian StyleXu, Jie, Jianwei Li, Xiaocheng Zhu, Guohua Fan, Debin Shan, and Bin Guo. 2015. "Microstructural Evolution at Micro/Meso-Scale in an Ultrafine-Grained Pure Aluminum Processed by Equal-Channel Angular Pressing with Subsequent Annealing Treatment" Materials 8, no. 11: 7447-7460. https://doi.org/10.3390/ma8115391