Article

Fatigue Life Prediction Based on Crack Closure and Equivalent Initial Flaw Size

Science and Technology on Reliability and Environmental Engineering Laboratory, School of Reliability and Systems Engineering, Beihang University, Beijing100191, China
*
Author to whom correspondence should be addressed.
Materials 2015, 8(10), 7145-7160; https://doi.org/10.3390/ma8105367
Submission received: 21 August 2015 / Revised: 2 October 2015 / Accepted: 13 October 2015 / Published: 21 October 2015

Abstract

:
Failure analysis and fatigue life prediction are necessary and critical for engineering structural materials. In this paper, a general methodology is proposed to predict fatigue life of smooth and circular-hole specimens, in which the crack closure model and equivalent initial flaw size (EIFS) concept are employed. Different effects of crack closure on small crack growth region and long crack growth region are considered in the proposed method. The EIFS is determined by the fatigue limit and fatigue threshold stress intensity factor △Kth. Fatigue limit is directly obtained from experimental data, and △Kth is calculated by using a back-extrapolation method. Experimental data for smooth and circular-hole specimens in three different alloys (Al2024-T3, Al7075-T6 and Ti-6Al-4V) under multiple stress ratios are used to validate the method. In the validation section, Semi-circular surface crack and quarter-circular corner crack are assumed to be the initial crack shapes for the smooth and circular-hole specimens, respectively. A good agreement is observed between model predictions and experimental data. The detailed analysis and discussion are performed on the proposed model. Some conclusions and future work are given.

1. Introduction

Life prediction and failure analysis are indispensable and critical for engineering structural materials, but continue to be challenging issues. The cumulative fatigue damage theories and the traditional S-N curve method, such as the stress-based approach [1], are often used for fatigue life prediction in engineering practice. Because of this, the fatigue crack growth method based on linear elastic fracture mechanics (LEFM) is becoming a more important and promising alternative for total fatigue life analysis. One of the main problems of this method is how to evaluate the initial flaw size (IFS) appropriately. This problem involves the complex mechanism of small-crack growth which is different from long crack growth behavior. In the current study, several methods are employed to estimate the value of initial flaw size, such as nondestructive evaluation (NDE) [2] and empirical approaches [3]. But most of the existing methods are lack of theoretical foundation and are sometimes unreliable [4]. Liu and Mahadevan [5] recently proposed a method to predict the fatigue life of smooth specimens based on the equivalent initial flaw size (EIFS). The value of EIFS is determined by fatigue limit σf and threshold stress intensity factor △Kth. However, the difference of growth behavior between small crack and long crack is not considered in this method. In addition, Newman et al. [6,7,8] predicted the total fatigue life of various smooth and notched specimens based on the crack closure model. The value of EIFS and small crack threshold stress intensity factor △Kth are determined by trial-and-error, which is an empirical approach rather than physical.
The crack closure phenomenon caused by plasticity was first observed by Elber [9]. Newman developed a strip yield model to quantify the crack closure level [10,11]. The concept of effective stress intensity factor △Keff is introduced and considered as the driving force in the crack growth analysis. If the △Keff is considered as a unique driving force in crack propagation, crack propagation rate curves i.e., da/dN~△Keff curves under different stress ratios will shrink into a single curve. Though some researchers doubted the contribution of crack closure to crack growth and the existence of the crack closure phenomenon [12,13,14], plenty of experimental research, numerical, and theoretical analysis on long cracks have shown that the crack closure phenomenon does exist and has a significant effect on fatigue crack growth [9,10,11,15,16,17,18,19,20,21,22,23,24]. Many complicated crack growth phenomena such as the overload retardation effect and the loading sequence effect, etc., can be explained by using the crack closure concept, which may not be applicable to small cracks. A number of studies on micro-structurally small cracks have indicated that the small-crack growth rate is much faster than large cracks at the same △K level [25,26,27]. This behavior is known as the small crack effect and it indicates that the crack closure phenomenon may not exist in small crack growth regions or it can be negligible. In other words, crack closure may just exist in the long crack growth regime but not in the small crack growth region. Crack closure considering the small crack effect may reflect real crack propagation characteristics. In this paper, a general method is proposed to predict fatigue life based on the crack closure model and the EIFS, in which the small crack effect is also considered.
The paper is organized as follows. First, a brief review of the concept of EIFS and the framework of fatigue life prediction based on crack growth analysis method, is addressed. Next, a total fatigue life prediction model considering the crack closure, is established; then, a large number of experimental data, for smooth and circular-hole specimens on three different alloys (Al2024-T3, Al7075-T6 and Ti-6Al-4V), under multiple stress ratios collected from the open literature, are employed to validate the proposed model. Finally, some discussion and conclusions are drawn based on the current study.

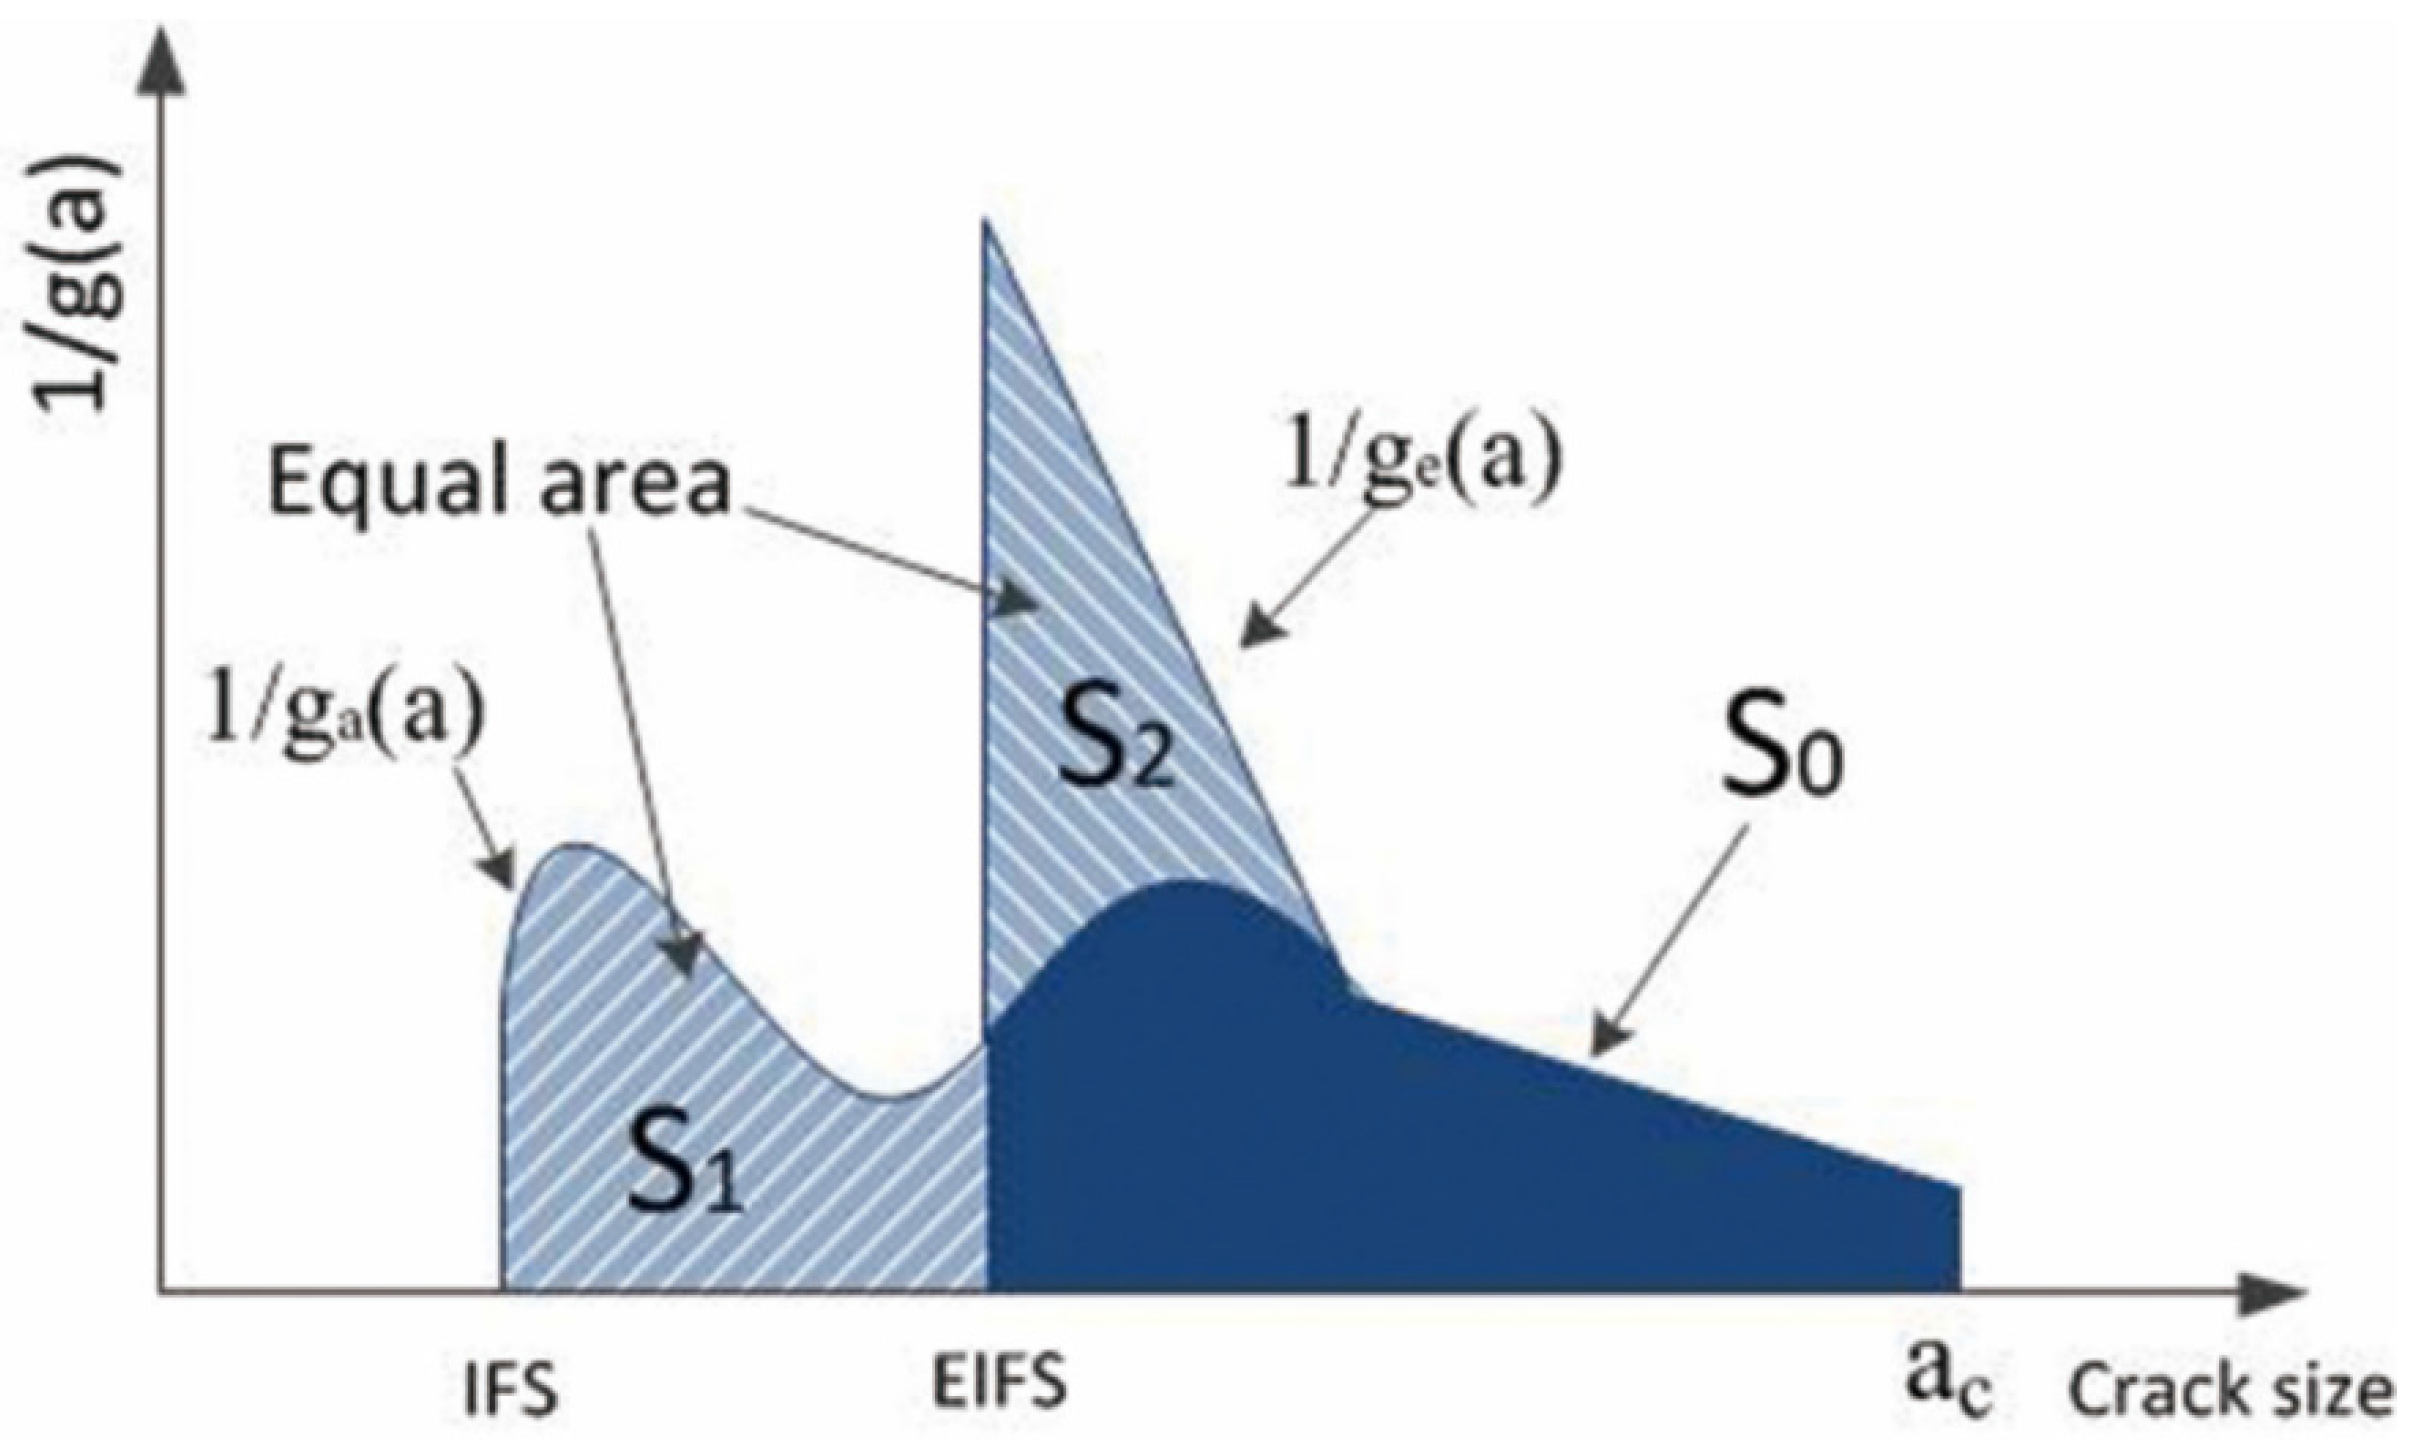
2. The Concept of Equivalent Initial Flaw Size (EIFS)

Fatigue life prediction based on EIFS is briefly reviewed in this section, and detailed information can be found in Ref. [5]. Small-crack growth is a very complicated process, and it is difficult to establish an accurate quantitative expression to describe the growth behavior of a real small crack. Additionally, estimation of the actual IFS is another challenge. These issues make fatigue life prediction based on crack growth analysis difficult. Therefore, the EIFS concept is considered to be a good way to solve these problems.
Several crack growth models are available to describe crack growth behavior, such as the Forman model and the Walker model. The general material crack propagation model can be expressed as
d a / d N = f ( K )
where da/dN represents the crack propagation rate; a represents the crack size; N represents the fatigue life; and △K is the stress intensity factor (SIF) range. Under constant amplitude loading, △K is a function of crack size a, so, crack propagation rate can also be expressed as
d a / d N = g ( a )
Fatigue life N can be expressed using crack size a
N = 0 N d N = a i a c 1 g ( a ) d a
where ai represents the actual initial flaw size; ac represents the critical crack size at failure, which is determined by the applied load levels and the critical stress intensity factor.
If the crack growth rate function ga(a) is used, in which small crack growth characteristics and the actual initial flaw size are taken into account, fatigue life NIFS can be written as
N I F S = I F S a c 1 g a ( a ) d a
If EIFS and the corresponding crack growth rate function ge(a) are employed, fatigue life NEIFS can be expressed as
N E I F S = E I F S a c 1 g e ( a ) d a
A schematic illustration of these two methods is shown in Figure 1. The underlying areas S0 + S1 and S0 + S2 below ga(a) and ge(a) represent fatigue life calculation results by using the respective method. If the value of EIFS could be chosen properly, the corresponding areas are equal, i.e., S1 = S2.
Figure 1. Schematic illustration of actual initial flaw size (IFS) and equivalent initial flaw size (EIFS).
Materials 08 05367 g001
The EIFS in Equation (5) is determined by solving following function
K t h = σ f π a Y
where a is the EIFS; △Kth is the value of the threshold stress intensity factor; Y represents the geometry correction factor which is a function of crack length a; and σf is the fatigue limit.The equation is proposed by El Haddad [28] which is based on the Kitagawa-Takahashi (KT) diagram [26], as shown in Figure 2.
Figure 2. Schematic representation of the relationship between fatigue limit and crack size.
Materials 08 05367 g002

3. Fatigue Life Prediction Based on Crack Closure and Equivalent Initial Flaw Size

3.1. Life Prediction for Smooth Specimens

The phenomenon of crack closure caused by plasticity was first observed by Elber [9], and Newman further developed a strip yield model [10,11]. In this paper, the crack closure model proposed by Newman is employed [10,11], which is widely used even in the NASGRO software [29,30]. The equation can be expressed as
d a / d N = C [ ( 1 f 1 R ) K ] m ( 1 K t h / K ) p ( 1 K max / K c ) q
where R is the stress ratio; △K represents the SIF range; △Kth is the small fatigue threshold stress intensity factor; Kmax is the maximum stress intensity factor; and Kc is the critical stress intensity factor. C, m, p, f and q are fitting parameters, f represents the crack closure contribution. For a constant amplitude loading condition, f can be expressed as [11]
f = { max ( R , A 0 + A 1 R + A 2 R 2 + A 3 R 3 )    R 0 A 0 + A 1 R       -2 R < 0
where
  • A 0 = ( 0.825 0.34 α + 0.05 α 2 ) [ cos ( π 2 S max / σ 0 ) ] 1 / α
  • A 1 = ( 0.415 0.071 α ) S max / σ 0
  • A 2 = 1 A 0 A 1 A 3
  • A 3 = 2 A 0 + A 1 1
There are five fitting parameters unknown in this formulation. The value of Smax0, α and p can be found in the NASGRO database and the fatigue crack growth database [29,30]. In this paper, Smax0 is assumed to be 0.3, α is assumed to be 2 and p is assumed to be 1.5. Since the fatigue life in the critical crack growth regime can be negligible, the value of q will not affect model prediction significantly, and can be assumed to be 1. C and m can be calibrated with da/dN~△K curves in the Paris region by using the least squares method. The crack growth rate data in the Paris region is extrapolatied to 10−10 m/cycle, and then the corresponding stress intensity factor coefficient is the value of △Kth.
Equation (7) can be rewritten as
d N = ( 1 K max / K c ) q C [ ( 1 f ) / ( 1 R ) × K ] m ( 1 K t h / K ) p d a
Fatigue life N can be expressed as
N = a i a c ( 1 K max / K c ) q C [ ( 1 f ) / ( 1 R ) × K ] m ( 1 K t h / K ) p d a
where ai is EIFS determined using Equation (6). ac represents the critical crack size at failure and can be estimated using the applied stress levels and critical stress intensity factor. For high-cycle fatigue problems, most of the fatigue life is spent at crack initiation, small crack growth, and in the Paris regime. Fatigue life spent in the unstable crack growth region can be negligible. The value of ac will not affect the model prediction significantly and can be set as a constant. As it is shown in Figure 3, 1/g(a) is the integral curve and the underlying area below 1/g(a) is the fatigue life. a (50 um) is assumed as EIFS. c1 and c2 are the critical crack lengths. Let critical crack size change from c1 (1 mm) to c2 (2 mm), and the corresponding fatigue life increases from 54,299 to 54,741. It is clear that the critical crack size increases by 100 percent, but the variation of corresponding fatigue life is just 0.81 percent.
Figure 3. Schematic illustration of the effect of critical crack size on fatigue life prediction.
Materials 08 05367 g003
In the proposed method, according to the Equation (6), ai also depends on the crack shape, that is, the geometry correction factor Y. In the current study, a semi-circular surface crack is assumed for smooth specimens, as shown in Figure 4. The geometry correction factor Y for a surface crack of finite plate width can be expressed as [31,32].
Y = M 0 g 1 f φ f w f x
where
  • M 0 = ( m 1 + m 2 ( a t ) 2 + m 3 ( a t ) 4 )
  • m 1 = 1.13 0.09 ( a / c )
  • m 2 = 0.54 + 0.89 / ( 0.2 + ( a / c ) )
  • m 3 = 0.5 1 / ( 0.65 + ( a / c ) ) + 14 ( 1 ( a / c ) ) 24
  • g 1 = 1 + ( 0.1 + 0.35 ( a t ) 2 ) ( 1 sin φ ) 2
  • f φ = ( sin φ + ( a / c ) 2 cos 2 φ ) 0.25
  • f w = sec ( π c W a t )
  • f x = [ 1 + 1.464 ( a c ) 1.65 ] 0.5
where a represents the semi-elliptical crack depth, and 2c represents the semi-elliptical crack length. W is the plate width and t is the plate thickness. Surface crack growth is actually a 3D crack problem, which is simplified as a 2D problem in this study. The surface crack is assumed to be a semi-circular surface crack, i.e., φ = 0 and a/c = 1.
Figure 4. Schematic representation of a semi-circular surface crack and a corner crack from a hole ‘O’.
Materials 08 05367 g004

3.2. Life Prediction for Circular-Hole Specimens

In this paper, the EIFS is determined by the fatigue threshold stress intensity factor △Kth and fatigue limit σf. The threshold stress intensity factor △Kth is usually defined as the stress intensity factor range at which the crack growth rate is less than 10−10 m/cycle. It is usually obtained from back-extrapolation of crack growth rate curves or experimental investigation. △Kth is an inherent characteristic of the material and is independent of specimen type. Therefore, the value of the threshold stress intensity factor △Kth of smooth specimens can also be used in predicting the life of circular-hole specimens. However, the fatigue limit of smooth and circular-hole specimens depends not only on the materials, but also on the specimen configuration. It is indicated that the S-N curves of smooth and circular-hole specimens in the same material are different [33].
In this paper, the initial crack shape for circular-hole specimens is assumed as quarter-circular corner crack, as shown in Figure 4. The geometry correction factor Y for a corner crack from a hole of finite plate width can be expressed as [34]
Y = G 0 G w
where
  • G 0 = f ( z ) / d
  • z = [ 1 + 2 ( a / D ) cos ( μ φ ) ] 1
  • f ( z ) = 0.7071 + 0.7548 z + 0.3415 z 2 + 0.642 z 3 + 0.9196 z 4
  • μ = 0.85
  • d = 1 + 0.13 z 2
  • G w = M 0 g 1 g 2 g 3 f w f φ f x
  • g 2 = ( 1 + 0.04 ( a / c ) ) [ 1 + 0.1 ( 1 cos φ ) 2 ] ( 0.85 + 0.15 ( a / t ) 0.25 )
  • g 3 = 1 0.7 ( 1 ( a / t ) ) ( ( a / c ) 0.2 ) ( 1 ( a / c ) )
  • f w = [ sec ( π D 2 W ) sec ( π ( D + c ) 2 W 2 c a t ) ] 0.5
where the expression of M0, g1, fφ and fx are the same as in Equation (11). The corner crack depth is a, and c is the surface corner crack length. D is the hole diameter, W is the plate width and t is the plate thickness. The crack growth problem is simplified as a 2D problem. More complicated problems need further research.

3.3. Plasticity Correction

The above discussion is applicable to linear elastic analysis which is usually used for high cycle fatigue analysis. The linear-elastic analysis is inadequate considering low-cycle fatigue. Materials will experience some plastic deformation under high stress level, and the plastic zone size is large enough compared to the crack size and cannot be negligible. A plasticity correction factor can be expressed as [5]
ρ = a ( sec ( π σ max ( 1 R ) 4 σ 0 ) 1 )
where ρ is the plastic zone size; a is the crack length; R is the stress ratio; and σmax is the maximum applied nominal stress; σ0 represents the flow stress and can be calculated using material yield strength σy and tensile strength σu.
The stress intensity factor range considering plasticity correction can be expressed as
K ' = σ π a ' Y '
where is the geometry correction factor using the equivalent crack length considering plasticity correction, and the equivalent crack length can be expressed as
a ' = a + ρ

4. Model Validation for Smooth and Circular-Hole Specimens

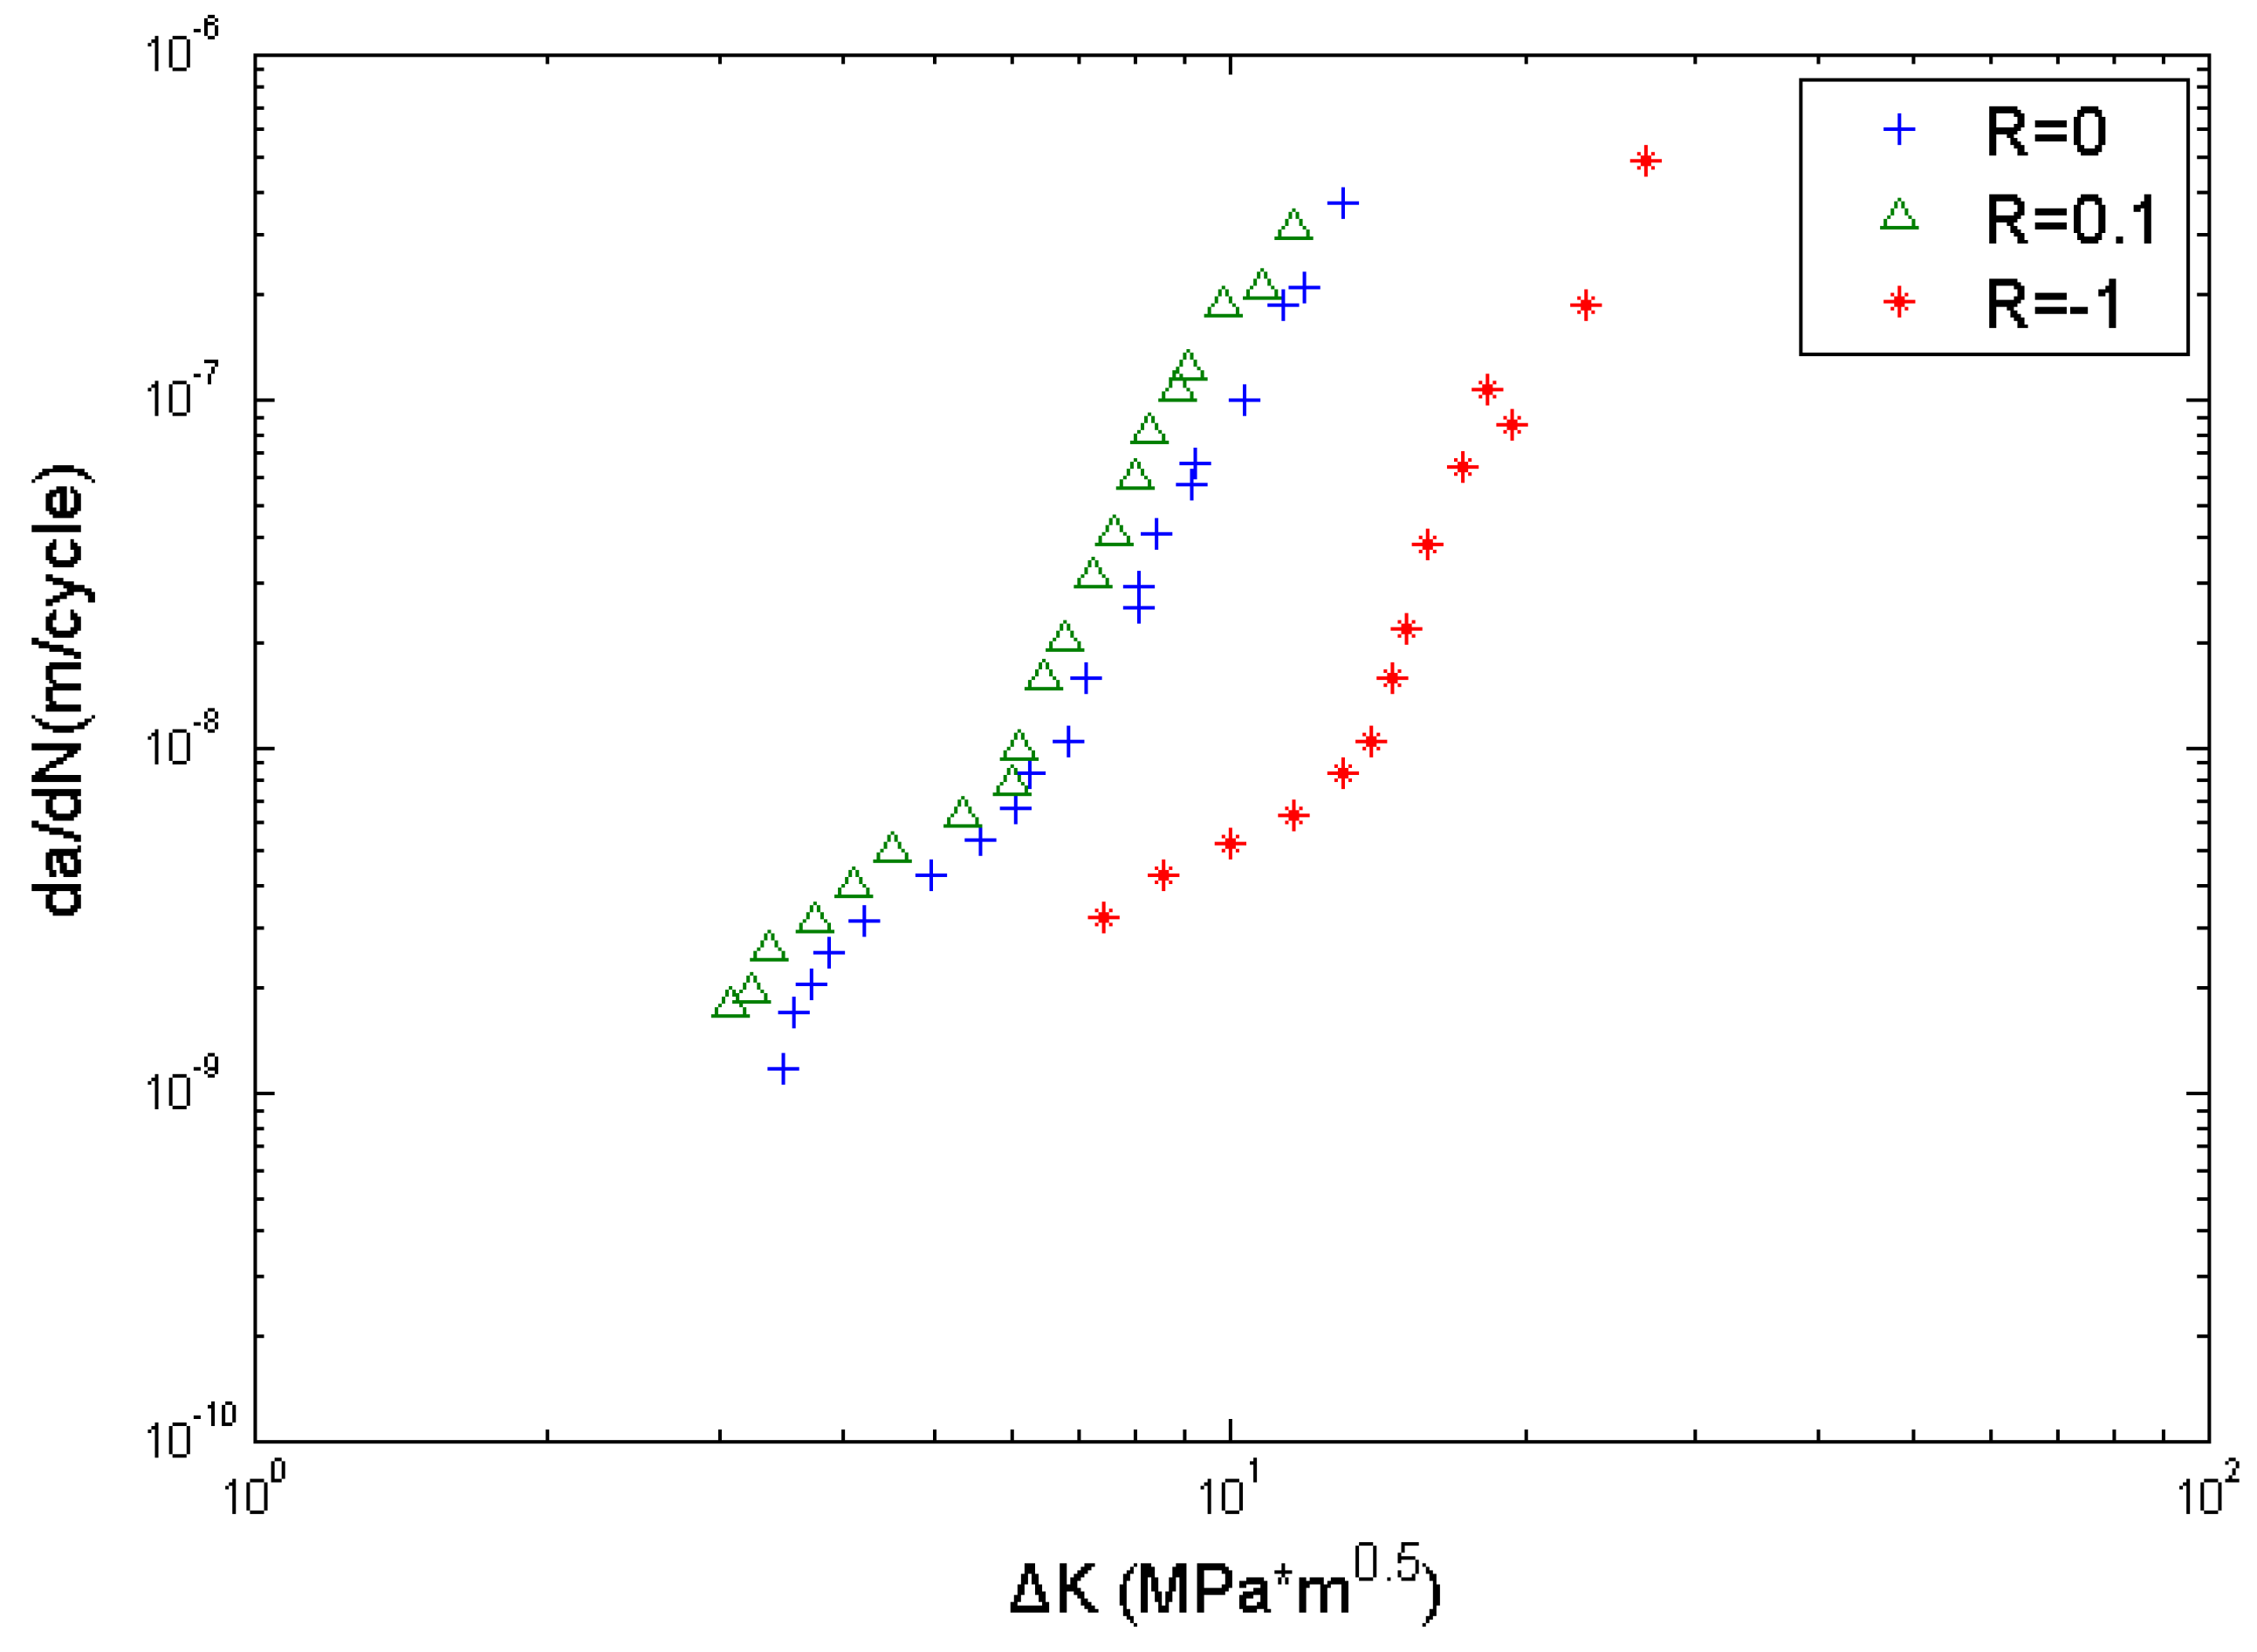
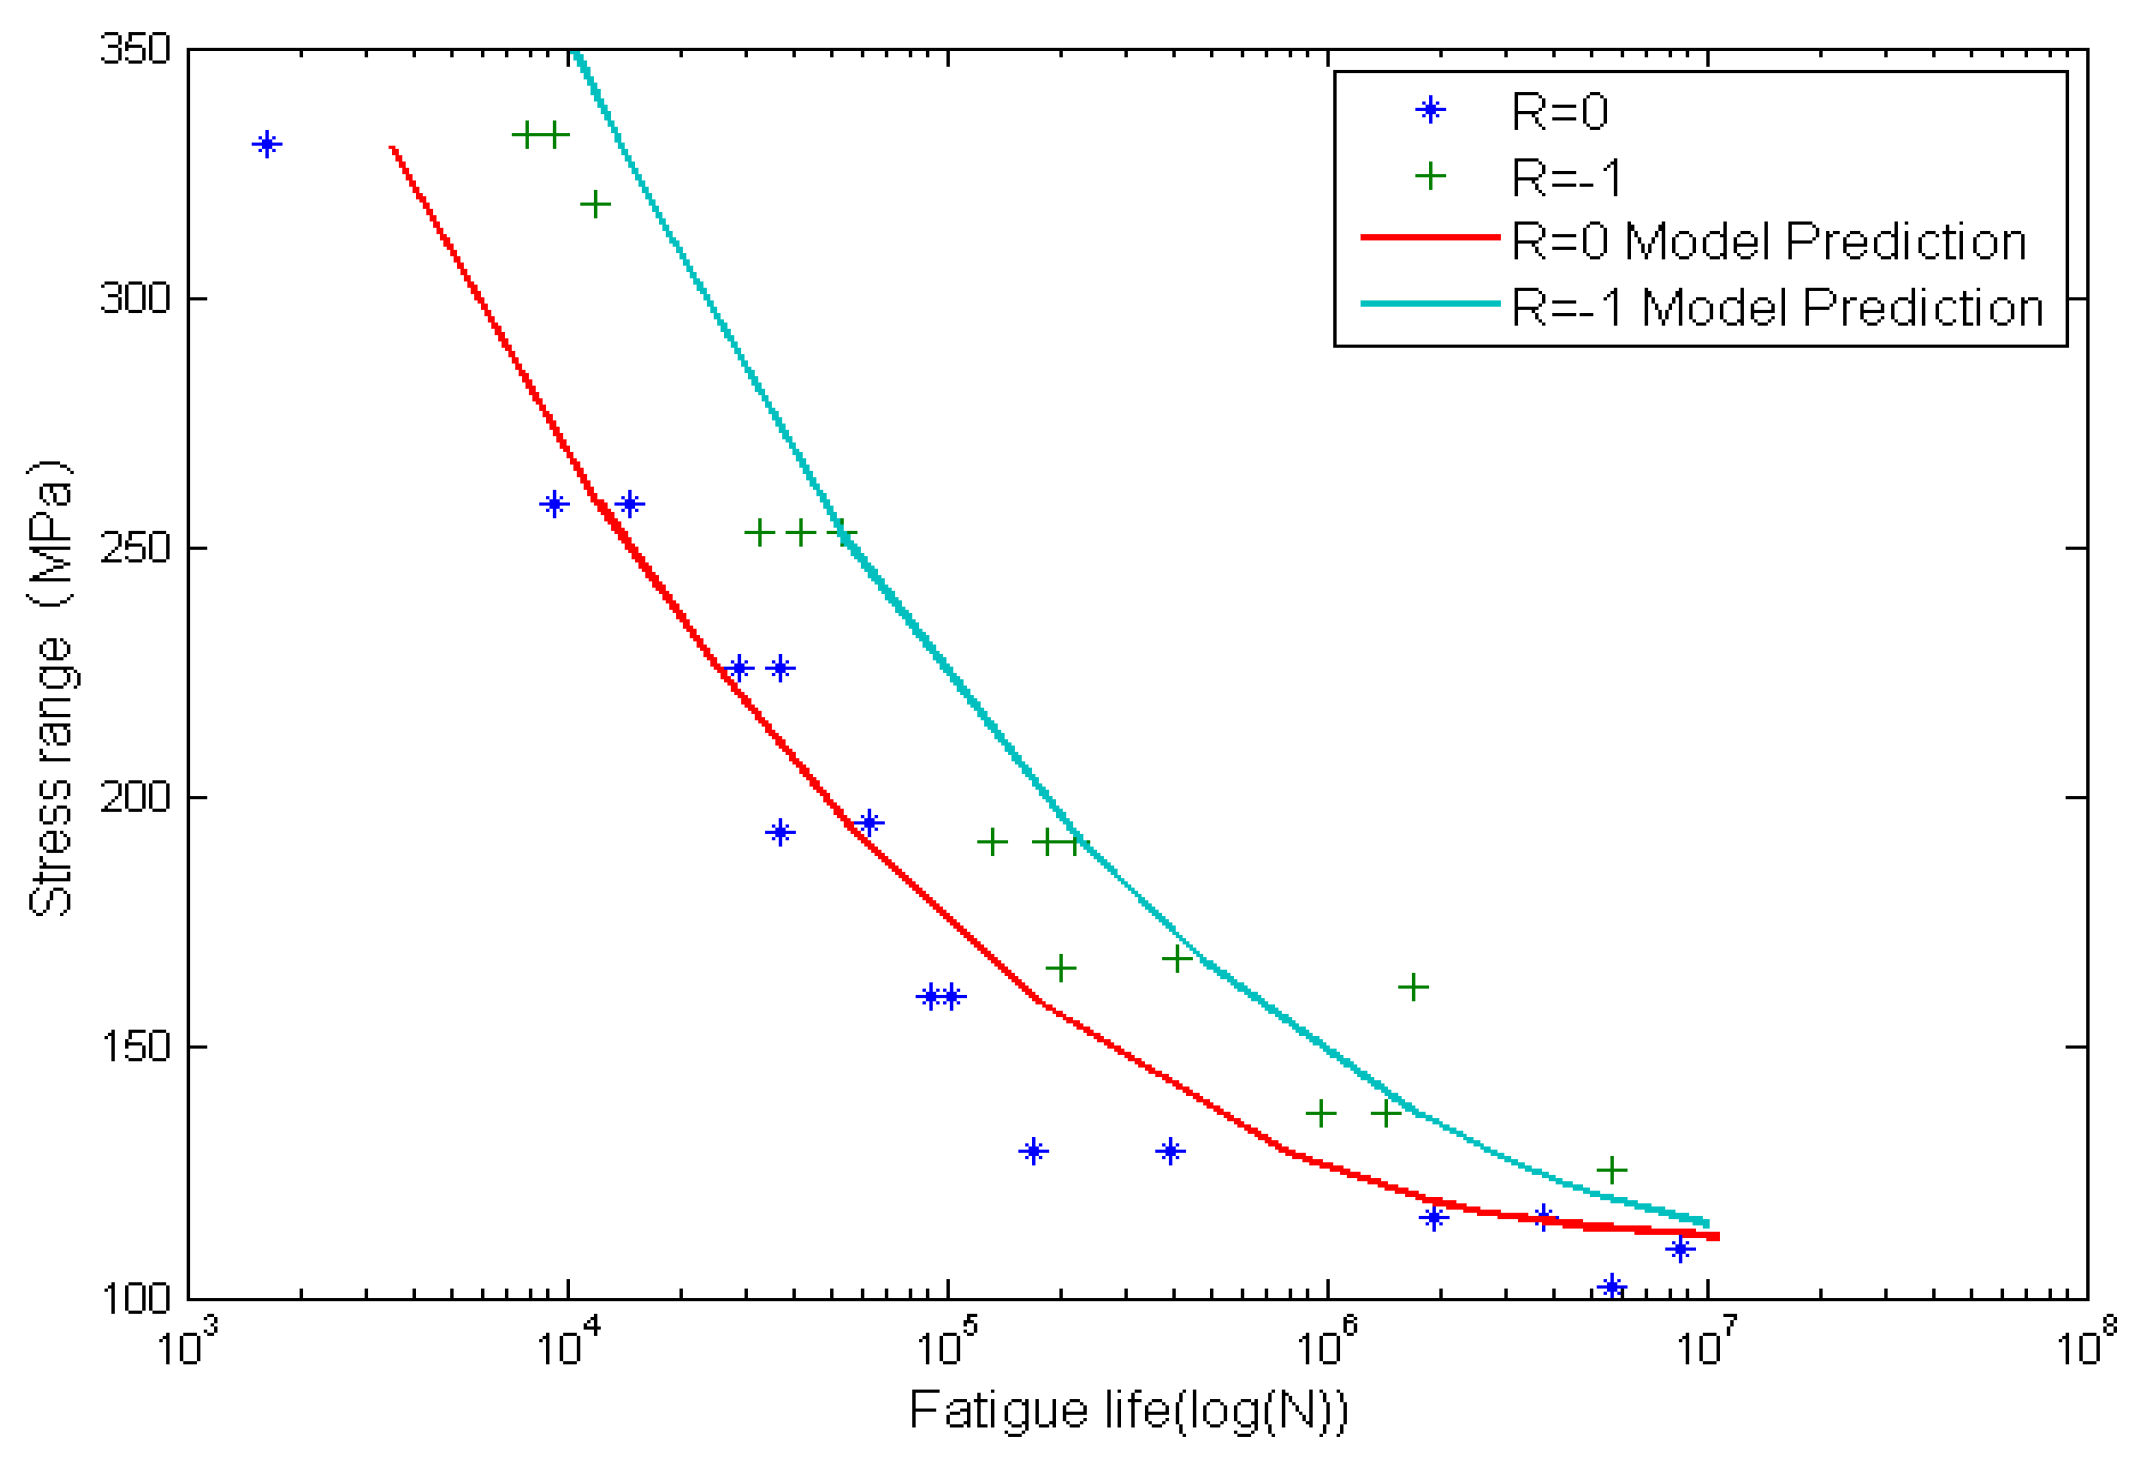
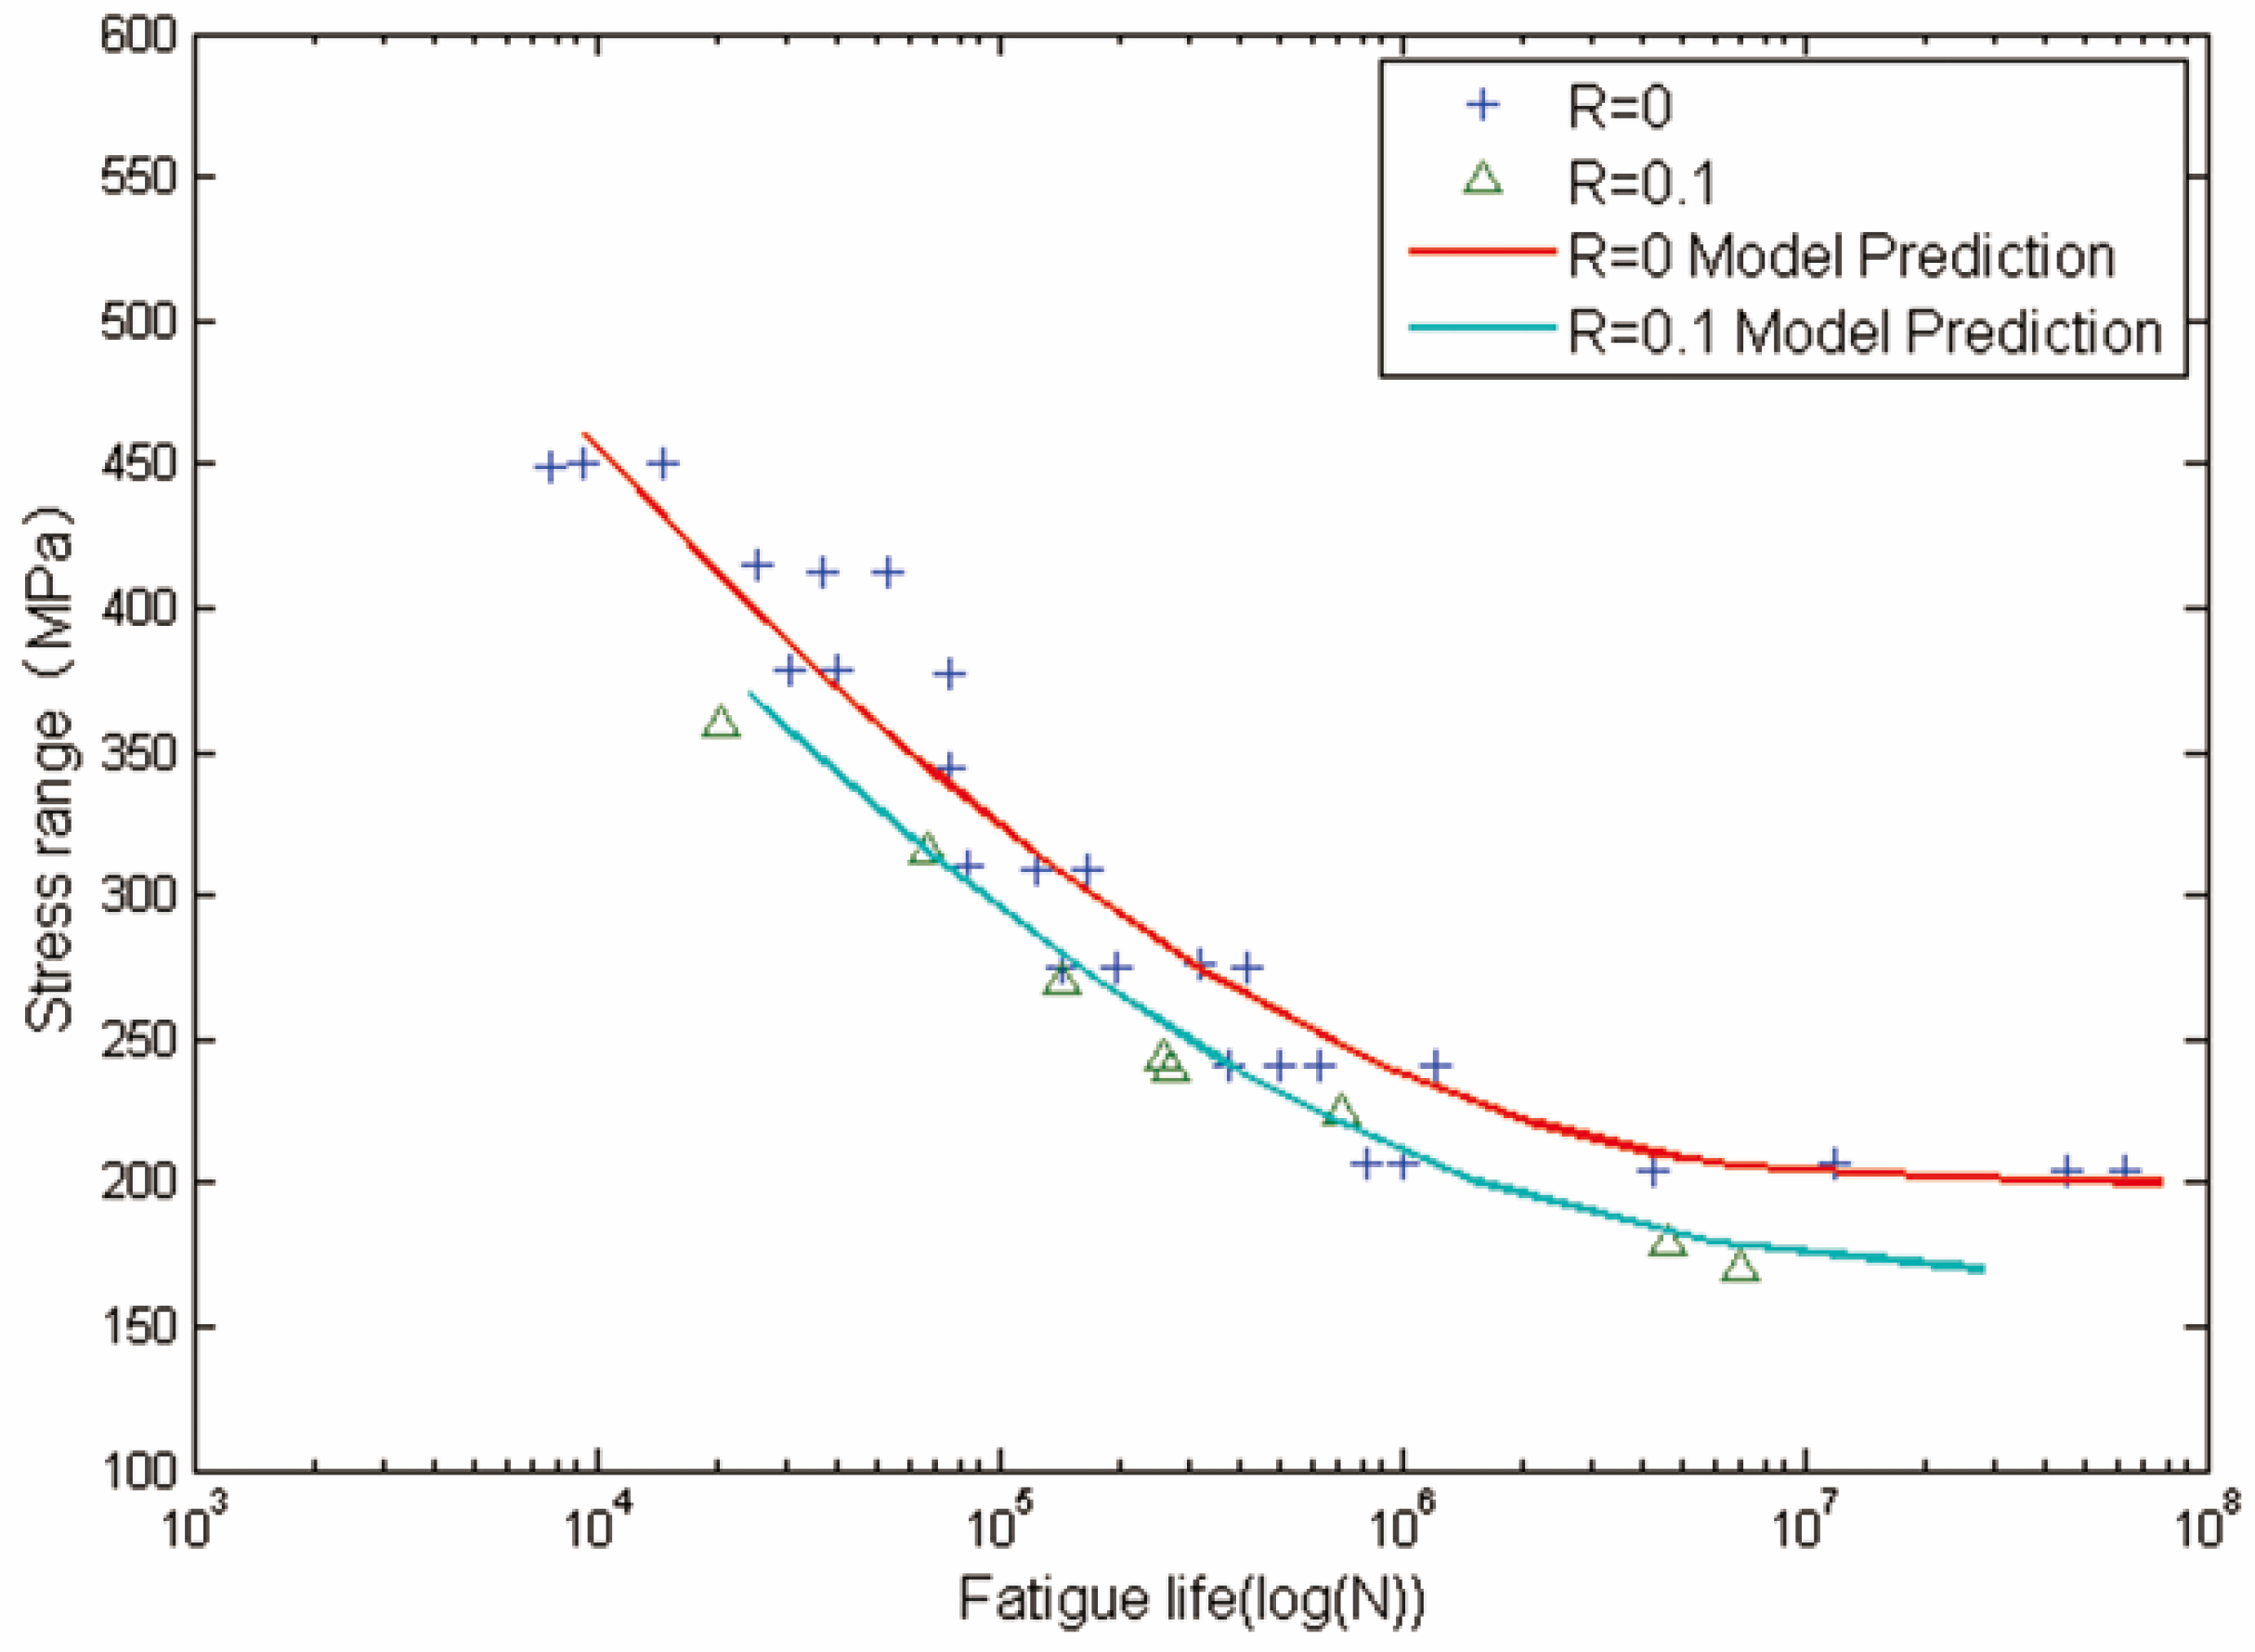
4.1. Life Prediction for Smooth and Circular-Hole Al2024-T3 Specimens

The crack growth rate data under different stress ratios were used from [35]. The S-N data for both smooth and circular-hole specimens of Al2024-T3 were used from [6,36]. The specimen geometry is listed in Table 1; and the mechanical properties of Al2024-T3 are as follows: yield strength σy is 360 MPa and ultimate strength σu is 490 MPa, and the critical stress intensity factor Kc is 30 MPa.
Table 1. Specimen geometry of Al2024-T3 aluminum alloy.
Specimen TypeRWidth (mm)Thickness (mm)Hole diameter (mm)
Smooth025.42.3/
0.110.05.0/
Notched0/−150.82.33.2
To predict fatigue life, crack growth rate data obtained from the literature [35] is used to calibrate C and m by the least squares method, as shown in Figure 5. The calibrated parameters are C = 3.5535 × 10⁻¹¹, m = 4.059. The remaining parameters are calculated and listed in Table 2. The value of △Kth is obtained by using the above back-extrapolation method. σs and σh are the fatigue limits, obtained from S-N curves of smooth and circular-hole specimens, respectively. EIFSs and EIFSh represent the corresponding EIFS which are calculated by using Equation (6).
Figure 5. Fatigue crack growth data of Al2024-T3 aluminum alloy.
Materials 08 05367 g005
Table 2. Mechanical properties and fatigue properties for Al2024-T3 aluminum alloy.
MaterialR△Kth (MPa)△σs (MPa)△σh (MPa)EIFSs (μm)EIFSh (μm)
Al2024-T301.913620011250.6923.87
0.11.6502170/53.34/
−13.7802/110/110.4
Life prediction for Al2024-T3 specimens are shown in Figure 6 and Figure 7. Figure 6 and Figure 7 are the comparison between calculated fatigue lives and experimental measurements for smooth and circular-hole Al2024-T3 specimens. The x-axis is the fatigue life, and the y-axis is the stress range. Solid lines represent model predictions and solid marks represent experimental data. It can be observed that life prediction results agree well with experimental data.
Figure 6. Experimental data and calculated fatigue lives for smooth Al2024-T3 aluminum alloy specimens.
Materials 08 05367 g006
Figure 7. Experimental data and calculated fatigue lives for circular-hole Al2024-T3 aluminum alloy specimens.
Materials 08 05367 g007

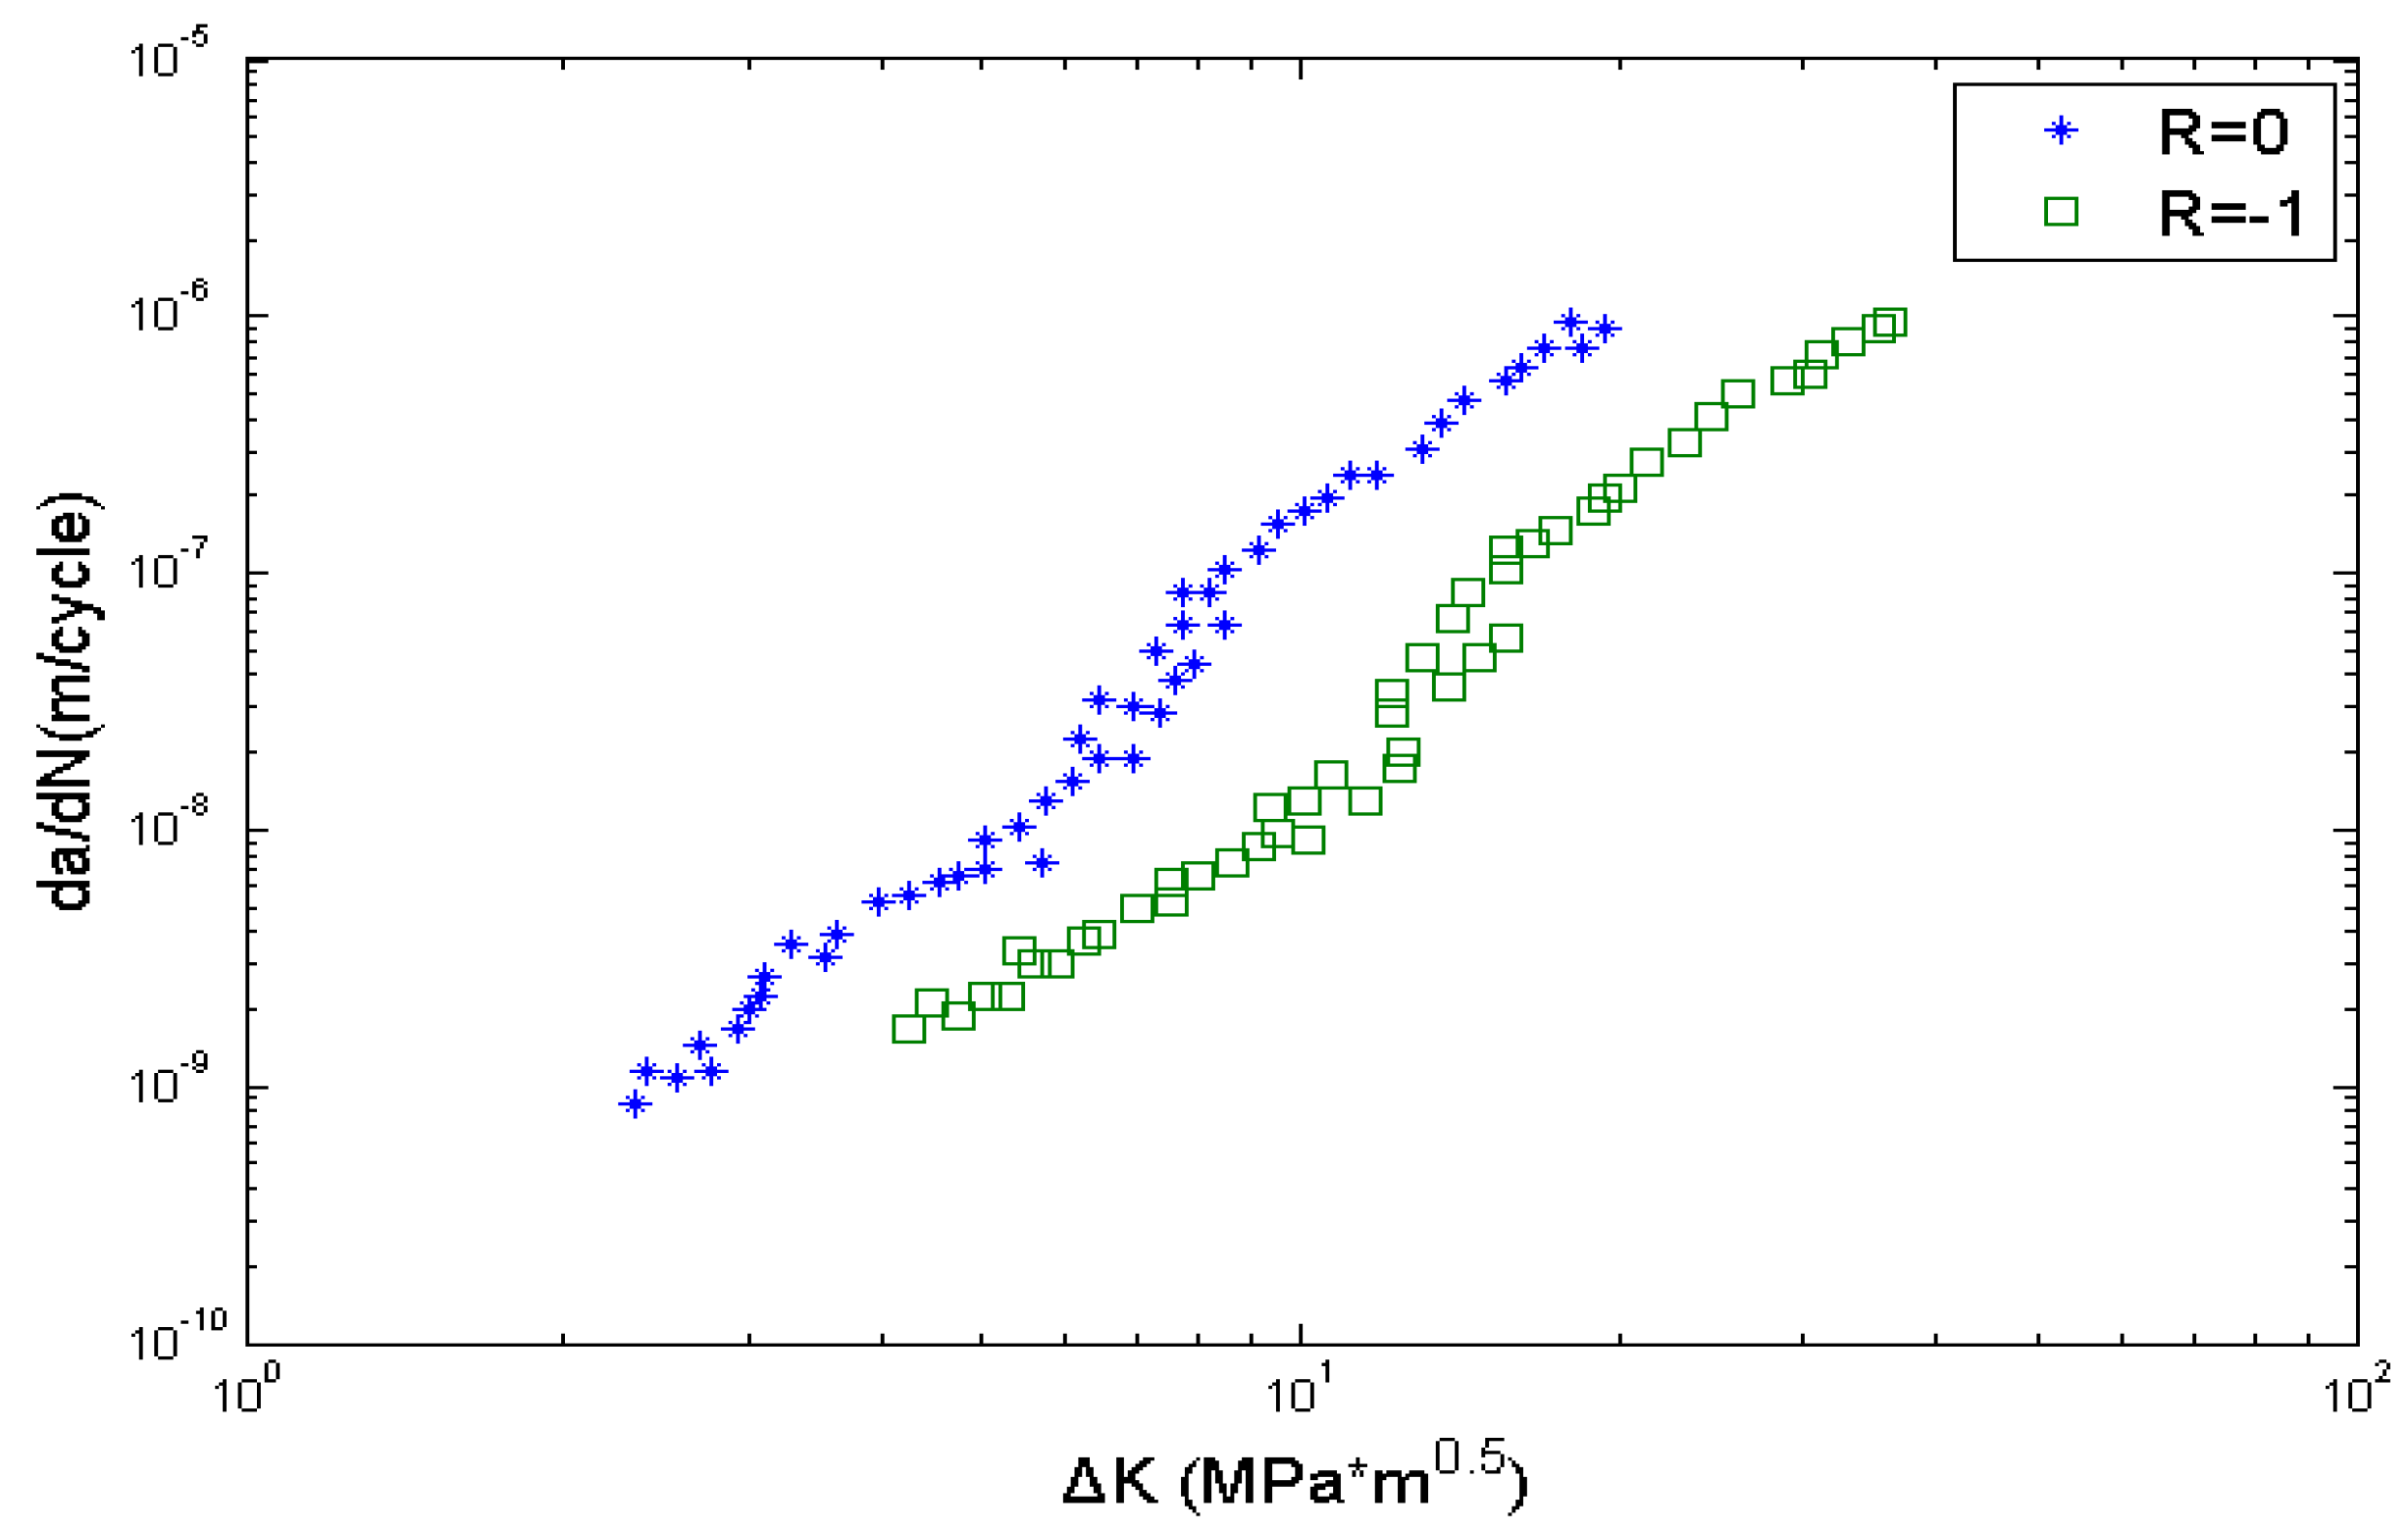
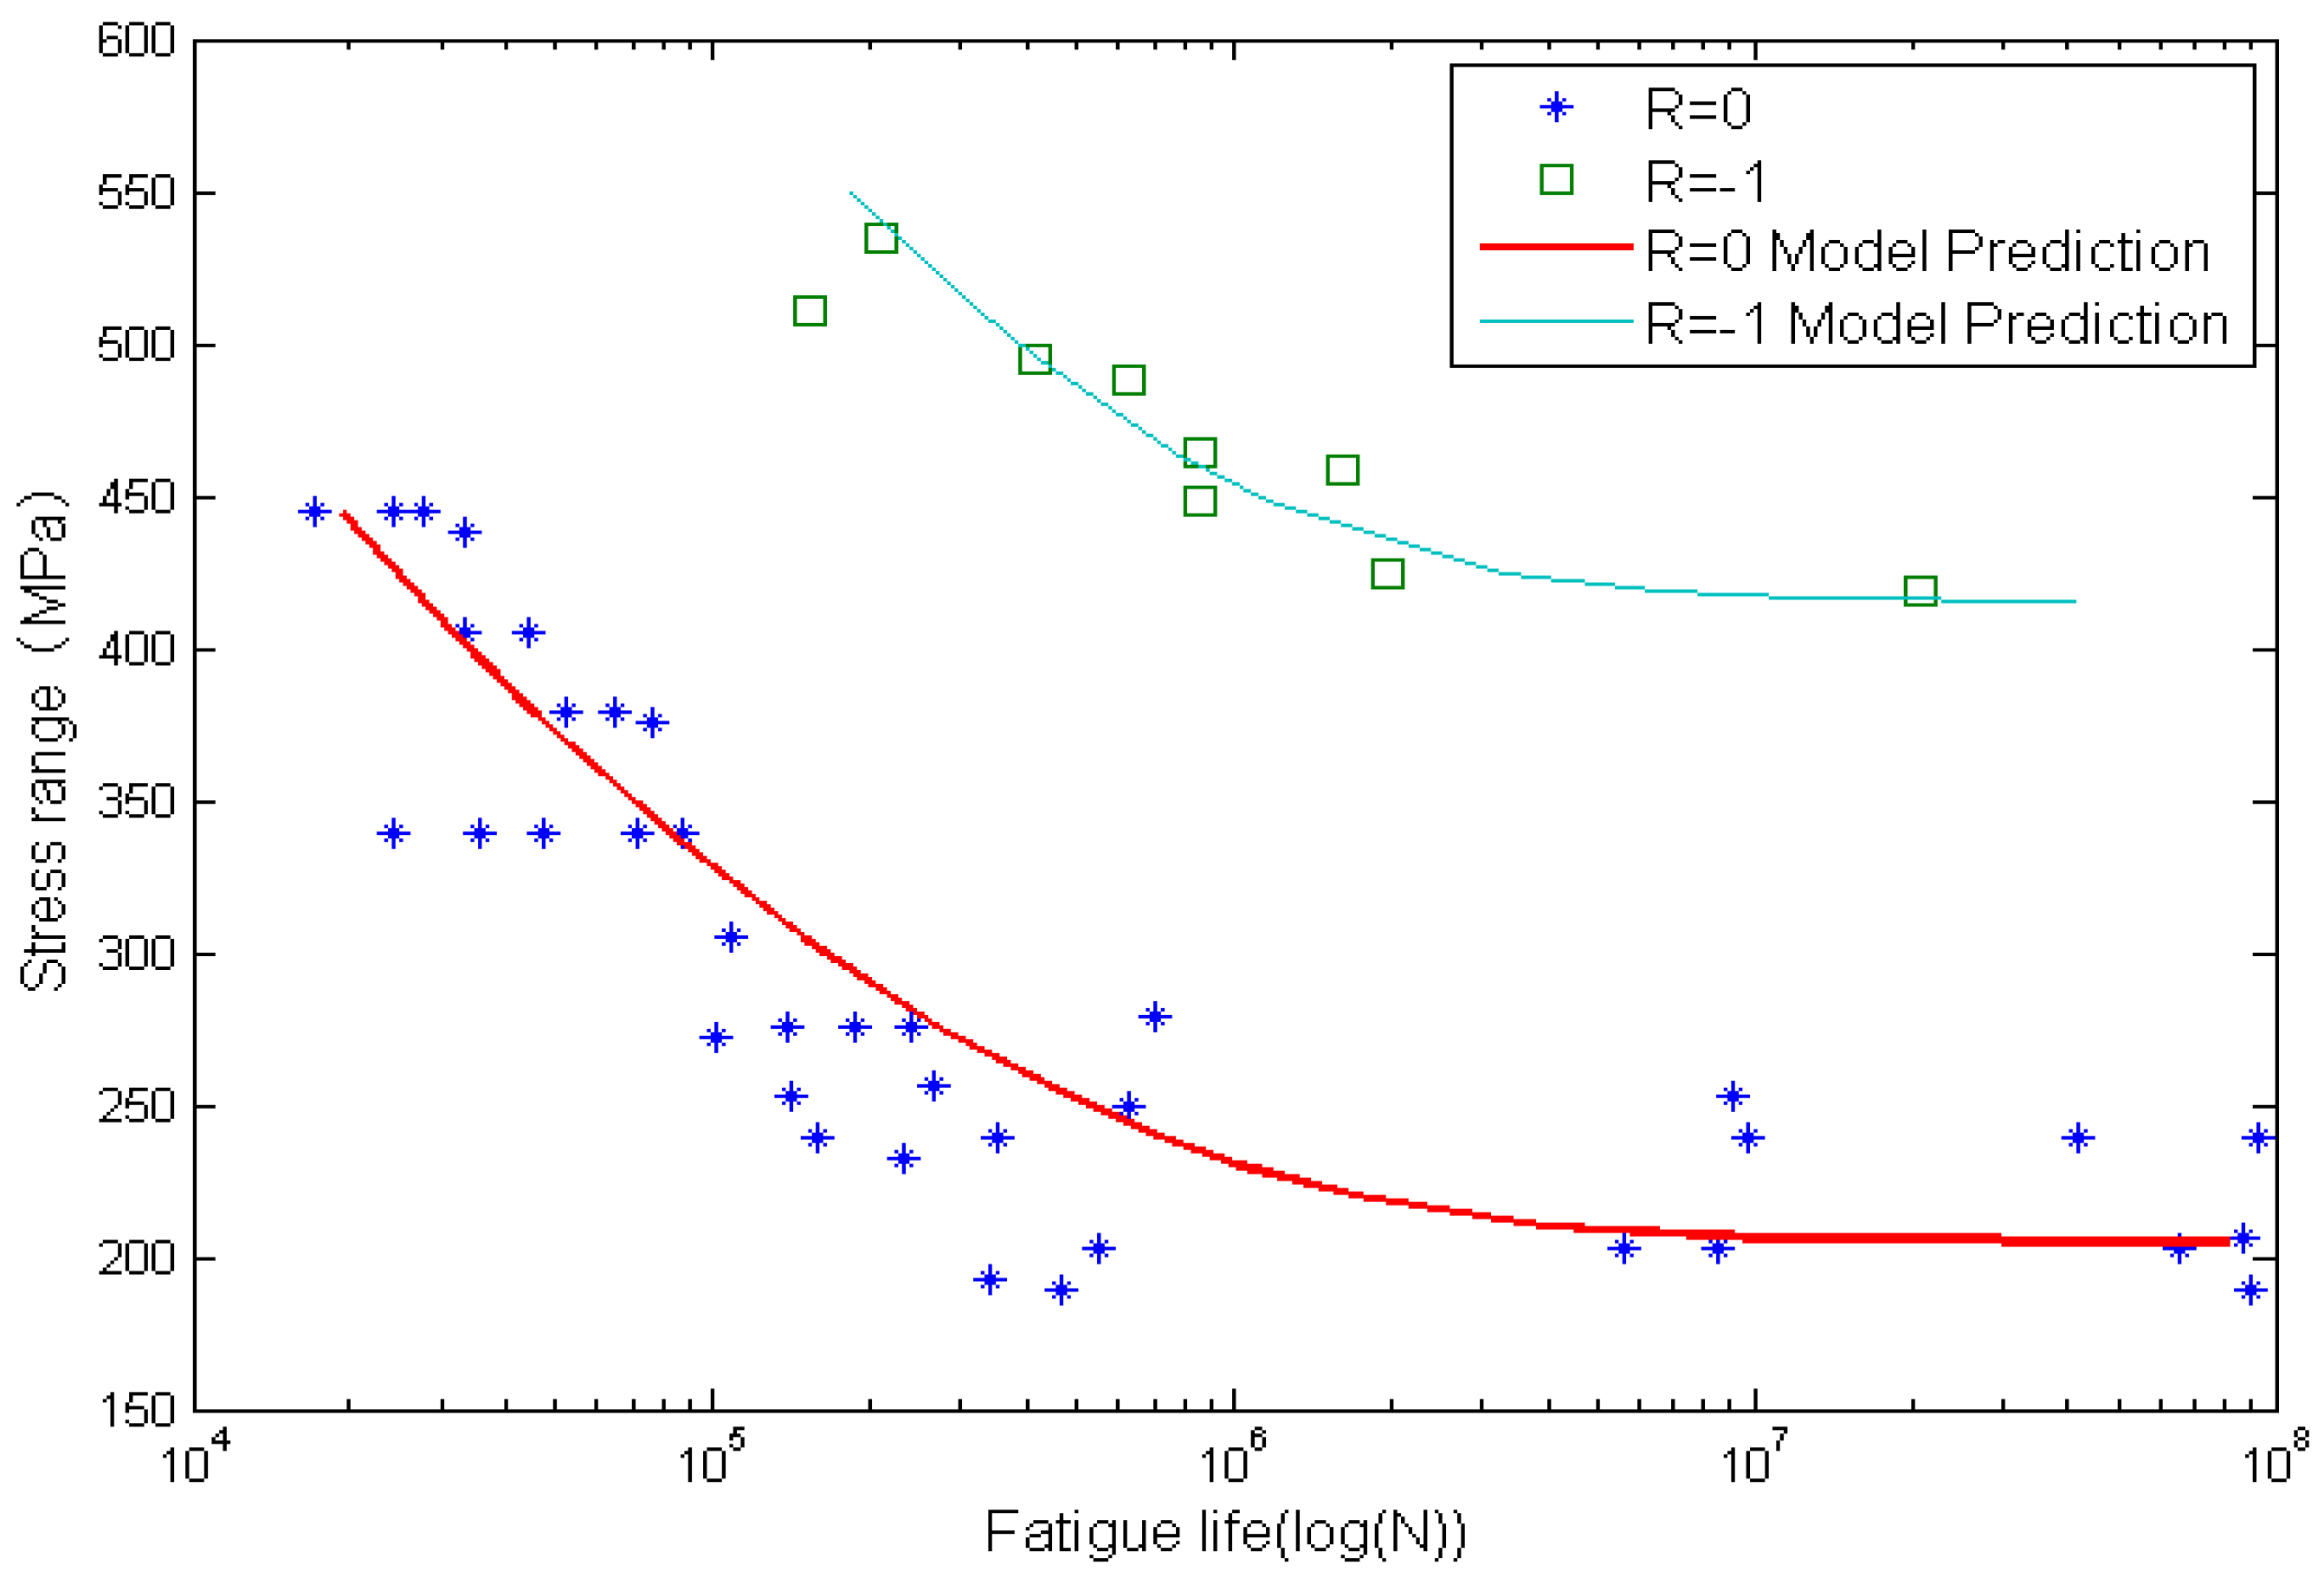
4.2. Life Prediction of Smooth and Circular-Hole Al7075-T6 Specimens

The crack growth rate data of Al7075-T6 are obtained from the literature [35], the S-N data for both smooth and circular-hole specimens of Al7075-T6 are also collected from the literature [6,37], and the specimen dimensions are shown in Table 3. For smooth specimens under R = −1, σy is 501 MPa and σu is 569 MPa [32]. For the remaining specimens, σy is 520 MPa and σu is 575 MPa [6]. The critical stress intensity factor, Kc, is 29 MPa.
Table 3. Specimen geometry of Al7075-T6 aluminum alloy.
Specimen TypeRWidth (mm)Thickness (mm)Hole Diameter (mm)
Smooth025.42.3/
−150.84.8/
Notched0/−150.82.31.6
Similarly, C and m are calibrated by using crack growth rate data obtained from the literature [35], and the calibrated parameters are C = 1.5779 × 10⁻¹⁰, m = 3.477. The crack growth data is shown in Figure 8. The other data needed are shown in Table 4. The value of △Kth is estimated using the above back-extrapolation method. EIFSs and EIFSh represents the equivalent initial flaw size of smooth and circular-hole specimens, respectively, and are determined using Equation (6).
Figure 8. Fatigue crack growth data of Al7075-T6 aluminum alloy.
Materials 08 05367 g008
Table 4. Mechanical properties and fatigue properties for Al7075-T6 aluminum alloy.
MaterialR△Kth (MPa)△σs (MPa)△σh (MPa)EIFSs (μm)EIFSh (μm)
Al7075-T601.300720512122.959.59
−12.155141513011.0619.88
Figure 9 and Figure 10 show the calculated fatigue lives and experimental data. The x-axis is the fatigue life, and the y-axis is the stress range. Solid lines represent model predictions by using the proposed method and the solid marks represent experimental data. It is clear that life prediction results agree well with experimental data.
Figure 9. Experimental data and calculated fatigue lives for smooth Al7075-T6 aluminum alloy specimens.
Materials 08 05367 g009
Figure 10. Experimental data and calculated fatigue lives for circular-hole Al7075-T6 aluminum alloy specimens.
Materials 08 05367 g010

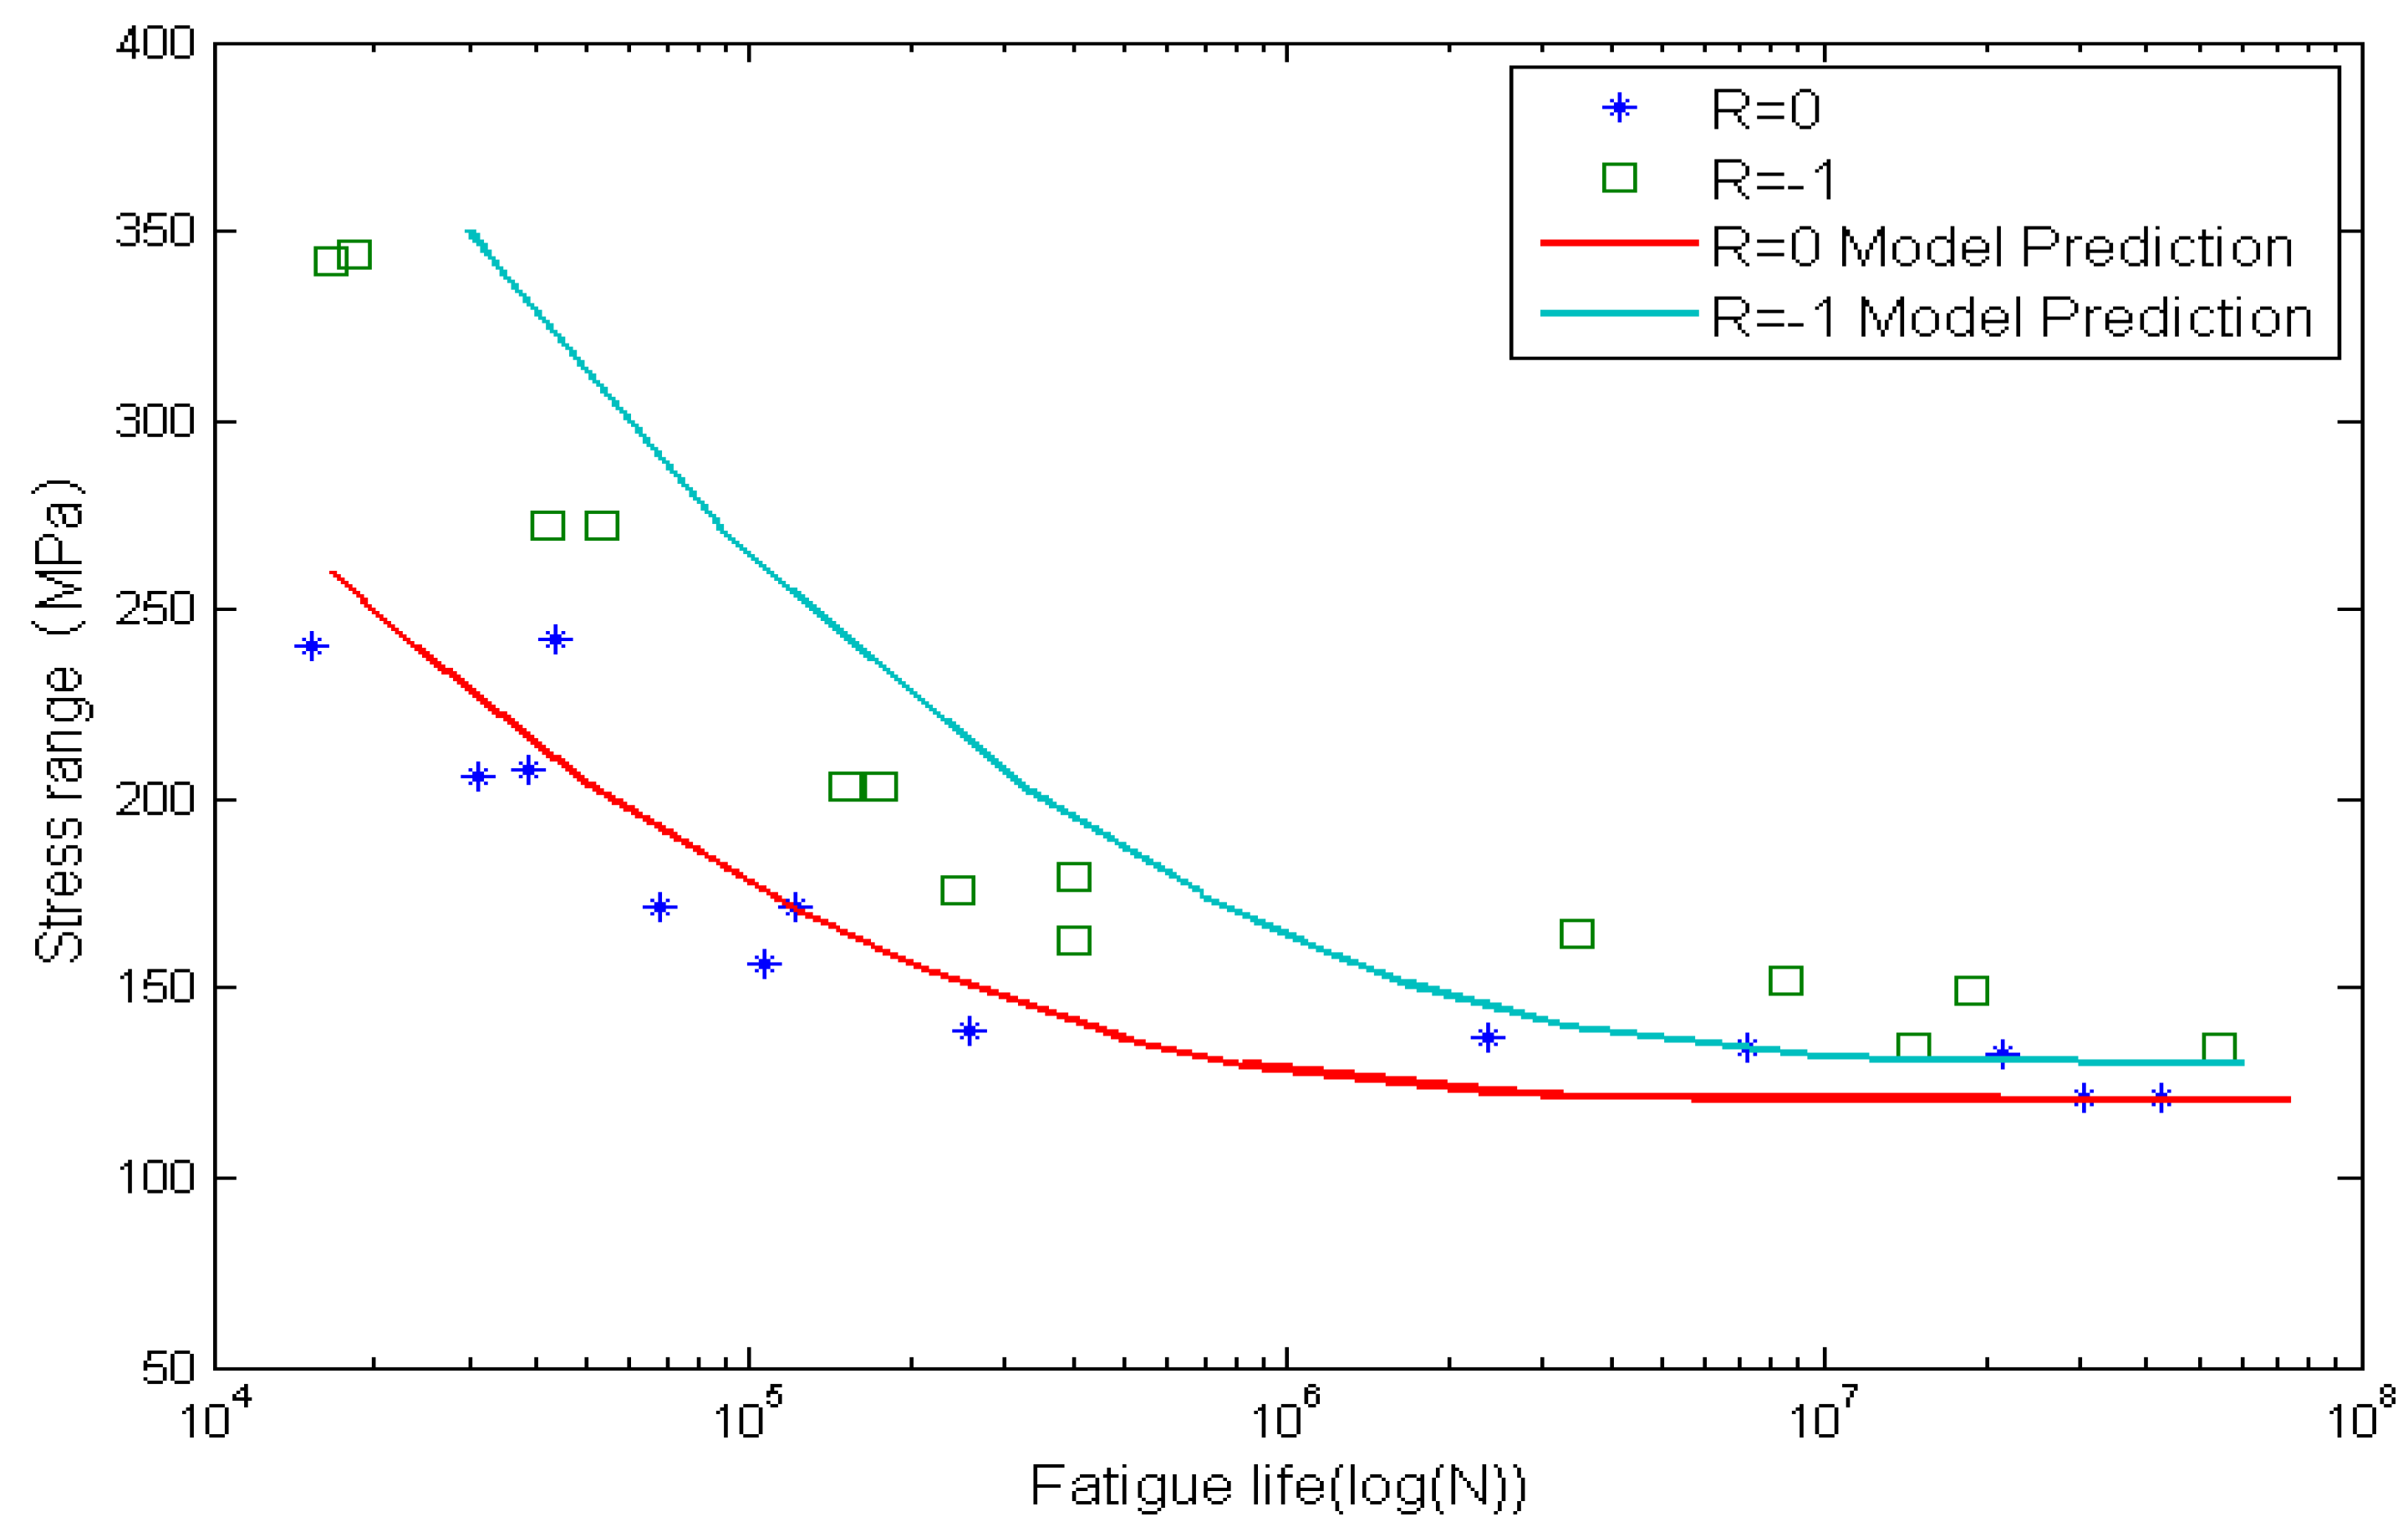
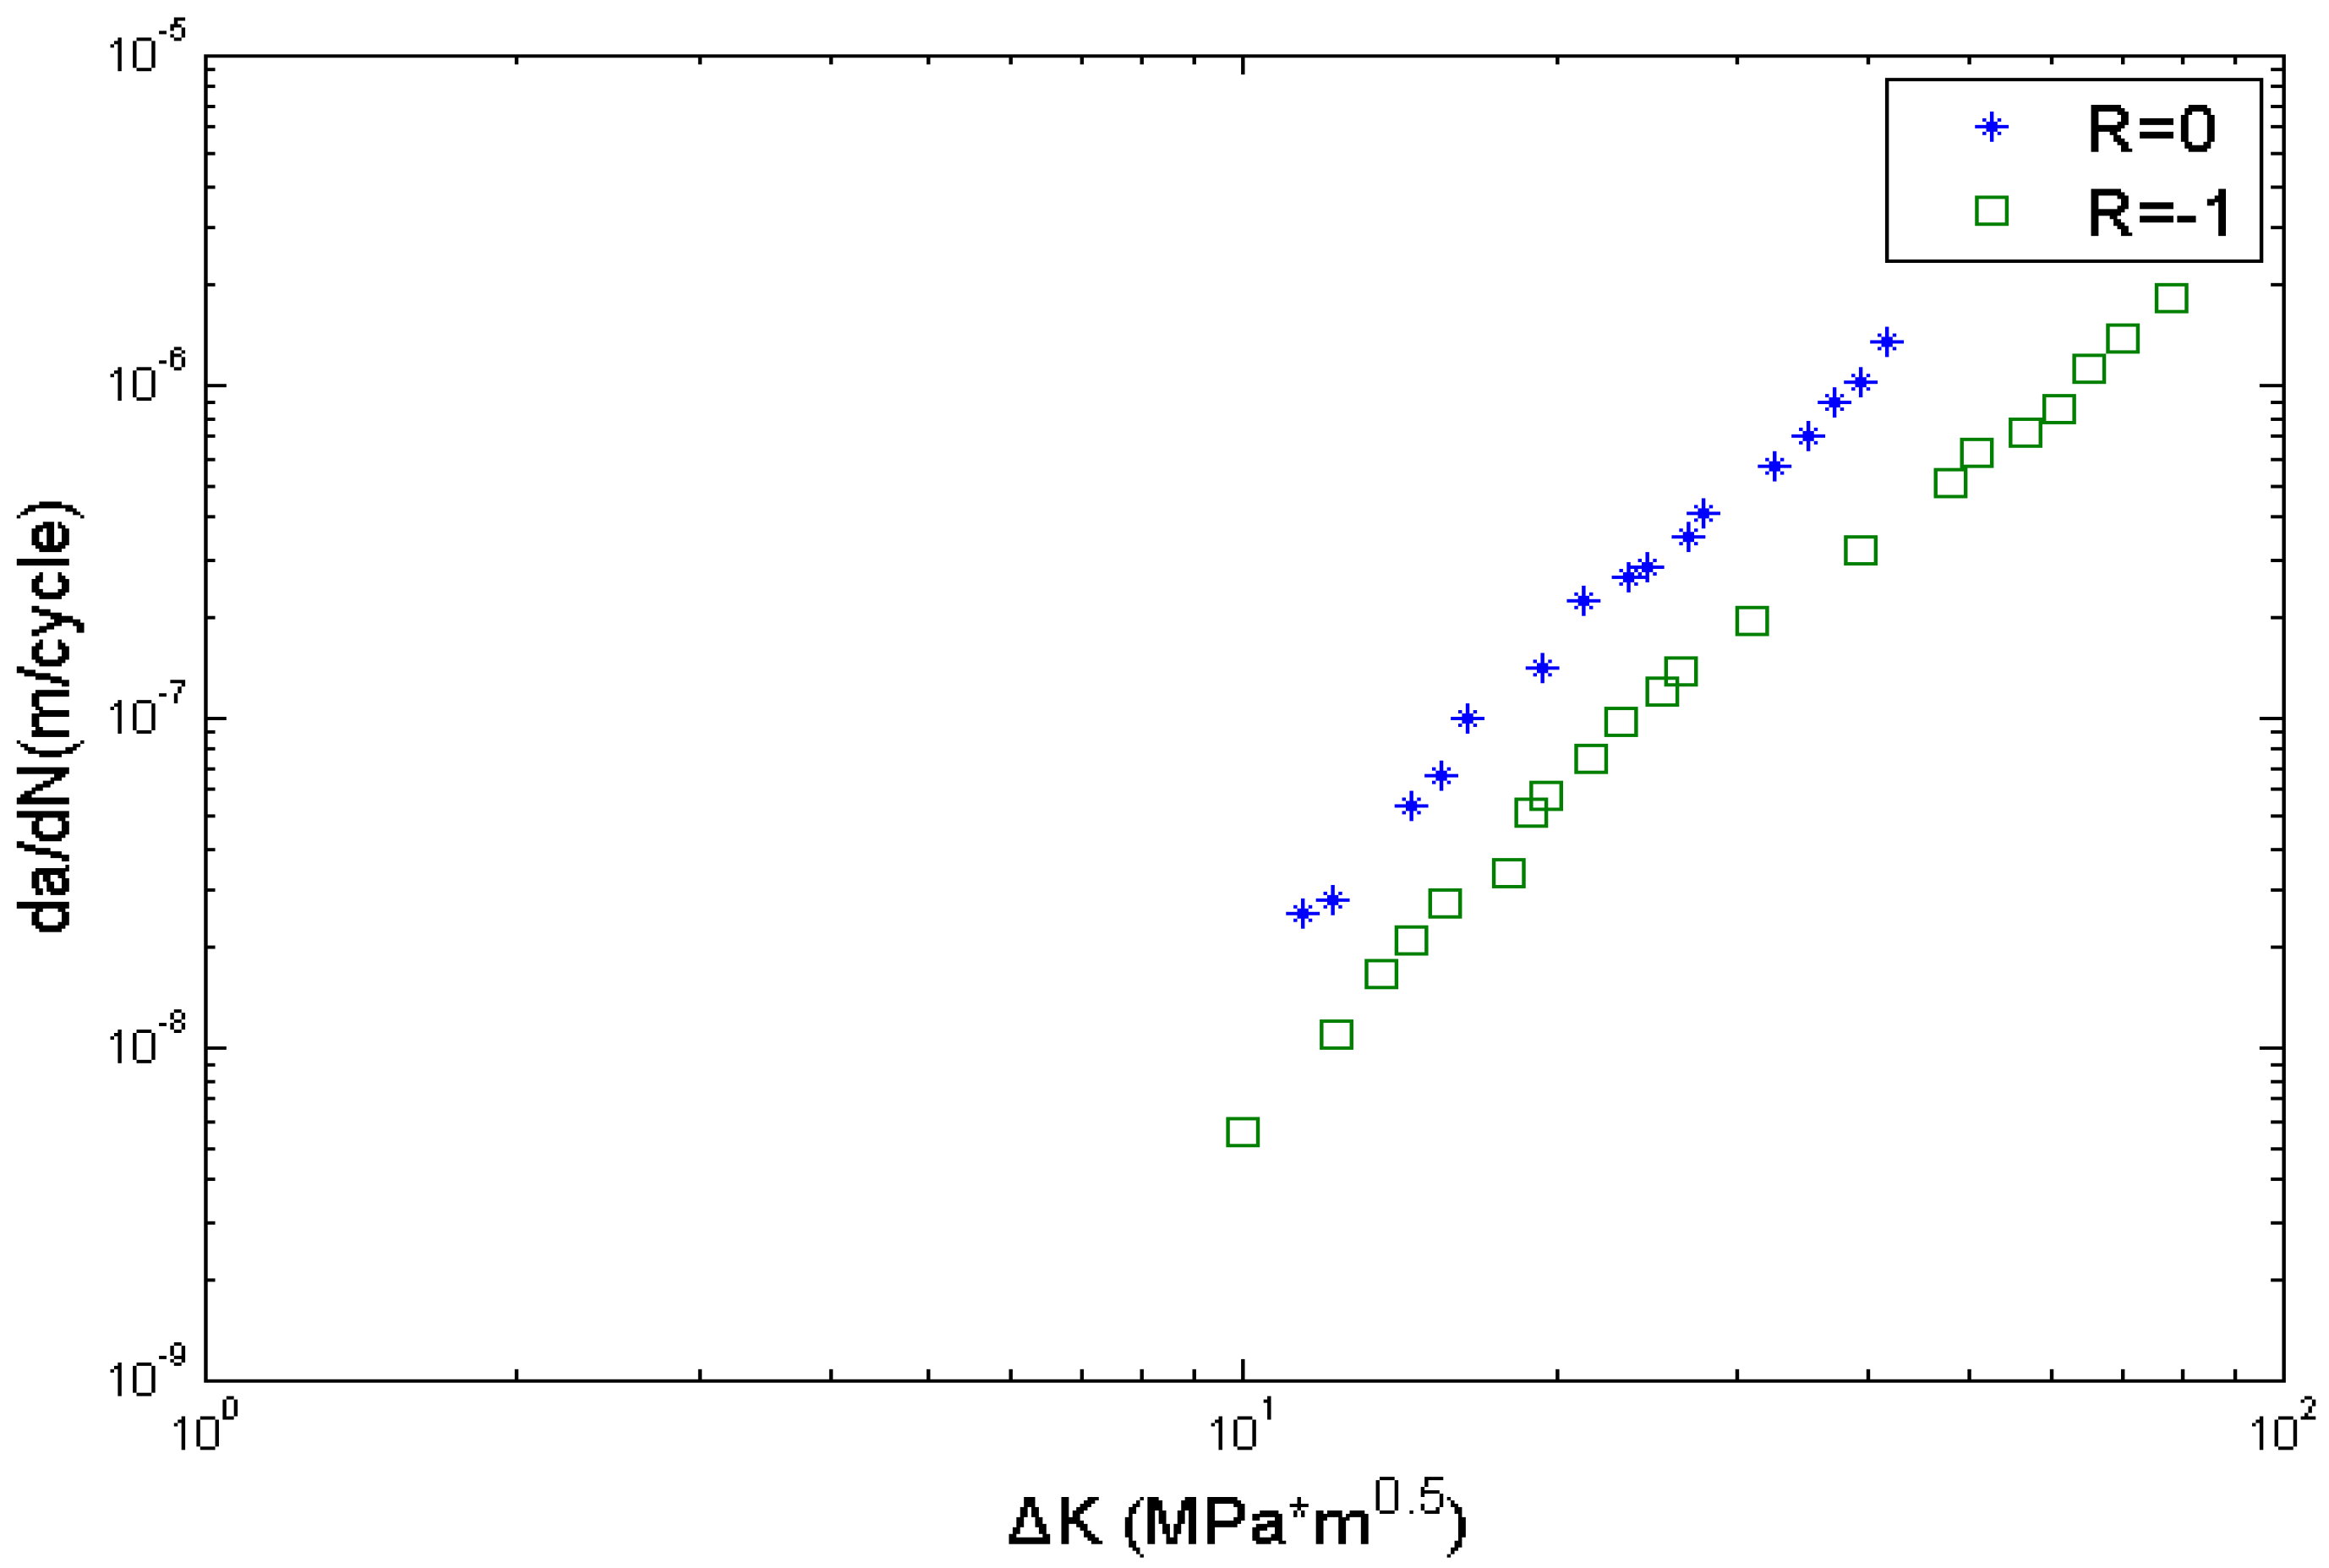
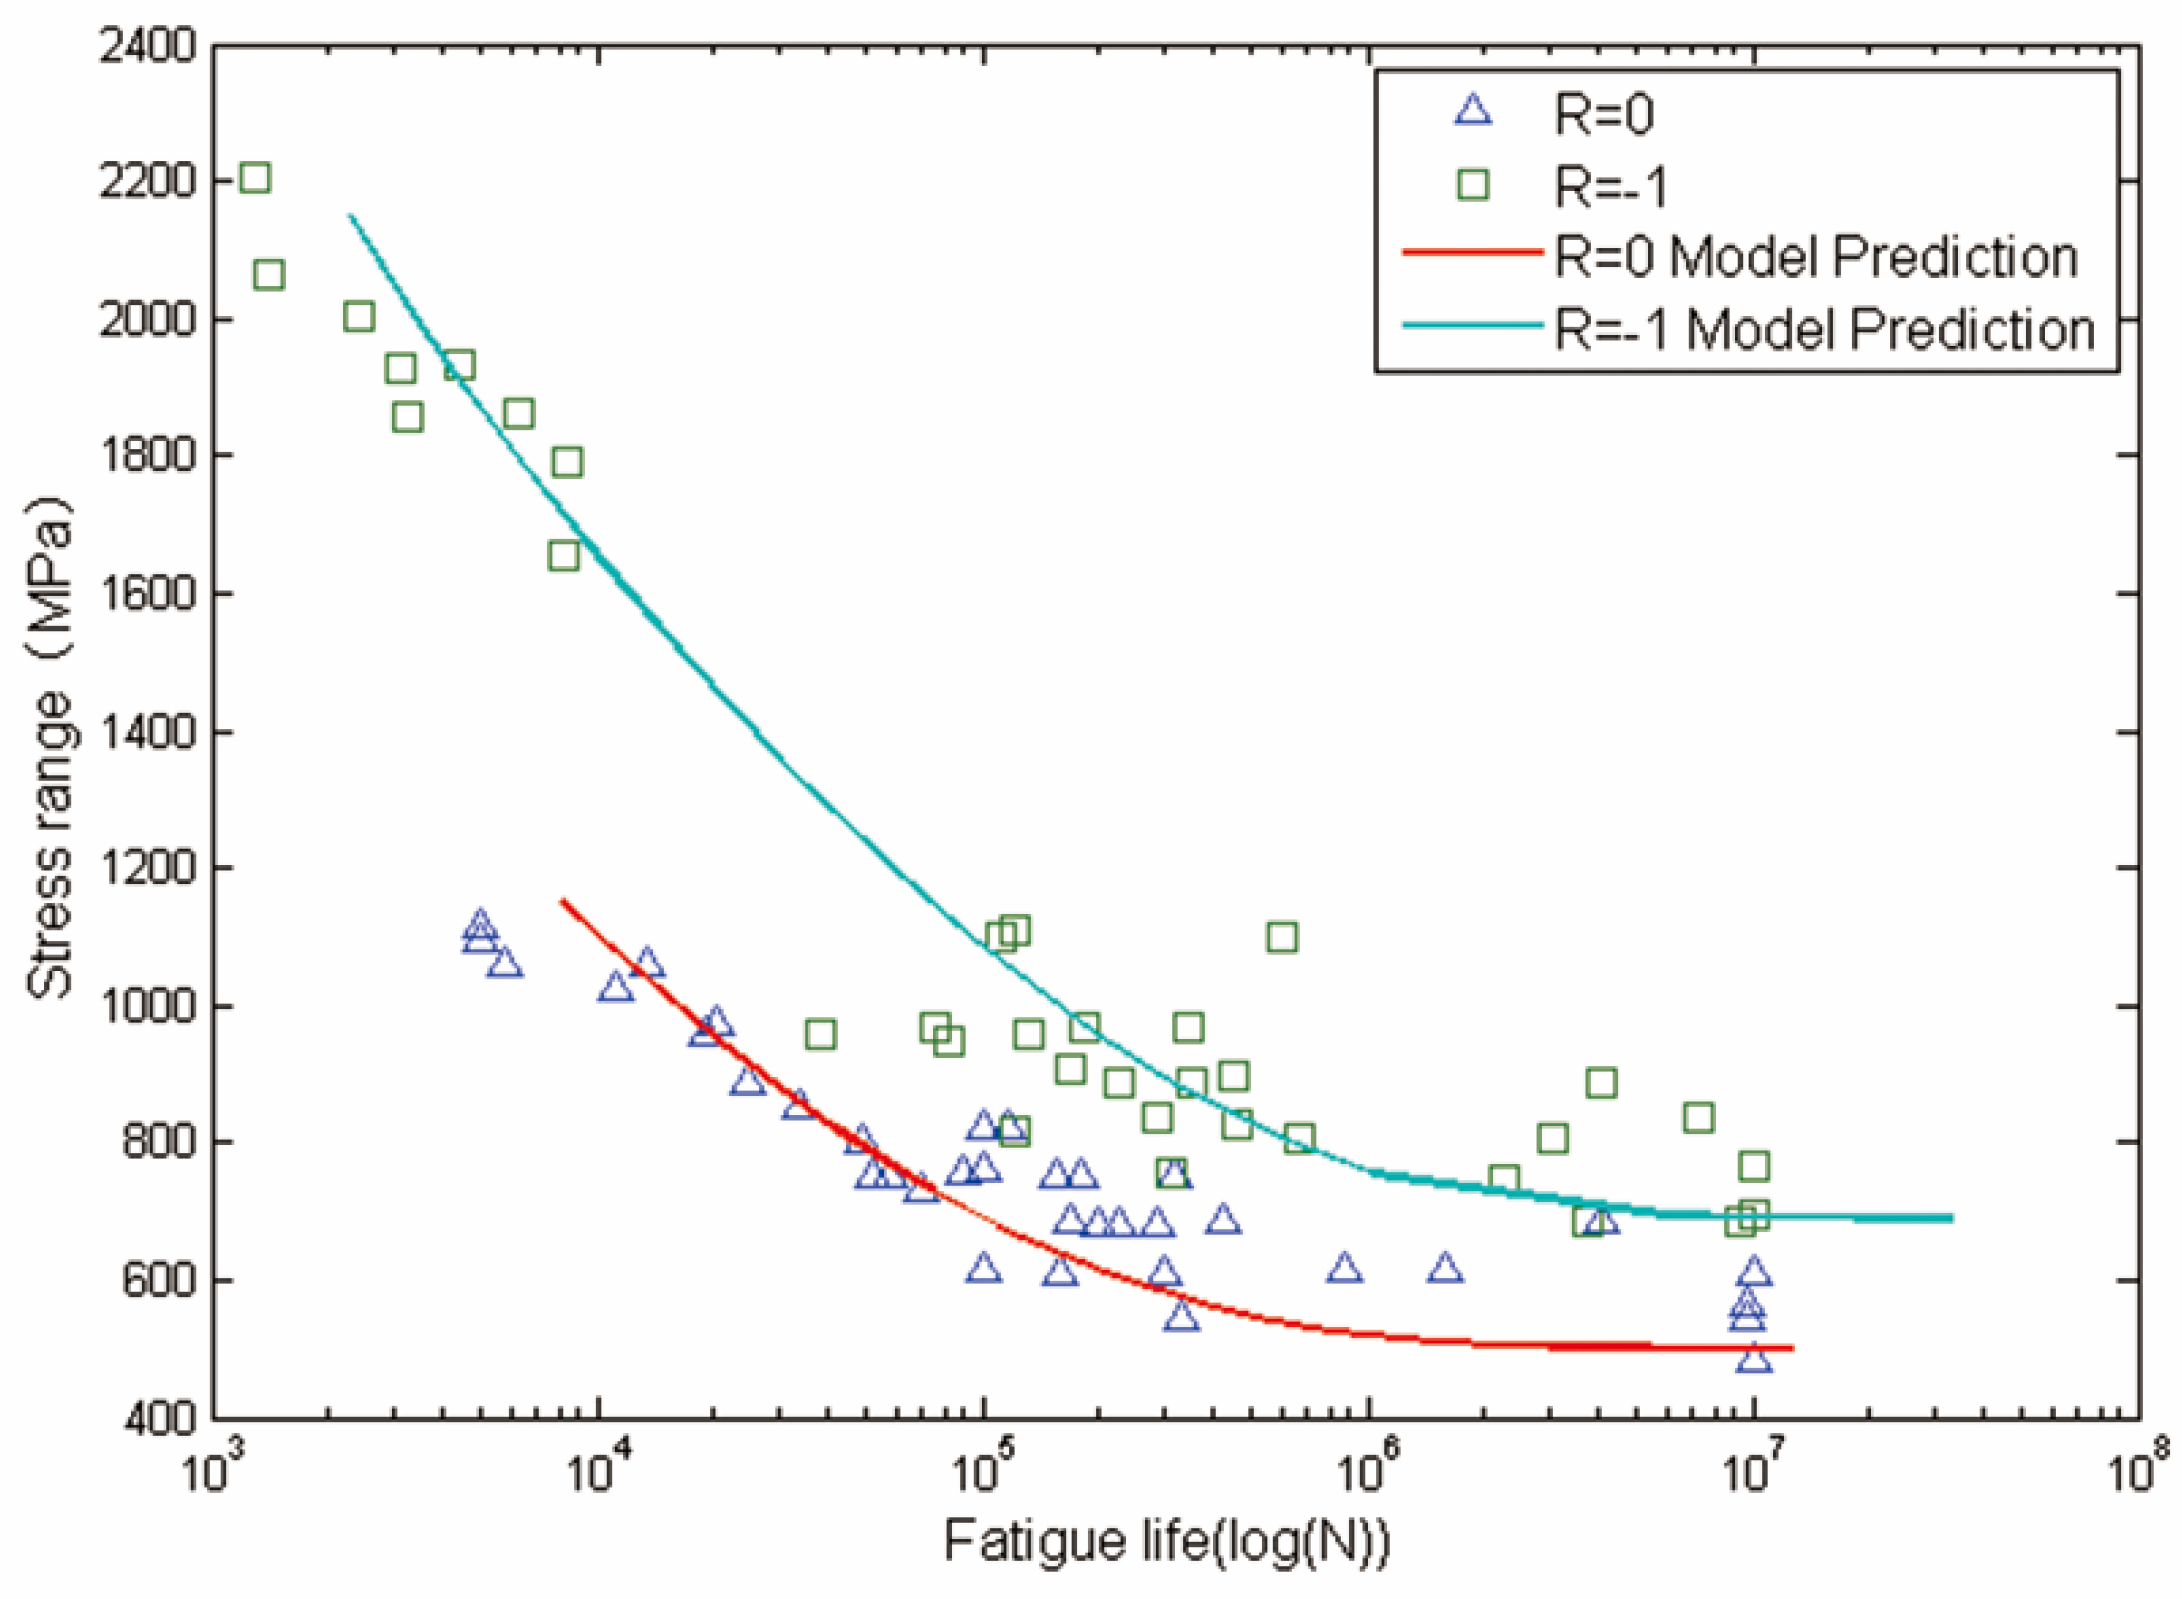
4.3. Life Prediction of Smooth and Circular-Hole Ti-6Al-4V Specimens

The crack growth rate data needed here are obtained from the literature [38], and the S-N curves are drawn from the literature [7]. The specimen dimensions are shown in Table 5, and the mechanical properties of Ti-6Al-4V are as follows: yield strength, σy, is 1100 MPa, ultimate strength, σu, is 1170 MPa, critical stress intensity factor, Kc, is 66 MPa.
Table 5. Specimen geometry of Ti-6Al-4V titanium alloy.
Specimen TypeRWidth (mm)Thickness (mm)Hole Diameter (mm)
Smooth0/−125.41.6/
Notched0/−150.81.61.6
The crack growth rate data obtained from literature [38] are used here to calibrate parameters C and m in Equation (7), as it is shown in Figure 11. The calibrated parameters are C = 5.9860 × 10⁻¹¹, m = 2.998. The other data needed are shown in Table 6. EIFSs and EIFSh represent the equivalent initial flaw size of smooth specimens and circular-hole specimens, respectively, which are calculated by using Equation (6).
Figure 11. Fatigue crack growth of Ti-6Al-4V titanium alloy.
Materials 08 05367 g011
Table 6. Mechanical properties and fatigue properties for Ti-6Al-4V titanium alloy.
MaterialR△Kth (MPa)△σs (MPa)△σh (MPa)EIFSs (μm)EIFSh (μm)
Ti-6Al-4V01.75905002506.924.04
−12.20326903205.363.87
Calculated fatigue lives and experimental data are shown in Figure 12 and Figure 13. The x-axis is the fatigue life, and the y-axis is the stress range. Solid lines represent model predictions of the proposed method and solid marks represent experimental data obtained from literatures. Overall, life prediction results are consistent with experimental data.
Figure 12. Experimental data and calculated fatigue lives for smoothTi-6Al-4V titanium alloy specimens.
Materials 08 05367 g012
Figure 13. Experimental data and calculated fatigue lives for circular-hole Ti-6Al-4V titanium alloy specimens.
Materials 08 05367 g013

5. Discussion and Conclusions

Crack closure plays a significant role in crack growth, especially for aluminum alloy and titanium alloy [9,15,39]. Once the crack closure concept is introduced, the crack growth rate curve is a single curve and is not affected by stress ratio. Newman et al. [6,7,8] predicted the fatigue life of various smooth and notched specimens by using a crack closure model. The value of EIFS is determined by trial-and-error to match experimental data, and is independent of the stress ratio. The effective threshold stress intensity factor (△Keff)th is proposed to consider the crack closure effect. The value of (△Keff)th is also determined by trial-and-error and is also independent of stress ratio. It is reasonable that the concept of (△Keff)th should be introduced and used in Equation (6) instead of △Kth to calculate the value of EIFS. Considering the crack closure phenomenon, just as △Keff is the driving force instead of △K in the crack growth analysis using crack closure concept. However, the concept of crack closure may not be applicable to small crack. It is observed that small crack can grow much faster than long crack at the same △K levels [25,26,27]. One feasible reason is that crack closure does not exist in small crack growth regime or its contribution is the small enough to be neglected. In other words, it is inappropriate to use crack closure modification in small crack region. The concept of (△Keff)th may not be necessary or may not reflect the small crack growth characteristics. Moreover, Boyce and Ritchie [39] studied the effect of load ratio on the fatigue threshold stress intensity factor. Their experiments showed that the value of △Kth continued to decrease with the increase of stress ratio, and even when the stress ratio was large enough, the crack closure was not detected (i.e., (△Keff)th =△Kth). In other words, △Kth is not independent of stress ratio even considering crack closure. In this paper, △Kth is calculated by using a back-extrapolation method, which is dependent on the stress ratio. Consequently, the value of EIFS also depends on the stress ratio.
Fatigue limit is another important parameter of the EIFS calculation. Fatigue limit is defined as the range of cyclic stress under which no fatigue failure occurs. In other words, if the applied stress is in the range of the fatigue limit, the corresponding fatigue life tendency becomes horizontal. In this paper, if fatigue life at a low stress level range shows a horizontal tendency which can be considered as the infinite fatigue life, the corresponding stress range is the fatigue limit. In other words, the fatigue limit is not selected at the specific number of cycles. The fatigue limit that is chosen based on horizontal tendency is more reliable than that based on a specific number of cycles, since the experimental data have large dispersion.
Although EIFS is not the actual initial crack size, it reflects the initial specimen conditions, such as the geometrical configuration, the surface condition, and the material properties. Total fatigue life of the structure, which is sensitive to EIFS in the fatigue crack growth method, is affected by many factors, such as corrosion environment [40,41,42], shot peening [43,44,45], temperature [46] and geometrical size [47], etc. For the same material, fatigue life is also different due to some factors, such as manufacturing process and service condition. So the value of EIFS which represents the initial quality should be different.
It is observed that some discrepancies exist between the model predictions and experimental data in the low cycle fatigue region. One possible reason is that crack initiations are quite different for some materials in low cycle and high cycle fatigue regions. A hypothesis is implied in the current work that the crack initiation mechanism is the same for both low cycle fatigue and high cycle fatigue. However, some studies [48,49,50,51] indicate that fatigue failure of some materials initiates from internal defects in high and ultra-high cycle fatigue region, whereas in low cycle fatigue region the crack initiation often occurs from the surface. Additionally, crack growth is a complicated three-dimensional problem, but in the current study, it is simplified as an idealized regular surface crack, which may also lead to discrepancies in life prediction.
A fatigue life prediction method based on crack closure and equivalent initial flaw size (EIFS) is proposed to predict fatigue life. Fatigue limit σf and threshold stress intensity factor, △Kth, are used to calculate the value of EIFS. Different effects of crack closure on small crack growth region and the long crack growth region are considered in the proposed method. The method is validated by using smooth and circular-hole specimens on aluminum alloy and titanium alloy under different stress ratios, and model predictions match the experimental data well. Some conclusions can be drawn based on the current work:
(1)
The value of △Kth is dependent on the stress ratio even if the crack closure effect is considered. Consequently, the value of EIFS is also dependent on the stress ratio.
(2)
The factors that affect the value of EIFS include the geometrical configuration, the surface condition, and the material properties. For the same material, fatigue life is affected by many factors, and, based on these, the value of EIFS which represents the initial quality should be different.
(3)
The crack initiation mechanism of the same material may be different under different stress levels, and its influence on model predictions should be further studied.

Acknowledgments

The research is financially supported by the National Natural Science Foundation of China (No. 51405009) and the Fundamental Research Funds for the Central Universities.

Author Contributions

Wei Zhang organized the research; Qiang Wang carried on the model simulation and wrote the manuscript; Shan Jiang wrote programs and checked the manuscript.

Conflicts of Interest

The authors declare no conflict of interest.

References

  1. Lim, J.-Y.; Hong, S.-G.; Lee, S.-B. Application of local stress–strain approaches in the prediction of fatigue crack initiation life for cyclically non-stabilized and non-Masing steel. Int. J. Fatigue 2005, 27, 1653–1660. [Google Scholar] [CrossRef]
  2. Krasnowski, B.; Rotenberger, K.; Spence, W. A damage tolerance method for helicopter dynamic components. J. Am. Helicopter Soc. 1991, 36, 52–60. [Google Scholar] [CrossRef]
  3. Merati, A.; Eastaugh, G. Determination of fatigue related discontinuity state of 7000 series of aerospace aluminum alloys. Eng. Fail Anal. 2007, 14, 673–685. [Google Scholar] [CrossRef]
  4. Forth, S.C.; Everett, R.A.; Newman, J.A. (Eds.) A Novel Approach to Rotorcraft Damage Tolerance. In Proceedings of the Sixth Joint FAA/DoD/NASA Conference on Aging Aircraft, San Francisco, CA, USA, 16–19 September 2002.
  5. Liu, Y.; Mahadevan, S. Probabilistic fatigue life prediction using an equivalent initial flaw size distribution. Int. J. Fatigue 2009, 31, 476–487. [Google Scholar] [CrossRef]
  6. Newman, J.; Phillips, E.P.; Swain, M. Fatigue-life prediction methodology using small-crack theory. Int. J. Fatigue 1999, 21, 109–119. [Google Scholar] [CrossRef]
  7. Newman, J.C.; Annigeri, B.S. Fatigue-life prediction method based on small-crack theory in an engine material. J. Eng. Gas Turbines Power 2012, 134. [Google Scholar] [CrossRef]
  8. Newman, J., Jr. Fatigue-life prediction metliodology using a crack-closure IVIodel. J. Eng. Mater. Technol. 1995, 117, 433–439. [Google Scholar] [CrossRef]
  9. Elber, W. The significance of fatigue crack closure. Astm Stp. 1971, 486, 230–243. [Google Scholar]
  10. Newman, J.C., Jr. A crack-closure model for predicting fatigue crack growth under aircraft spectrum loading. ASTM STP 748 1981, 53–84. [Google Scholar]
  11. Newman, J.J. A crack opening stress equation for fatigue crack growth. Int. J. Fract. 1984, 24, R131–R135. [Google Scholar] [CrossRef]
  12. Vasudevan, A.; Sadananda, K.; Louat, N. Reconsideration of fatigue crack closure. Scr. Metall. Mater. 1992, 27, 1673–1678. [Google Scholar] [CrossRef]
  13. Zhang, J.Z.; Zhang, J.Z.; Meng, Z.X. Direct high resolution in situ SEM observations of very small fatigue crack growth in the ultra-fine grain aluminium alloy IN 9052. Scr. Mater. 2004, 50, 825–828. [Google Scholar] [CrossRef]
  14. Riemelmoser, F.; Pippan, R. Crack closure: A concept of fatigue crack growth under examination. Fatigue Fract. Eng. Mater. Struct. 1997, 20, 1529–1540. [Google Scholar] [CrossRef]
  15. Zhang, W.; Liu, Y. In situ SEM testing for crack closure investigation and virtual crack annealing model development. Int. J. Fatigue 2012, 43, 188–196. [Google Scholar] [CrossRef]
  16. Zhang, W.; Liu, Y. Investigation of incremental fatigue crack growth mechanisms using in situ SEM testing. Int. J. Fatigue 2012, 42, 14–23. [Google Scholar] [CrossRef]
  17. Antunes, F.; Chegini, A.; Branco, R.; Camas, D. A numerical study of plasticity induced crack closure under plane strain conditions. Int. J. Fatigue 2015, 71, 75–86. [Google Scholar] [CrossRef]
  18. Zhang, J.; Bowen, P. On the finite element simulation of three-dimensional semi-circular fatigue crack growth and closure. Eng. Fract. Mech. 1998, 60, 341–360. [Google Scholar] [CrossRef]
  19. Budiansky, B.; Hutchinson, J. Analysis of closure in fatigue crack growth. J. Appl. Mech. 1978, 45, 267–276. [Google Scholar] [CrossRef]
  20. Chen, D.-L.; Weiss, B.; Stickler, R. A new evaluation procedure for crack closure. Int. J. Fatigue 1991, 13, 327–331. [Google Scholar] [CrossRef]
  21. Chen, D.; Weiss, B.; Stickler, R. Effect of stress ratio and loading condition on the fatigue threshold. Int. J. Fatigue 1992, 14, 325–329. [Google Scholar] [CrossRef]
  22. Chen, D.; Weiss, B.; Stickler, R. The effective fatigue threshold: significance of the loading cycle below the crack opening load. Int. J. Fatigue 1994, 16, 485–491. [Google Scholar] [CrossRef]
  23. Chen, D.; Weiss, B.; Stickler, R. Contribution of the cyclic loading portion below the opening load to fatigue crack growth. Mater. Sci. Eng. A 1996, 208, 181–187. [Google Scholar] [CrossRef]
  24. Chen, D.; Weiss, B.; Stickler, R. A model for crack closure. Eng. Fract. Mech. 1996, 53, 493–509. [Google Scholar] [CrossRef]
  25. Pearson, S. Initiation of fatigue cracks in commercial aluminium alloys and the subsequent propagation of very short cracks. Eng. Fract. Mech. 1975, 7, 235–247. [Google Scholar] [CrossRef]
  26. Kitagawa, H.; Takahashi, S. (Eds.) Applicability of Fracture Mechanics to Very Small Cracks or the Cracks in the Early Stage. In Proceedings of the Second International Conference on Mechanical Behavior of Materials ASM, Metals Park, OH, USA, 16–20 August 1976; pp. 627–631.
  27. Miller, K.J.; de Los Rios, E. The Behaviour of Short Fatigue Cracks; Mechanical Engineering Publications: Suffolk, UK, 1986. [Google Scholar]
  28. El Haddad, M.; Topper, T.; Smith, K. Prediction of non propagating cracks. Eng. Fract. Mech. 1979, 11, 573–584. [Google Scholar] [CrossRef]
  29. Consortium, N. Fatigue Crack Growth Computer Program NASGRO® Version 3.0. User Manual, JSC-22267B; NASA Technical Report; NASA: Houston, TX, USA, 2001. [Google Scholar]
  30. Forman, R.; Shivakumar, V.; Cardinal, J.; Williams, L.; McKeighan, P. Fatigue Crack Growth Database for Damage Tolerance Analysis; Final Report No. DOT/FAA/AR-05/15; US Department of Transportation Federal Aviation Administration (FAA), Office of Aviation Research: Washington, DC, USA, 2005. [Google Scholar]
  31. Forman, R.; Shivakumar, V.; Newman, J. Fatigue Crack Growth Computer Program NASA/FLAGRO Version 2.0; Johnson Space Center Report JSC-22267A; NASA: Houston, TX, USA, 1993. [Google Scholar]
  32. Newman, J., Jr.; Raju, I. Stress-intensity factor equations for cracks in three-dimensional finite bodies subjected to tension and bending loads. Comput. Methods Mech. Fract. 1986, 2, 311–334. [Google Scholar]
  33. Schijve, J. Fatigue of Structures and Materials; Springer: Dordrecht, The Netherland, 2001. [Google Scholar]
  34. Newman, J.; Raju, I. Stress-intensity factor equations for cracks in three-dimensional finite bodies. ASTM STP 791 1983, 238–265. [Google Scholar]
  35. Huang, X.; Torgeir, M.; Cui, W. An engineering model of fatigue crack growth under variable amplitude loading. Int. J. Fatigue 2008, 30, 2–10. [Google Scholar] [CrossRef]
  36. Rodopoulos, C.; Curtis, S.; de Los Rios, E.; SolisRomero, J. Optimisation of the fatigue resistance of 2024-T351 aluminium alloys by controlled shot peening—methodology, results and analysis. Int. J. Fatigue 2004, 26, 849–856. [Google Scholar] [CrossRef]
  37. Zhao, T.; Jiang, Y. Fatigue of 7075-T651 aluminum alloy. Int. J. Fatigue 2008, 30, 834–849. [Google Scholar] [CrossRef]
  38. Noroozi, A.; Glinka, G.; Lambert, S. A study of the stress ratio effects on fatigue crack growth using the unified two-parameter fatigue crack growth driving force. Int. J. Fatigue 2007, 29, 1616–1633. [Google Scholar] [CrossRef]
  39. Boyce, B.; Ritchie, R. Effect of load ratio and maximum stress intensity on the fatigue threshold in Ti–6Al–4V. Eng. Fract. Mech. 2001, 68, 129–147. [Google Scholar] [CrossRef]
  40. Dolley, E.; Lee, B.; Wei, R. The effect of pitting corrosion on fatigue life. Fatigue Fract. Eng. Mater. Struc. 2000, 23, 555–560. [Google Scholar] [CrossRef]
  41. Sankaran, K.; Perez, R.; Jata, K. Effects of pitting corrosion on the fatigue behavior of aluminum alloy 7075-T6: Modeling and experimental studies. Mater. Sci. Eng. A 2001, 297, 223–229. [Google Scholar] [CrossRef]
  42. Chamos, A.; Pantelakis, S.G.; Spiliadis, V. Fatigue behaviour of bare and pre-corroded magnesium alloy AZ31. Mater. Des. 2010, 31, 4130–4137. [Google Scholar] [CrossRef]
  43. Hatamleh, O.; Lyons, J.; Forman, R. Laser and shot peening effects on fatigue crack growth in friction stir welded 7075-T7351 aluminum alloy joints. Int. J. Fatigue 2007, 29, 421–434. [Google Scholar] [CrossRef]
  44. Farrahi, G.; Lebrijn, J.; Couratin, D. Effect of shot peening on residual stress and fatigue life of a spring steel. Fatigue Fract. Eng. Mater. Struct. 1995, 18, 211–220. [Google Scholar] [CrossRef]
  45. Zhang, X.; Liu, D. Effect of shot peening on fretting fatigue of Ti811 alloy at elevated temperature. Int. J Fatigue 2009, 31, 889–893. [Google Scholar] [CrossRef]
  46. Zhu, X.; Shyam, A.; Jones, J.; Mayer, H.; Lasecki, J.; Allison, J. Effects of microstructure and temperature on fatigue behavior of E319-T7 cast aluminum alloy in very long life cycles. Int. J. Fatigue 2006, 28, 1566–1571. [Google Scholar] [CrossRef]
  47. Shirani, M.; Härkegård, G. Fatigue life distribution and size effect in ductile cast iron for wind turbine components. Eng. Fail. Anal. 2011, 18, 12–24. [Google Scholar] [CrossRef]
  48. Marines, I.; Bin, X.; Bathias, C. An understanding of very high cycle fatigue of metals. Int. J. Fatigue 2003, 25, 1101–1107. [Google Scholar] [CrossRef]
  49. Chandran, K.R.; Chang, P.; Cashman, G. Competing failure modes and complex S–N curves in fatigue of structural materials. Int. J. Fatigue 2010, 32, 482–491. [Google Scholar] [CrossRef]
  50. Przybyla, C.; McDowell, D. Microstructure-sensitive extreme-value probabilities of high-cycle fatigue for surface vs. subsurface crack formation in duplex Ti–6Al–4V. Acta Mater. 2012, 60, 293–305. [Google Scholar] [CrossRef]
  51. Zuo, J.; Wang, Z.; Han, E. Effect of microstructure on ultra-high cycle fatigue behavior of Ti–6Al–4V. Mater. Sci. Eng. A 2008, 473, 147–152. [Google Scholar] [CrossRef]

